- 1Department of Space Physics, School of Electronic Information, Wuhan University, Wuhan, China
- 2National Key Laboratory of Electromagnetic Environment, China Research Institute of Radio Wave Propagation, Qingdao, China
- 3School of Computer Science, Huanggang Normal University, Huanggang, China
- 4Key Laboratory of Detection and Application of Space Effect in Southwest Sichuan at Leshan Normal University, Education Department of Sichuan Province, Leshan, China
- 5School of Automatic and Electronic Information, Xiangtan University, Xiangtan, China
- 6School of Artificial Intelligence, Hubei University, Wuhan, China
- 7Key Laboratory of Intelligent Sensing System and Security (Hubei University), Ministry of Education, Wuhan, China
There is a long history of using VHF radar systems to detect ionospheric irregularities based on the theory of coherent scattering. According to previous work, there is a high occurrence of field-aligned irregularities (FAIs) in the ionospheric E-region over Kunming, China. In this paper, the VHF coherent scattering radar at Kunming is used to study the FAIs in the ionospheric E-region. Different arrangement of VHF radar antenna arrays, interferometry, and FAI echo parameter inversion methods are designed and tested. The measurement results show that the temporal and spatial characteristics of the irregularities can be obtained using these methods, as well as more refined spatial three-dimensional structure information. It is indicated that the new arrangement of the VHF radar antenna array is feasible to operate interferometry detection of E-region FAIs with the Kunming VHF radar.
1 Introduction
The term ionospheric irregularities refer to ionized “clumps” or “wavy” structures of various lengths floating in the normal ionospheric structure. The electron density of these structures is significantly different from that of the background ionosphere, where the electron density is higher or lower than the average electron density of the surrounding medium (Kelly, 2012). Ionospheric irregularities fluctuate over time and space. Their formation and evolution are complex, involving numerous factors and electrodynamic processes (Berkner and Wells, 1934; Woodman and La Hoz, 1976; Yamamoto et al., 1991; Yamamoto et al., 1992; Larsen et al., 2000). The FAIs represent a very important physical phenomenon in the ionosphere.
Various ionospheric instabilities are characterized as being the FAIs; such features can be used as the tracer of background wind fields and waves, too. (Yamamoto et al., 1994). In addition, FAIs represent a variety of complex plasma processes in the ionosphere (Cosgrove and Tsunoda, 2001; Cosgrove and Tsunoda, 2002b; Cosgrove and Tsunoda, 2002a; Cosgrove and Tsunoda, 2003; Cosgrove and Tsunoda, 2004; Bernhardt, 2002; Saito et al., 2008). Therefore, the study of FAIs is important for the understanding of the variations and physical processes in the ionosphere. Ionospheric irregularities can change the propagation path and delay of radio waves, causing random and rapid fluctuations in the amplitude and phase of radio signals (Sun et al., 2017); this causes serious alterations to the signals, resulting in a considerable performance degradation in the low-altitude radio systems (Buchau et al., 1979; Aggson et al., 1996; Otsuka et al., 2002). These fluctuations have a significant impact on radar systems, communication systems, and navigation systems (Kelly, 2012). It is therefore necessary to study the characteristics of FAIs using a variety of methods. FAIs study also has importance in the development and improvement of ionospheric radio wave propagation models.
The three-dimensional spatial structure of FAIs is essential for analyzing their characteristics (Yamamoto et al., 1991; Palmer et al., 1999; Luce et al., 2006). While conventional detection methods can provide information on the distribution of FAIs in the geomagnetic meridian plane, they fall short in revealing the finer spatial structure of FAIs, such as the east-west distribution, layered FAIs, and striped FAIs, which cannot be discerned from conventional Height-Intensity-Time (HIT) diagram (Yamamoto et al., 1994; Chilson et al., 2003; Yu and Brown, 2004).
In many cases, interferometry can provide more information than conventional detection techniques (Farley, 1966; Evans, 1969; Yeh et al., 1973; Yu and Brown, 2004). In order to better study FAIs, Farley et al. firstly applied spatial interferometry to the Jicamarca Radar system to study the phenomenon of equatorial electrojet (Farley et al., 1981) and obtained the three-dimensional structure of FAIs in the equatorial region. Since then, this technology has been widely used in the study of the spatial structure of FAIs in the auroral region, mid-latitude, and low latitude E- and F-regions, such as Sao Luis Radar, Clemson Radar, MU Radar, St. Croix Radar (Hysell et al., 2009), Chung-Li Radar (Wang et al., 2011) and ICEBEAR Radar (Huyghebaert et al., 2019). Yamamoto et al. first obtained the three-dimensional structure of the FAIs in the nighttime E-region in the middle latitude using spatial interferometry technology with the MU Radar (Yamamoto et al., 1994). Hysell et al. extended the interferometry work to the E region, using coherent scatter radar that collect the coherent movement of the FAIs. He has deployed VHF radars at mid-latitudes to research quasi periodic (QP) echoes events (Hysell et al., 2009) and at high-latitudes to research artificial E-region FAIs (Nossa et al., 2009). In addition, Li et al. also carried out detection experiments on the three-dimensional spatial structure of the E-region irregularities in the low latitude ionosphere via the use of spatial interferometry by the Sanya VHF radar (Li et al., 2013; Li et al., 2014).
Spatial Interferometry is to determine the position of the scatterers in detecting area using the cross-correlation phases between the received scattered signals by FAIs, and then to image the two- or three-dimensional (2D/3D) structure of FAIs (Chen and Zecha, 2009; Chen et al., 2016). Hysell and Chau (2006) extended the applications of radar interferometry technology, permitting multiple scattering regions to be observed within the detection range of the radar beam (Hysell and Chau, 2006). This technique, called radar imaging (Luce et al., 2001), has been used to study FAIs in equatorial region and high latitude (Kudeki et al., 1982; Yokoyama et al., 2003; Yokoyama et al., 2009; Zhang et al., 2005; Chu et al., 2013; Hysell et al., 2019).
In recent decades, with the development of various ionospheric detection techniques, and in particular with the establishment of the incoherent scattering radar, numerous research achievements have been made related to FAIs (Kudeki and Stitt, 1987; Franke, 1990; Woodman et al., 1991; Kagan and Kelley, 1998). However, compared with the extensive research of E-region irregularities in the equatorial and auroral regions, study on the detection of the three-dimensional fine structure of E-region irregularities in the low and middle latitudes in China is still lacking. It remains some key scientific questions to be solved related to E-region irregularities in the low and middle latitudes, including the key physical mechanism of the E-region irregularities generation in the low and middle latitudes, the relationship between the E-region irregularities and the background ionosphere and the atmospheric waves, and the spatial distribution of the E-region irregularities in the low and middle latitudes. These scientific topics require further research. The understanding of the three-dimensional fine structure of the E-region irregularities in the low and middle latitudes still requires further research. Therefore, it is necessary to carry out the three-dimensional spatial structure detection of E-region irregularities based on Kunming VHF radar.
This paper focus on the interferometry techniques and inversion algorithm of the E-region irregularities with Kunming VHF radar, which can support study on the three-dimensional fine structure of FAIs in the low and middle latitudes. The outline of this paper is as follows. Section 2 briefly introduces Kunming VHF radar. In Section 3, it is proposed the experimental scheme of the antenna array for interferometry of the E-region irregularities by utilized the Kunming VHF coherent radar. The inversion algorithm and system phase calibration of interferometry of the E-region irregularities are demonstrated in Section 4. Section 5 shows the observing results of the E-region irregularities with the proposed inversion algorithm after the phase calibration. The principal conclusions are summarized in Section 6.
2 Observation equipment
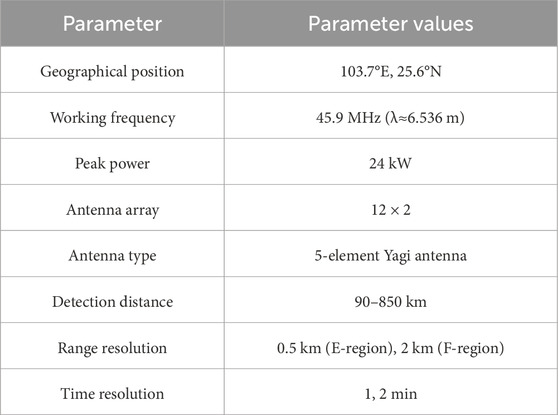
The operating frequency of the VHF coherent scattering radar at the Kunming station (located at 103.7°E, 25.6°N) is 45.9 MHz. Figure 1 presents the geometry of the Kunming VHF Radar antenna array. The Kunming VHF radar uses a rectangular antenna array, which has 60 m from east to west and 10 m from south to north. The transmitting antenna and the receiving antenna share the same antenna array. The antenna array adopts an east-west two row structure, with each row consisting of 12 five element Yagi antennas.
The regular working mode of the Kunming VHF Radar was such that the E- and F-regions were detected alternately, with a detection distance of 90–850 km, a time resolution of 2 min, and a distance resolution of 500 m. Table 1 describes the basic parameters of the Kunming VHF Radar. The Kunming VHF coherent scattering radar can detect the power, signal-to-noise ratio, Doppler velocity, and Doppler spectral width of irregularities structures in the ionosphere. It is, therefore, feasible to use the Kunming VHF coherent scattering radar to detect FAIs in the E-region.
3 Interferometry proposes of E-region irregularities with Kunming VHF radar
The Kunming VHF coherent scattering radar, working on the regular detecting mode, can observe the of occurring spatial and temporal positions and Doppler radial velocities of FAIs in E-region. Whereas, the three-dimensional fine structures of FAIs cannot be obtained in the regular detecting mode of the Kunming VHF radar. Here, one detection scheme of the Kunming VHF radar is proposed for the interferometry technique, in order to observing the three-dimensional fine structures of FAIs by the Kunming VHF radar. Plasma waves propagating along the Earth’s magnetic field lines cause FAIs distributions aligned with the magnetic field direction. The scattering cross-section of these FAIs depending on the angle between the radar beam and the magnetic field lines. Specifically, the scattering cross-section of the FAIs is maximized when the radar beam is perpendicular to the magnetic field lines. Consequently, for optimal radar detection, the incident radar wave must be aligned perpendicular to the geomagnetic field lines in the E regions. The experimental scheme of antenna array, shown in Figure 2B, is based on moving a group of integrated transceiver channels for interferometry. Compare with the original geometry of the antenna array shown in Figure 2A, a group of antennas defined as Channel 6 moves to the front of Channel 3. As seen in Figure 2B, the distance between Channel 2 and Channel 3 is 1.4λ, and the distance between Channel 3 and Channel 6 is 1.6λ, where λ is the wavelength of the Kunming VHF radar detecting signal. Figure 2C shows that after moving one group, the antenna array beam center is directed towards geomagnetic north, forming an angle (approximately 1.6°) with true north. The radar beam azimuth range is −15° to 15°, with geographical azimuth values from −16.6° to 13.4° and a zenith angle of 40°. The half power beam width of the antenna beam for the entire array is 29.87° in the elevation plane and 11.5° in the azimuth plane. According to the IGRF-WMM-2020 model, at a detection altitude of 100 km, the magnetic declination is −1.78° and the magnetic inclination is 39.7°, with the data dated November 11, 2019. Previously mentioned, the zenith angle of the Kunming VHF radar antenna beam is 40°, pointing to geomagnetic north (magnetic aspect angle of ±0.5° (Lu et al., 2008)), the radar beam direction is almost perpendicular to the geomagnetic field (Liu et al., 2021). Although the apex of the main antenna beam is not normal to the geomagnetic field line, the Kunming VHF radar can still detect the coherent backscatter echoes generated by E-layer ionosphere FAIs (90–130 km) due to its broad antenna beam (Chu et al., 1999).
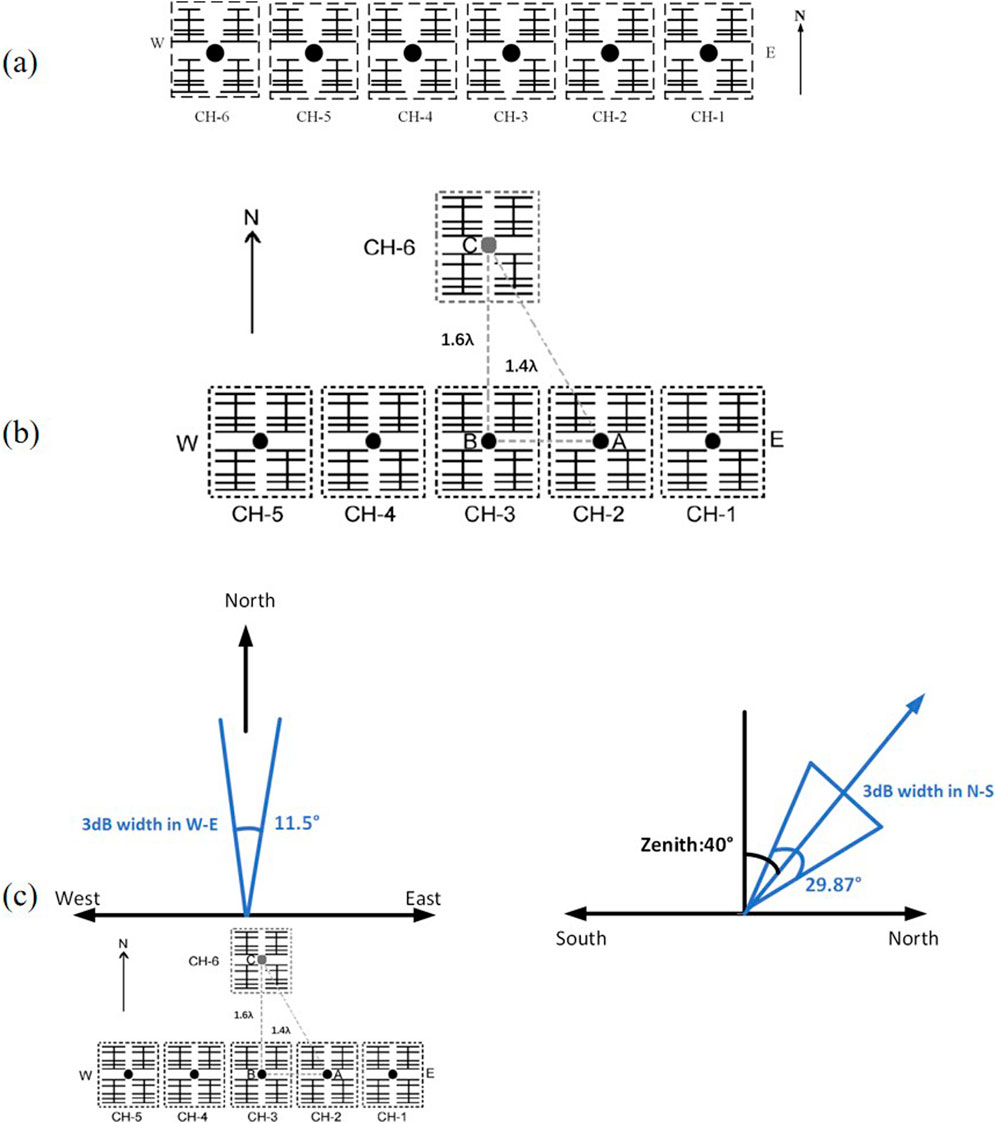
Figure 2. (A) The geometry of the signal channels of the original antenna array in the Kunming VHF Radar antenna array. (B) The geometry of the signal channels of the experimental scheme of antenna array for interferometry in the Kunming VHF Radar antenna array. (C) A schematic diagram of the radar antenna array after repositioning a group of antennas is presented. All modules are employed for both transmission and reception, with the beam axis set at a zenith angle of 40°. The antenna beam of the entire array exhibits a fanlike shape, with a half-power beam width (HPBW) of 11.5° in the azimuth (East-West) direction and 29.87° in the elevation (North-South) direction. This configuration satisfies the field-perpendicular condition for coherent scatter in the ionospheric E region (90–130 km altitude) and is capable of detecting coherent backscatter echoes arising from FAIs.
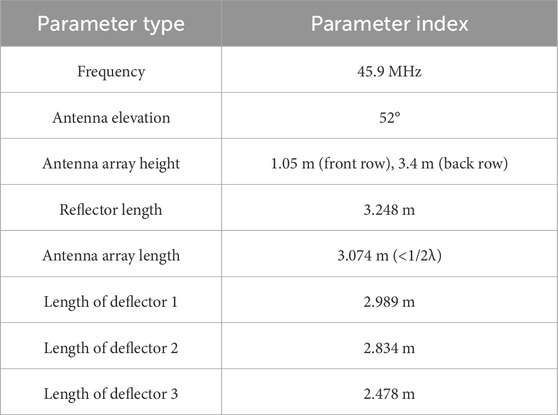
Here the feasibility of the test scheme is analyzed using an antenna array simulation. The directional gain patterns of the original and the proposed experimental antenna array are simulated and illustrated in Figures 3, 4. The simulation parameters of the antenna are shown in Table 2. The resolution of the antenna gain patterns are set to 5° in azimuth angle and 1° in the zenith angle. The feed impedance is set at 50 Ω, where θ is the zenith angle of the radar beam and ϕ is the azimuth angle (east-west) of the radar beam.

Figure 3. (A) Directional gain diagram for the Kunming VHF antenna array. (B) Antenna gain diagram for the

Figure 4. (A) The directional gain diagram after moving a group of antennas in accordance with test scheme 2 outlined above. (B) The antenna gain diagram for the
Figures 3A–C respectively present the directional gain patterns of the Kunming VHF antenna array, as well as the antenna gain patterns in the planes of azimuth angle ϕ = 0° and zenith angle θ = 38°. It can be seen from Figure 3B that in the azimuth angle ϕ = 0° plane, the maximum gain is 21.31 dB in the direction of 36° from zenith (elevation angle is 54°), and the HPBW is 44.21°. In addition, it can be seen from Figure 3C that in the zenith angle θ = 38° plane, the maximum gain is 21.28 dB in the direction of 0° from azimuth, and the HPBW is 9.22°.
Figure 4A presents the directional gain pattern obtained after relocating Channel 6. The antenna directional gain diagrams for the azimuth angle ϕ = 0° and the zenith angle θ = 38° planes are shown in Figures 4B, C, respectively. These patterns were derived from simulations conducted after repositioning Channel 6 to the front of Channel 3. It can be seen from Figure 4B that the maximum gain is 20.91 dB in the azimuth angle ϕ = 0° plane, which is obtained for a direction of 42° from zenith (elevation angle is 48°), and the HPBW is 29.87°. In addition, Figure 4C shows that the maximum gain is 21.73 dB in the zenith angle θ = 38° plane, which is obtained for the direction of 0° from azimuth, and the HPBW is 11.51°. The figures also present that the lobe has a tendency of splitting. Also, the elevation of maximum gain decreases from 54° to 48°, and the HPBW decreases from 44.21° to 29.87°. The maximum gain decreases by 0.4 dB as seen in Figures 3, 4.
The feasibility of experiment scheme is evaluated based on the simulation results. Tables 3 and 4 respectively demonstrate a comparison of the antenna directivity parameters of the VHF radar antenna array in the azimuth angle ϕ = 0° and zenith angle θ = 38° planes for the original and experimental antenna array. It can be seen from Tables 3 and 4 that the experimental scheme yields results that are slightly smaller than those obtained by the original antenna array in the case of the directivity parameters. But the antenna parameters decline does not affect the detection of the E-region irregularities. The results related to the directivity parameters in the case of the experiment scheme are closer to the simulation results of the original radar antenna array. Therefore, the experiment scheme can be used for interferometry of the E-region irregularities.
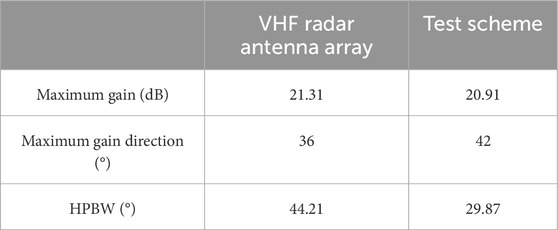
Table 3. Comparison of the antenna directivity parameters for the
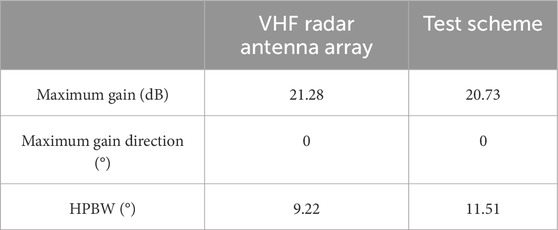
Table 4. Comparison of antenna directivity parameters for the θ = 38° (Zenith angle of antenna beam) plane VHF radar antenna array, results are shown for test scheme.
4 Inversion algorithm of interferometry for Kunming VHF radar
Due to the modification of the original antenna array arrangement in the Kunming area, it is necessary to redesign the inversion algorithm for irregular body echo parameters. Accordingly, Section 4.1 provides a detailed procedure for the inversion algorithm for FAIs echo parameters and presents the results of the parameter inversion. Section 4.2 outlines the computational process of the parameter inversion algorithm for the three-dimensional structure of FAIs in the Kunming area and describes the three-dimensional spatial structure of FAIs in this region. Section 4.3 addresses the calibration of the existing system phase deviations.
4.1 FAI echo parameter inversion in Kunming
When the experimental scheme is used for interferometry at the Kunming VHF radar, the original antenna array arrangement is modified. Thus, the original data inversion algorithm is made less accurate by the change to the system, and a new inversion algorithm of interferometry must be designed. As seen in the flowchart of Figure 5, the new inversion procedures for the signal-to-noise ratio, power, Doppler radial velocity, and spectral width are as follows:
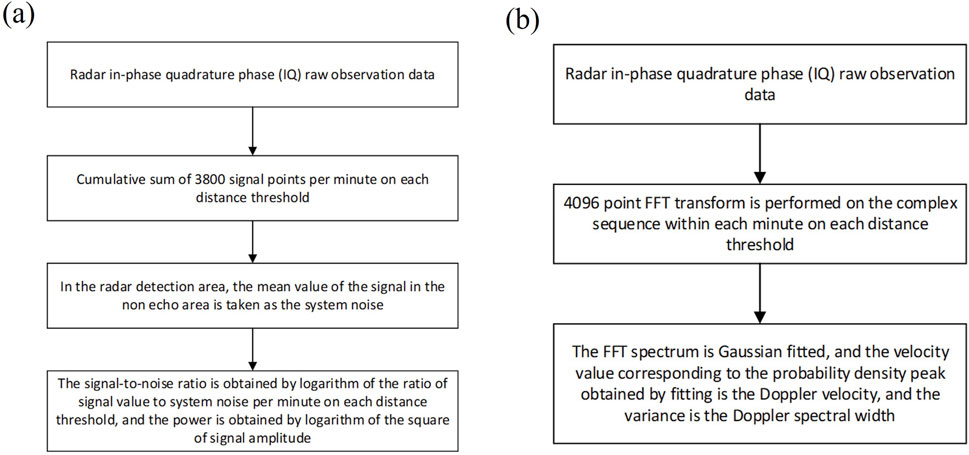
Figure 5. (A) The inversion process for the SNR and power parameter inversion. (B) The inversion process for the Doppler velocity and spectral width parameters.
Step 1. Obtain the in-phase and quadrature-phase (I/Q) observation raw data of the radar, and accumulate all 3,800 signal points per minute on each range gate.
Step 2. The mean value of the signal in the non-echo area is taken to be the system noise in the radar detection area.
Step 3. The ratio of the signal value to the system noise for each minute at each range gate is calculated by logarithm to obtain the signal-to-noise ratio (SNR), and the power is obtained by taking the logarithm of the square of the signal amplitude.
Step 4. The window size and resolution of the Doppler velocity are determined according to the radar operating frequency, pulse repetition frequency, and coherent integration number.
Step 5. Obtain the in-phase and quadrature-phase (I/Q) observation raw data of the radar, and then perform a 4096-points fast Fourier transform (FFT) on the I/Q data within each range gate for every minute.
Step 6. The FFT spectrum is then fitted with a Gaussian function. The Doppler velocity and the Doppler spectral width are given by the peak frequency density and the variance of the Gaussian fitting function, respectively.
To verify the feasibility of the irregularities echo parameter inversion algorithm, we invert the FAIs parameters, followed the inversion algorithm shown in Figure 5, from the data obtained 12:00–17:00 UT on June 11, 2019 by the Kunming VHF radar. The inversion results are shown in Figures 6A–D which presents the SNR, the power, the Doppler velocity, and the Doppler spectral width, respectively. It can be seen from Figure 6 that the primary form of the E-region irregularities is clear and consist with the physical characteristics of the E-region irregularities. In Kunming, FAIs predominantly occur at 12:00–15:00 UT, with an altitude range of 95–115 km. Therefore, it is feasible to use the methodology outlined above to investigate the E-region irregularities in Kunming area. Comparing the echo structures at different times, the FAI tends to drift westward. It has been reported that low and mid latitude E-region FAI echoes in the northern hemisphere predominantly align along a northwest-southeast axis and typically migrate westward or southward (Saito et al., 2006; Yamamoto et al., 1994). E-region radar echoes shown in Kunming look somehow different from other QP echoes reported in the literature. The modulation amplitude of E-region radar echoes in Kunming is approximately 5–10 km, whereas at mid latitude regions the amplitude modulation up to about 20 km (Yamamoto et al., 1991; Zhou et al., 2018). In addition, the modulation period of the echoes observed in Kunming is longer compared to the typical echoes at mid latitudes (Zhou et al., 2018).
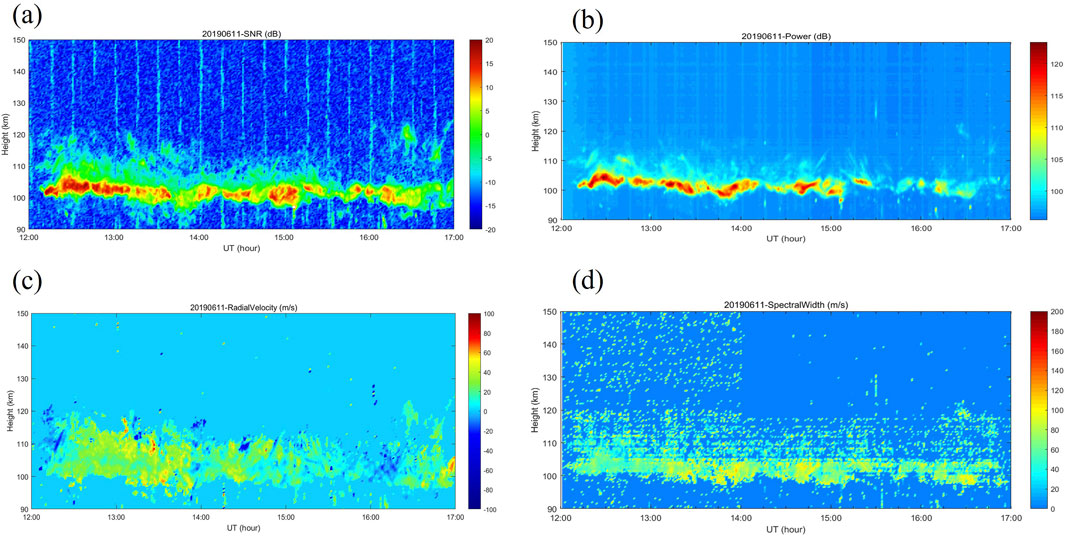
Figure 6. (A) Results of SNR of the E region irregularity echoes. LT = UT+8 h. (B) Results of power of the E region irregularity echoes. LT = UT+8 h. (C) Results of Doppler velocity of the E region irregularity echoes. LT = UT+8 h. (D) Results of Doppler width of the E region irregularity echoes. LT = UT+8 h.
4.2 3D structure parameter inversion of FAIs by the Kunming VHF radar
Interferometry can be employed to study the three-dimensional fine structures of FAIs. When the experiment scheme (discussed in Section 3) is adopted for interferometry with the Kunming VHF radar, the moving antenna array forms a triangle with any two channels of the antenna array, as shown in Figure 2B. The operating frequency of the Kunming VHF radar is 45.9 MHz. The main direction of the beam is fixed toward the north. Here, we take antenna array B (as defined in Figure 2B) as the coordinate origin, the Z-axis to be in the zenith direction, the X-axis to be in the east direction, and the Y-axis to be in the geographic north. Based on these definitions, a spherical coordinate system can be defined. ϕ is taken to be the azimuth, which represents the angle between the FAIs and the main radar beam direction in the horizontal plane. θ is the elevation angle. R then represents the distance between the target and the coordinate origin, i.e., the range gate.
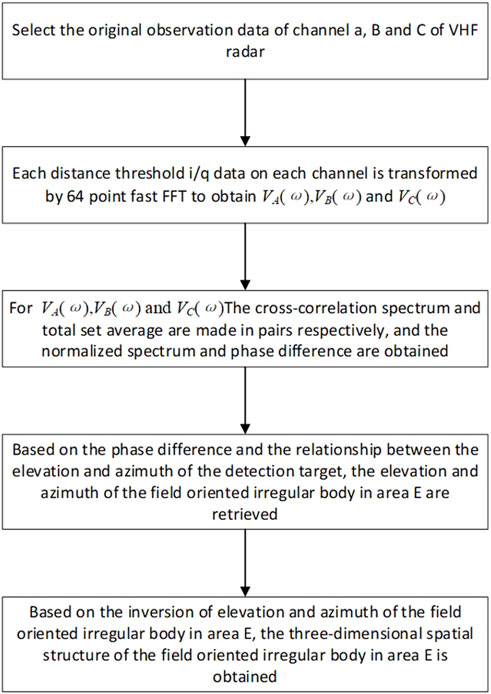
As illustrated in Figure 2B, the distance between channels A and B channels is 1.4λ, and between channels B and C channels is 1.6λ, where λ is the wavelength of the radar detecting signal. Here, we select the raw data of the three channels A, B, and C of the VHF radar. Take the two channels A and B as examples. Firstly, we perform a 64-point FFT on the raw IQ data of each channel to obtain
According to the Equation (1), We can obtain the normalized spectrum,
The distance between the antenna array and the target is RA and RB, respectively. The phase difference between the different antenna arrays is defined as
It can be seen from Equation (1) that the echo signal has a phase difference due to the propagation path difference. If the distance between the centers of the two antenna arrays A and B is d and the unit vector of the target point is
Then, the phase difference between the arrays A and B, B and C can then be obtained as follows, among them, ϕ is the azimuth angle (East-West), which represents the angle between the FAIs and the main radar beam direction in the horizontal plane, and θ is the elevation angle (North-South) of the antenna beam.
By combining Equations (3) and (4), we can obtain,
where
For a fixed beam direction, that is, the beam is directed toward the geographic north, the three-dimensional structure of the target point is given by Equations (7)–(9).
In the data processing, there are three limiting conditions: (1)
4.3 System phase calibration
Due to the system phase deviation, the phase difference distributions
Utilizing the IGRF13 model, we determined that the anticipated echoing region, where the Kunming VHF radar beam axis is perpendicular to the geomagnetic field lines at altitudes of 90–130 km, should appear within the fan-shaped region of ±15° in azimuth angle (ϕ) and 51°–52° in elevation angle (θ). According to Equations (3) and (4), the predicted value of east-west phase difference (
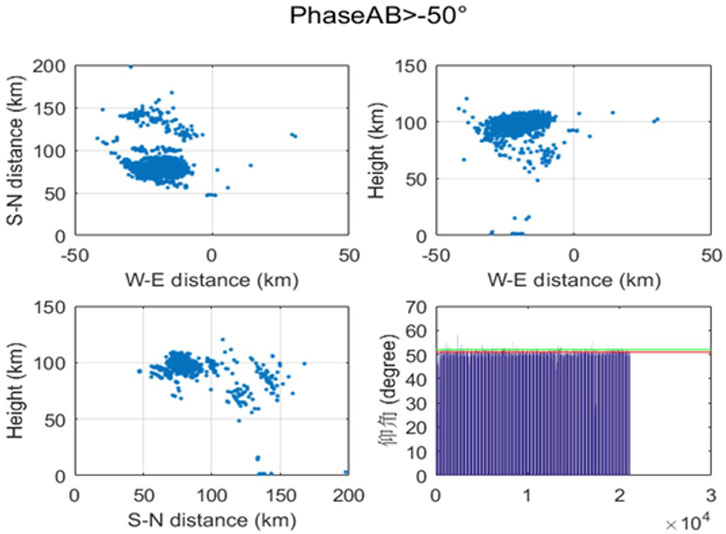
Interference processing was carried out on the data obtained at 14:00 UT on November 11, 2019 by the Kunming VHF radar. Figures 8, 9 presents the phase difference distribution of the received signal and the corresponding three-dimensional structure of the FAIs before the system phase calibration, respectively. As can be seen from Figure 8, the phase distribution of radar echo is primarily divided into two parts: one is the echo with an east-west phase difference
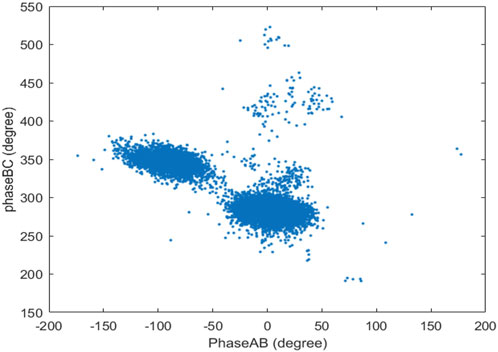
Figure 8. Distribution of the phase difference of the received signal from 14:00 UT on November 11, 2019 before phase calibration.

Figure 9. Three-dimensional spatial structure of the FAI from 14:00 UT November 11, 2019 before phase calibration.
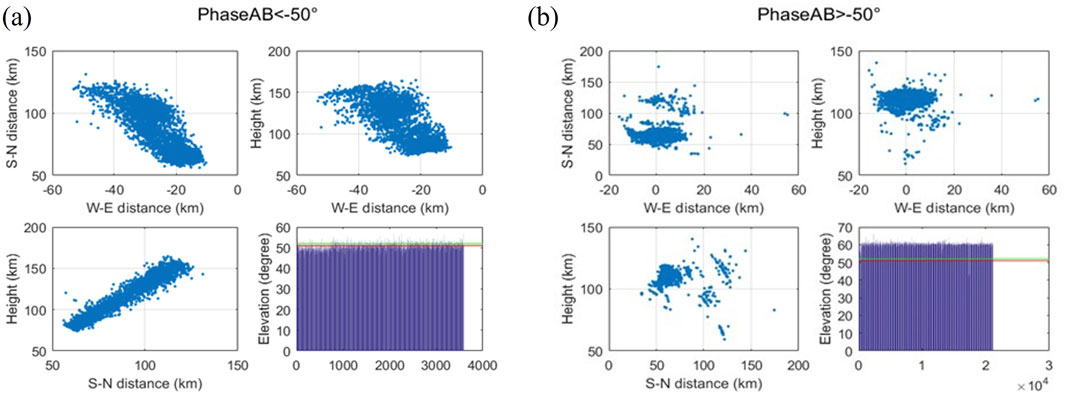
Figure 10. (A)
Figure 11 shows the IDBS diagrams of FAIs observed by the Kunming VHF radar. Compared with the VHF radar data shown in Figure 11, the FAIs echo for 14:00 UT appears in the range gate of 110–150 km, i.e., the altitude is 85–120 km. As seen in Figure 10, the data corresponding to
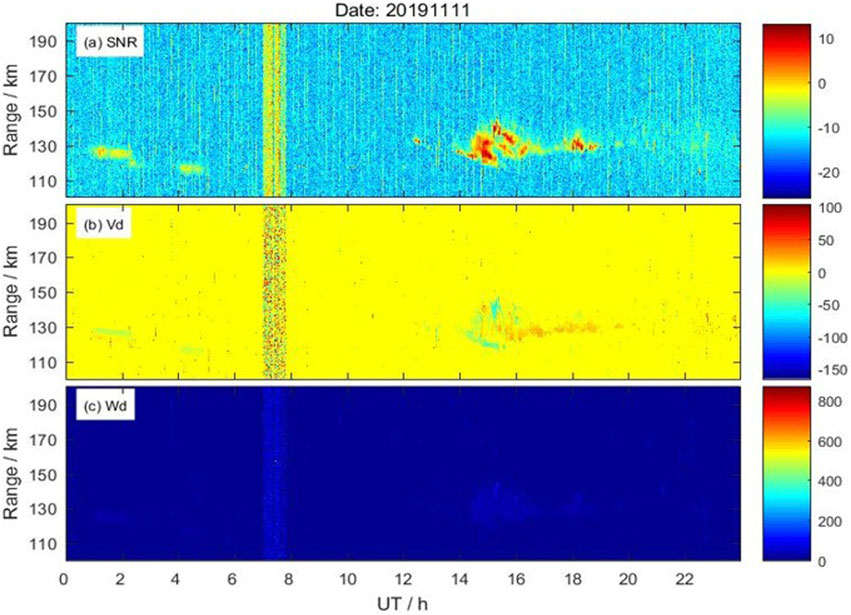
Figure 11. Results of the FAI obtained from the Kunming radar array before system phase calibration. LT = UT+8 h.
According to the above analysis, the predicted value of the east-west phase difference,
5 Observation results
We use the above interferometry method to process the radar raw data obtained from the Kunming VHF radar and carry out a system phase calibration for the phase difference between different channels. Figure 13 presents the spatial and temporal variations of the three-dimensional fine structure of the E-region irregularities observed on November 11, 2019. In Figure 13A, the left column represents the result of the echo projection on the horizontal plane (north-south and east-west), the middle column represents the projection on the azimuth plane (height and east-west), and the right column represents the projection on the elevation plane (height and north-south). It can be seen from the right column Figure 13A that the echo of the E-region irregularities is mostly concentrated in the area perpendicular to the geomagnetic field. Comparing the echo structures at different times, the FAI tends to drift westward. It has been reported that low and midlatitude E-region FAI echoes in the northern hemisphere predominantly align along a northwest-southeast axis and typically migrate westward or southward (Saito et al., 2006; Yamamoto et al., 1994; Hysell et al., 2004). It can also be seen from Figure 13A that the echo of FAIs takes a cluster shape with a vertical range of about 8 km, a latitudinal range of about 10 km, and a meridional range of about 10 km. The theory of wave-induced polarization electric field suggests that polarization electric fields induced by wave fluctuations can trigger gradient drift instability in the Es layer, which in turn generate FAI structures aligned along the geomagnetic field at the ionospheric E-layer altitude through amplitude modulation processes (Tsunoda et al., 1994; Woodman et al., 1991). Based on the observations from the Chung-Li VHF radar, Lee et al. (2000) found that the virtual height of the Es layer is about 5–10 km higher than the occurrence height of FAIs. Thus, the results as shown in Figure 13A are likely to be modulated by fluctuations in the ionosphere E-region. It is notable that due to the high sensitivity of the E-layer irregularities in the geomagnetic field, only a small part of the whole FAI structure can be observed in the direction perpendicular to the geomagnetic field. Comparing the interferometric results obtained here with the results of the Shigaraki MU (Yamamoto et al., 1994) radar and Sanya VHF radar (Li et al., 2014), Figure 13A shows a similar three-dimensional spatial structure of FAIs in the E-layer with the previous observations. To illustrate a more intuitive result, we present the FAI spatial structure obtained at time 14:38 UT in a three-dimensional plot, as shown in Figure 13B. It is indicated that the three-dimensional spatial structure obtained here via the inversion algorithm of irregularities is feasible. The interferometry technique significantly enhances the accuracy and precision of the derived parameters compared to traditional radar techniques, allowing for a more detailed study of the properties of turbulence.

Figure 13. (A) Three-dimensional spatial structure of FAI in Kunming. (B) Three-dimensional diagram of the spatial structure of the FAI obtained from the Kunming array.
6 Conclusion
In this work, one scheme was proposed for the interferometry of the E-region irregularities using the Kunming VHF radar. The proposed scheme is moving the original group of integrated receiving and transmitting channel antenna arrays for interferometric measurement. After comparing the experimental scheme and the original antenna array, it was concluded that it is feasible to adopt the experimental scheme to build the interferometry system of E-region irregularities in the Kunming VHF radar and develop inversion algorithm related to the structural parameters of the E-region irregularities based on spatial interferometry.
The detection results show that the interferometry and echo parameter inversion of the E-region irregularities can be used to obtain the special-temporal distribution of FAIs position, Doppler spectrum, and other information related to the FAIs, as well as the spatial three-dimensional fine structure. It is of great significance to statistically analyze the morphological structure and formation mechanism of the FAIs in the low and middle latitude of China and to solve key scientific problems related to the E-region irregularities in the low and middle latitudes.
Data availability statement
The original contributions presented in the study are included in the article/supplementary material, further inquiries can be directed to the corresponding authors.
Author contributions
BC: Writing–original draft, Writing–review and editing. YX: Data curation, Writing–original draft, Writing–review and editing. CZ: Investigation, Methodology, Writing–review and editing. YZ: Writing–review and editing. YL: Writing–review and editing, Data curation. TX: Data curation, Writing–original draft. BX: Data curation, Writing–original draft. JF: Data curation, Writing–original draft. TL: Investigation, Methodology, Writing–review and editing. HQ: Writing–review and editing. ZD: Data curation, Writing–original draft. XW: Investigation, Methodology, Writing–review and editing. XZ: Methodology, Investigation, Writing–original draft, Writing–review and editing.
Funding
The author(s) declare that financial support was received for the research, authorship, and/or publication of this article. This work was supported by the National Natural Science Foundation of China (Grant No. 42204161), the Sichuan Provincial University Key Laboratory of Detection and Application of Space Effect in Southwest Si-chuan (No. ZDXM202101001), the Natural Science Foundation of Hubei Province of China youth fund project (No. 2022CFB651, 2023AFB200).
Acknowledgments
We are grateful to the reviewers for their thoughtful reviews and advice, which led to an improved revised manuscript. Wang Xiang appreciated the support by “The Young Top-notch Talent Cultivation Program of Hubei Province”.
Conflict of interest
The authors declare that the research was conducted in the absence of any commercial or financial relationships that could be construed as a potential conflict of interest.
Publisher’s note
All claims expressed in this article are solely those of the authors and do not necessarily represent those of their affiliated organizations, or those of the publisher, the editors and the reviewers. Any product that may be evaluated in this article, or claim that may be made by its manufacturer, is not guaranteed or endorsed by the publisher.
References
Aggson, T. L., Laakso, H., Maynard, N. C., and Pfaff, R. F. (1996). In situ observations of bifurcation of equatorial ionospheric plasma depletions. J. Geophys. Res. Space Phys. 101, 5125–5132. doi:10.1029/95JA03837
Berkner, L. V., and Wells, H. W. (1934). F-region ionosphere-investigations at low latitudes. Terr. Magnetism Atmos. Electr. 39, 215–230. doi:10.1029/TE039i003p00215
Bernhardt, P. A. (2002). The modulation of sporadic-E layers by Kelvin–Helmholtz billows in the neutral atmosphere. J. Atmos. Solar-Terrestrial Phys. 64, 1487–1504. doi:10.1016/S1364-6826(02)00086-X
Buchau, J., Weber, E. J., and Whitney, H. E. (1979). “New insight into ionospheric irregularities and associated VHF/UHF scintillations,” in AGARD digital communication in avionics, 26. (SEE N79-31458 22-32).
Chen, J.-S., Chu, Y.-H., Su, C.-L., Hashiguchi, H., and Li, Y. (2016). Range imaging of E-region field-aligned irregularities by using a multifrequency technique: validation and initial results. IEEE Trans. Geoscience Remote Sens. 54, 3739–3749. doi:10.1109/TGRS.2016.2521702
Chen, J.-S., and Zecha, M. (2009). Multiple-frequency range imaging using the OSWIN VHF radar: phase calibration and first results. Radio Sci. 44. doi:10.1029/2008RS003916
Chilson, P. B., Yu, T.-Y., Strauch, R. G., Muschinski, A., and Palmer, R. D. (2003). Implementation and validation of range imaging on a UHF radar wind profiler. J. Atmos. Ocean. Technol. 20, 987–996. doi:10.1175/1520-0426(2003)20<987:IAVORI>2.0.CO;2
Chu, Y. h., Yang, K. f., Wang, C. y., and Su, C. l. (2013). Meridional electric fields in layer-type and clump-type plasma structures in midlatitude sporadic E region: observations and plausible mechanisms. J. Geophys. Res. Space Phys. 118, 1243–1254. doi:10.1002/jgra.50191
Chu, Y.-H., and Wang, C.-Y. (1999). Interferometry investigations of VHF backscatter from plasma irregularity patches in the nighttime E region using the Chung-Li radar. J. Geophys. Res. Space Phys. 104, 2621–2631. doi:10.1029/98JA02329
Cosgrove, R. B., and Tsunoda, R. T. (2001). Polarization electric fields sustained by closed-current dynamo structures in midlatitude sporadic E. Geophys. Res. Lett. 28, 1455–1458. doi:10.1029/2000GL012178
Cosgrove, R. B., and Tsunoda, R. T. (2002a). A direction-dependent instability of sporadic-E layers in the nighttime midlatitude ionosphere. Geophys. Res. Lett. 29, 11-1–11-4. doi:10.1029/2002GL014669
Cosgrove, R. B., and Tsunoda, R. T. (2002b). Wind-shear-driven, closed-current dynamos in midlatitude sporadic E. Geophys. Res. Lett. 29, 7-1–7-4. doi:10.1029/2001GL013697
Cosgrove, R. B., and Tsunoda, R. T. (2003). Simulation of the nonlinear evolution of the sporadic-E layer instability in the nighttime midlatitude ionosphere. J. Geophys. Res. Space Phys. 108. doi:10.1029/2002JA009728
Cosgrove, R. B., and Tsunoda, R. T. (2004). Instability of the E-F coupled nighttime midlatitude ionosphere. J. Geophys. Res. Space Phys. 109. doi:10.1029/2003JA010243
Evans, J. V. (1969). Theory and practice of ionosphere study by Thomson scatter radar. Proc. IEEE 57, 496–530. doi:10.1109/PROC.1969.7005
Farley, D. T. (1966). A theory of incoherent scattering of radio waves by a plasma: 4. The effect of unequal ion and electron temperatures. J. Geophys. Res. (1896-1977) 71, 4091–4098. doi:10.1029/JZ071i017p04091
Farley, D. T., Ierkic, H. M., and Fejer, B. G. (1981). Radar interferometry: a new technique for studying plasma turbulence in the ionosphere. J. Geophys. Res. Space Phys. 86, 1467–1472. doi:10.1029/JA086iA03p01467
Franke, S. J. (1990). Pulse compression and frequency domain interferometry with a frequency-hopped MST radar. Radio Sci. 25, 565–574. doi:10.1029/RS025i004p00565
Huyghebaert, D., Hussey, G., Vierinen, J., McWilliams, K., and St.-Maurice, J.-P. (2019). ICEBEAR: an all-digital bistatic coded continuous-wave radar for studies of the E region of the ionosphere. Radio Sci. 54, 349–364. doi:10.1029/2018RS006747
Hysell, D. L., and Chau, J. L. (2006). Optimal aperture synthesis radar imaging. Radio Sci. 41, 1–12. doi:10.1029/2005RS003383
Hysell, D. L., Chau, J. L., Coles, W. A., Milla, M. A., Obenberger, K., and Vierinen, J. (2019). The case for combining a large low-band very high frequency transmitter with multiple receiving arrays for geospace research: a geospace radar. Radio Sci. 54 (7), 533–551. doi:10.1029/2018rs006688
Hysell, D. L., Larsen, M. F., and Zhou, Q. H. (2004). Common volume coherent and incoherent scatter radar observations of mid-latitude sporadic E-layers and QP echoes. Ann. Geophys. 22 (9), 3277–3290. doi:10.5194/angeo-22-3277-2004
Hysell, D. L., Nossa, E., Larsen, M. F., Munro, J., Sulzer, M. P., and Gonzalez, S. A. (2009). Sporadic E layer observations over Arecibo using coherent and incoherent scatter radar: assessing dynamic stability in the lower thermosphere. J. Geophys. Res. 114, A12303. doi:10.1029/2009JA014403
Kagan, L. M., and Kelley, M. C. (1998). A wind-driven gradient drift mechanism for mid-latitude E-region ionospheric irregularities. Geophys. Res. Lett. 25, 4141–4144. doi:10.1029/1998GL900123
Kudeki, E., Farley, D. T., and Fejer, B. G. (1982). Long wavelength irregularities in the equatorial electrojet. Geophys. Res. Lett. 9, 684–687. doi:10.1029/GL009i006p00684
Kudeki, E., and Stitt, G. R. (1987). Frequency domain interferometry: a high resolution radar technique for studies of atmospheric turbulence. Geophys. Res. Lett. 14, 198–201. doi:10.1029/GL014i003p00198
Larsen, M. F. (2000). A shear instability seeding mechanism for quasiperiodic radar echoes. J. Geophys. Res. Space Phys. 105 (A11), 24931–24940. doi:10.1029/1999ja000290
Lee, C. C., Liu, J. Y., Pan, C. J., and Igarashi, K. (2000). The heights of sporadic-E layer simultaneously observed by the VHF radar and ionosondes in Chung-Li. Geophys. Res. Lett. 27 (5), 641–644. doi:10.1029/1999gl003713
Li, G., Ning, B., Abdu, M. A., Otsuka, Y., Yokoyama, T., Yamamoto, M., et al. (2013). Longitudinal characteristics of spread F backscatter plumes observed with the EAR and Sanya VHF radar in Southeast Asia. J. Geophys. Res. Space Phys. 118 (10), 6544–6557. doi:10.1002/jgra.50581
Li, G., Ning, B., and Hu, L. (2014). Interferometry observations of low-latitude E-region irregularity patches using the Sanya VHF radar. Sci. China Technol. Sci. 57, 1552–1561. doi:10.1007/s11431-014-5592-3
Liu, Y., Deng, Z., and Xu, B. (2021). Design and research of antenna array of Kunming VHF radar using for the interferometry observations. Commun. Technol. 54 (5), 1045–1051. doi:10.3969/j.issn.1002-0802.2021.05.002
Lu, F., Farley, D. T., and Swartz, W. E. (2008). Spread in aspect angles of equatorial E region irregularities. J. Geophys. Res. 113 (A11), A11309. doi:10.1029/2008ja013018
Luce, H., Hassenpflug, G., Yamamoto, M., and Fukao, S. (2006). High-resolution vertical imaging of the troposphere and lower stratosphere using the new MU radar system. Ann. Geophys. 24, 791–805. doi:10.5194/angeo-24-791-2006
Luce, H., Yamamoto, M., Fukao, S., Helal, D., and Crochet, M. (2001). A frequency domain radar interferometric imaging (FII) technique based on high-resolution methods. J. Atmos. Solar-Terrestrial Phys. 63, 221–234. doi:10.1016/S1364-6826(00)00147-4
Nossa, E., Hysell, D. L., Fallen, C. T., and Watkins, B. J. (2009). Radar observations of artificial E-region field-aligned irregularities. Ann. Geophys. 27 (7), 2699–2710. doi:10.5194/angeo-27-2699-2009
Otsuka, Y., Shiokawa, K., Ogawa, T., and Wilkinson, P. (2002). Geomagnetic conjugate observations of equatorial airglow depletions. Geophys. Res. Lett. 29, 43-1–43–4. doi:10.1029/2002GL015347
Palmer, R. D., Yu, T.-Y., and Chilson, P. B. (1999). Range imaging using frequency diversity. Radio Sci. 34, 1485–1496. doi:10.1029/1999RS900089
Saito, S., Yamamoto, M., and Hashiguchi, H. (2008). Imaging observations of nighttime mid-latitude F-region field-aligned irregularities by an MU radar ultra-multi-channel system. Ann. Geophys. 26 (8), 2345–2352. doi:10.5194/angeo-26-2345-2008
Saito, S., Yamamoto, M., Hashiguchi, H., and Maegawa, A. (2006). Observation of three-dimensional structures of quasi-periodic echoes associated with mid-latitude sporadic-E layers by MU radar ultra-multi-channel system. Geophys. Res. Lett. 33 (14). doi:10.1029/2005gl025526
Sun, L., Xu, J., Wang, W., Yuan, W., and Zhu, Y. (2017). Evolution processes of a group of equatorial plasma bubble (EPBs) simultaneously observed by ground-based and satellite measurements in the equatorial region of China. J. Geophys. Res. Space Phys. 122, 4819–4836. doi:10.1002/2016JA023223
Tsunoda, R. T., Fukao, S., and Yamamoto, M. (1994). On the origin of quasi-periodic radar backscatter from midlatitude sporadic E. Radio Sci. 29, 349–365. doi:10.1029/93RS01511
Wang, C. Y., Chu, Y. H., Su, C. L., Kuong, R.-M., Chen, H.-C., and Yang, K. F. (2011). Statistical investigations of layer-type and clump-type plasma structures of 3-m field-aligned irregularities in nighttime sporadic E region made with Chung-Li VHF radar. J. Geophys. Res. Space Phys. 116. doi:10.1029/2011JA016696
Woodman, R. F., and La Hoz, C. (1976). Radar observations of F region equatorial irregularities. J. Geophys. Res. (1896-1977) 81, 5447–5466. doi:10.1029/JA081i031p05447
Woodman, R. F., Yamamoto, M., and Fukao, S. (1991). Gravity wave modulation of gradient drift instabilities in mid-latitude sporadic E irregularities. Geophys. Res. Lett. 18, 1197–1200. doi:10.1029/91GL01159
Yamamoto, M., Fukao, S., Ogawa, T., Tsuda, T., and Kato, S. (1992). A morphological study on mid-latitude E-region field-aligned irregularities observed with the MU radar. J. Atmos. Terr. Phys. 54 (6), 769–777. doi:10.1016/0021-9169(92)90115-2
Yamamoto, M., Fukao, S., Woodman, R. F., Ogawa, T., Tsuda, T., and Kato, S. (1991). Mid-latitude E region field-aligned irregularities observed with the MU radar. J. Geophys. Res. Space Phys. 96, 15943–15949. doi:10.1029/91JA01321
Yamamoto, M., Komoda, N., Fukao, S., Tsunoda, R. T., Ogawa, T., and Tsuda, T. (1994). Spatial structure of the E region field-aligned irregularities revealed by the MU radar. Radio Sci. 29, 337–347. doi:10.1029/93RS01846
Yeh, K. C., Liu, C. H., and Seshadri, S. R. (1973). Theory of ionospheric waves. IEEE Trans. Plasma Sci. 1, 42. doi:10.1109/TPS.1973.4316816
Yokoyama, T., Hysell, D. L., Otsuka, Y., and Yamamoto, M. (2009). Three-dimensional simulation of the coupled Perkins and Es-layer instabilities in the nighttime midlatitude ionosphere. J. Geophys. Res. Space Phys. 114 (A3). doi:10.1029/2008ja013789
Yokoyama, T., Yamamoto, M., and Fukao, S. (2003). Computer simulation of polarization electric fields as a source of midlatitude field-aligned irregularities. J. Geophys. Res. Space Phys. 108. doi:10.1029/2002JA009513
Yu, T.-Y., and Brown, W. O. J. (2004). High-resolution atmospheric profiling using combined spaced antenna and range imaging techniques. Radio Sci. 39. doi:10.1029/2003RS002907
Zhang, G., Yu, T.-Y., and Doviak, R. J. (2005). Angular and range interferometry to refine weather radar resolution. Radio Sci. 40. doi:10.1029/2004RS003125
Keywords: VHF radar, field-aligned irregularities, three-dimensional structure, interferometry, parameter inversion
Citation: Chen B, Xu Y, Zhou C, Zhang Y, Liu Y, Xu T, Xu B, Feng J, Lan T, Qing H, Deng Z, Wang X and Zhang X (2024) Interferometry of ionospheric E-region irregularities based on Kunming VHF radars. Front. Astron. Space Sci. 11:1343286. doi: 10.3389/fspas.2024.1343286
Received: 23 November 2023; Accepted: 23 September 2024;
Published: 07 October 2024.
Edited by:
Guozhu Li, Chinese Academy of Sciences (CAS), ChinaReviewed by:
Eliana Nossa, The Aerospace Corporation, United StatesChunxiao Yan, Chinese Academy of Sciences (CAS), China
Copyright © 2024 Chen, Xu, Zhou, Zhang, Liu, Xu, Xu, Feng, Lan, Qing, Deng, Wang and Zhang. This is an open-access article distributed under the terms of the Creative Commons Attribution License (CC BY). The use, distribution or reproduction in other forums is permitted, provided the original author(s) and the copyright owner(s) are credited and that the original publication in this journal is cited, in accordance with accepted academic practice. No use, distribution or reproduction is permitted which does not comply with these terms.
*Correspondence: Xiang Wang, d2FuZ3hpYW5nLndodUB3aHUuZWR1LmNu; Xinmiao Zhang, enhtd2h1QHdodS5lZHUuY24=
 Bo Chen1
 Yihao Xu
 Chen Zhou
 Yuqiang Zhang
