 S. Sathishkumar
 S. Sridharan2
- 1Equatorial Geophysical Research Laboratory, Indian Institute of Geomagnetism, Tirunelveli, India
- 2National Atmospheric Research Laboratory, Pakala, India
- 3Radar Observatory, Shivaji University, Kolhapur, India
Upper mesospheric wind data acquired by the medium frequency radar at Kolhapur (16.7oN, 74.2oE) and Modern–Era Retrospective analysis for Research and Application version 2 (MERRA-2) temperature and wind reanalysis datasets are used to investigate the dynamical response of the low-latitude middle atmosphere to the sudden stratospheric warming (SSW) events that occurred during the 2017–18 and 2018–19 winters. When the amplitude of the high-latitude stratospheric planetary wave (PW) of zonal wavenumber one reduces considerably with the onset of the SSW event, the low-latitude mesospheric PW over Kolhapur also shows a considerable reduction in the PW activity. It is noteworthy that the upper mesospheric winds are eastward for approximately 3 weeks after the onset of SSW. The reduced PW activity is associated with the enhanced gravity wave activity in the meridional wind during the SSW 2018–19 event. The plane of propagation of gravity waves obtained from the perturbation ellipse method suggests that their predominant plane of propagation is in the north–south direction. The persistence of the eastward winds is suggested to be due to the interaction of the northward propagating gravity waves with the mean flow, leading to the eastward acceleration due to the Coriolis force.
Highlights
• Enhanced planetary wave (PW) activity prior to the onset of SSW in 2019 in the low-latitude mesopause region.
• Mesospheric gravity wave activity increased when PW activity is reduced during SSW of 2019.
• At low latitudes, the zonal wind is westward at upper stratospheric heights during the SSW 2018–19 event due to the convergence of the PW flux.
1 Introduction
A sudden stratospheric warming (SSW) event is the sudden increase in the temperature of the cold polar stratosphere during some winters. The event can persist for a few days with either just a deceleration of the eastward winds in a minor event or a complete reversal of the eastward winds in a major event. The widely accepted mechanism for the formation of SSW events is the anomalous generation and vertical propagation of the quasi-stationary planetary waves (PWs) from the troposphere to the stratosphere and their interaction with the mean flow (Matsuno, 1971). These westward-propagating planetary waves induce westward forcing in the polar winter stratosphere, resulting in the deceleration and/or reversal of eastward winter winds. This process leads to a downward circulation in the stratosphere, producing adiabatic heating and an upward circulation in the mesosphere and leading to adiabatic cooling, as observed by Liu and Roble (2002) and Liu (2005) in their numerical simulations. Their simulations also reveal that the stratospheric westward winds during SSW permit only eastward propagating gravity waves (GWs) while filtering the westward propagating gravity waves. These eastward propagating gravity waves reach the mesosphere and contribute to the change in the circulation by inducing eastward drag, leading to a change in the prevailing poleward/downward circulation during the northern hemispheric winter to the equatorward/upward circulation (Liu and Roble, 2002).
The high-latitude mesosphere responds to the SSW events with an enhancement in the PW amplitude just prior to the SSW event, followed by a drastic decrease in the amplitude with the SSW onset, along with zonal wind reversal and significant cooling (Shepherd et al., 2014; Zülicke and Becker, 2013; Stray et al., 2015; Zülicke et al., 2018). Using observations from multi-satellite missions including the Constellation Observing System for Meteorology, Ionosphere, and Climate (COSMIC), Challenging Mini satellite Payload (CHAMP), High-Resolution Dynamics Limb Sounder (HIRDLS), and Thermosphere–Ionosphere–Mesosphere Energetics and Dynamics (TIMED)/Sounding of the Atmosphere using Broadband Emission Radiometry (SABER), Wang and Alexander (2009) revealed the enhancement of the GW amplitudes in the stratosphere and reduction in the same in the lower mesosphere during SSW events. Jia et al. (2015) observed large GW amplitudes during the SSW events of 2008 and 2009.
Although there are many studies on the high-latitude middle atmospheric response to the SSW events, there are only a few studies on the low-latitude middle atmospheric response to the SSW events. Sridharan and Sathishkumar (2008) and Sathishkumar and Sridharan (2009) observed enhancements in the upper mesospheric gravity wave activity during the major SSW events. There had been many major events during 1999–2013, at least once a year or in alternate years. However, no major SSW event has occurred from 2014 until early 2017. Recently, major SSW events have occurred during the successive winters of 2017–18 and 2018–2019, giving us an opportunity to examine the low-latitude dynamical response to these two SSW events. Particularly, the present study examines and compares the variabilities of mean winds and planetary wave and gravity wave activities in the MLT region over a low-latitude station, Kolhapur (16.7°N, 74.2°E), during these two recent SSW events.
2 Datasets used
2.1 MERRA-2 reanalysis datasets
For this study, the daily wind and temperature data from the Modern–Era Retrospective analysis for Research and Application version 2 (MERRA-2) reanalysis (Bosilovich et al., 2015) for the period 01 December 2017–28 February 2018 and 01 December 2018–28 February 2019 are used. MERRA-2 data are available over 0.625° × 0.5° longitude–latitude grids at pressure levels ranging from ground to 0.1 hPa. As the MERRA-2 data represent the global features of stratospheric and lower mesospheric circulations quite well, they are frequently used to study dynamical events in the stratosphere, including planetary waves and SSWs.
2.2 Medium frequency radar data
The 1.98 MHz medium frequency radar at Kolhapur (16.2°N, 74.2°E) was installed by the Indian Institute of Geomagnetism, Mumbai, India, in 1999, and it is currently being operated with 32 kW peak power, 25 μs pulse duration, and 2 km height resolution. The system specifications are similar to the one installed earlier at Tirunelveli (8.7°N, 77.8°E), except that the antennae for the latter were linearly polarized (Rajaram and Gurubaran, 1998). The radar provides horizontal wind data in the MLT region between 70 and 110 km with a time resolution of 1 min using the spaced antenna method. More details about the instrumentation, data analysis, and method of retrieval of winds can be found in Rajaram and Gurubaran (1998). Though winds are computed with a high resolution of 1 min, several data points are rejected if they do not satisfy several data acceptance criteria adopted in the method of retrieval. The winds obtained are hourly averaged, and the hourly data are used for further analysis.
3 Results
3.1 The SSW 2017–18 and 2018–19 events
The occurrence of a major warming event has traditionally been identified by the positive temperature gradient between 60°N and the pole and the reversal of zonal wind at 60°N at 10 hPa (Andrews et al., 1987). The different panels of Figure 1 show the daily variations in zonal mean temperature difference between pole and 60oN, zonal mean temperature and zonal wind at 60°N and 17°N, and amplitudes of PWs of zonal wavenumbers 1–2 at 60°N and 17°N for the periods 1 December 2017 to 28 February 2018 and 1 December 2018 to 28 February 2019. During the 2017–18 winter, the occurrence of a series of SSW events can be noticed during days 62–66, 70–73, and 82, whereas the eastward wind gets decelerated and turns westward only on day 75 (major SSW). The reversal of the eastward wind persists till the end of February 2018 (day 87). As shown in Figure 1, the PW amplitudes in the zonal wind with wavenumber one enhance 2 weeks before the onset of warming at 60oN at 10 hPa, and their amplitude rapidly decreases during SSW (days 31–45). During the 2017–18 winter, the PW (k = 1) enhances prior to SSW, and the PW (k = 2) also increases during the onset of SSW of the 2018 event. This event is a vortex split-type event.
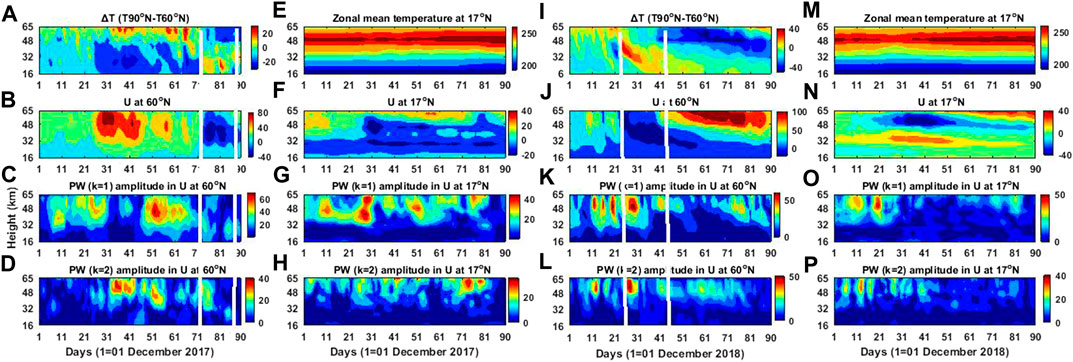
Figure 1. (A–P) State of stratosphere during the 2018–19 and 2017–18 winters at high latitudes (90°N-60°N) and 17oN. The four vertical columns (A–D) shows the time-altitude cross section of temperature gradient from pole and 60°N, zonal mean zonal wind at 60°N, PW (k = 1) amplitude in zonal wind and PW (k = 2) amplitude in zonal wind, second column (E–H) shows time-altitude cross section of zonal mean temperature, zonal mean wind, PW (k = 1) amplitude in zonal wind and PW (k = 2) amplitude in zonal wind at 17°N during 2018–19 winter, third(I–L) and fourth (M–P) column are similar to first and second column except for the winter 2017–18. (I–P) Same as (A–L), but for the days starting from 01 December 2018.
During the 2018–19 winter, an occurrence of the SSW event can be inferred to have taken place during 25 December 2018–16 January 2019 (day 47) based on the positive temperature difference between 90°N and 60°N, the deceleration of zonal mean zonal wind on 25 December 2018, and the subsequent reversal to westward flow that lasted until 16 January 2019 (major SSW). The peak positive temperature gradient of 27 K can be observed on 27 December 2018, which is associated with westward wind (−10 m/s) on day 41 (09 January 2019). During the 2017–18 winter, the PW (k = 2) increases during February 2018, and it was a split-type event. However, the PWs of k = 1 and k = 2 have larger and comparable amplitudes during the 2018–19 event, whereas the PW (k = 1) amplitude is dominant at the end of December and the PW (k = 2) is larger in the first week of January 2019, and hence, it is a mixed-type event with the combination of both displacement and split types.
The low-latitude circulation responds to the February 2018 event, and the westward wind is weakened by approximately 5 ms−1 in the middle and upper stratosphere regions between days 65 and 85. Above 48 km, an intense eastward is reverses to the westward of approximately 10 m/s on days 75 to 81, coinciding with the major SSW event occurring at high latitudes. During the 2018–19 winter, the low-latitude circulation responds well to the SSW event, with an intense eastward wind of 40 m/s prevailing during the days 25–45 in the middle and upper stratosphere regions. Relatively, the low-latitude middle atmosphere responds well to the SSW of 2018–19 winter than to the SSW of 2017–18 winter.
3.2 Wave forcing during the SSW events
The Eliassen–Palm flux (EP flux) has been widely used to represent wave propagation and zonal wave forcing in the meridional plane. It is defined by the following equations in spherical and log-pressure coordinates (Andrews et al., 1987):
The terms in Eqs 1–4 correspond to the standard notation of Andrews et al. (1987). Overbars and primes denote the zonal means and deviations along with their respective means. The subscripts ϕ and z denote the meridional and vertical derivatives, respectively. The direction of PW propagation can be identified from the orientation of the EP flux vectors. Negative (positive) EP flux divergence, i.e., ∇.F < 0 (∇.F > 0), corresponds to strong EP flux convergence (divergence). The convergence (divergence) of the EP flux indicates the piling up (export) of wave activity in the polar stratosphere. Wave driving (D) is proportional to the EP flux divergence (∇.F).
Wave forcing is an important component influencing the variability of the polar vortex and its position at low latitudes. The estimations of flux divergence and wave forcing are inevitable elements in wave propagation and amplification during SSW events. Therefore, EP flux divergence is significant for studying the dynamics of the polar vortex. In order to study wave driving and its behavior, we identified three days for the two SSW winters to represent prior to warming, peak warming, and post-warming, respectively. The wave transience arising from EP flux divergence and convergence yields eastward wind deceleration or acceleration. The planetary wave propagation direction can be inferred from the orientation of EP flux vectors. Figure 2 shows the meridional cross-section of EP flux vectors and wave forcing in the contour prior (20 December 2018), peak warming (4 January 2019), and post-warming (30 January 2019) events (left) and zonal mean zonal wind (right) for those days. The EP flux vectors are multiplied by e(Z/H) to view the vectors clearly in the stratosphere (Mechoso et al., 1985), and the vertical component of the EP flux vectors is magnified by a factor of 150 with respect to the horizontal component (Randel et al., 19877). As shown in Figure 2A, an intense convergence of wave flux on 20 December 2018 at high latitudes in the stratosphere gives rise to the precondition of warming. On 04 January 2019, strong convergence can be noticed equatorward up to 20°N in the height region above 30 km, associated with a strong westward wind in the zonal mean zonal wind (right). On 30 January 2019, the convergence of the EP flux extends further to the low latitudes at the equator. The westward winds can be observed in the upper stratosphere over equatorial latitudes. The winds return to normal in the high-latitude stratosphere. Figures 3A–F show similarity to Figure 2 except for the days 02, 16, and 28 February 2018. During the 2017–18 winter, the convergence reached up to 30°N during peak warming days. However, unlike the 2018–19 winter, the extension of convergence to the equatorial latitudes is not observed during the 2017–18 winter. It could be due to the fact that the 2017–18 SSW event is relatively moderate and associated with weaker planetary wave activity.
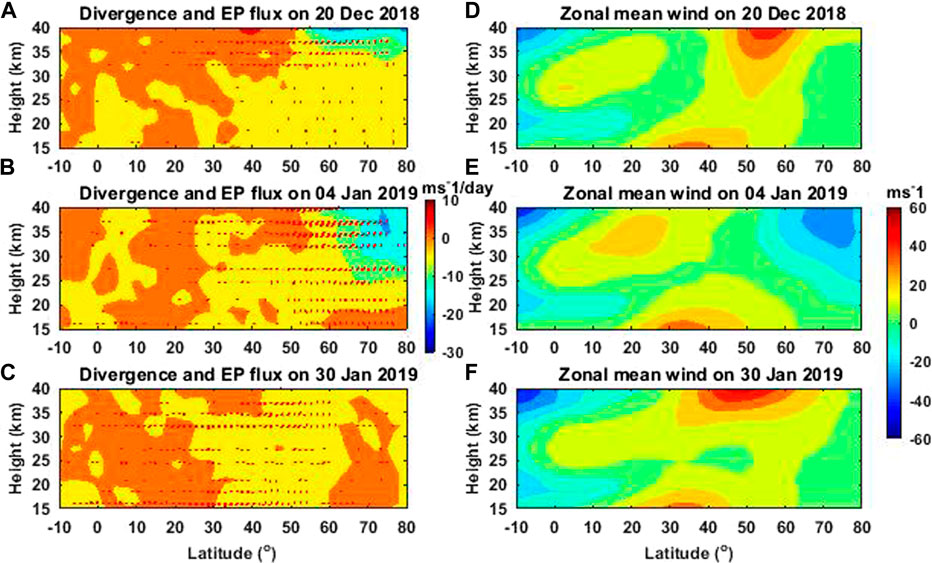
Figure 2. (A–C) EP flux cross-section in the meridional plane for prior, during, and post-warming days, i.e., 20 December 2018 and 04 and 14 January 2019, respectively. Contour represents the value of the wave-driving term D. (e–f) The same as for the day except for zonal wind.
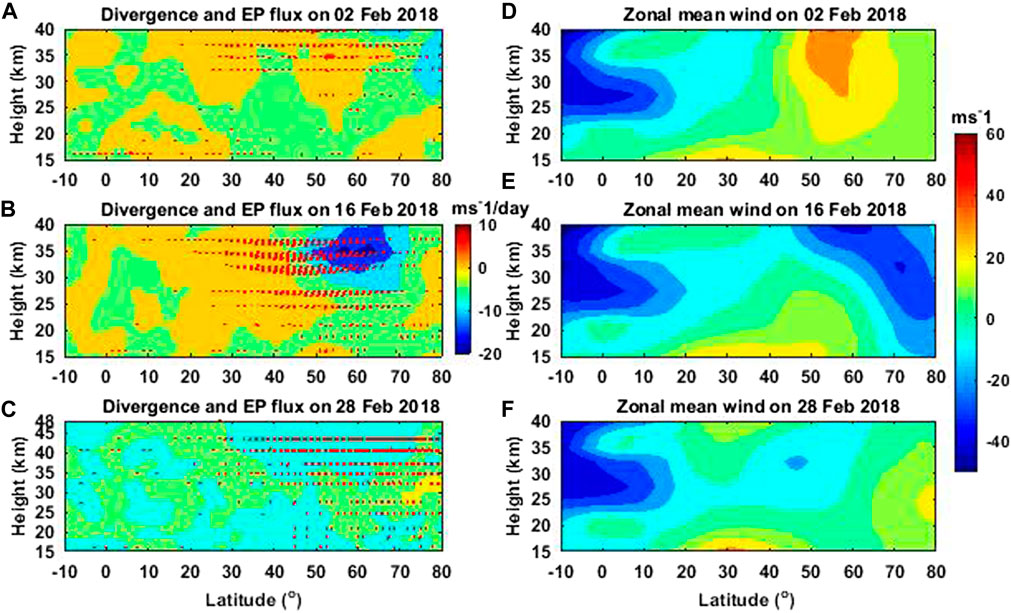
Figure 3. (A–C) The same as Figure 5 except for days 02, 16, and 28 February 2018 and (E, F) the same as for the days except for zonal wind.
3.3 Low-latitude MLT circulation
The response of the low-latitude MLT circulation to the two SSW events is depicted in Figure 4, which shows the daily mean zonal and meridional winds for the height region of 78–98 km acquired by the MF radar at Kolhapur. It may be recalled that a major SSW event occurred on days 25–45 during the winter of December 2018–February 2019. Before the onset of SSW, the zonal wind over Kolhapur exhibits alternating patterns of eastward and westward winds. However, immediately after the onset of SSW, the wind becomes largely eastward around day 30. The eastward wind persists for more than 20 days until around day 52. In the eastward wind regime, the winds are more eastward initially (>30 m/s), which later become approximately 20 m/s. After day 52, the westward wind is predominantly present. The meridional wind is in the poleward wind direction before the onset of SSW. It shows a quick transition to an equatorward direction around day 30, and it immediately changes to poleward. This poleward wind persists up to day 60. After day 60, the wind becomes equatorward, starting first at higher heights. When these results are compared with the SSW 2017–18 event, which is observed to occur during the days 62–82 as three successive bursts, it is apparent that during the SSW 2017–18 event, strong westward wind prevailing prior to the onset of the SSW event gets decelerated to weak eastward wind when there is reversal of stratospheric zonal wind at high latitudes. Weak fluctuations in the zonal winds are only present. In addition, there is no significant change observed in the meridional wind.
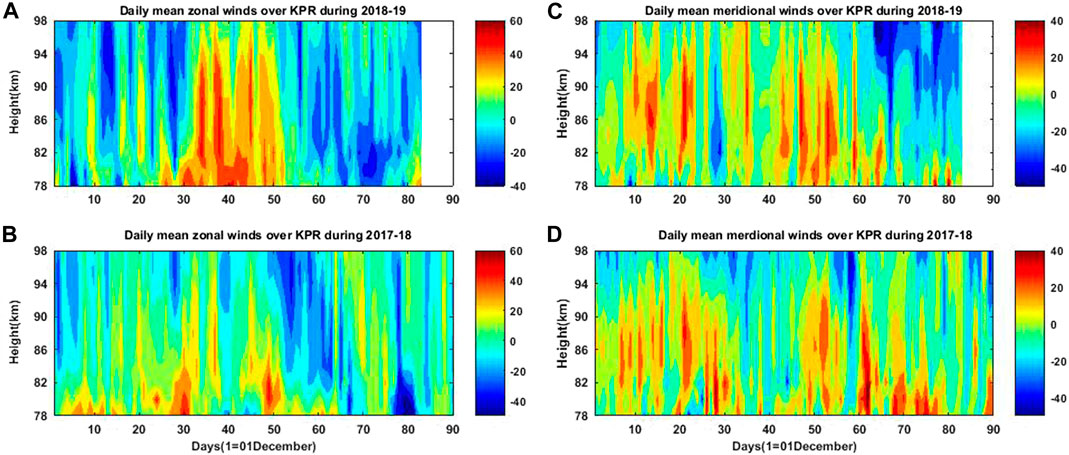
Figure 4. (A–D) Time-altitude cross-section of daily mean zonal (A, B) and meridional wind (C, D) over Kolhapur (16.7°N, 74.2°E) during 2018–19 and 2017–18 winters.
3.4 Planetary waves
In order to investigate the temporal variation of planetary wave activity in the MLT region over Kolhapur, the hourly mean MLT winds at 90 km over Kolhapur are subjected to wavelet analysis. Figure 5 shows the wavelet spectra of zonal and meridional winds at 90 km during the 80-day period of 1 December 2018–19 February 2019. As shown in Figure 5, the wavelet spectrum of the zonal wind over Kolhapur shows more energy in 12–17 day periodicity prior to the SSW, indicating the presence of the 16-day planetary wave, and the wave activity decreases drastically just before the onset of the SSW. In addition, the presence of a ∼5-day wave is also noticed during days 20–30. During the winter of 2017–18, PW activity with periods near 11 days is noticed in the zonal wind spectrum prior to the SSW event, though it is less when compared to the SSW 2018–19 event. In both events (SSW 2017–18 and 2018–19), PW activity observed in the low-latitude MLT region is similar to that observed in the high-latitude stratosphere. In both the polar stratosphere and low-latitude mesosphere, PW activity is absent for several days after the onset of the SSW event. This clearly reveals that PW variabilities, even in the low-latitude MLT region, are predominantly influenced by the major SSW events. The meridional wind spectrum does not show any significant wave periods during this course of the event, though a weak wave activity with a period of ∼10 days is present during days 20–30.
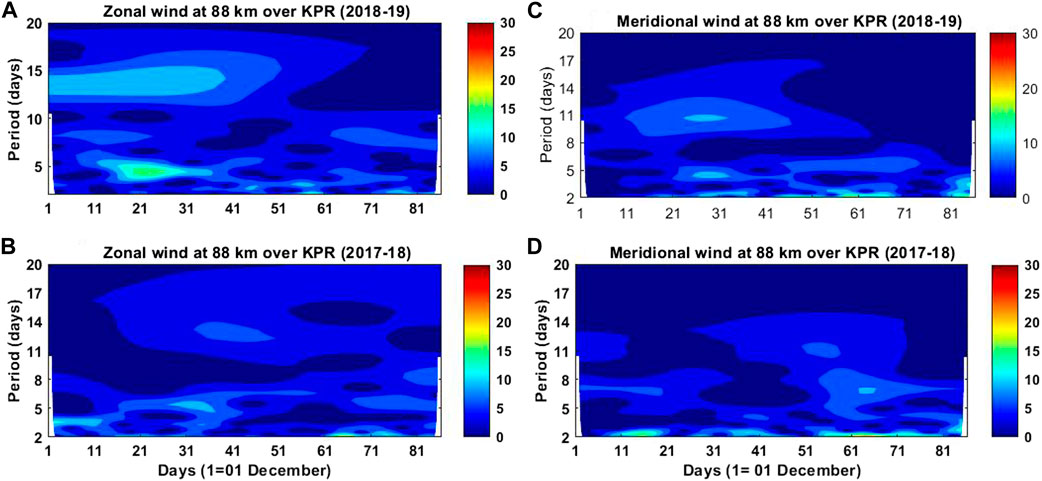
Figure 5. (A–D) Wavelet spectra of zonal (A, B) and meridional (C, D) winds at 90 km for 1–90 days starting from 01 December of 2018–19 (A, C) and 2017–18 (B, D).
3.5 Gravity waves
Previous studies from high latitudes observed enhanced gravity wave activity in the MLT region during SSW events (Hoffmann et al., 2007; Manney et al., 2008). In order to investigate the temporal variation of gravity wave activity in the low-latitude MLT region, the hourly zonal and meridional winds are subjected to residual filter (RS) analysis to examine gravity wave activity with a period of the order of few hours (Gavrilov et al., 1995). The RS filter data were obtained by estimating the variance of residual hourly values by removing mean winds and tidal components (24, 12, and 8 h). The output of the RS filter will yield an estimate of the intensity of the wind variation with a period in the range 2–6 h (Gavrilov et al., 1995). Figure 6 depicts gravity wave activity in meridional wind and zonal wind during 1 December 2018–19 February 2019 and 1 December 2017–28 February 2018, along with the state of the high-latitude stratosphere for the high-latitude region. During the SSW 2018–19 event, GW variance in the meridional wind over Kolhapur shows an enhancement from days 32 to 40 during the reversal of the eastward winds in the high-latitude stratosphere. However, during the SSW 2017–18 event, though there is a transient enhancement in the gravity wave variance near day 56, no persisting gravity wave activity is noted. There is no significant change noticed in the zonal wind variance during the SSW events.
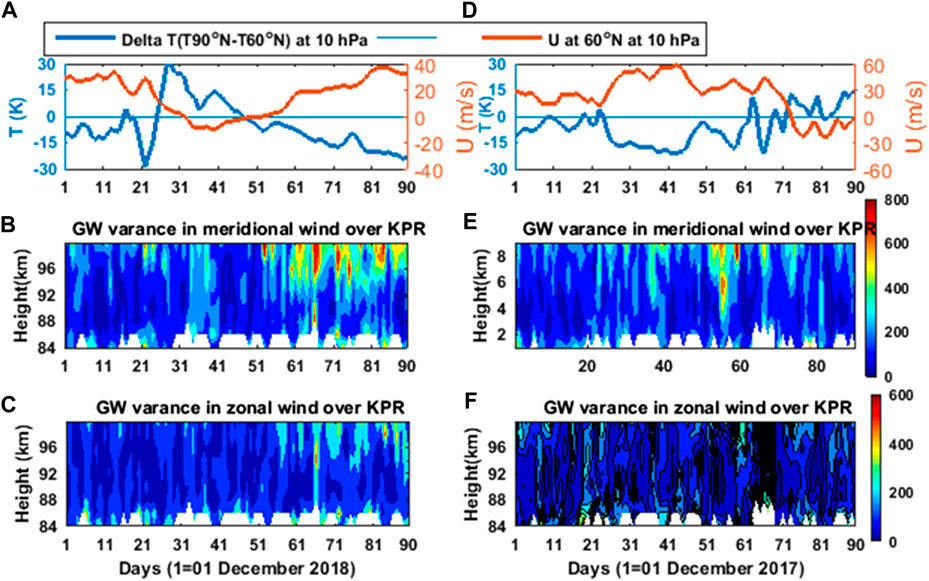
Figure 6. (A–C) Zonal mean temperature difference between pole and 60°N and zonal mean zonal wind 60°N at 10 hPa for the (A) 2018–19 and (B) 2017–18 winters and (B, E) altitude-time cross-section of gravity wave variance in meridional winds over Kolhapur (B) for 2018–19 and (E) 2017–18 winters for the right of the middle and (C, F) the same as (B, E) except for gravity wave variance in zonal wind in the bottom.
3.6 GW propagation direction during SSW
To infer the direction of propagation of GW activity from the perturbations of gravity waves, the perturbation ellipses have been calculated using the following equation (Gavrilov et al., 1995; Jacobi et al., 2006):
where
where r is the correlation coefficient between u’ and v’. The above equation describes an ellipse with the direction of the main axis as the preferred plane of propagation to be determined.
We have
where n = 1, if the denominator in Eq. 3 is negative, and n = 0 for r > 0 or n = 2 for r < 0, respectively, if the denominator in Eq. 3 is positive. One should keep in mind that Eq. 3 gives the angle of inclination of the main axis of the drift variance oval, which corresponds to the line of the propagation of the main wave component.
Figure 7 shows the perturbation ellipses at 86 km (top) and 90 km (bottom) over Kolhapur obtained from the group of days representing, respectively, prior to, during, and after the SSW event of the winter 2018–19. The propagation direction of gravity waves is in the northeast–southwest direction at 86 km and the northwest–southeast direction at 90 km prior to as well as post-SSW at 90 km. However, during the SSW event, an enhancement in the gravity wave activity is noticed from the expansion of the size of the perturbation ellipse during SSW. It is also interesting to note that the direction of propagation is consistent in the north–south plane at both 86 and 90 km. As there is 180° ambiguity, we can only determine the plane of propagation without precisely knowing the direction of propagation of gravity waves. The enhancement of gravity wave activity during SSW shown in Figure 8 is observed during the 2017–18 winter from the expanded ellipse. In this case, the direction of propagation is close to the north–south plane during SSW. There is also a change in the plane of propagation from northwest–southeast prior to SSW to northeast–southwest after SSW.
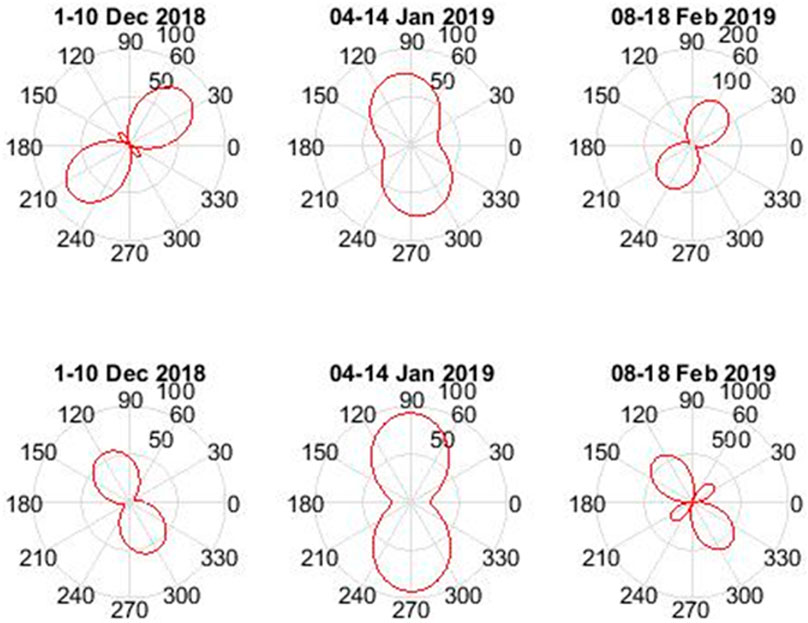
Figure 7. Perturbation ellipses for the days prior to (1–10 December 2018), during (04–14 January 2019), and post SSW (08–18 February 2019) of the winter 2018–19 obtained from the wind perturbations at heights 86 km (top) and 90 km (bottom).
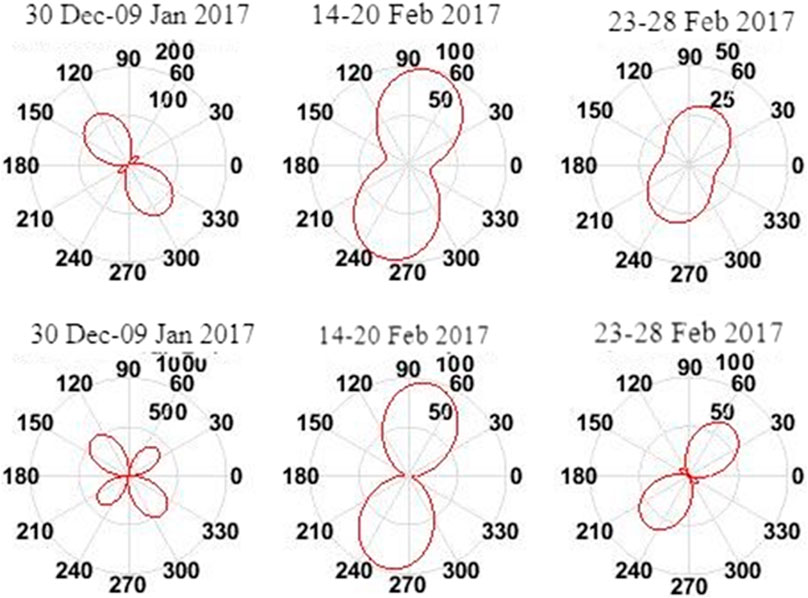
Figure 8. Perturbation ellipses for the days prior to (30 December–09 January 2017), during (14–20 February 2017), and post SSW (23–28 February 2017) of the winter 2017–18 obtained from the wind perturbations at heights 86 km (top) and 90 km (bottom).
4 Discussion
In this paper, we present the variabilities of mean winds and planetary wave and gravity activities in the MLT region over Kolhapur during the two recent stratospheric sudden warming events of February 2018 and January 2019. It is noticed that both events (2017–18 and 2018–19) exhibit enhanced planetary wave activity in the stratosphere prior to the onset of SSW events, whereas in the low-latitude mesosphere, the enhanced PW activity is observed well before the onset of SSW of 2019 and considerably diminished during and after the onset of SSW. The reduced PW activity continues even a few days after the onset of the SSW event. However, there was relatively little enhancement in the PW activity in the MLT region prior to the SSW 2017–18 event when compared to the SSW 2018–19 event. During the 2018–2019 winter, gravity wave activity is observed to be enhanced when there is a reduced planetary wave in the MLT heights. However, there is no such enhancement in the gravity wave variance noticed during the 2017–18 winter. Hoffman et al. (2007) also noticed an enhancement in GW activity at high-latitude MLT heights when there was a reduction in PW activity in the high-latitude stratosphere during 2005–06. Dunkerton and Butchart (1984) adopted the ray-tracing technique to study the propagation of the gravity wave during SSW and explained that enhancement in the PW amplification could lead to propagating and forbidden zones, thus reducing gravity wave propagation into the mesosphere. Our results also reveal the smaller GW variance prior to the onset of SSW events at times when the PW amplitudes are larger. The enhanced PW activity drives strong westward wind in the high-latitude winter stratosphere, causing the reversal of the stratospheric jet. The critical layer created for the upward propagation of the PW by the reversal of the jet leads to the breakdown of the wave. There is no significant PW flux observed above the critical layer, leading to the reduced PW activity at low-latitude MLT heights after the onset of the major SSW event.
During the 2018–19 winters, GW variance in the meridional wind over Kolhapur shows larger values from day 30, and it is associated with the reversal of stratospheric eastward wind. It might be a response to the reversal of eastward winds and diminished PW amplitude at stratospheric heights, which enable eastward propagating gravity waves to propagate upward. The TIME-GCM model results of Liu and Roble (2002) show that eastward gravity wave forcing in the winter hemisphere induces an equatorward and upward flow due to the Coriolis force at upper mesospheric heights.
Each SSW event has different dynamical responses to the MLT region over low latitudes, and it is highly variable in nature with respect to the other event. We also observed an increase in GW activity during 2018–2019 and not in the 2017–18 winter and differences in GW and PW activity during the SSWs, which may reflect the discrepant impacts of the different types of SSWs on the dynamics of the MLT region. The variability is mainly due to the variability in the GW activity at MLT heights, which is influenced by the wave-source mechanisms, the background winds through which they propagate, and the presence of PW of large amplitudes.
At low latitudes, the zonal wind is westward (Figure 1F) at upper stratospheric heights during the SSW 2018–19 event due to the convergence of the PW flux at low latitudes, which can be inferred from the large PW activity at 17°N (Figure 1G) just before the onset of the SSW. It might have caused the filtering of westward-propagating waves above the stratosphere. The eastward winds present in the lower stratosphere are relatively weaker. The eastward-propagating gravity waves can reach upper mesospheric heights and induce eastward acceleration. This explains the persisting eastward wind regime after the onset of the SSW. During the SSW 2017–18 event, the behavior of lower atmospheric winds was different. Large westward winds are present in the stratosphere, and eastward winds are present in the lower mesosphere. This might have prevented the gravity waves, which have both eastward and westward directions of propagation, from reaching the mesospheric heights.
In the present study, the perturbation ellipse was obtained from the residual wind perturbations after removing the tidal components that represent gravity wave activity in the north–south plane during the SSW event. Though the precise direction of propagation of gravity waves cannot be obtained from the perturbation ellipse method, the predominant plane of propagation can be obtained. Kovalam et al. (2011) observed that the direction of gravity wave propagation in the MLT region over Tirunelveli and Pameungpeuk is oriented in the north–south direction rather than the east–west direction. Earlier, Sridharan and Sathishkumar (2008) also noted the direction of propagation of gravity waves in the northwest–southeast direction. The northward-propagating gravity waves can induce northward acceleration, which, due to the Coriolis force, changes to eastward. This could also be the reason for the persisting eastward winds over Kolhapur.
5 Summary and conclusion
The important results obtained from the present study are summarized below.
1. The low-latitude mesospheric response to the recent two SSW events (2017–18 and 2018–19) is studied using the medium-frequency (MF) radar over Kolhapur. These two SSW events are different in the sense that the SSW 2017–18 event is the vortex split one, whereas the January 2019 event is relatively stronger with the vortex displacement type followed by the split type.
2. Using the EP flux and its divergence, the present study clearly shows the robust entry of PW energy from the high-to-low-latitude stratosphere during the SSW 2018–19 event, and PW activity reaches up to 20oN when the warming reaches the peak. However, during the SSW 2017–18 event, the PW activity is limited only up to 30oN.
3. PW activity is observed to be enhanced well before the onset of SSW of 2019 and considerably diminished during and after the event in the low-latitude mesosphere, whereas during the SSW 2017–18 event, there was only relatively less enhancement in PW activity in the MLT region prior to the event when compared to SSW of 2018–19.
4. When there is a reduced PW activity, enhancement in the GW activity in the low-latitude mesosphere over Kolhapur was noticed during the SSW 2018–19 event. However, no significant enhancement in GW activity is observed during the SSW 2017–18 event.
The plane of propagation of gravity waves is observed to be in the north–south direction during the SSW 2018–19 direction, and they could induce northward/southward acceleration in the background wind, which could be changed to eastward/westward acceleration by the Coriolis force, and this explains the enhanced eastward winds observed during the SSW 2018–19 event.
In our future work, we intend to conduct further investigations using both observations and modeling to better understand the SSW influence on the low-latitude mesospheric dynamics.
Data availability statement
The raw data supporting the conclusion of this article will be made available by the authors, without undue reservation.
Author contributions
SSa: writing–original draft, writing–review and editing, conceptualization, and methodology. SSr: conceptualization, validation, and writing–review and editing. KK: investigation and writing–review and editing. PP: data curation and writing–review and editing.
Funding
The author(s) declare that no financial support was received for the research, authorship, and/or publication of this article.
Acknowledgments
The authors are grateful to the MERRA-2 reanalysis fields that were obtained from the NASA Earth Observing System Data and Information System (https://earthdata. nasa.gov). They would also like to thank the technical team of Indian Institute of Geomagnetism for maintaining the MF radar at Kolhapur.
Conflict of interest
The authors declare that the research was conducted in the absence of any commercial or financial relationships that could be construed as a potential conflict of interest.
Publisher’s note
All claims expressed in this article are solely those of the authors and do not necessarily represent those of their affiliated organizations, or those of the publisher, the editors, and the reviewers. Any product that may be evaluated in this article, or claim that may be made by its manufacturer, is not guaranteed or endorsed by the publisher.
References
Andrews, D. G., Holton, W. J., and Leovy, C. B (1987). Middle Atmospheric Dynamics. New York: Elsevier, 184.
Bosilovich, M. G., et al. (2015). MERRA-2: initial evaluation of the climate. NASA Tech. Rep. NASA/TM-2015-104606 43, 136. https://gmao.gsfc.nasa.gov/pubs/docs/Bosilovich803.
Dunkerton, T. J., and Butchart, N. (1984). Propagation and selective transmission of internal gravity waves in a sudden warming. J. Atmos.Sci. 41, 1443–1460. doi:10.1175/1520-0469(1984)041<1443:pastoi>2.0.co;2
Gavrilov, N. M., Manson, A. H., and Meek, C. E. (1995). Climatological monthly characteristics of middle atmosphere gravity waves (10 min-10 h) during 1979-1993 at Saskatoon. Ann. Geophys. 13, 285–295. doi:10.1007/s00585-995-0285-7
Hoffmann, P., Singer, W., Keuer, D., Hocking, W. K., Kunze, M., and Murayama, Y. (2007). Latitudinal and longitudinal variability of mesospheric winds and temperatures during stratospheric warming events. J. Atmos. Solar-Terrestrial Phys. 69 (17-18), 2355–2366. doi:10.1016/j.jastp.2007.06.010
Jacobi, C., Гаврилов, Н. М., Kürschner, D., and Fröhlich, K. (2006). Gravity wave climatology and trends in the mesosphere/lower thermosphere region deduced from low-frequency drift measurements 1984–2003 (52.1°N, 13.2°E). J. Atmos. Solar-Terrestrial Phys. 68 (17), 1913–1923. doi:10.1016/j.jastp.2005.12.007
Jia, Y., Zhang, S., Yi, F., Huang, C., Huang, K., Gan, Q., et al. (2015). Observations of gravity wave activity during stratospheric sudden warmings in the Northern Hemisphere. Sci. China Technol. Sci. 58 (6), 951–960. doi:10.1007/s11431-015-5806-3
Kovalam, S., Tsuda, T., and Gurubaran, S. (2011). High-frequency gravity waves observed in the low-latitude mesosphere-lower thermosphere (MLT) region and their possible relationship to lower-atmospheric convection. J. Geophys. Res. 116 (D15), D15101. doi:10.1029/2011jd015625
Liu, H.-L., and Roble, R. G. (2002). A study of a self-generated stratospheric sudden warming and its mesospheric-lower thermospheric impacts using the coupled TIME-GCM/CCM3. J. Geophys. Res. Atmos., 107(D23), p. doi:10.1029/2001jd001533
Liu, H.-L., and Roble, R. G. (2005). Dynamical coupling of the stratosphere and mesosphere in the 2002 Southern Hemisphere major stratospheric sudden warming. Geophys. Res. Lett. 32 (13). doi:10.1029/2005gl022939
Manney, G. L., Katja, K., Pawson, S., Minschwaner, K., Schwartz, M. W., Daffer, W. H., et al. (2008). The evolution of the stratopause during the 2006 major warming: satellite data and assimilated meteorological analyses. J. Geophys. Res. 113 (D11). doi:10.1029/2007JD009097
Matsuno, T. (1971). A dynamical model of the stratospheric sudden warming. J. Atmos. Sci. 28 (8), 1479–1494. doi:10.1175/1520-0469(1971)028<1479:ADMOTS>2.0.CO;2
Mechoso, C. R., Hartmann, D. L., and Farrara, J. D.(1985). Climatology and interannual variability of wave, mean-flow interaction in the Southern Hemisphere. J. Atmos. Sci.42, 289–2206.
Rajaram, R., and Gurubaran, S. (1998). Seasonal variabilities of low-latitude mesospheric winds. Ann. Geophys. 16 (2), 197–204. doi:10.1007/s00585-998-0197-4
Randel, W. J., Stevens, D. E., and Stanford, L. J.(1987). A study of planetary waves in the southern winter troposphere and stratosphere, Part II: Life cycles. J. Atmos. Sci.44, 936–949.
Sathishkumar, S., and Sridharan, S. (2009). Planetary and gravity waves in the mesosphere and lower thermosphere region over Tirunelveli (8.7°N, 77.8°E) during stratospheric warming events. Geophys. Res. Lett. 36 (7). doi:10.1029/2008gl037081
Shepherd, M. G., Beagley, S. R., and Fomichev, V. I. (2014). Stratospheric warming influence on the mesosphere/lower thermosphere as seen by the extended CMAM. Ann. Geophys. 32 (6), 589–608. doi:10.5194/angeo-32-589-2014
Sridharan, S., and Sathishkumar, S. (2008). Seasonal and interannual variations of gravity wave activity in the low-latitude mesosphere and lower thermosphere over Tirunelveli (8.7° N, 77.8° E). Ann. Geophys. 26 (11), 3215–3223. doi:10.5194/angeo-26-3215-2008
Stray, N. H., Orsolini, Y. J., Espy, P. J., Limpasuvan, V., and Hibbins, R. E. (2015). Observations of planetary waves in the mesosphere-lower thermosphere during stratospheric warming events. Atmos. Chem. Phys. 15 (9), 4997–5005. doi:10.5194/acp-15-4997-2015
Wang, L., and Alexander, M. J. (2009). Gravity wave activity during stratospheric sudden warmings in the 2007–2008 Northern Hemisphere winter. J. Geophys. Res. 114 (D18). doi:10.1029/2009jd011867
Zülicke, C., and Becker, E. (2013). The structure of the mesosphere during sudden stratospheric warmings in a global circulation model. J. Geophys. Res. Atmos. 118 (5), 2255–2271. doi:10.1002/jgrd.50219
Keywords: planetary waves, gravity wave, mesosphere and lower thermosphere, sudden stratospheric warming, wavenumber, polar vortex
Citation: Sathishkumar S, Sridharan S, Krishnapriya K and Patil PT (2024) Response of the low latitude mesosphere and lower thermosphere to the recent sudden stratospheric warming events of 2017–18 and 2019. Front. Astron. Space Sci. 11:1308198. doi: 10.3389/fspas.2024.1308198
Received: 06 October 2023; Accepted: 26 March 2024;
Published: 10 June 2024.
Edited by:
Amitava Guharay, Physical Research Laboratory, IndiaReviewed by:
Karanam Kishore Kumar, Vikram Sarabhai Space Centre, IndiaRicardo Da Costa, Federal University of Campina Grande, Brazil
Copyright © 2024 Sathishkumar, Sridharan, Krishnapriya and Patil. This is an open-access article distributed under the terms of the Creative Commons Attribution License (CC BY). The use, distribution or reproduction in other forums is permitted, provided the original author(s) and the copyright owner(s) are credited and that the original publication in this journal is cited, in accordance with accepted academic practice. No use, distribution or reproduction is permitted which does not comply with these terms.
*Correspondence: S. Sathishkumar, c2F0aGlzaG1hdGhzQGdtYWlsLmNvbQ==