 Weijia Zhan
 Stephen R. Keappler
- 1Department of Physics and Astronomy, Clemson University, Clemson, SC, United States
- 2Now at Space Weather Technology, Research and Education Center, University of Colorado Boulder, Boulder, CO, United States
Introduction: The auroral E-region is an important interface where forces from the magnetosphere and the lower atmosphere converge and have a significant effect on the vertical structure of the neutral winds. The resulting vertical neutral wind structure has been reported to be associated with altitude-dependent and nonlinear effects from different forces. We conduct a statistical examination of the reactions of wintertime neutral winds to four various degrees of geomagnetic activity, with a focus on the impacts of ion drag.
Methods: We derive neutral winds using the PFISR measurements covering 2010–2019 and will give a statistical view of the auroral E-region neutral wind with a focus on the winter nighttime during different disturbed conditions. We investigate the effects of the geomagnetic activity on the neutral winds and the tidal components by dividing the dataset into 4 subsets. Tidal decomposition is conducted by least square fitting of the seasonal median winds to obtain the mean, diurnal amplitude, diurnal phase, semidiurnal amplitude, and semidiurnal phase.
Results and discussion: We find that 1) when geomagnetic activity increases, dawn-dusk asymmetry exists in both zonal and meridional winds in the upper E-region with stronger zonal wind in the dusk sector than in the dawn sector and much stronger meridional wind in the dawn sector than in the dusk sector. 2) Tidal decomposition results reveal that geomagnetic activity has more significant effects on the meridional diurnal amplitude than zonal diurnal amplitude while the zonal and meridional semidiurnal amplitudes show similar changes when the geomagnetic activity increases. In addition, the maximum semidiurnal amplitude, particularly in the zonal direction, appears at a higher altitude with larger values as geomagnetic activity increases, indicating an ascending transition altitude for the semidiurnal oscillations. The ascending trend of maximum semidiurnal amplitude appearing at higher altitudes during more disturbed conditions has not been reported before. 3) Zonal wind over 110 km demonstrates increasing ion drag effects in the evening sector and the effects of coupled ion drag and other factors after midnight.
1 Introduction
The auroral E-region is an important interface where forces from the magnetosphere and the lower atmosphere converge and have a significant effect on the vertical structure of the neutral winds. The resulting vertical neutral wind structure has been reported to be associated with altitude-dependent and nonlinear effects from different forces (i.e., Mikkelsen and Larsen, 1991; Parish and Lyons, 2006; Müller-Wodarg et al., 2001). The neutral wind has a significant impact on electromagnetic energy deposition (Thayer and Semeter, 2004; Cai et al., 2013; Zhan et al., 2021a). While the quiet-time E-region neutral wind is predominantly composed of the solar-driven background wind and upward-propagating tides from the lower atmosphere (Brekke et al., 1994; Nozawa and Brekke, 1999b), the disturbed neutral wind can also be modulated by the in-situ oscillations associated with the ion drag force and pressure gradient force due to Joule heating. These forces result in more complex spatial and temporal variations compared to the quiet-time background wind (i.e., Müller-Wodarg et al., 2001).
During perturbed conditions, numerical simulations have demonstrated that, in general, the neutral wind closely follows the two-cell plasma convection in the upper E-region and F-region, but with a time delay in the E-region due to the high concentration of neutrals (Fuller-Rowell and Rees, 1981; Hays et al., 1984; Kwak and Richmond, 2007). However, the interaction among forces at different altitudes and magnetic local time (MLT) sectors can make this scenario far more complex. Simulations of the high latitude E-region neutral winds have revealed nonlinear effects due to the superposition of tidal and auroral forcing, which can result in either an increase or a decrease in the magnitudes of the neutral winds (Gundlach et al., 1988; Mikkelsen and Larsen, 1991).
An important characteristic of the auroral E-region neutral wind is the dawn-dusk asymmetry, in which the anticyclone in the dusk sector is larger than the cyclone in the dawn sector. This asymmetry is suggested to be a result of the gradient wind balance in the auroral E-region (Larsen and Mikkelsen, 1983; Kwak and Richmond, 2007; Larsen et al., 2022). Larsen et al. (2022) gave an overview of the force balance, and we present a quick synopsis below. For a westward neutral flow in the auroral oval on the duskside (in the northern hemisphere), the Coriolis force and centrifugal force are, respectively, northward and southward. The neutral density in the high latitude E-region owns a pattern with high pressure in the duskside cell and low pressure in the dawnside cell. In addition, the neutral flow outside of the auroral acceleration channel is stationary or slow moving, convergence occurs on one side of the channel and divergence on the other, producing a back-pressure, which is southward in the evening sector. Therefore, the southward pressure gradient force can more easily counteract centrifugal and Coriolis forces. The balance of forces in the meridional direction allows the neutral parcels to remain in the auroral zone; hence, a stronger anticyclone can form when a minor zonal ion drag force persists for an extended period of time. For the eastward neutral flow on the dawnside, the Coriolis force and centrifugal force are both southward, and a substantially bigger northward pressure gradient force, which corresponds to a relatively long duration of acceleration, is necessary to achieve equilibrium in the meridional direction. As a result, the neutral parcels will only be accelerated in the auroral zonal channel for a brief period of time before achieving equilibrium. Therefore, dawn sector cyclones are typically weak. This hypothesis has been principally established by numerical simulations (Richmond et al., 2003; Kwak et al., 2007) and theoretic analysis (Larsen et al., 2022). An investigation of F-region neutral winds measurements from Fabry Perot interferometers also confirms the existence of dawn-dusk asymmetry of the winds (Oyama et al., 2023a; Oyama et al., 2023b). Larsen et al. (2022) also showed that the zonal wind velocity limit is set by the inertial wind value in the dusk sector and by twice the geostrophic wind speed in the dawn sector, which is much smaller than the initial wind value. The inertial wind corresponds to the balance between the curvature and Coriolis forces. These wind limits become important as geomagnetic activity increases, i.e., enhanced plasma drifts. The accompanying feature of the strong equatorward wind in the postmidnight sector can become very large (Richmond et al., 2003).
The responses of the neutral winds in the auroral E-region to different geomagnetic activity levels also show different behaviors in the dawn and dusk sectors due to the interaction of Joule heating related pressure gradient force and ion drag force (Thayer and Killeen, 1993; Kwak and Richmond, 2007; Kwak and Richmond, 2014; Dhadly et al., 2018). These studies show that in the upper E-region and F-region, the wind is dominated by the ion drag-related clockwise and anticlockwise rotational flows in the dusk and dawn sectors, respectively, with larger vorticity in the dusk sector. As geomagnetic activity increases, the heating-related divergent wind experiences a larger increase than the rotational wind. This feature leads to the smaller total wind in the dusk sector compared to the wind purely caused by the convection and cancels the increased convection-related rotational wind in the dawn sector. Therefore, the zonal wind would be enhanced but to a limited extent in the dusk sector and keep stable in the dawn sector.
Incoherent scatter radar (ISR) observations have been used to obtain altitude-resolved E-region neutral wind since the 1970s (i.e., Brekke et al., 1973; Brekke et al., 1994; Nozawa and Brekke, 1995; Nozawa and Brekke, 1999b; Tsuda et al., 2007; Heinselman and Nicolls, 2008). However, few incoherent scatter radar studies have resolved E-region winds as a function of geomagnetic activity level across a solar cycle. With only 14 days of observations, an early ISR research at Chatanika, Alaska (Johnson et al., 1987) compared neutral responses for three different geomagnetic activity conditions (Kp
For numerous decades, chemical tracers (i.e., trimethyl aluminum or TMA) released by sounding rockets have been used to calculate neutral winds Larsen (2002). The study by Larsen et al. (1997) showed 4 TMA-derived neutral wind measurements over Poker Flat for different geomagnetic activity levels and presented dramatic vertical variations above around 120 km and shears above and below a local maximum appeared below 120 km. Larsen et al. (2022) analyzed in detail the force balance aided by two TMA measurements. While TMA measurements have the advantage of high vertical resolution, such measurements are limited by temporal and spatial coverage.
The purpose of this paper is to understand and quantify how the average wind pattern over a diurnal cycle changes as a result of auroral forcing for different geomagnetic activity levels. This paper will follow the method to derive neutral winds using the measurements covering 2010–2019 and will give a statistical view of the auroral E-region neutral wind with a focus on the winter nighttime during different disturbed conditions. We will investigate the effects of the geomagnetic activity on the neutral winds by dividing the dataset into 4 subsets instead of 2 subsets like those done by Nozawa and Brekke (1995), Nozawa and Brekke (1999b). However, instead of using the global AP index, as was done in previous investigations (Nozawa and Brekke, 1995; Nozawa and Brekke, 1999b), we use local magnetometer perturbations of the Horizontal (H) component at Poker Flat as our metric for activity. Zhan et al. (2021a) showed in an example that the regional geomagnetic activity index (regional SuperMag Electrojet, SMEr) which incorporates geomagnetic disturbances in a narrow high latitude region can better represent the local auroral activity than global index (AE). Instead of using region index, we take a step further and only uses geomagnetic disturbance monitored by the local magnetometer. Therefore, we can see if the responses of the neutral wind due to auroral forcing vary consistently.
This paper will be organized as follows. The second section will introduce the PFISR measurements and methods used to derive neutral winds and do tidal decomposition. The third section will present the average wind pattern and the difference wind patterns by subtracting the quiet time wind from those during disturbed conditions. The ionospheric conditions associated with the measurements are also presented in this section. We will further get the tidal decomposition results during different disturbed conditions. Some implications of the results and comparisons with previous studies will be discussed as well as the limitations of this study.
2 Methodology
2.1 Poker flat incoherent scatter radar measurements and data
For this investigation, PFISR measurements during winter months (November, December, and January) from 2010 to 2019 are selected to derive the neutral winds in the E-region. We focus on the winter nighttime measurements when the auroral oval is always in darkness. The neutral wind is estimated using an implementation of the linear Bayesian inversion technique that is described in Heinselman and Nicolls (2008). The derived neutral wind data has a resolution of 10 min in time and 5 km in the vertical direction. The data set has been used to derive Joule heating and the results have been reported in the previous two papers (Zhan et al., 2021a; Zhan et al., 2021b). Details about PFISR measurements and radar modes can be found in Zhan et al. (2021a).
The neutral wind vector can be estimated from Incoherent scatter radar (ISR) measurements by measuring the deflection of the ion velocity vector observed in the E-region relative to the F-region plasma flow, which to very good approximation corresponds to the E×B direction. In the E-region, as the ion-neutral collision frequency increases with decreasing altitude, ions demagnetize and drift in a direction that becomes closer to that of the neutral wind with decreasing altitude. More details regarding ion demagnetization physics can be found in Richmond and Thayer (2000). A quantitative wind estimate can be obtained by solving the ion momentum equation that includes the ion drag force, subject to the assumption that the ion acceleration is zero. The electric field needed in the calculation is obtained from the F-region drifts and maps along the field lines to E-region heights (Farley Jr, 1959; Forget et al., 1991).
To optimize the solutions for the measured line-of-sight velocities, a linear Bayesian inversion method is used, as described by Heinselman and Nicolls (2008) for multi-beam ISR measurements. Given the line-of-sight velocities (LOS) and the uncertainty of the LOS velocities (eLOS) we can write the following linear equation,
where
We use a Bayesian inversion technique to solve Eq. 1 and provide an estimate of the neutral winds given the LOS velocity observations, i.e., provide an estimate
where Σp is the prior parameter covariance matrix, and Σe is the LOS error matrix standard errors on the LoS velocity measurements (Heinselman and Nicolls, 2008). The Bayesian estimation also provides a method for propagating the uncertainty, which is also derived in Tarantola (2005). The full covariance matrix of the estimator for altitude bin zk, Σx(zk), can be determined in the following way,
The interpretation of the estimated parameters in x (zk) is that they correspond to the most probable estimate of the neutral winds and electric field given the ISR LOS data with associated covariance specified by Σx(zk). We use a weak prior in the parameter covariance matrix, Σp, so posterior parameter covariance is driven primarily by the data. If we obtain a solution that has a variance equal to the prior, we know that the data did not provide an improvement in the estimation of the electric field and neutral winds. Heinselman and Nicolls (2008) presents a single case study from 2007 highlighting results using this technique; however, to our knowledge, there has not been a systematic investigation of E-region neutral winds using this method.
2.2 Tidal decomposition
We perform tidal decomposition of the seasonal median zonal and meridional wind components at each altitude to quantify the mean, diurnal, and semidiurnal oscillations, similar to the decomposition performed in Azeem and Johnson (1997). The median wind can be represented as
where ω24 = 2π/24 is the diurnal angular frequency and ω12 = 2π/12 is the semidiurnal angular frequency. Here A24 and A12 are the amplitudes of the diurnal and semidiurnal oscillations. The phases, t24 and t12, correspond to the magnetic local time of the maximum eastward and northward flow for the diurnal and semidiurnal oscillations, respectively. Previous investigations also used additional tidal components, including the 8- and 6-h period tidal components; however, for our investigation, we are primarily interested in the impact of geomagnetic activity on the diurnal and semidiurnal oscillations of the wind components.
Different from previous studies which usually divide the data set into quiet and active groups, we divide our data set into four different groups according to the geomagnetic disturbance level, which is indicated by the perturbations (ΔH) recorded by the local magnetometer measurements after background subtracting off the daily mean H-component. Due to the large data set, we have enough measurements in each subgroup. Therefore, we have a chance to specifically check if the effect of the magnetic activity or auroral forcing on the neutral wind is linear or nonlinear. The four subgroups correspond to ΔH ∈ (−100, 0) nT, (−300, −100)nT, (−500, −300) nT, and (-∞, −500) nT. Membership within each group was determined when ΔH was below a certain level (0, −100, −300, −500 in this case) and should last at least 1 h between 1800 and 0600 MLT to ensure a potential response of the neutral winds. For example, for the first group, the duration of ΔH below 0 should be at least 1 h but the duration of ΔH below −100 nT should be less than 1 h, otherwise, it will belong to other groups. Using this method, the numbers of events in each group are 317, 171, 78, and 45. Each event in these groups corresponds to the full 12-h period covering from 1800 to 0600 MLT. In addition, to do tidal decomposition, the full day (24-h) measurements are used to ensure the validity of the method.
3 Results
In this section, we will first present the local ionospheric conditions during different geomagnetic activity levels characterized by the local geomagnetic disturbance in Section 3.1. The median neutral wind variations are presented in Section 3.2 by applying a median filter with a 1-h window to the derived neutral winds with a time step of 15 min. Our focus is given to the nighttime variation during 1800–0600 magnetic local time (MLT). To quantify the effects of geomagnetic activity, we produce the difference wind patterns by subtracting the quiet time wind pattern from the disturbed wind patterns. These results are presented in Section 3.3. The tidal decomposition results are presented in Section 3.4.
3.1 Background
To better understand the neutral wind variations, we first present in Figure 1 three closely related basic geophysical parameters, ΔH, E ×B drift, and electron density (Ne) from left to right, respectively, during different disturbance levels from top to bottom. The plasma drift and electron density measurments are obtained directly from PFISR measurements. We show these results during 1300–1300 MLT (0000–2400 UT) to have a full picture of the ionospheric conditions during the whole day. The gray lines in the first column show the variation of raw ΔH for all the events in each disturbance group. The black lines correspond to their averages. The blue and red lines in the second column show the median zonal and meridional E ×B drifts, respectively. The third column shows the average electron density on a logarithmic scale. The dashed vertical lines indicate the magnetic midnight.
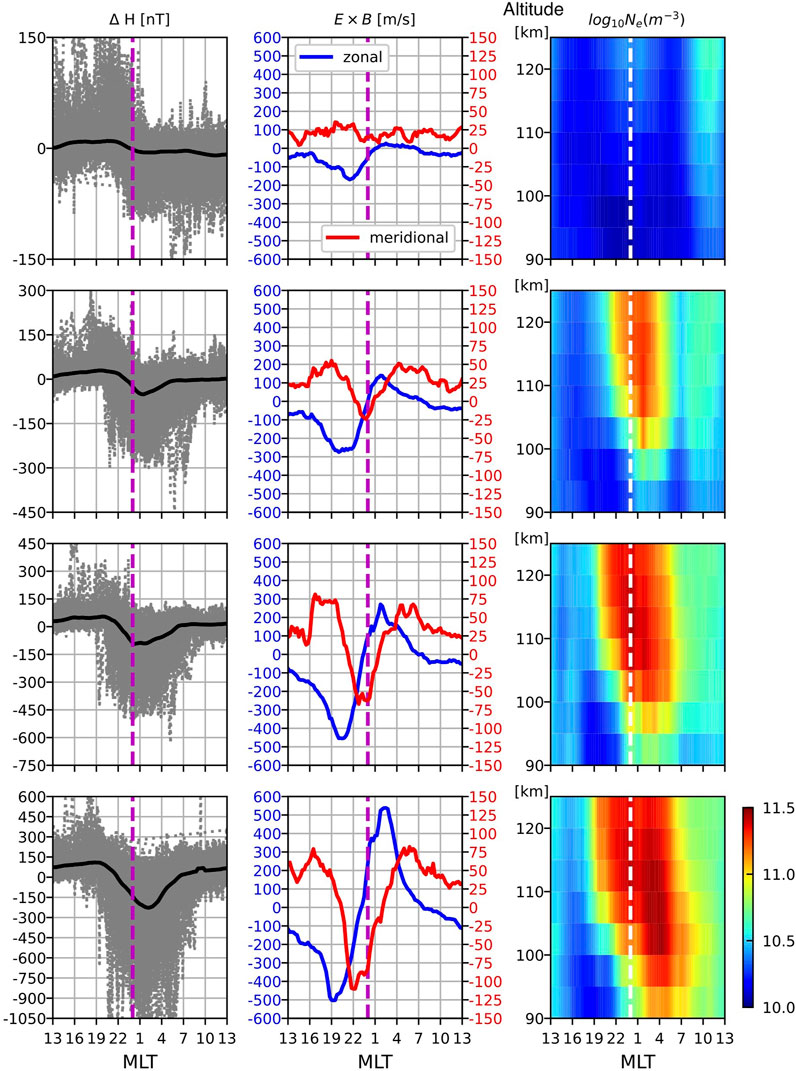
FIGURE 1. Background ionospheric conditions (from left to right: ΔH, magnetic field disturbance, median zonal and meridional E × B drifts, and electron density) for different geomagnetic conditions (from top to bottom: quiet, weak, moderate, and strong). The gray lines in the left column represent all events and the black lines present the averages. Positive values of plasma drifts indicate geomagnetic eastward and northward directions.
We summarize the key features of the three parameters as the geomagnetic disturbance level increases. First, ΔH is mainly positive during the daytime (1000–1900 MLT) due to the eastward electrojet and mostly negative during nighttime (1900–1000 MLT) due to the westward electrojet (Vickrey et al., 1982). The westward electrojet around magnetic midnight is the largest due to strong substorm activity. Second, the zonal component of E ×B drift shows diurnal variation while the meridional component shows a transition from semidiurnal variation to diurnal variation as the disturbance level increases. The magnitude of the zonal component is much larger than the meridional component (∼550 m/s vs. ∼110 m/s in strong condition). The larger zonal drift is consistent with the dominant cross-polar cap electric field. The zonal drift also presents stronger magnitudes in the dusk sector than in the dawn sector, especially during quiet, weak, and moderate conditions. This stronger zonal drift in the duskside is consistent with previous studies which show that the horizontal potential gradient tends to be steeper in the duskside (Milan and Grocott, 2021). The maximum westward drift appears earlier when the geomagnetic activity increases. Third, the electron densities during nighttime are very small (smaller than the daytime values) during quiet conditions due to a lack of auroral or solar EUV production. However, the electron density becomes enhanced and expands to lower altitudes with longer duration during nighttime as the geomagnetic disturbance level increases which indicates stronger particle precipitation. The deepest altitudes of the enhancements occur after midnight and the strongest enhancements occur between 100 and 115 km.
3.2 Median neutral winds
The median zonal and meridional neutral winds during nighttime, from 1800 to 0600 MLT, are plotted as a function of MLT (MLT ∼ UT - 11 h) and altitude in Figures 2A–D and Figures 3A–D, respectively. The contour lines are shown with a spacing of 40 m/s. Positive values of the zonal and meridional winds correspond to eastward and northward, respectively. The zonal and meridional directions are in geomagnetic coordinates, which is a suitable coordinate system when investigating high latitude neutral winds as a function of geomagnetic activity level (i.e., Hays et al., 1984).
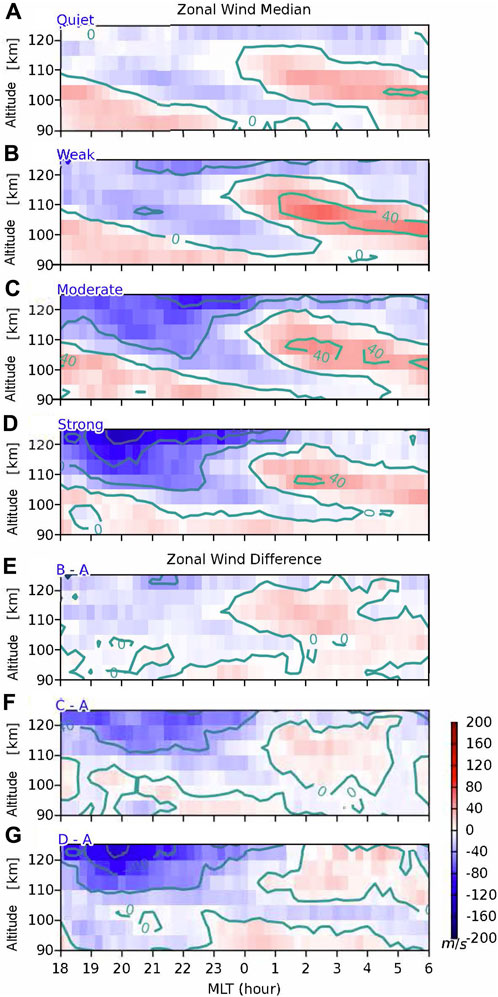
FIGURE 2. Median zonal winds in winter as a function of MLT (MLT
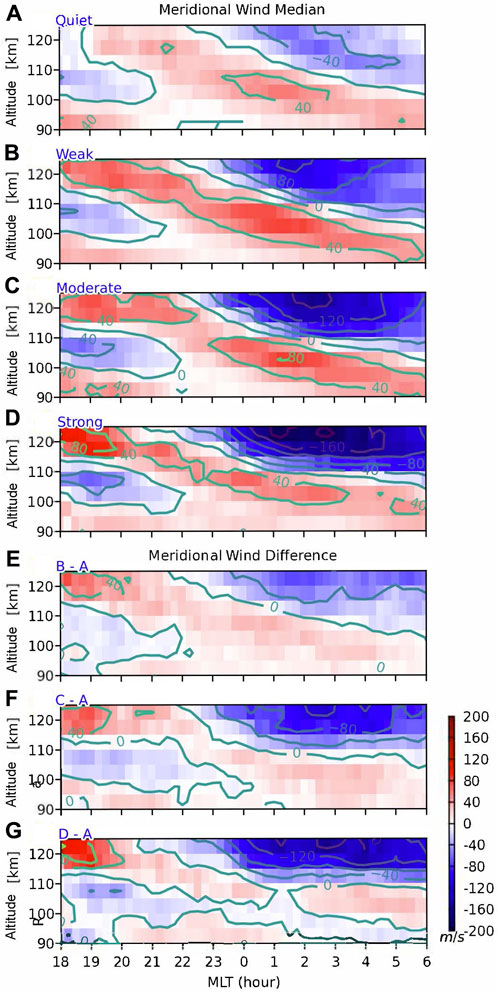
FIGURE 3. The same as Figure 2 but for meridional winds.
We observe some similarities in the median neutral winds between different geomagnetic conditions. First, in the lower E-region, mainly between 100 and 115 km, oscillations appear in both the zonal and meridional winds. The transitions of the directions of both wind components show a downward phase progression in altitude, which is typically associated with upward propagating tides from the lower atmosphere. The zonal winds show a downward phase progression with respect to time transitioning from eastward to westward winds in the premidnight sector, but the winds become predominantly eastward in the postmidnight sector. In the upper E-region, the zonal wind is westward above around 110 km in the premidnight sector and becomes weakly westward above around 120 km in the postmidnight sector. The median meridional wind flows southward between 100 and 110 km until 2100 MLT, and then the winds become northward until 0600 MLT. Above 110 km, the winds are northward until approximately 0000 MLT and then become strongly southward into the postmidnight.
Geomagnetic activity has clear impacts on the median neutral winds during disturbed conditions versus quiet conditions. The zonal and meridional winds become enhanced as the geomagnetic disturbance level increases. Westward winds above 110 km between 1800 and 2300 MLT show an increase in magnitude as the geomagnetic activity level increases and the region of wind enhancements extends to lower altitudes. The postmidnight sector, however, does not show a significant enhancement in the zonal winds as a function of geomagnetic activity. Both the northward wind in the evening sector and the southward wind in the postmidnight sector become enhanced as geomagnetic activity increases. In particular, the southward wind in the postmidnight is significantly enhanced (
3.3 Difference winds
To understand the changes of neutral wind due to geomagnetic activity, we subtracted the quiet time wind pattern from the wind patterns during weak, moderate, and strong geomagnetic activity conditions to obtain the difference wind patterns. These results are presented in Figures 2E–G and Figures 3E–G, respectively. The spacing between contour lines is again 40 m/s.
In the upper E-region, above around 110 km, there are two regions with fairly large magnitudes: an increasing northwest component in the evening sector and a southward component in the postmidnight sector. As geomagnetic activity increases, the westward winds in the evening sector show larger enhancements than the eastward winds in the postmidnight sector. The westward winds increase by greater than 40 m/s and 80 m/s for moderate and strong geomagnetic activity, while the increase is modest for weak activity. The southward winds in the postmidnight sector are also enhanced to a much larger degree than the northward winds in the evening sector during disturbed conditions. Even in the weak case, the meridional winds showed an enhancement of above 40 m/s, while becoming larger than 80 m/s during the moderate and strong geomagnetic activity levels.
The magnitudes of eastward winds above 110 km in the postmidnight are consistent for the three disturbance levels. These rather constant eastward difference winds regardless of geomagnetic disturbance level are very different than the increasing eastward E × B plasma drift and electron densities shown in Figure 1. This observation suggests that the eastward wind cannot be explained purely through the Pedersen component of the ion drag (Larsen and Walterscheid, 1995). In the lower E-region, between 100 and 110 km, the difference zonal wind shows westward enhancements in the premidnight sector, while in the postmidnight sector, there is a modest eastward wind enhancement. Also between 100 and 110 km, the difference winds in the meridional direction show southward enhancements in the evening sector and northward enhancements in the postmidnight, especially during strong conditions. These changes are weakly correlated with geomagnetic activity and show opposite directions relative to the difference winds observed above 110 km. Previous studies have shown that changes in the neutral winds in the lower E-region can be associated with the Hall component of ion drag (Larsen and Walterscheid, 1995; Kwak and Richmond, 2007).
3.4 Tidal decomposition
The results of the tidal decomposition for the zonal and meridional winds as a function of altitude are presented in Figure 4. The left and right columns show the tidal components of zonal and meridional wind, respectively. The rows from top to bottom correspond to the mean wind, the amplitude of the diurnal component, the amplitude of the semidiurnal component, the phase of the diurnal component, and the phase of the semidiurnal component, respectively. The blue, red, black, and green curves correspond to the results during quiet, weak, moderate, and strong geomagnetic conditions, respectively.
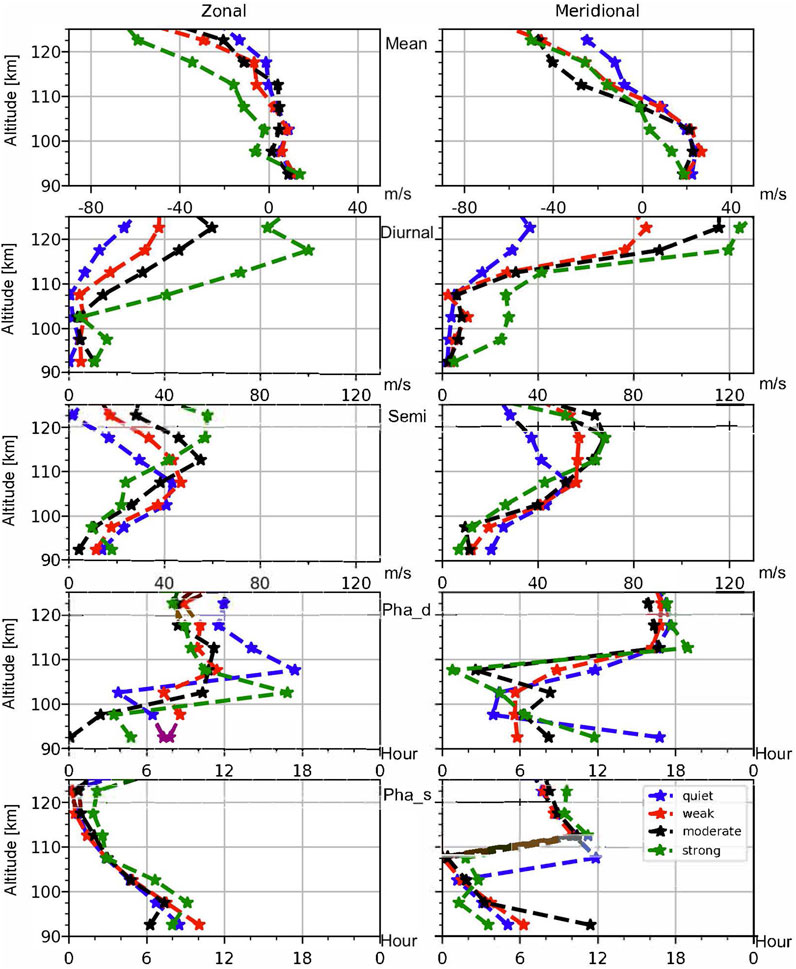
FIGURE 4. Tidal components of zonal (left) and meridional (right) neutral winds during different disturbed conditions (blue: quiet, red: weak, black: moderate, green: strong). From top to bottom: mean, amplitude of diurnal component, amplitude of semidiurnal component, the MLT when diurnal component reaches positive maximum, and the MLT when semidiurnal component reaches positive maximum.
We summarize some important changes in the tidal components for different geomagnetic conditions. First, the mean winds are eastward and northward below 110 km and become westward and southward above around 110 km. This eastward wind below 110 km is consistent with the mean zonal wind in December solstice in Fuller-Rowell (1995). Both of the mean wind components become enhanced during disturbed conditions. Second, the diurnal amplitudes are small in the lower E-region but increase at and above 110 km as a function of the geomagnetic activity level and reach a maximum at 122.5 km. The meridional diurnal amplitude is enhanced to a larger degree as the geomagnetic activity level increases. Third, the semidiurnal amplitude has a maximum of around 110 km during the quiet conditions, but there is an upward shift of the peak altitude as geomagnetic activity increases. This upward shift in altitude is especially prominent in the zonal wind. This ascending trend of maximum semidiurnal amplitude of neutral wind in the E-region has not been reported before and needs further investigation. This maximum of semidiurnal amplitudes around 110 km can be a signature of the semidiurnal mode S (2,2) (Richmond, 2017). In the fourth row, the phases of the diurnal component do not change significantly above 110 km, which indicates a direct impact from ion drag. Finally, the phases of the semidiurnal component show a downward phase progression and the phases are consistent for different disturbed conditions, especially between 100 and 120 km. The lack of change in the semidiurnal phases above 120 km is consistent with a recent study by Günzkofer et al. (2022). Their study suggests a local generation of semidiurnal oscillation besides upward propagating semidiurnal tides. While it is not the goal of this paper to locate the source of semidiurnal oscillations in the upper E-region, interested readers are referred to the simulation study by Günzkofer et al. (2022).
4 Discussion
We observed progressively enhanced northwestward wind in the evening sector and strong southward wind but weak zonal wind during postmidnight during disturbed conditions above 110 km. The stronger westward wind in the dawn and much stronger southward wind in the postmidnight indicate the existence of dawn-dusk asymmetry of neutral wind in both zonal and meridional directions. This dawn-dusk asymmetry of zonal wind above 110 km is generally in agreement with previous modeling and observational studies of the E− and F-region winds (i.e., Richmond et al., 2003; Kwak and Richmond, 2007; Oyama et al., 2023a; Oyama et al., 2023b). The dawn-dusk asymmetry of zonal wind in the auroral oval E-region was investigated in more detail through theoretical analysis of solutions of the gradient wind equation by taking account of TMA measurements in a most recent study by Larsen et al. (2022). One of the key predictions made through the solutions was explaining how a balance of forces could produce large westward wind observations on the eveningside of the auroral oval. Through applying the gradient wind equation in the auroral E-region, Larsen et al. (2022) showed that the solution of the gradient wind equation can be either regular or anomalous in the dusk sector while it can only be a regular solution in the dawn sector. The regular solution is limited by twice the geostrophic wind while the anomalous solution can reach the initial wind value, which is determined by the balance between curvature and Coriolis forces. Typical geostrophic wind is around 40 m/s with a temperature gradient of 2 K/100 km according to an estimate at Tromosø (Nozawa and Brekke, 1999a). Our observations demonstrate an enhancement of the westward winds as a function of the geomagnetic activity level in a statistical sense, which shows consistency with the theory by Larsen et al. (2022). We also notice that the stronger zonal E ×B drift in the duskside (see Figure 1) could also add to the stronger westward wind in the duskside than in the dawnside through ion drag. While the geostrophic wind balance is usually applied to explain the dawn-dusk asymmetry of zonal wind in the auroral region, the relative importance of electric potential and geostrophic wind balance needs further quantitative analysis which is out of the scope of this study.
In the postmidnight sector, at altitudes above 110 km, there are strong southward winds. This wind feature has been demonstrated in previous modeling investigations (Fuller-Rowell, 1984; Kwak and Richmond, 2007) and recent observational studies using Fabry-Perot interferometers in the F-region (Oyama et al., 2023a; Oyama et al., 2023b). Figure 5 shows a quiver figure of the median winds as a function of magnitude local time and geomagnetic activity level, with red, black, and green corresponding to weak, moderate, and strong geomagnetic activity, respectively. The rows show altitude slices at 92.5, 102.5, 112.5, and 122.5 km altitudes from the top to bottom row, with the left column being the median winds and the right column being the difference winds. These results are plotted in a format similar to Figure 7 in Oyama et al. (2023b) which shows the winds as a function of increasing geomagnetic activity level, indicated by the SME index versus local magnetometer perturbation level in our observations. Nonetheless, the most important feature is that the winds at 112.5 and 122.5 km altitudes show equatorward winds, while the winds at 92.5 km show instead poleward directed winds; these results are consistent with Oyama et al. (2023b). The magnitude of the equatorward-directed winds also increases as a function of geomagnetic activity level, again consistent with the findings in Oyama et al. (2023b). This strong equatorward wind during postmidnight is suggested to be associated with the enhanced antisunward plasma flow across the polar cap (Oyama et al., 2023b).
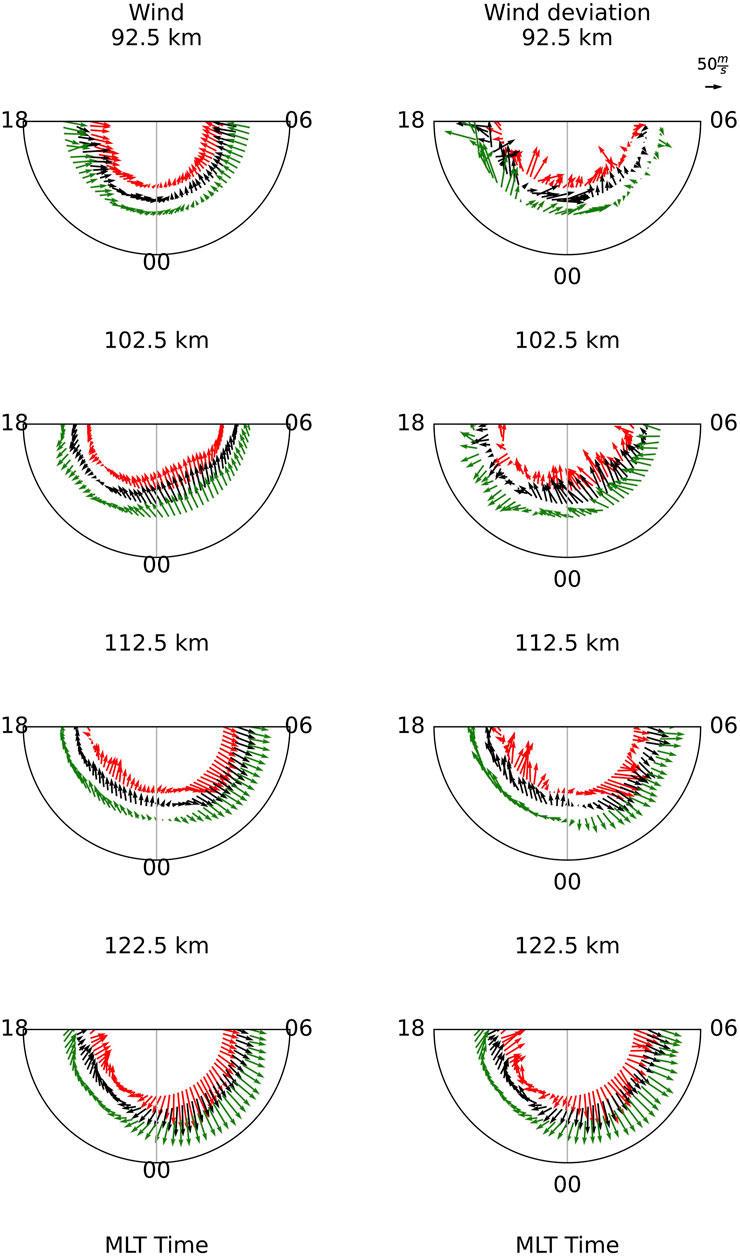
FIGURE 5. Polar plot of the (left) median winds and (right) difference winds during geomagnetic weak (red), moderate (black), strong (green) conditions, which are the same values as presented in Figures 2, 3, respectively.
The tidal decomposition results present more insights into the vertical variation of different components. In general, geomagnetic activity has a modest impact on the mean and diurnal components of the winds below 110 km and much more significant impacts above 110 km. The semidiurnal amplitudes become weakened below 110 km and strengthened above 110 km. Our results are consistent with the simulation results at high latitude (67.5° N) by Fesen et al. (1993) and Fesen (1997). The vertical variations of the zonal and meridional mean wind are similar to that of Nozawa and Brekke (1995) but their magnitudes are different below 110 km. The meridional mean wind below 110 km is larger and the zonal mean wind is smaller in our study than Nozawa and Brekke (1995). We also notice that the meridional mean below 107.5 km shows large change comparing to other conditions. This is a interesting feature and need further investigation. One possible reason might be that the local neutral wind responses might be impacted by Joule heating caused by auroral activity in a much larger scale especially in the meridional direction. The zonal diurnal amplitudes are similar to Nozawa and Brekke (1995) above 110 km, but the meridional diurnal amplitude is significantly different than these previous results. Nozawa and Brekke (1995) shows a maximum diurnal amplitude at around 120 km during both quiet and disturbed conditions. Our results show that the meridional diurnal amplitude peaks near 120 km altitude and even during weak activity there is nearly a factor of two increase in the amplitude relative to quiet time. Nozawa and Brekke (1995) attributed the significant change in the zonal diurnal amplitude to be associated with the effects of ion drag. Our results are consistent with this interpretation, but we also find a strong enhancement of the winds in the meridional direction as well.
Moreover, The vertical variation of semidiurnal amplitudes presents a distinct new feature as well as some similar features to the simulation by Fesen et al. (1993). Both our study and study by Fesen et al. (1993) show a maximum between 110 and 120 km and increasing magnitudes when the geomagnetic activity increases. This feature is also similar to observations at EISCAT (Nozawa and Brekke, 1995). The big difference is that the altitude of maximum semidiurnal amplitudes shows an ascending trend from 110 km during the quiet conditions to 120 km during the strong activity condition in our study and does not show much change in the simulation by Fesen et al. (1993) and observations (Nozawa and Brekke, 1995). Fesen et al. (1993) shows that tides play a dominant role in the semidiurnal tides below 150 km in the E-region. Therefore, the distinct ascending feature of semidiurnal tides below 120 km indicates the change in the background thermosphere which is altered to allow semidiurnal tides to propagate to higher altitudes before they break and dissipate. In addition, the semidiurnal phase result indicates that the semidiurnal tides could be associated with localized semidiurnal oscillation which has been investigated in detail by Günzkofer et al. (2022). To better interpret this feature, a numerical simulation study to reveal more details about the change of the background ionosphere-thermosphere with the increasing geomagnetic activity.
At last, we observed rather consistent westward wind above 120 km throughout the night especially during quiet, weak, and moderate conditions in Figure 2. The westward wind in the evening sector becomes enhanced with the increase of the geomagnetic activity while it is weak and shows small variations in the postmidnight sector. The weak westward wind in the upper E-region after midnight has been rarely reported before but it is consistent with that observed in the F-region by Thayer and Killeen (1993). Thayer and Killeen (1993) used measurements from the DE2 satellite to show that the plasma convection-related sunward neutral flow in dawn and dusk sectors in the auroral region will be enhanced during moderate conditions compared to quiet conditions. However, the solar and Joule heating-related divergent flow will reduce the sunward flow in the auroral region. The result is that the sunward flow in the dusk sector still becomes larger compared to quiet time but smaller than the purely convection-related sunward neutral flow while the sunward flow in the dawn sector gets inhibited. Therefore, the dawnside cell of neutral circulation is not always observed (Dhadly et al., 2018). This difference from other previous E-region neutral wind studies could be related to either the different locations where the measurements are made or the number of measurements and the associated geophysical conditions. The weak westward wind could be due to the Coriolis effect on the strong southward wind during postmidnight when it reaches lower latitude (Fuller-Rowell et al., 1994).
5 Conclusion
We have collected 10 years of PFISR measurements in winter to characterize the auroral E-region neutral wind responses under different disturbed conditions. The key findings are summarized as follows.
The neutral winds at lower E-region (below around 110 km) show oscillation structures and present little impact from the geomagnetic activity, which generally agrees with the results in Nozawa and Brekke (1995). This indicates that the lower E-region neutral winds are dominated by tidal forcing and these tides are less impacted by the auroral forcing, as has been concluded by several previous investigations (Nozawa and Brekke, 1995; Nozawa and Brekke, 1999a; Nozawa and Brekke, 1999b; Nozawa et al., 2005).
The zonal wind above 110 km shows increasing westward wind in the premidnight sector and remains weakly westward and relatively unchanged in the postmidnight sector above 120 km. The enhanced westward wind in the premidnight sector is likely due to the gradient wind balance that keeps the neutral parcel in the auroral region where the ion drag can interact for long time intervals. The weakly westward wind above 120 km in the postmidnight sector is different from previous studies, for example, the results in Nozawa and Brekke (1995). How this westward wind in the postmidnight occurs in the upper E-region is less known. The competition between tidal forcing and ion drag-related convection wind with different phases could play a role and lead to a reduction of neutral wind suggested by Müller-Wodarg et al. (2001). In-situ generated forces such as Joule heating-associated pressure gradient could also contribute to the complex picture. We find increasingly enhanced southward wind in the postmidnight sector as the geomagnetic activity level increases; this behavior is consistent with previous studies (i.e., Kwak and Richmond, 2007).
The tidal decomposition results show some insights into the vertical variations of different components of the neutral winds when the geomagnetic activity level increases. First, the diurnal wind amplitude at and above 110 km is more sensitive to the geomagnetic activity, this effect is due to the enhanced plasma convection and is consistent with previous investigation (Nozawa and Brekke, 1995). Second, the meridional diurnal amplitude is more sensitive to geomagnetic activity than the zonal diurnal amplitudes which is likely associated with the enhanced auroral activity. Third, the semidiurnal amplitudes show a decreasing trend below the maximum and an increasing trend above the maximum and the altitude of the peak semidiurnal amplitude increases monotonically when the geomagnetic activity level increases. To our knowledge, this investigation is one of the first E-region wind investigations to show an increase in the semidiurnal tidal amplitude that is correlated with geomagnetic activity level. Finally, the diurnal phases above 110 km show small impacts in the zonal direction from the geomagnetic activity while the semidiurnal phases show negligible impacts from the geomagnetic activity. A last, we notice smaller northward meridional mean below 107.5 km during strong conditions than other conditions. This could be related to the much stronger response of the neutral wind in much larger scale during the extrem conditions. However, further numerical simulation analysis is needed to have more insights on this.
Data availability statement
The original contributions presented in the study are included in the article/Supplementary material, further inquiries can be directed to the corresponding author.
Author contributions
WZ: Conceptualization, Investigation, Methodology, Software, Validation, Visualization, Writing–original draft. SK: Conceptualization, Data curation, Funding acquisition, Methodology, Project administration, Resources, Supervision, Writing–review and editing.
Funding
The author(s) declare financial support was received for the research, authorship, and/or publication of this article. WZ and SK were supported by National Science Foundation AGS–1853408 and AGS–1552269. SK was also supported by Air Force Office of Scientific Research Grant FA9550-19-1-0130 to Clemson University. This material is based upon work supported by the Poker Flat Incoherent Scatter Radar which is a major facility funded by the National Science Foundation through cooperative agreement AGS–1840962 to SRI International.
Acknowledgments
We are grateful for the useful discussion with Dr. Miguel Larsen from the Physics and Astronomy Department at Clemson University.
Conflict of interest
The authors declare that the research was conducted in the absence of any commercial or financial relationships that could be construed as a potential conflict of interest.
Publisher’s note
All claims expressed in this article are solely those of the authors and do not necessarily represent those of their affiliated organizations, or those of the publisher, the editors and the reviewers. Any product that may be evaluated in this article, or claim that may be made by its manufacturer, is not guaranteed or endorsed by the publisher.
References
Azeem, S. M. I., and Johnson, R. M. (1997). Lower thermospheric neutral winds at Søndre Strømfjord: a seasonal analysis. J. Geophys. Res. Sp. Phys. 102, 7379–7397. doi:10.1029/97JA00226
Brekke, A., Doupnik, J. R., and Banks, P. M. (1973). A preliminary study of the neutral wind in the auroral E region. J. Geophys. Res. 78, 8235–8250. doi:10.1029/ja078i034p08235
Brekke, A., Nozawa, S., and Sparr, T. (1994). Studies of the E region neutral wind in the quiet auroral ionosphere. J. Geophys. Res. 99, 8801–8825. doi:10.1029/93JA03232
Cai, L., Aikio, A. T., and Nygrén, T. (2013). Height-dependent energy exchange rates in the high-latitude e region ionosphere. J. Geophys. Res. Sp. Phys. 118, 7369–7383. doi:10.1002/2013JA019195
Dhadly, M. S., Emmert, J. T., Drob, D. P., Conde, M. G., Doornbos, E., Shepherd, G. G., et al. (2018). Seasonal dependence of geomagnetic active-time northern high-latitude upper thermospheric winds. J. Geophys. Res. Sp. Phys. 123, 739–754. doi:10.1002/2017JA024715
Farley, D. T. (1959). A theory of electrostatic fields in a horizontally stratified ionosphere subject to a vertical magnetic field. J. Geophys. Res. 64, 1225–1233. doi:10.1029/JZ064i009p01225
Fesen, C. G. (1997). Geomagnetic activity effects on thermospheric tides: a compendium of theoretical predictions. J. Atmos. Solar-Terrestrial Phys. 59, 785–803. doi:10.1016/S1364-6826(96)00106-X
Fesen, C. G., Richmond, A. D., and Roble, R. G. (1993). Theoretical effects of geomagnetic activity on thermospheric tides. J. Geophys. Res. Space Phys. 98, 15599–15612. doi:10.1029/93JA01188
Forget, B., Cerisier, J.-C., Berthelier, A., and Berthelier, J.-J. (1991). Ionospheric closure of small-scale birkeland currents. J. Geophys. Res. Space Phys. 96, 1843–1847. doi:10.1029/90JA02376
Fuller-Rowell, T. J. (1984). A two-dimensional, high-resolution, nested-grid model of the thermosphere: 1. Neutral response to an electric field “spike”. J. Geophys. Res. 89, 2971–2990. doi:10.1029/JA089iA05p02971
Fuller-Rowell, T. J., Codrescu, M. V., Moffett, R. J., and Quegan, S. (1994). Response of the thermosphere and ionosphere to geomagnetic storms. J. Geophys. Res. Space Phys. 99, 3893–3914. doi:10.1029/93JA02015
Fuller-Rowell, T. J., and Rees, D. (1981). A three-dimensional, time-dependent simulation of the global dynamical response of the thermosphere to a geomagnetic substorm. J. Atmos. Terr. Phys. 43, 701–721. doi:10.1016/0021-9169(81)90142-2
Fuller-Rowell, T. J. (1995). “The dynamics of the lower thermosphere,” in The upper mesosphere and lower thermosphere: a review of experiment and theory (Washington, D. C: American Geophysical Union), 23–36. doi:10.1029/GM087p0023
Gundlach, J. P., Larsen, M. F., and Mikkelsen, I. S. (1988). A simple model describing the nonlinear dynamics of the dusk/dawn asymmetry in the high-latitude thermospheric flow. Geophys. Res. Lett. 15, 307–310. doi:10.1029/GL015i004p00307
Günzkofer, F., Pokhotelov, D., Stober, G., Liu, H., Liu, H.-L., Mitchell, N. J., et al. (2022). Determining the origin of tidal oscillations in the ionospheric transition region with eiscat radar and global simulation data. J. Geophys. Res. Space Phys. 127, e2022JA030861. doi:10.1029/2022JA030861
Hays, P. B., Killeen, T. L., Spencer, N. W., Wharton, L. E., Roble, R. G., Emery, B. A., et al. (1984). Observations of the dynamics of the polar thermosphere. J. Geophys. Res. 89, 5597–5612. doi:10.1029/JA089iA07p05597
Heinselman, C. J., and Nicolls, M. J. (2008). A bayesian approach to electric field and E -region neutral wind estimation with the poker flat advanced modular incoherent scatter radar. Radio Sci. 43, RS5013. doi:10.1029/2007RS003805
Johnson, R., Wickwar, V., Roble, R., and Luhmann, J. (1987). Lower-Thermospheric winds at high latitude. Ann. Geophys. 5A, 383–404.
Kwak, Y.-S., and Richmond, A. D. (2007). An analysis of the momentum forcing in the high-latitude lower thermosphere. J. Geophys. Res. Sp. Phys. 112, A01306. doi:10.1029/2006JA011910
Kwak, Y.-S., and Richmond, A. D. (2014). Dependence of the high-latitude lower thermospheric wind vertical vorticity and horizontal divergence on the interplanetary magnetic field. J. Geophys. Res. Sp. Phys. 119, 1356–1368. doi:10.1002/2013JA019589
Kwak, Y. S., Richmond, A. D., and Roble, R. G. (2007). Dependence of the high-latitude lower thermospheric momentum forcing on the interplanetary magnetic field. J. Geophys. Res. Sp. Phys. 112, 1–13. doi:10.1029/2006JA012208
Larsen, M. F., Christensen, A. B., and Odom, C. D. (1997). Observations of unstable atmospheric shear layers in the lower E region in the post-midnight auroral oval. Geophys. Res. Lett. 24, 1915–1918. doi:10.1029/97GL01942
Larsen, M. F., and Mikkelsen, I. S. (1983). The dynamic response of the high-latitude thermosphere and geostrophic adjustment. J. Geophys. Res. 88, 3158–3168. doi:10.1029/JA088iA04p03158
Larsen, M. F., Pfaff, R. F., Mesquita, R., and Kaeppler, S. R. (2022). Gradient winds and neutral flow dawn-dusk asymmetry in the auroral oval during geomagnetically disturbed conditions. J. Geophys. Res. Space Phys. 127, e2021JA029936. doi:10.1029/2021JA029936
Larsen, M. F., and Walterscheid, R. L. (1995). Modified geostrophy in the thermosphere. J. Geophys. Res. 100, 17321–17329. doi:10.1029/95JA00137
Larsen, M. F. (2002). Winds and shears in the mesosphere and lower thermosphere: results from four decades of chemical release wind measurements. J. Geophys. Res. Sp. Phys. 107, SIA 28-1–SIA 28–14. doi:10.1029/2001JA000218
Mikkelsen, I. S., and Larsen, M. F. (1991). A numerical modeling study of the interaction between the tides and the circulation forced by high-latitude plasma convection. J. Geophys. Res. Sp. Phys. 96, 1203–1213. doi:10.1029/90JA01869
Milan, S. E., and Grocott, A. (2021). “High latitude ionospheric convection,” in Ionosphere dynamics and applications (Washington, D. C: American Geophysical Union), 21–47. chap. 2. doi:10.1002/9781119815617.ch2
Müller-Wodarg, I., Aylward, A., and Fuller-Rowell, T. (2001). Tidal oscillations in the thermosphere: a theoretical investigation of their sources. J. Atmos. Solar-Terrestrial Phys. 63, 899–914. doi:10.1016/S1364-6826(00)00202-9
Nozawa, S., Brekke, A., Maeda, S., Aso, T., Hall, C. M., Ogawa, Y., et al. (2005). Mean winds, tides, and quasi-2 day wave in the polar lower thermosphere observed in european incoherent scatter (eiscat) 8 day run data in november 2003. J. Geophys. Res. Space Phys. 110, A12309. doi:10.1029/2005JA011128
Nozawa, S., and Brekke, A. (1999a). Seasonal variation of the auroral E-region neutral wind for different solar activities. J. Atmos. Solar-Terrestrial Phys. 61, 585–605. doi:10.1016/S1364-6826(99)00016-4
Nozawa, S., and Brekke, A. (1999b). Studies of the auroral E region neutral wind through a solar cycle: quiet days. J. Geophys. Res. Sp. Phys. 104, 45–66. doi:10.1029/1998ja900013
Nozawa, S., and Brekke, A. (1995). Studies of the E region neutral wind in the disturbed auroral ionosphere. J. Geophys. Res. 100, 14717–14734. doi:10.1029/95JA00676
Oyama, S., Aikio, A., Sakanoi, T., Hosokawa, K., Vanhamäki, H., Cai, L., et al. (2023b). Geomagnetic activity dependence and dawn-dusk asymmetry of thermospheric winds from 9-year measurements with a fabry–perot interferometer in tromsø, Norway. Earth, Planets Space 75, 70. doi:10.1186/s40623-023-01829-0
Oyama, S., Hosokawa, K., Vanhamäki, H., Aikio, A., Sakanoi, T., Cai, L., et al. (2023a). Imf dependence of midnight bifurcation in the thermospheric wind at an auroral latitude based on nine winter measurements in tromsø, Norway. Geophys. Res. Lett. 50, e2023GL104334. doi:10.1029/2023GL104334
Parish, H. F., and Lyons, L. R. (2006). Sensitivity studies of the e region neutral response to the postmidnight diffuse aurora. Ann. Geophys. 24, 1551–1565. doi:10.5194/angeo-24-1551-2006
Picone, J. M., Hedin, A. E., Drob, D. P., and Aikin, A. C. (2002). NRLMSISE-00 empirical model of the atmosphere: statistical comparisons and scientific issues. J. Geophys. Res. Sp. Phys. 107, SIA 15-1–SIA 15-16. doi:10.1029/2002JA009430
Richmond, A. D. (2017). Handbook of atmospheric electrodynamics (1995). Boca Raton: CRC Press. doi:10.1201/9780203713297
Richmond, A. D., Lathuillère, C., and Vennerstroem, S. (2003). Winds in the high-latitude lower thermosphere: dependence on the interplanetary magnetic field. J. Geophys. Res. Sp. Phys. 108, 1–14. doi:10.1029/2002JA009493
Richmond, A. D., and Thayer, J. P. (2000). Ionospheric electrodynamics: a tutorial. Geophys. Monogr. Ser. 118, 131–146. doi:10.1029/GM118p0131
Schunk, R., and Nagy, A. (2009). Ionospheres. Cambridge: Cambridge University Press. doi:10.1017/CBO9780511635342
Tarantola, A. (2005). Inverse problem theory and methods for model parameter estimation. Philadelphia: Society for Industrial and Applied Mathematics. doi:10.1137/1.9780898717921
Thayer, J. P., and Killeen, T. L. (1993). A kinematic analysis of the high-latitude thermospheric neutral circulation pattern. J. Geophys. Res. 98, 11549–11565. doi:10.1029/93JA00629
Thayer, J. P., and Semeter, J. (2004). The convergence of magnetospheric energy flux in the polar atmosphere. J. Atmos. Solar-Terrestrial Phys. 66, 807–824. doi:10.1016/j.jastp.2004.01.035
Tsuda, T. T., Nozawa, S., Brekke, A., Ogawa, Y., Motoba, T., Roble, R., et al. (2007). An ion drag contribution to the lower thermospheric wind in the summer polar region. J. Geophys. Res. Sp. Phys. 112, A06319. doi:10.1029/2006JA011785
Vickrey, J. F., Vondrak, R. R., and Matthews, S. J. (1982). Energy deposition by precipitating particles and joule dissipation in the auroral ionosphere. J. Geophys. Res. Space Phys. 87, 5184–5196. doi:10.1029/JA087iA07p05184
Zhan, W., Kaeppler, S. R., Larsen, M. F., Reimer, A., and Varney, R. (2021a). An investigation of auroral e region energy exchange using poker flat incoherent scatter radar observations during fall equinox conditions. J. Geophys. Res. Space Phys. 126, e2021JA029371. doi:10.1029/2021JA029371
Keywords: auroral E-region, neutral wind, geomagnetic activity, ion drag, tidal decomposition
Citation: Zhan W and Keappler SR (2023) Responses of the wintertime auroral E-region neutral wind to varying levels of geomagnetic activity. Front. Astron. Space Sci. 10:1282724. doi: 10.3389/fspas.2023.1282724
Received: 24 August 2023; Accepted: 06 October 2023;
Published: 23 October 2023.
Edited by:
Shun-Rong Zhang, Massachusetts Institute of Technology, United StatesReviewed by:
Daniel Billett, University of Saskatchewan, CanadaLeslie Lamarche, SRI International, United States
Copyright © 2023 Zhan and Keappler. This is an open-access article distributed under the terms of the Creative Commons Attribution License (CC BY). The use, distribution or reproduction in other forums is permitted, provided the original author(s) and the copyright owner(s) are credited and that the original publication in this journal is cited, in accordance with accepted academic practice. No use, distribution or reproduction is permitted which does not comply with these terms.
*Correspondence: Weijia Zhan, d2VpamlhLnpoYW5AY29sb3JhZG8uZWR1