 J. Joseph
 A. N. Jaynes
 W. S. Kurth
 J. D. Menietti
 J. E. P. Connerney2
- 1Department of Physics and Astronomy, University of Iowa, Iowa City, IA, United States
- 2Goddard Space Flight Center, Greenbelt, MD, United States
- 3Southwest Research Institute, San Antonio, TX, United States
Electron cyclotron harmonic (ECH) waves along with whistler mode waves are suggested to be responsible for causing the persistent diffuse aurora in Jupiter. In this work, for the first time we systematically analyze the ECH waves in the Jovian inner magnetosphere, which was surveyed by Juno during the later orbits (>25). We find that in the Jovian inner magnetosphere, ECH waves occur in two specific regions—one equatorial and the other off-equatorial, just outside the Io torus. Equatorial ECH waves have higher intensity compared to their off-equatorial counterpart. We also notice an overlap between the region of mid-latitude hot injections and the region of off-equatorial ECH wave occurrence. Finally, we show an event to describe the complex nature of ECH wave growth/damping varying with particle density structures of the injection region at mid-latitude.
1 Introduction
Electron cyclotron harmonic (ECH) waves (also known as electron Bernstein mode waves) are banded electrostatic emissions, where the wave power peaks at frequencies between the harmonics of electron cyclotron frequency (
The first observation of ECH waves at Jupiter was recorded during the Voyager flybys (Kurth et al., 1980). Subsequently Galileo observed strong ECH emissions (Menietti et al., 2012) in the low-latitude region of the Jovian middle magnetosphere (r > 10 RJ, where RJ (71,492 km) is the equatorial radius of Jupiter). However, due to the near equatorial nature of Galileo’s orbit, information from higher latitudes in the middle magnetosphere was unavailable. In this study, we use wave and particle data from the Juno satellite, which has larger latitudinal coverage of the Jovian middle magnetosphere (5 < r < 18 RJ).
For the first time our study reveals that, like Saturn, Jupiter has two distinct regions of ECH wave occurrence. We further show that the region of ECH wave occurrence at mid latitudes coincides with the region of hot electron injections reported by Kurth et al. (2023). Finally, we reveal the complex nature of ECH wave growth/extinction using an event with simultaneous wave and particle observations.
2 Instrument
The Waves instrument (Kurth et al., 2017) on board Juno is used in this study to obtain the electric and magnetic field measurements. The front-end of the Waves instrument is comprised of one electric dipole antenna, which is sensitive to electric fields parallel to the y-axis of the satellite, and one magnetic search coil, which is sensitive to magnetic fields parallel to the spacecraft spin (z) axis. Low frequency electric signals (50 Hz–150 kHz) and magnetic signals (50 Hz–20 kHz) are handled by a low frequency receiver (LFR). The LFR consists of three channels - two of them measure electric fields in the frequency ranges of 50 Hz to 20 kHz and 10–150 kHz, and a third one measures magnetic fields in the range of 50 Hz to 20 kHz. Even though the fractional spectral resolution (Δf/f) is approximately constant throughout the range of frequencies, the absolute spectral resolution for the 10–150 kHz channel is substantially less than that of the lower band. Data from the LFR is used for the current study. The Waves instrument also has a high frequency receiver (HFR), which covers the frequency range of 0.1–40 MHz. However, sensitivity of the HFR is not sufficient to be used in this study. Apart from the Waves instrument, we also use measurements from the fluxgate magnetometer, which is included in the MAG instrument (Connerney et al., 2017) for measuring the three axis (x, y, and z) background magnetic field. Particle data from the JADE instrument (McComas et al., 2017), specifically the JADE-E sensors that measure electrons in the energy range of ∼0.001–100 keV, are used to confirm the correlations between ECH waves and the underlying electron density structure.
Ephemeris information, including the M-shell, MLat and MLT are calculated with 1 minute time resolution by mapping the spacecraft position on the JRM-33 dipole magnetic field model (Connerney et al., 2021) with the magnetodisc model (Connerney et al., 2020).
We encounter several orbit/instrument limitations, which are listed below, for the current study of ECH waves in Jupiter’s middle magnetosphere.
1. While our study includes data from Orbit 1 onward, due to precession of the orbital trajectory, only during later orbits (>25), does Juno spend substantial time in the equatorial regions of the middle magnetosphere ( <18).
2. Juno did not sample the equatorial region of the middle magnetosphere during day magnetic local times (MLT).
3. Due to the high magnetic field strength of Jupiter, the electron cyclotron frequency (
4. Due to the lack of 3-axis measurements of the electric and the magnetic vectors, complete wave propagation parameters cannot be determined.
5. Due to high levels of penetrating radiation, limited particle data is available in some regions of the magnetosphere.
3 Observations
Juno Waves data from PJ1 (2016-08-25) to PJ45 (2022-10-02) were used in this study to examine the occurrence of ECH waves in the middle magnetosphere (M < 18) of Jupiter. ECH waves are primarily characterized by bands of raised intensity in E-field between harmonics of fce. Ideally E/cB also needs to be evaluated to verify the electrostatic nature of these waves. Full characterization of the propagation characteristics of the waves could provide additional confirmation. However, with the limitation of instrumentation on Juno, validation of all of the above criteria for identifying ECH waves is not possible. The problem becomes evident near the planet due to the increase in background magnetic field, which results in large fce. Since ECH waves are related to harmonics of fce, measurement of E and B fields at high frequencies are needed. Even though B field measurements may seem unnecessary for identification of ECH waves, any presence of B field would disqualify the emission as ECH waves. The Waves instrument on Juno has reasonable electric and magnetic field measurements up to 20 kHz, beyond which the E-field is measured at a lower resolution and no B-field data are available. So, to cope with these limitations, we mainly rely on the identification of the banded structure in the E-field intensity. Juno Waves instrument records power spectral densities (PSDs) of electric and magnetic fields at incremental frequency intervals (Δf), where Δf/f is approximately constant. Using these values, our algorithm first calculates the PSDs between harmonics of fce, which is determined from the measurement of the background B field (FGM instrument). Then the algorithm identifies events, where the first band (3/2) PSD is greater than 30 times the background PSD and the second band (5/2) PSD is greater than 5 times the background PSD. We do not track higher harmonics (>5/2) in this study, nor the lone occurrence of the 3/2 band. The in-band PSDs are calculated by integrating the PSDs from n*fce to (n+1)*fce, where n = 1 for the first band and n = 2 for the second band, and dividing by the number of frequency bins (Δf) present in the interval (n*fce - (n+1)*fce). Due to variation in background noise, background PSDs are separately evaluated for the two bands for each event from the PSDs at the lower boundary of the band, i.e., at fce and 2fce for the 3/2 and the 5/2 band respectively. Even though the primary process deals with the PSDs of electric field, a similar auxiliary process is executed for PSDs of the magnetic field, too. For frequencies below 20 kHz, the auxiliary process verifies the absence of concurrent magnetic field components. But above 20 kHz, we rely solely on the electric field measurements. An event is registered when within the duration of a minute the PSD of electric field of the 3/2 band is greater than 30 times the background PSD with no corresponding magnetic field and the PSD of electric field of the 5/2 band is greater than 5 times the background PSD. Multiple short duration ECH wave occurrences within a minute are treated as single event. We likely have omitted some ECH occurrences in the vicinity of the planet, where 3/2 or 5/2 band falls above 150 kHz. It is to be noted that the HFR instrument (0.1–40 MHz) is unsuitable for this study due to low frequency resolution and poor sensitivity. Stringent thresholds were used by the algorithm to specifically exclude the ECH-like thermal emission (Sentman, 1982) at high latitudes. Regions of ECH waves with moderate PSDs are often seen surrounding the strong events identified by our algorithm. Weak ECH waves do not affect the particle acceleration, hence eliminating them from the catalog is considered acceptable. Figure 1 shows an example of the auto-detected ECH waves.
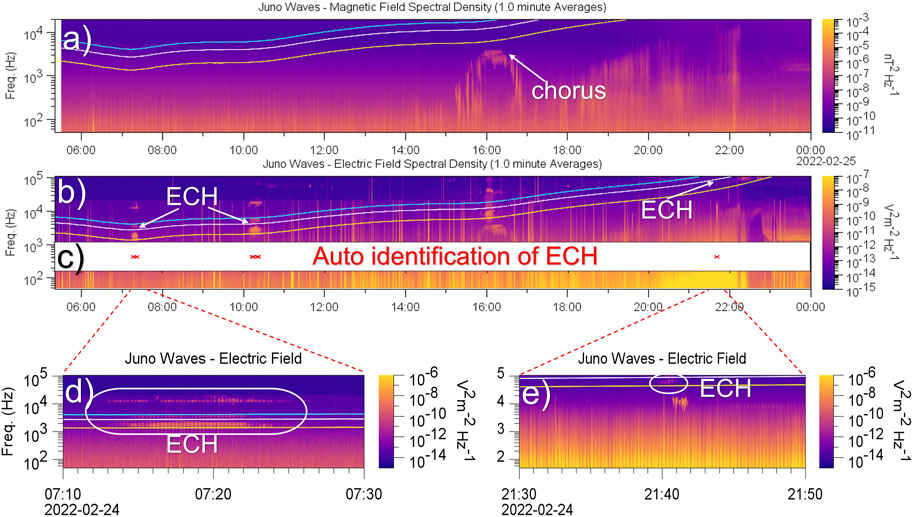
FIGURE 1. An example of algorithmic detection of ECH waves. Panels (A) and (B) show the power spectral densities (PSDs) of the magnetic field and electric field respectively. On Panel (C), the red markers show the regions of ECH waves detected by the algorithm. Panel (C) is overlaid on panel (B) for easy comparison. Panels (D) and (E) are the zoomed in views of two of the ECH wave regions shown in panel (B). Yellow, white, and magenta traces on the plots indicate values of fce, 2fce, and 3fce respectively.
The occurrence of ECH waves is sorted in magnetic coordinates (M, MLat) according to the JRM33 magnetic field model (Connerney et al., 2021) and the magnetodisc model (Connerney et al., 2020). Identified ECH waves are shown in Figure 2A along with the time spent by Juno at each location (Figure 2B) in the M-MLat plane. The bin resolution used is 0.18 × 3° in M-MLat directions. From Figure 2A, two distinct clusters of ECH wave occurrence are seen—one in the equatorial region and the other at the mid latitude region. Due to the limited (∼6 h) coverage of MLT in the inner magnetosphere by Juno, this study does not include ECH wave analysis in the M-MLT plane.
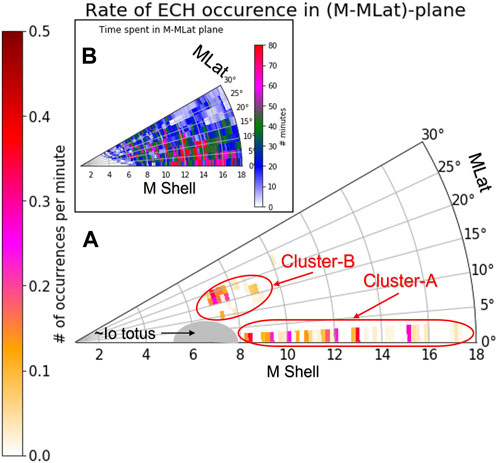
FIGURE 2. Rate of ECH waves occurence in the M-MLat plane. Panel (A) shows the ECH wave occurrence rate per minute. ECH waves are concentrated in two regions indicated by Cluster-A and Cluster-B outside the Io plasma torus, whose approximate cross section is shown. Panel (B) shows the time spent by Juno at each location.
4 Analysis
A complete analysis of waves involves both the magnitude of the wave power and direction of its propagation. Further investigation is possible for each band of the ECH waves.
4.1 Amplitude
In this study, we first examine the relative intensities of the 3/2 and 5/2 ECH bands. Secondly, we map the detailed distribution of PSDs of the 3/2 band in different energy ranges.
Figure 3 shows the average PSDs of electric field for the first two harmonic band (ECH-3/2 and ECH-5/2) in the M-MLat plane. Average PSD of ECH-3/2 in the equatorial region is ∼10−10V2m−2Hz−1 (Figure 3A1). We also have a cluster of mid-latitude ECH-3/2 emissions with PSD of ∼10−12V2m−2Hz−1. ECH-5/2 has substantially weaker PSDs - ∼10−11V2m−2Hz−1 and ∼10−13V2m−2Hz−1 (Figure 3A2) at the equatorial and the mid-latitude regions respectively. To view the relative behavior of ECH-3/2 and ECH-5/2, we segregate the overall observations (Figure 3A) into two subgroups as shown in Figures 3B, C.
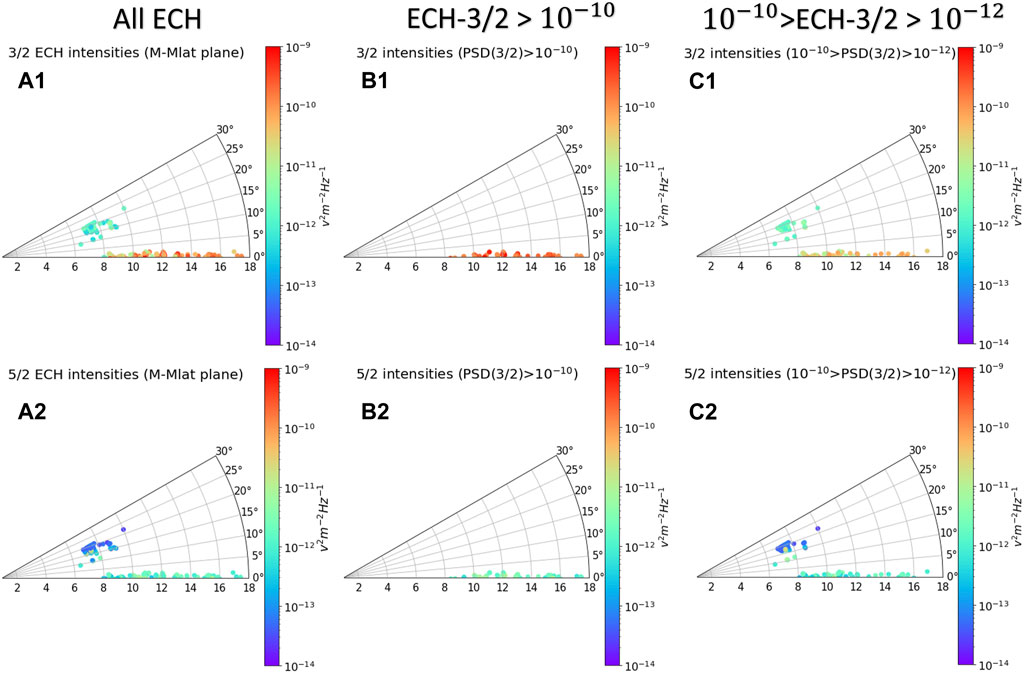
FIGURE 3. Power spectral densities (PSDs) of ECH waves for the first two bands in M-MLat plane. Panels (A1) and (A2) show the PSDs observed in the 3/2 and 5/2 bands respectively. Panels (B1, B2) and (C1, C2) show cases of strong (>10−10) and weak (<10−10) PSDs of ECH-3/2 (ECH-5/2) separately.
We sort the ECH-3/2 PSDs into four different levels in the range of 10−10V2m−2Hz−1 to 10−12V2m−2Hz−1, which is shown in Figures 4A–D. It is evident from Figure 4 that the PSDs of ECH-3/2 are generally higher (
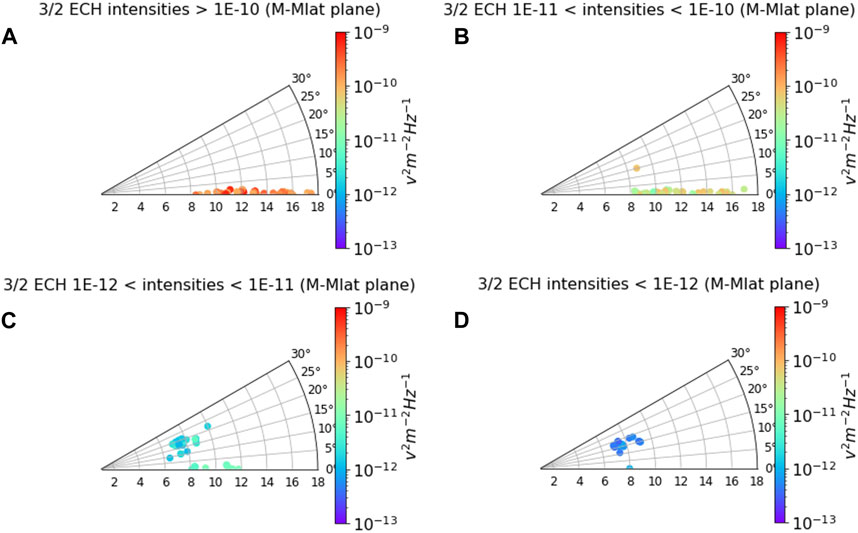
FIGURE 4. Distribution of power spectral density (PSD) of the 3/2-band of ECH waves in M-MLat plane. Panels (A–D) shows ECH wave observed within four specific PSD ranges.
4.2 Polarization
Ideally, the full propagation characteristics should be measured to verify the waves as ECH waves. But, due to the absence of 3-axis electric field measurements on Juno, we resort to an indirect method. Instead, we estimate the polarization of the wave electric field with respect to the background magnetic field. The observed electric field by the Juno-Waves instrument is spin modulated due to the rotation of the electric dipole antenna. When the dipole antenna axis coincides with the orientation of the electric signal oscillation, we record the maximum amplitude. Conversely, a minimum amplitude is observed when the antenna is perpendicular to the electric field. So, if the ECH wave is perpendicularly polarized as expected, the electric field observed should follow the orientation of the dipole as shown in Figures 5A1, A2. We receive minimum electric field, when the dipole is parallel to the Jovian magnetic field (Figures 5A1, B1, A2, B2) confirming a perpendicularly polarized ECH wave. This is an approximate method.
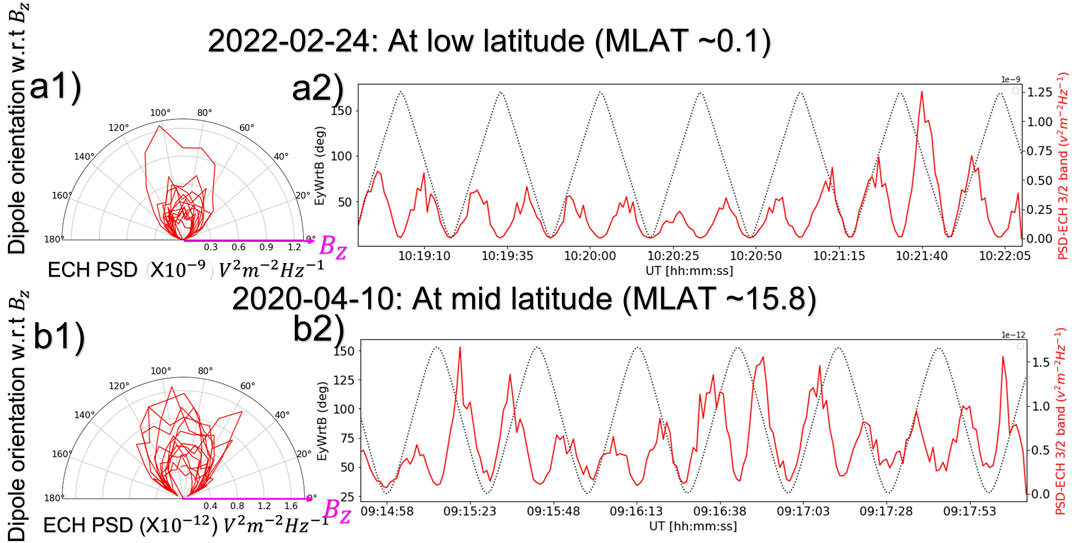
FIGURE 5. Correlation of spin modulated ECH wave PSDs with the dipole antenna orientation. Panels (A1, B1) show the electric power received by the dipole as it rotates w.r.t the background magnetic field at low latitudes and at mid latitudes respectively confirming the perpendicular polarization. Panels (A2, B2) show the cycle-by-cycle variation revealing the fine structures of alignment between the received signal strength and the dipole direction. The black dotted lines show the dipole orientation as the spacecraft spins. The red lines show the corresponding electric power spectral density (PSD) variation. Note that the electric field is maximum for angles near 90° and minimal for angles closest to 0 and 180°.
5 Discussion
This study shows that besides the equatorial region outside the Io torus (cluster-A Figure 2A), ECH waves are seen in the mid latitude region just above the Io torus (cluster-B Figure 2A). At small values of the ratio of the electron plasma frequency to cyclotron frequency
From our analysis, we find that the typical PSDs of mid-latitude ECH waves (
Generation of ECH waves requires a mixture of cold background plasma and hot plasma. For example, planetward convection of hot plasma sheet electrons from the geomagnetic tail into the cold magnetospheric plasma are expected to generate ECH waves (Kennel et al., 1970). ECH waves are seen at the magnetic equator for most Solar System planets with intrinsic magnetic fields including Earth, Jupiter, Saturn, Uranus and Neptune (Kurth et al., 1980; Kurth et al., 1987; Barbosa et al., 1990; Meredith et al., 2009; Long et al., 2021). Manifestation of these ECH waves is attributed to the increased equatorial plasma density and the equatorial injections of hot plasma in the nightside as a consequence of Dungey/Vasyliunas cycle, which is well studied (Mauk et al., 1999; 2005; Burch et al., 2005). So, here we concentrate on the observation of mid-latitude ECH waves in the Jovian magnetosphere. We see a clear correlation between the regions where injections reported by Kurth et al. (2023) are seen and where the mid latitude ECH waves are observed. ECH wave occurrences are shown in Figure 6B, and injection events are shown in Figure 6A. The shaded background in panels a and b of Figure 6 are the regions where
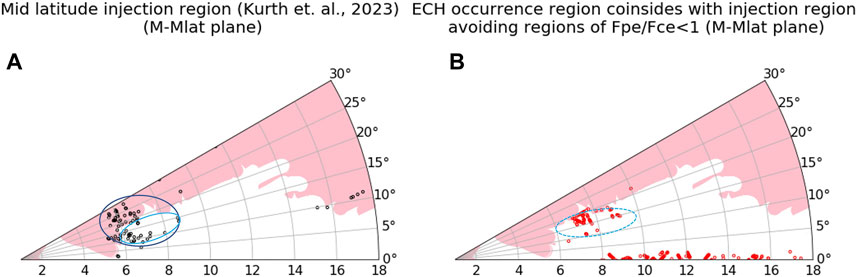
FIGURE 6. Correlations between the injection region and ECH wave occurrence region at mid-latitude in M-MLat plane. Black dots in panel (A) shows the locations of injections. Red dots in panel (B) shows the locations of ECH waves. Pink shaded areas indicate the regions where
Mechanisms that lead to ECH wave intensification in the region of injection may be complex. Generation of ECH waves requires a plasma with two electron populations—a background cold population and a hot population with a loss cone distribution as a free energy source (Ashour-Abdalla and Kennel, 1978a; Horne, 1989; Horne et al., 2003). Parametric studies by Ashour-Abdalla et al. (1979) shows that even though the cold electron density determines the harmonic bands, wave intensification is possible only when the density and temperature ratio between cold and hot electron components are sufficiently small. These conditions are often satisfied in the vicinity of the injection regions and lead to generation and amplification of ECH waves (Zhang and Angelopoulos, 2013). However, excessive modification of the local plasma densities, especially at the fresh injection site may contribute to the extinction of ECH waves. A snapshot of the mid latitude injection region of Jupiter exhibiting such wave-particle behavior is shown in Figure 7. Here, we note that the ECH wave intensifications/extinctions clearly follow the ratio of the cold to hot electron density structures observed by the particle data from JADE in the vicinity of the injection site. A large ratio (>2-5) of cold to hot electron density (
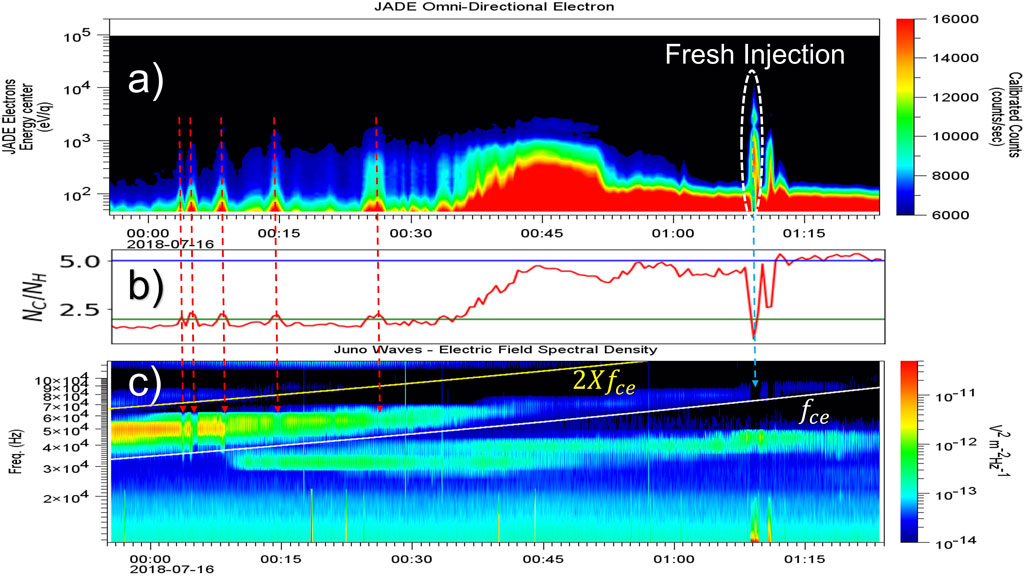
FIGURE 7. An event (PJ-14, 16 July 2018) showing the correlations between the growth/damping of ECH waves and the cold/hot electron density structures in the vicinity of an injection site. Panel (A) shows the electron counts at different energy levels. Panel (B) shows the ratio of calculated hot to cold electron count. Panel (C) shows the electric field power spectral density (PSD). The white and the yellow traces on panel (C) represent the values of fce and 2fce respectively. Red arrows between the panels indicate the regions where sudden changes in cold to hot (Nc/Nh) electron counts resulted in corresponding changes in ECH wave growth. Blue arrow indicates a fresh injection site and the possible disappearance of ECH waves due to lowering of the plasma frequency.
6 Conclusion
Key results of this study are listed below.
1. Two distinct regions of ECH wave occurrence are found in the Jovian inner magnetosphere—one at the equator and the other at mid-latitudes.
2. Power spectral densities of equatorial ECH waves are an order of magnitude higher than those of mid-latitude ECH waves.
3. The region of ECH wave occurrence at mid-latitudes coincides with the mid latitude injection region just outside the Io plasma torus.
4. Evidence of ECH wave growth/damping depending on the hot/cold plasma density structure in the mid-latitude injection region is reported.
Juno sampled the middle magnetosphere of Jupiter during limited span of MLTs. We need wave samples for a larger range of MLTs to characterize the MLT dependence of ECH waves distribution. However, the MLT distribution is expected to be like that of Saturn. Also, the trajectory of Juno did not cover the inner magnetosphere of the southern hemisphere well enough to conduct a statistical analysis, even though this is likely to be similar to that of the northern hemisphere.
Data availability statement
Publicly available datasets were analyzed in this study. This data can be found here: Data for Waves instrument, MAG instrument and JADE instrument onboard Juno is taken from https://pds-ppi.igpp.ucla.edu/. Jovian magnetic field models are available at http://lasp.colorado.edu/home/mop/missions/juno/trajectory-information/.
Author contributions
JJ: Conceptualization, Data curation, Formal Analysis, Investigation, Methodology, Software, Validation, Visualization, Writing–original draft. AJ: Funding acquisition, Project administration, Supervision, Writing–review and editing. WK: Data curation, Funding acquisition, Project administration, Supervision, Writing–review and editing. JM: Methodology, Writing–review and editing. JC: Writing–review and editing. SB: Writing–review and editing.
Funding
The author(s) declare financial support was received for the research, authorship, and/or publication of this article. The research at the University of Iowa is supported by NASA through Contract 699041X with the Southwest Research Institute.
Acknowledgments
JJ acknowledges the use of the Space Physics Data Repository at the University of Iowa supported by the Roy J. Carver Charitable Trust.
Conflict of interest
The authors declare that the research was conducted in the absence of any commercial or financial relationships that could be construed as a potential conflict of interest.
Publisher’s note
All claims expressed in this article are solely those of the authors and do not necessarily represent those of their affiliated organizations, or those of the publisher, the editors and the reviewers. Any product that may be evaluated in this article, or claim that may be made by its manufacturer, is not guaranteed or endorsed by the publisher.
References
Angelopoulos, V., Baumjohann, W., Kennel, C. F., Coronti, F. V., Kivelson, M. G., Pellat, R., et al. (1992). Bursty bulk flows in the inner central plasma sheet. J. Geophys. Res. 97, 4027–4039. doi:10.1029/91JA02701
Ashour-Abdalla, M., Kennel, C. F., and Livesey, W. (1979). A parametric study of electron multiharmonic instabilities in the magnetosphere. J. Geophys. Res. 84 (A11), 6540–6546. doi:10.1029/JA084iA11p06540
Ashour-Abdalla, M., and Kennel, C. F. (1978b). Multi-harmonic electron cyclotron instabilities. Geophys. Res. Lett. 5 (8), 711–714. doi:10.1029/GL005i008p00711
Ashour-Abdalla, M., and Kennel, C. F. (1978a). Nonconvective and convective electron cyclotron harmonic instabilities. J. Geophys. Res. 83 (A4), 1531–1543. doi:10.1029/JA083iA04p01531
Barbosa, D. D., Kurth, W. S., Cairns, I. H., Gurnett, D. A., and Poynter, R. L. (1990). Electrostatic electron and ion cyclotron harmonic waves in Neptune’s magnetosphere. Geophys. Res. Lett. 17, 1657–1660. doi:10.1029/GL017i010p01657
Baumjohann, W. (1993). The near-Earth plasma sheet: an AMPTE/IRM perspective. Space Sci. Rev. 64, 141–163. doi:10.1007/BF00819660
Burch, J. L., Goldstein, J., Hill, T. W., Young, D. T., Crary, F. J., Coates, A. J., et al. (2005). Properties of local plasma injections in Saturn’s magnetosphere. Geophys. Res. Lett. 32, L14S02. doi:10.1029/2005GL022611
Connerney, J. E. P., Benn, M., Bjarno, J. B., Denver, T., Espley, J., Jorgensen, J. L., et al. (2017). The Juno magnetic field investigation. Space Sci. Rev. 213, 39–138. doi:10.1007/s11214-017-0334-z
Connerney, J. E. P., Timmins, S., Herceg, M., and Joergensen, J. L. (2020). A Jovian magnetodisc model for the Juno era. J. Geophys. Res. Space Phys. 125, e2020JA028138. doi:10.1029/2020JA028138
Connerney, J. E. P., Timmins, S., Oliversen, R. J., Espley, J. R., Joergensen, J. L., Kotsiaros, S., et al. (2021). A new model of Jupiter's magnetic field at the completion of Juno's prime mission. J. Geophys. Res. Planets 127 (2), e2021JE007055. doi:10.1029/2021JE007055
Divine, N., and Garrett, H. B. (1983). Charged particle distributions in Jupiter's magnetosphere. J. Geophys. Res. 88, 6889–6903. doi:10.1029/JA088iA09p06889
Gough, M. P., Christiansen, P. J., Martelli, G., and Gershuny, E. J. (1979). Interaction of electrostatic waves with warm electrons at the geomagnetic equator. Nature 279, 515–517. doi:10.1038/279515a0
Gurnett, D. A., and Bhattacharjee, A. (2005). Introduction to plasma physics: with space and laboratory applications. Cambridge, UK: Cambridge University Press, 133–134. doi:10.1017/CBO9780511809125
Hill, T. W., Dessler, A. J., and Maher, L. J. (1981). Corotating magnetospheric convection. J. Geophys. Res. 86, 9020–9028. doi:10.1029/JA086iA11p09020
Horne, R. B. (1989). Path-integrated growth of electrostatic waves: the generation of terrestrial myriametric radiation. J. Geophys. Res. 94 (A7), 8895–8909. doi:10.1029/JA094iA07p08895
Horne, R. B., Thorne, R. M., Glauert, S. A., Menietti, J. D., Shprits, Y. Y., and Gurnett, D. A. (2008). Gyro-resonant electron acceleration at Jupiter. Nat. Phys. 4 (4), 301–304. doi:10.1038/nphys897
Horne, R. B., Thorne, R. M., Meredith, N. P., and Anderson, R. R. (2003). Diffuse auroral electron scattering by electron cyclotron harmonic and whistler mode waves during an isolated substorm. J. Geophys. Res. 108 (A7), 1290. doi:10.1029/2002JA009736
Horne, R. B., and Thorne, R. M. (1998). Potential waves for relativistic electron scattering and stochastic acceleration during magnetic storms. Geophys. Res. Lett. 25 (15), 3011–3014. doi:10.1029/98GL01002
Kennel, C. F., and Petschek, H. E. (1966). Limit on stably trapped particle fluxes. J. Geophys. Res. 71, 1–28. doi:10.1029/JZ071i001p00001
Kennel, C. F., Scarf, F. L., Fredricks, R. W., McGehee, J. H., and Coroniti, F. V. (1970). VLF electric field observations in the magnetosphere. J. Geophys. Res. 75 (31), 6136–6152. doi:10.1029/JA075i031p06136
Kurth, W. S., Barbosa, D. D., Gurnett, D. A., and Scarf, F. L. (1980). Electrostatic waves in the Jovian magnetosphere. Geophys. Res. Lett. 7 (1), 57–60. doi:10.1029/GL007i001p00057
Kurth, W. S., Barbosa, D. D., Gurnett, D. A., and Scarf, F. L. (1987). Electrostatic waves in the magnetosphere of Uranus. J. Geophys. Res. 92, 15225–15233. doi:10.1029/JA092iA13p15225
Kurth, W. S., Hospodarsky, G. B., Faden, J. B., Sulaiman, A. H., Mauk, B. H., Clark, G., et al. (2023). “Evidence of fresh injections related to the interchange instability in the Io torus,” in Proceedings of Ninth Planetary, Solar, and Heliospheric Radio Emissions Conference, Dublin, September 2022. doi:10.25546/103104
Kurth, W. S., Hospodarsky, G. B., Kirchner, D. L., Mokrzycki, B. T., Averkamp, T. F., Robison, W. T., et al. (2017). The Juno waves investigation. Space Sci. Rev. 213 (1–4), 347–392. doi:10.1007/s11214-017-0396-y
Long, M., Gu, X., Ni, B., Cao, X., Ma, X., and Zhao, Y. (2021). Global distribution of electrostatic electron cyclotron harmonic waves in Saturn's magnetosphere: a survey of over13-year Cassini RPWS observations. J. Geophys. Res. Planets 126, e2020JE006800. doi:10.1029/2020JE006800
Ma, Q., Li, W., Zhang, X.-J., Shen, X.-C., Daly, A., Bortnik, J., et al. (2021). Energetic electron distributions near the magnetic equator in the Jovian plasma sheet and outer radiation belt using Juno observations. Geophys. Res. Lett. 48, e2021GL095833. doi:10.1029/2021GL095833
Mauk, B. H., Saur, J., Mitchell, D. G., Roelof, E. C., Brandt, P. C., Armstrong, T. P., et al. (2005). Energetic particle injections in Saturn’s magnetosphere. Geophys. Res. Lett. 32, L14S05. doi:10.1029/2005GL022485
Mauk, B. H., Williams, D. J., McEntire, R. W., Khurana, K. K., and Roederer, J. G. (1999). Storm-like dynamics of Jupiter's inner and middle magnetosphere. geophys. Res. 104, 22759–22778. doi:10.1029/1999JA900097
McComas, D. J., Alexander, N., Allegrini, F., Bagenal, F., Beebe, C., Clark, G., et al. (2017). The jovian auroral distributions experiment (JADE) on the Juno mission to jupiter. Space Sci. Rev. 213, 547–643. doi:10.1007/s11214-013-9990-9
Menietti, J. D., Averkamp, T. F., Kurth, W. S., Ye, S.-Y., Gurnett, D. A., and Cecconi, B. (2017). Survey of Saturn electrostatic cyclotron harmonic wave intensity. J. Geophys. Res. Space Phys. 122, 8214–8227. doi:10.1002/2017JA023929
Menietti, J. D., Shprits, Y. Y., Horne, R. B., Woodfield, E. E., Hospodarsky, G. B., and Gurnett, D. A. (2012). Chorus, ECH, and Z mode emissions observed at Jupiter and Saturn and possible electron acceleration. J. Geophys. Res. 117, A12214. doi:10.1029/2012JA018187
Meredith, N. P., Horne, R. B., Johnstone, A. D., and Anderson, R. R. (2000). The temporal evolution of electron distributions and associated wave activity following substorm injections in the inner magnetosphere. J. Geophys. Res. 105 (12), 12907–12917. doi:10.1029/2000JA900010
Meredith, N. P., Horne, R. B., Thorne, R. M., and Anderson, R. R. (2009). Survey of upper band chorus and ECH waves: implications for the diffuse aurora. J. Geophys. Res. 114, A07218. doi:10.1029/2009JA014230
Meredith, N. P., Johnstone, A. D., Szita, S., Horne, R. B., and Anderson, R. R. (1999). Pancake” electron distributions in the outer radiation belts. J. Geophys. Res. 104, A12431–A12444. doi:10.1029/1998JA900083
Ni, B., Liang, J., Thorne, R. M., Angelopoulos, V., Horne, R. B., Kubyshkina, M., et al. (2012). Efficient diffuse auroral electron scattering by electrostatic electron cyclotron harmonic waves in the outer magnetosphere: a detailed case study. J. Geophys. Res. 117, A01218. doi:10.1029/2011JA017095
Ni, B., Thorne, R., Liang, J., Angelopoulos, V., Cully, C., Li, W., et al. (2011). Global distribution of electrostatic electron cyclotron harmonic waves observed on THEMIS. Geophys. Res. Lett. 38, L17105. doi:10.1029/2011GL048793
Sentman, D. D. (1982). Thermal fluctuations and the diffuse electrostatic emissions. geophys. Res. 87, 1455–1472. doi:10.1029/JA087iA03p01455
Shaw, R. R., and Gurnett, D. A. (1975). Electrostatic noise bands associated with the electron gyrofrequency and plasma frequency in the outer magnetosphere. J. Geophys. Res. 80 (31), 4259–4271. doi:10.1029/JA080i031p04259
Thorne, R. M. (1983). “Microscopic plasma processes in the Jovian magnetosphere,” in Physics of the jovian magnetosphere. Editor A. J. Dessler (Cambridge, U. K: Cambridge Univ. Press), 454–488. doi:10.1017/CBO9780511564574.014
Zhang, X.-J., Angelopoulos, V., Ni, B., Thorne, R. M., and Horne, R. B. (2013). Quasi-steady, marginally unstable electron cyclotron harmonic wave amplitudes. J. Geophys. Res. Space Phys. 118, 3165–3172. doi:10.1002/jgra.50319
Zhang, X., Angelopoulos, V., Ni, B., and Thorne, R. M. (2015). Predominance of ECH wave contribution to diffuse aurora in Earth’s outer magnetosphere. J. Geophys. Res. Space Phys. 120, 295–309. doi:10.1002/2014JA020455
Keywords: electron cyclotron harmonic waves, electron injection, wave-particle interaction, spin modulation, Jovian magnetosphere
Citation: Joseph J, Jaynes AN, Kurth WS, Menietti JD, Connerney JEP and Bolton SJ (2023) Electron cyclotron harmonic waves in Jovian magnetosphere as seen by Juno. Front. Astron. Space Sci. 10:1274760. doi: 10.3389/fspas.2023.1274760
Received: 08 August 2023; Accepted: 09 October 2023;
Published: 07 November 2023.
Edited by:
Rudolf A. Treumann, Ludwig Maximilian University of Munich, GermanyCopyright © 2023 Joseph, Jaynes, Kurth, Menietti, Connerney and Bolton. This is an open-access article distributed under the terms of the Creative Commons Attribution License (CC BY). The use, distribution or reproduction in other forums is permitted, provided the original author(s) and the copyright owner(s) are credited and that the original publication in this journal is cited, in accordance with accepted academic practice. No use, distribution or reproduction is permitted which does not comply with these terms.
*Correspondence: J. Joseph, amF5YXNyaS1qb3NlcGhAdWlvd2EuZWR1