
94% of researchers rate our articles as excellent or good
Learn more about the work of our research integrity team to safeguard the quality of each article we publish.
Find out more
ORIGINAL RESEARCH article
Front. Astron. Space Sci., 04 October 2023
Sec. Space Physics
Volume 10 - 2023 | https://doi.org/10.3389/fspas.2023.1254243
This article is part of the Research TopicAdvances In Mesosphere And Thermosphere DynamicsView all 5 articles
 Qiang Zhang1
 De-Sheng Han1*
 Shang-Chun Teng1Zhi-Wei Wang1
 Q.-H. Zhang2Zan-Yang Xing2Yong Wang2Yu-Zhang Ma2
The ion upflow associated with the subauroral ion drift (SAID) is a crucial component in the exchange of particles between the ionosphere and the ring currents. The ion upflow associated with the double-peak subauroral ion drift (DSAID), which is a subclass of the SAID, is more complex compared to SAID. In this study, we conducted a statistical analysis of the ion upflow associated with DSAID using Defense Meteorological Satellite Program (DMSP) F16–F18 data spanning 11 years (2010–2020) in the Northern Hemisphere. Our findings revealed that ion upflow associated with DSAID can exhibit either a double-peak or a one-peak upflow. The statistical characteristics of these two types of events displayed significant differences. In DSAID with a double-peak upflow event, the velocity of DSAID around the high-latitude peak was greater than that around the low-latitude peak. However, in DSAID with a one-peak upflow event, the DSAID velocities around the two peaks were very similar. Based on the formation mechanism of DSAID and the process of frictional heating in the ionosphere, we proposed that the formation of DSAID with a double-peak upflow and DSAID with a one-peak upflow are likely related to the formation process of DSAID.
Subauroral polarization streams (SAPS) are a phenomenon that occurs during periods of disturbed magnetic activity, such as geomagnetic storms and substorms. These streams are characterized by the presence of a large and strong westward ion flow in the ionospheric subauroral region from post-noon to the midnight side and even the predawn side (Spiro et al., 1979; Anderson et al., 1993; Karlsson et al., 1998; Foster and Burke, 2002; Foster and Vo, 2002; Oksavik et al., 2006; Clausen et al., 2012; Lin et al., 2019). SAPS comprise subauroral ion drifts/polarization jets (SAIDs/PJs) (Galperin et al., 1974; Spiro et al., 1979; Anderson et al., 1993) and westward flows in the broad subauroral region (Yeh et al., 1991). SAID is a localized westward ion flow with high speed exceeding 1 km/s and a latitudinal width of 1°–2° (Anderson et al., 1993; Karlsson et al., 1998; Anderson et al., 2001; He et al., 2014; He et al., 2016). The formation mechanism of SAPS/SAID is still a matter of debate. The current generator model reveals that after the polarization electron field is induced by R2 field-aligned currents (FACs) flowing into the subauroral region with low conductance (the ionospheric plasma trough), the E × B drift of ions occurs in that region with velocities of several thousand meters per second under a series of physical and chemical processes. This phenomenon is responsible for the development of SAPS/SAID (Schunk et al., 1976; Anderson et al., 1993; Anderson et al., 2001). However, SAPS and SAID exhibit distinct physical characteristics, and the current generator model is insufficient in describing their fast time appearance. SAID is generated within the plasmapause region through the short-circuiting of earthbound mesoscale plasma flows from the reconnection region by the cold plasma. This process creates a fast time voltage generator in the plasmasphere (Mishin and Puhl-Quinn, 2007; Mishin, 2013; Mishin et al., 2017). During periods of heightened magnetic disturbance, an infrequent velocity structure, known as the double-peak subauroral ion drift (DSAID), emerges (e.g., He et al., 2016; Horvath and Lovell, 2017). DSAID is a subclass of the typical SAID and is characterized by the presence of two velocity peaks in the subauroral region. This structure was first reported by He et al. (2016). They proposed that DSAID occurs when double-layer R2 FACs develop two or more closed circuits in the subauroral region. Wei et al. (2019) suggested that DSAID could also be associated with double-layer gaps of Pedersen conductance without double-layer FACs. Furthermore, observations and simulations have revealed that double-peak pressure gradients resulting from a ring current injection lead to a complex configuration of field-aligned currents, which induces the formation of two closed circuits and, thus, contributes to the development of DSAIDs (Wei et al., 2019). Nevertheless, in a short-circuit model, the formation of multiple peaks in SAID is attributed to the combined effect of multiple injections with the motion of the plasmapause: inward/equatorward during the growth phase, and substorm expansion and outward/poleward during the recovery phase (e.g., Mishin, 2023). In addition to DSAID, the morphological characteristics of SAPS velocity structures also include abnormal subauroral ion drifts (ASAIDs) (an eastward flow with the velocity peak exceeding 1,000 m/s) (e.g., Ebihara et al., 2008; Voiculescu and Roth, 2008; Liléo et al., 2010; Horvath and Lovell, 2018), as well as complex subauroral flow channel structures (double-peak ion drifts where one of the ion drift is eastward) (Horvath and Lovell, 2021), among others.
During the magnetosphere–ionosphere coupling process, a series of plasma irregularities, such as storm-enhanced density (SED), tongue of the ionosphere (TOI), and polar cap patches, appear, accompanied by convection cells in the polar ionosphere (e.g., Foster and Burke, 2002; Foster et al., 2005; Zhang et al., 2011; Zhang et al., 2013). These plasma irregularities are often accompanied by an ion upflow (e.g., Yuan et al., 2008; Zhang et al., 2016; Zhang et al., 2017; Zou et al., 2017; Ma et al., 2018). Similarly, the ion upflow associated with SAID is also a common phenomenon during these events. The study of the ion upflow is a crucial aspect in understanding the particle exchange during magnetosphere–ionosphere coupling. The mechanism behind the ion upflow can be broadly divided into two types. The first type is frictional heating caused by collisions between ions and neutral particles. Frictional heating increases the ion temperature and the pressure gradient, resulting in the ion upflow. The second mechanism is soft electron precipitation. Under the force of ambipolar electron fields, triggered by soft electron precipitation, the ions move upward (Wahlund et al., 1992; Arnoldy et al., 1996; Coley et al., 2003).
Numerous studies have been conducted on the ion upflow associated with SAID (e.g., Buonsanto et al., 1992; Heelis et al., 1993; Erickson et al., 2010; Wang and Lühr, 2013; Zhang et al., 2017; Zhang et al., 2020). Case studies have revealed the parameter characteristics of the ion upflow during SAPS periods, including the ion and electron temperature, plasma density, and velocity. Statistical studies have presented the distribution of the ion upflow on large temporal and spatial scales, including the distribution of the ion upflow with the season and different AE, and Kp indices. However, previous studies have mainly focused on SAID events, with few studies concerning the ion upflow being associated with the subclass of SAID, such as DSAID. In this paper, we presented a statistical study of the fine structures of the ion upflow associated with DSAID. We found that DSAID can correspond to both the double-peak and one-peak upflow events, and the distributions of these two types of events are significantly different. Additionally, we discussed the possible formation processes of the two types of DSAID upflows.
DMSP (Defense Meteorological Satellite Program) satellites are well-suited for the statistical study of the ion upflow associated with SAID. The Special Sensor for Ions, Electrons, and Scintillation (SSIES), the Special Sensor for precipitating particles (SSJ-4), and the Special Sensor Magnetometer (SSM) provide plasma and magnetic field data (Hardy et al., 1984; Rich et al., 1985; Greenspan et al., 1986). Based on DMSP F16–F18 data in the Northern Hemisphere from 2010 to 2020, we selected 342 cases of SAID with the ion upflow, 70 cases of DSAID with a double-peak upflow, and 22 cases of DSAID with a one-peak upflow. We identified cases of interest based on the definition of SAID/DSAID. The latitude width of SAID is less than 2°, and the velocity peak is greater than or equal to 1,000 m/s. For DSAID, at least one velocity peak is greater than or equal to 1,000 m/s, and the other peak is greater than or equal to 500 m/s. The width of each velocity peak of DSAID is less than 2°. The widths of SAID/DSAID were defined as the full-width half maximum (FWHM) of the velocity. Cases with the field-aligned velocity exceeding 100 m/s (including 100 m/s) were identified as upflow cases (Ogawa et al., 2009; Ma et al., 2020).
Figure 1 provides an overview of the parameters for SAID (Figure 1A), DSAID with a double-peak upflow (Figure 1B), and DSAID with a one-peak upflow (Figure 1C). From the top to bottom, the parameters include the electron and ion temperature, O+ ion and electron density, cross-track horizontal velocity (DSAID/SAID velocity), field-aligned velocity (upward velocity is positive), and electron and ion energy flux. The field-aligned velocity is calculated by projecting the upward velocity and cross-track horizontal velocity along the magnetic field line. The ranges of FWHM of the DSAID/SAID velocity are marked by the gray frame. The equatorward boundary of the auroral oval is marked by the dotted line in each panel. Figure 1A illustrates the SAID velocity peak, which corresponds to a single upflow velocity peak and an enhancement in the ion temperature. Figure 1B exhibits two velocity peaks of DSAID, both exceeding 1 km/s, and two upflow velocity peaks exceeding 500 m/s. These DSAID velocity peaks and the upflow velocity peaks have a one-to-one correspondence. Additionally, only the high-latitude velocity peak corresponds to an enhancement in the ion temperature. Figure 1C shows two velocity peaks of DSAID but with only one peak of the upflow velocity. The upflow velocity peak is situated between the two peaks of the DSAID velocity. Moreover, there is a tendency for the upflow velocity peak to be closer to the low-latitude SAID peak. In this case, there are no significant variations in the ion temperature.

FIGURE 1. Overview of the parameters of SAID, DSAID with the double-peak upflow, and DSAID with the one-peak upflow. From the top to bottom, the parameters are electron and ion temperature; O+, ion, and electron density; the cross-track horizontal velocity (DSAID/SAID velocity) and field-aligned velocity (upward velocity is positive); and the electron and ion energy flux. The width of DSAID/SAID is defined as the full-width half maximum (FWHM). The ranges of the FWHM are marked by the gray frame. The equatorward boundary of the auroral oval is marked by the dotted line in each panel. (A) SAID event; (B) DSAID with the double-peak upflow event; (C) DSAID with the one-peak upflow event.
Figure 2 illustrates the statistical distributions of the cases of SAID (black), DSAID with the double-peak upflow (blue), and DSAID with the one-peak upflow (red) parameters. The parameters include the DSAID/SAID velocity, field-aligned velocity, O+ number density, O+ upward number flux, and joule heating rate. The distributions were obtained using the superposed epoch method, with a relative magnetic latitude range of −5°–+5°. The average width between the low-latitude velocity peak and the high-latitude velocity peak of DSAID is 1.6°. The parameter distributions of DSAID were normalized, with 0° corresponding to the middle of the width between the two DSAID velocity peaks (valley) and corresponding to the velocity peak in SAID distributions shown by the dotted green lines. Peak 1 represents the low-latitude velocity peak of DSAID, and Peak 2 represents the high-latitude velocity peak of DSAID. The error bars represent the standard deviations.
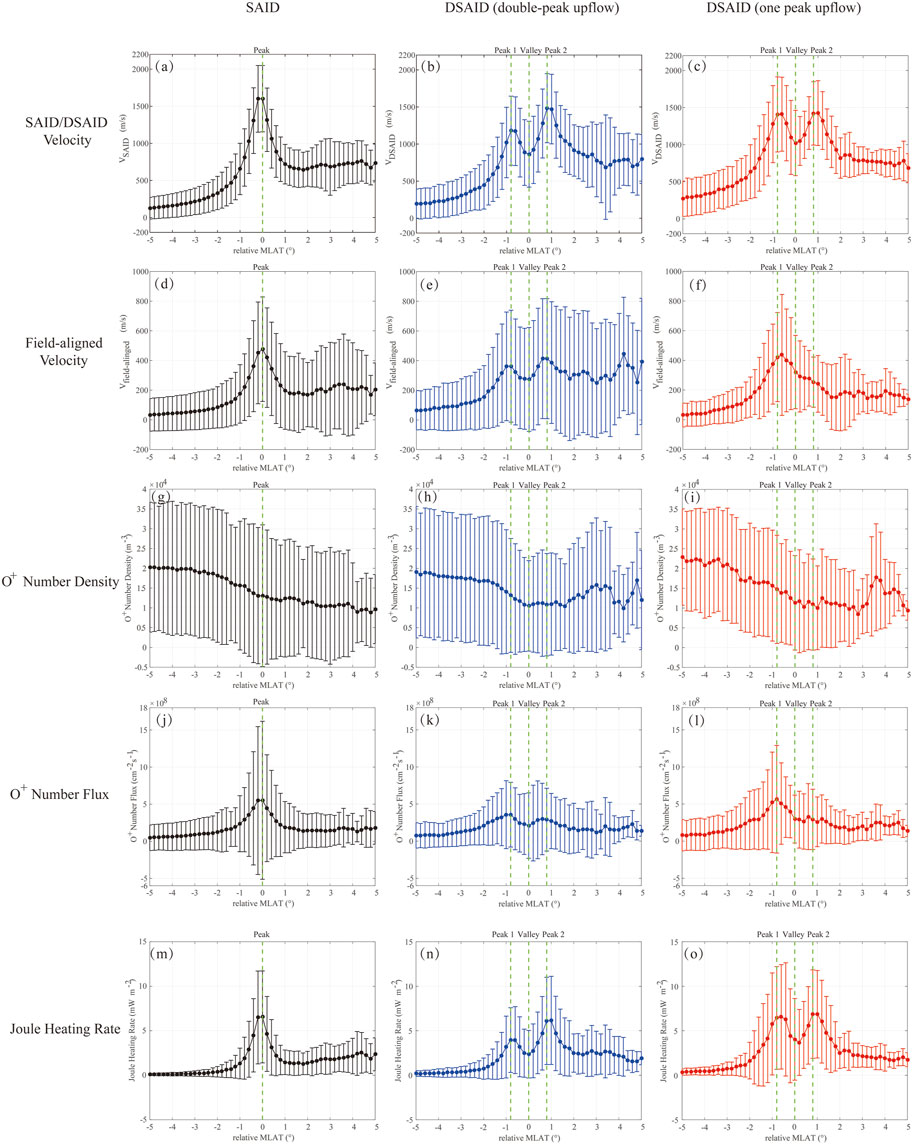
FIGURE 2. Statistical distributions of the parameters of SAID (black), DSAID with the double-peak upflow (blue), and DSAID with the one-peak upflow (red). The parameters are the DSAID/SAID velocity (A–C), field-aligned velocity (D–F), O+ number density (G–I), O+ upward number flux (J–L), and the joule heating rate (M–O). The distributions are the results obtained using the superposed epoch method. The range of relative magnetic latitudes is from −5° to +5°. The average width between the low-latitude velocity peak and the high-latitude velocity peak of DSAID was 1.6°. The parameter distributions of DSAID are normalized. The 0° value corresponds to the middle of the width between the two DSAID velocity peaks (valley) and corresponds to the velocity peak in the distributions of SAID. The dotted green lines represent the SAID velocity peak in the SAID event, two DSAID velocity peaks, and the DSAID velocity valley. Peak 1 represents the low-latitude DSAID peak, and Peak 2 represents the high-latitude peak. Error bars represent the standard deviations.
In panels a–c, the two types of DSAID velocities are very similar with the SAID velocity. In panel b, Peak 1 is approximately 300 m/s lower than Peak 2. Conversely, in panel c, Peak 1 is approximately equal to Peak 2. We examined all the cases and observed that in DSAID with the double-peak upflow event, Peak 2 is predominantly larger than Peak 1. However, in DSAID with a one-peak upflow event, Peak 2 is very similar to Peak 1, and in some instances, it is even lower than Peak 1. In panels d–f, we observed that the two types of upflow velocities of DSAID remain similar to those of SAIDs. In panel e, the upflow velocity of Peak 2 is approximately 50 m/s higher than that of Peak 1 (with ∼350 m/s for Peak 1 and ∼400 m/s for Peak 2). In panel f, a single significant upflow peak is observed, which occupies both the regions of Peak 1 and Peak 2. Furthermore, the location of this upflow velocity peak is very close to the location of Peak 1. We also noted a decrease in the upflow velocity around Peak 2. It appears that the upflow velocities around Peak 1 and Peak 2 combine to form a larger upflow velocity peak. In panels g–i, the densities in all three events exhibit a decrease around the peak, which correspond to the ionospheric trough regions. In panels h–i, both types of events show more decreases compared to those of SAID. In panels j–l, all three events exhibit abundant upward fluxes. In panel k, the upward flux around Peak 1 is larger than that around Peak 2, which is opposite to the pattern observed in the upflow velocity in panel e. In panel l, there is an intense upward flux observed around Peak 1, while the value around Peak 2 is only half of that. The distributions of joule heating rates are represented in panels m–o. The joule heating rate is a parameter used to represent the intensity of frictional heating. The joule heating rate in this study was calculated using the same method as the previous studies (Spiro et al., 1982; Foster et al., 1983; Rich et al., 1987). In panel m, there is a notable increase in the joule heating rate around the peak, indicating that frictional heating contributes significantly to the ion upflow associated with SAID. In panels n–o, both types of events show strong increases in the joule heating rate around Peak 1 and Peak 2, suggesting that frictional heating also plays an important role in the ion upflow associated with DSAID. In panel n, the double peak of the joule heating rate corresponds to that of the upflow velocity in panel e. The joule heating rate around Peak 2 is higher than that around Peak 1. However, in panel o, the double peak of the joule heating rate corresponds to only one upflow peak in panel f. Moreover, the joule heating rate around Peak 2 is very similar to that around Peak 1.
In conclusion, the distributions in Figure 2 differ significantly among SAID, DSAID with the double-peak upflow, and DSAID with the one-peak upflow. The main characteristics can be summarized as follows: in DSAID with the double-peak upflow event, the velocity around Peak 2 is higher than that around Peak 1, whereas in DSAID with the one-peak upflow event, the velocity around Peak 2 is similar to that around Peak 1. The location of the one-peak upflow is close to Peak 1, and there is a small velocity decrease around Peak 2 in DSAID with the one-peak upflow event. Frictional heating plays a crucial role in the ion upflow associated with DSAID, and the joule heating rate exhibits similar distribution characteristics to the DSAID velocity. These characteristics indicate that DSAID with the double-peak upflow and DSAID with a one-peak upflow are distinct events that may correspond to different formation mechanisms.
The significant differences in the statistical characteristics indicate that DSAID with the double-peak upflow and DSAID with the one-peak upflow may correspond to different formation processes. To investigate their potential formation mechanisms, it is necessary to understand the formation mechanism of DSAID. Based on the studies by He et al. (2016) and Wei et al. (2019), DSAID is generated by double-layer R2 FACs derived from the plasma-repeated injection. Generally, during a plasma injection in the dusk-side magnetosphere, a single pressure gradient peak is formed. This peak couples with the ionosphere, resulting in the formation of single-layer R2 FACs, which correspond to the formation of SAID. However, during repeated plasma injections, the previously formed single pressure gradient peak of the ring current does not get released to the ionosphere in a timely manner. This leads to the appearance of a second pressure gradient peak at a greater distance from the Earth. This further results in the formation of a double-layer R2 FAC structure, leading to the emergence of a second SAID structure at higher latitudes compared to the original SAID structure. Ultimately, this leads to the formation of the DSAID structure.
We believe that the differences between DSAID with the double-peak upflow and DSAID with one-peak upflow events are likely related to the formation process of DSAID. Figure 3 illustrates the possible formation processes of the two types of events. From the statistical characteristics, we can deduce that the ion upflow caused by DSAID is closely related to frictional heating. Previous studies have shown that the formation of SAID leads to an increase in the ion temperature from the lower ionosphere to the upper ionosphere, indicating that frictional heating in the SAID region is a down–top process (e.g., Liang et al., 2022). When a heating source appears at low altitudes, ions gain upward velocity due to the thermal pressure gradient, resulting in an upward motion. The latest research indicates that the ion Pedersen drift plays a crucial role in the formation process of SAID. The ion Pedersen drift effect leads to the strong depletion of density and conductance in the low ionosphere in the SAID region (Liang et al., 2021). The dissipation caused by the ion Pedersen drift predominantly occurs at lower ionospheric altitudes. Furthermore, the ion Pedersen drift can also induce upward movements of ions (Liang et al., 2022). Under this dissipation process, the surrounding ions around the heating source in the low ionosphere rush in to replenish the loss of ions, leading to a horizontal velocity around the heating source, as shown in Figure 3A. As the high-latitude peak of DSAID begins to form, a second heating source appears at high latitudes, causing new ions to upflow. Due to the proximity of the two DSAID peaks and the presence of the horizontal velocity, ions heated by the high-latitude heating source move upward while simultaneously moving toward the low-latitude heating source, merging with the ion upflow generated by the low-latitude heating source, as shown in Figure 3B. When the heating efficiency of the high-latitude heating source is lower than or comparable to that of the low-latitude heating source (i.e., the two DSAID peaks are similar), the ion upflow generated by the high-latitude heating source is not sufficient to break through the confinement of the low-latitude heating source. Instead, they completely merge into the ion upflow generated by the low-latitude heating source, forming a large-scale single upward peak, as shown in Figure 3C. At this point, the single upflow peak is in close proximity to the low-latitude DSAID peak, and the velocities of the two DSAID peaks are similar, which is consistent with the statistical characteristics. However, when the heating efficiency of the high-latitude heating source is significantly higher than that of the low-latitude heating source (i.e., the high-latitude DSAID peak is much larger than the low-latitude DSAID peak), the ion upflow generated by the high-latitude heating source is sufficiently strong to overcome the confinement of the low-latitude heating source. This results in the formation of a new upflow peak, leading to the presence of two upflow peaks, as shown in Figure 3D. At this point, the high-latitude DSAID peak is much larger than the low-latitude DSAID peak, which is also consistent with the statistical characteristics. Therefore, we propose that the occurrence of double-peak and single-peak upflows with DSAID is closely related to the formation process of DSAID.
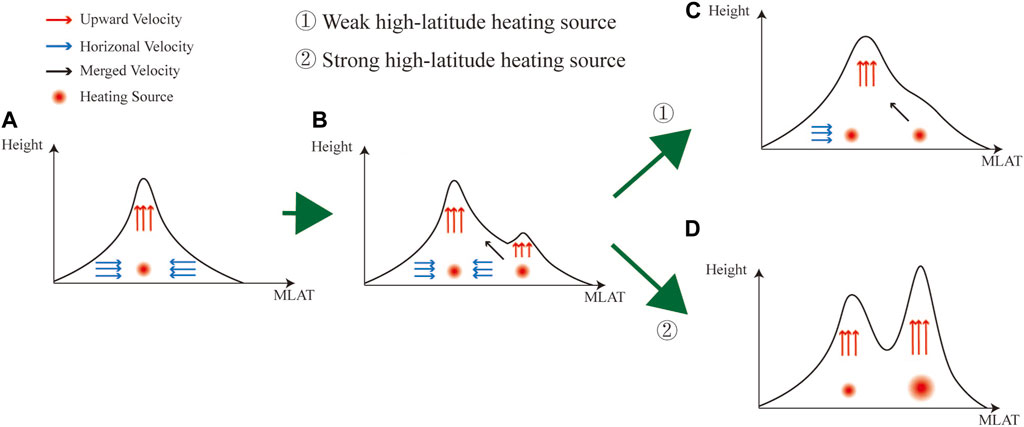
FIGURE 3. Schematic diagram for explaining formation processes of DSAID with the double-peak upflow and DSAID with the one-peak upflow. (A) Ion upflow appeared around the low-latitude peak of DSAID. (B) Ion upflow started to appear around the high-latitude peak of DSAID. (C) DSAID with one-peak upflow. (D) DSAID with double-peak upflow.
To further validate our hypothesis, we present the correlation between SAID/DSAID velocities and upward velocities under different conditions, as illustrated in Figure 4. The black line represents SAID, the red line represents DSAID with the one-peak upflow, the blue line represents the low-latitude peak of DSAID with the double-peak upflow, and the magenta line represents the high-latitude peak of DSAID with the double-peak upflow. Previous studies have indicated that there exists a moderate linear correlation between the SAPS velocity and the upward velocity, with the slope of the linear fit typically ranging from 0.25 to 0.29 (Wang and Lühr, 2013; Zhang et al., 2020). Figure 4 shows that the slopes of the linear fits for the black, red, and blue lines are distributed around this value, which is consistent with the previous statistical results. This suggests that the high-latitude peak of DSAID with the double-peak upflow and DSAID with the one-peak upflow may follow the same factors that influence the upward velocity as SAID. However, in the low-latitude peak of DSAID with the double-peak upflow, the slope of the linear fit is much larger than that in the other conditions, indicating that there are additional factors affecting the ion upflow in the low-latitude peak. Figure 3 shows that the ion upflow from the high-latitude peak supplements the ion upflow from the low-latitude peak, which may correspond to the larger slope of the linear fit for the low-latitude peak of DSAID with the double-peak upflow compared to the other events.
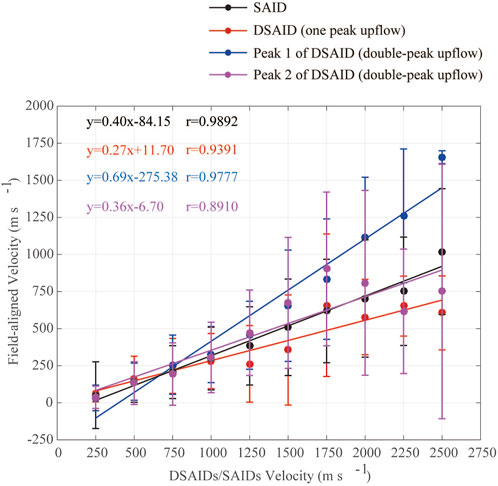
FIGURE 4. Correlation between the DSAID/SAID velocity and the field-aligned velocity in the four scenarios (black for SAID, red for DSAID with the one-peak upflow, blue for Peak 1 of DSAID with the double-peak upflow, and magenta for Peak 2 of DSAID with the double-peak upflow). Error bars represent the standard deviations. The straight lines are linear fitting lines, and the top left corner shows the linear fitting equations.
We conducted a statistical study on the ion upflow related to DSAID using the DMSP F16–F18 data spanning 11 years (2010–2020). Our findings indicate that DSAID can be associated with both the double-peak upflow and one-peak upflow. The statistical analysis of the ion upflow associated with SAID, DSAID with the double-peak upflow, and DSAID with the one-peak upflow revealed distinct and noticeable distribution characteristics. Additionally, we proposed the potential formation processes for events of DSAID with the double-peak upflow and DSAID with the one-peak upflow. The key findings are summarized as follows:
1. The statistical characteristics of DSAID with the double-peak upflow and DSAID with the one-peak upflow are significantly different. In DSAID with the double-peak upflow event, the velocity of DSAID around Peak 2 is higher than that around Peak 1. However, in DSAID with a single-peak upflow event, the velocity of DSAID around Peak 2 is similar to that around Peak 1. Additionally, the location of the one-upflow peak is near Peak 1.
2. Frictional heating also plays an important role in the ion upflow associated with DSAID. The double-peak of the joule heating rate corresponds to only the one-upflow peak in DSAID with the one-peak upflow event.
3. The differences between DSAID with the double-peak upflow and DSAID with the one-peak upflow are likely related to the formation process of DSAID.
Due to the limitations in satellite observations, we were only able to provide preliminary results. The formation processes of DSAID with the double-peak upflow and DSAID with the one-peak upflow remain unclear. Further studies are needed to validate the deductions made. Case studies and model simulations will be conducted in the future.
The original contributions presented in the study are included in the article/Supplementary Material; further inquiries can be directed to the corresponding author.
QZ: writing—original draft, data curation, investigation, methodology, resources, software, and validation. D-SH and S-CT: methodology, supervision, and writing—review and editing. Z-WW, Q-HZ, Z-YX, YW, and Y-ZM: methodology and writing—review and editing.
This work was supported by the National Natural Science Foundation of China (NSFC) grant 42204158, the National Natural Science Foundation of China (42030101), and the Fundamental Research Funds for the Central Universities. This work was also supported by the National Natural Science Foundation of China (42120104003, 42074188, 42204164), the Shandong Provincial Natural Science Foundation (grant ZR2022QD077), and the China Postdoctoral Science Foundation (Grant 2021M701974).
The authors thank NOAA FTP and JHU/APL for making the DMSP data and the F10.7 flux data available.
The authors declare that the research was conducted in the absence of any commercial or financial relationships that could be construed as a potential conflict of interest.
All claims expressed in this article are solely those of the authors and do not necessarily represent those of their affiliated organizations, or those of the publisher, the editors, and the reviewers. Any product that may be evaluated in this article, or claim that may be made by its manufacturer, is not guaranteed or endorsed by the publisher.
Anderson, P. C., Carpenter, D. L., Tsuruda, K., Mukai, T., and Rich, F. J. (2001). Multisatellite observations of rapid subauroral ion drifts (SAID). J. Geophys. Res. 106 (A12), 29585–29599. doi:10.1029/2001JA000128
Anderson, P. C., Hanson, W. B., Heelis, R. A., Craven, J. D., Baker, D. N., and Frank, L. A. (1993). A proposed production model of rapid subauroral ion drifts and their relationship to substorm evolution. J. Geophys. Res. 98 (A4), 6069–6078. doi:10.1029/92JA01975
Arnoldy, R. L., Lynch, K. A., Kintner, P. M., Bonnell, J., Moore, T. E., and Pollock, C. J. (1996). SCIFER-structure of the cleft ion fountain at 1400 km altitude. Geophys. Res. Lett. 23 (14), 1869–1872. doi:10.1029/96GL00475
Buonsanto, M. J., Foster, J. C., and Sipler, D. P. (1992). Observations from millstone hill during the geomagnetic disturbances of march and april 1990. J. Geophys. Res. 97 (A2), 1225–1243. doi:10.1029/91JA02428
Clausen, L. B. N., Baker, J. B. H., Ruohoniemi, J. M., Greenwald, R. A., Thomas, E. G., Shepherd, S. G., et al. (2012). Large-scale observations of a subauroral polarization stream by midlatitude superDARN radars: instantaneous longitudinal velocity variations. J. Geophys. Res. Atmos. 117, A05306. doi:10.1029/2011JA017232
Coley, W. R., Heelis, R. A., and Hairston, M. R. (2003). High-latitude plasma outflow as measured by the DMSP spacecraft. J. Geophys. Res. 108, 1441. doi:10.1029/2003JA009890
Ebihara, Y., Nishitani, N., Kikuchi, T., Ogawa, T., Hosokawa, K., and Fok, M.-C. (2008). Two-dimensional observations of overshielding during a magnetic storm by the super dual auroral radar network (SuperDARN) hokkaido radar. J. Geophys. Res. 113, A01213. doi:10.1029/2007JA012641
Erickson, P. J., Goncharenko, L. P., Nicolls, M. J., Ruohoniemi, M., and Kelley, M. C. (2010). Dynamics of North American sector ionospheric and thermospheric response during the November 2004 superstorm. J. Atmos. Solar-Terrestrial Phys. 72 (4), 292–301. doi:10.1016/j.jastp.2009.04.001
Foster, J. C., and Burke, W. J. (2002). SAPS: A new categorization for sub-auroral electric fields. Eos Trans. Am. Geophys. Union 83 (36), 393–394. doi:10.1029/2002EO000289
Foster, J. C., Coster, A. J., Erickson, P. J., Holt, J. M., Lind, F. D., Rideout, W., et al. (2005). Multiradar observations of the polar tongue of ionization. J. Geophys. Res. Space Phys. 110, A09S31. doi:10.1029/2004JA010928
Foster, J. C., St.-Maurice, J. P., and Abreu, V. J. (1983). Joule heating at high latitudes. J. Geophys. Res. 88 (A6), 4885–4897. doi:10.1029/JA088iA06p04885
Foster, J. C., and Vo, H. B. (2002). Average characteristics and activity dependence of the subauroral polarization stream. J. Geophys. Res. 107 (A12), SIA 16-21–SIA 16-10. doi:10.1029/2002JA009409
Galperin, Y., Ponomarev, V. N., and Zosimova, A. G. (1974). Plasma convection in the polar ionosphere. Ann. Geophys. 30, 1–7.
Greenspan, M. E., Anderson, P. B., and Pelagatti, J. M. (1986). Characteristics of the thermal plasma monitor (SSIES) for the defense meteorological satellite program (DMSP) spacecraft S8 through S10. MA: Air Force BaseLab. Rep. AFGL-TR-86-0227.
Hardy, D. A., Schmitt, L. K., Gussenhoven, M. S., Marshall, F. J., and Yeh, H. C. (1984). Precipitating electron and ion detectors (SSJ/4) for the block 5D/Flights 6-10 DMSP (Defense Meteorological Satellite Program) satellites: Calibration and data presentation, Rep. AFGL-TR-84-0314. MA: Air Force Base Lab.
He, F., Zhang, X.-X., and Chen, B. (2014). Solar cycle, seasonal, and diurnal variations of subauroral ion drifts: statistical results. J. Geophys. Res. Space Phys. 119, 5076–5086. doi:10.1002/2014JA019807
He, F., Zhang, X.-X., Wang, W., and Chen, B. (2016). Double-peak subauroral ion drifts (DSAIDs). Geophys. Res. Lett. 43, 5554–5562. doi:10.1002/2016GL069133
Heelis, R. A., Bailey, G. J., Sellek, R., Moffett, R. J., and Jenkins, B. (1993). Field-aligned drifts in subauroral ion drift events. J. Geophys. Res. 98 (A12), 21493–21499. doi:10.1029/93JA02209
Horvath, I., and Lovell, B. C. (2021). Complex sub-auroral flow channel structure formed by double-peak sub-auroral ion drifts (DSAID) and abnormal sub-auroral ion drifts (ASAID). J. Geophys. Res. Space Phys. 126, e2020JA028475. doi:10.1029/2020JA028475
Horvath, I., and Lovell, B. C. (2018). Investigating the development of abnormal subauroral ion drift (ASAID) and abnormal subauroral polarization stream (ASAPS) during the magnetically active times of September 2003. J. Geophys. Res. Space Phys. 123, 1566–1582. doi:10.1002/2017JA024870
Horvath, I., and Lovell, B. C. (2017). Investigating the development of double-peak subauroral ion drift (DSAID). J. Geophys. Res. Space Phys. 122, 4526–4542. doi:10.1002/2016JA023506
Karlsson, T., Marklund, G. T., Blomberg, L. G., and Mälkki, A. (1998). Subauroral electric fields observed by the freja satellite: A statistical study. J. Geophys. Res. 103 (A3), 4327–4341. doi:10.1029/97ja00333
Liang, J., St-Maurice, J. P., and Donovan, E. (2021). A time-dependent twodimensional model simulation of lower ionospheric variations under intense SAID. J. Geophys. Res. Space Phys. 126, e2021JA029756. doi:10.1029/2021JA029756
Liang, J., St-Maurice, J.-P., and Donovan, E. F. (2022). Model simulation of SAID intensification in the ionosphere under a current generator: the role of ion pedersen transport. J. Geophys. Res. Space Phys. 127, e2022JA030960. doi:10.1029/2022JA030960
Liléo, S., Karlsson, T., and Marklund, G. T. (2010). Statistical study on the occurrence of ASAID electric fields. Ann. Geophys. 28, 439–448. doi:10.5194/angeo-28-439-2010
Lin, D., Wang, W., Scales, W. A., Pham, K., Liu, J., Zhang, B., et al. (2019). SAPS in the 17 march 2013 storm event: initial results from the coupled magnetosphere-ionosphere-thermosphere model. J. Geophys. Res. Space Phys. 124, 6212–6225. doi:10.1029/2019JA026698
Ma, Y.-Z., Zhang, Q.-H., Jayachandran, P. T., Oksavik, K., Lyons, L. R., Xing, Z.-Y., et al. (2020). Statistical study of the relationship between ion upflow and field-aligned current in the topside ionosphere for both hemispheres during geomagnetic disturbed and quiet time. J. Geophys. Res. Space Phys. 125, e2019JA027538. doi:10.1029/2019JA027538
Ma, Y.-Z., Zhang, Q. -H., Xing, Z. -Y., Jayachandran, P. T., Moen, J., Heelis, R. A., et al. (2018). Combined contribution of solar illumination, solar activity, and convection to ion upflow above the polar cap. J. Geophys. Res. Space Phys. 123, 4317–4328. doi:10.1029/2017JA024974
Mishin, E. V. (2013). Interaction of substorm injections with the subauroral geospace: 1. Multispacecraft observations of SAID. J. Geophys. Res. Space Phys. 118, 5782–5796. doi:10.1002/jgra.50548
Mishin, E. V., Nishimura, Y., and Foster, J. (2017). SAPS/SAID revisited: A causal relation to the substorm current wedge. J. Geophys. Res. Space Phys. 122, 8516–8535. doi:10.1002/2017JA024263
Mishin, E. V., and Puhl-Quinn, P. A. (2007). SAID: plasmaspheric short circuit of substorm injections. Geophys. Res. Lett. 34, L24101. doi:10.1029/2007GL031925
Mishin, E. V. (2023). The evolving paradigm of the subauroral geospace. Front. Astron. Space Sci. 10, 1118758. doi:10.3389/fspas.2023.1118758
Ogawa, Y., Buchert, S. C., Fujii, R., Nozawa, S., and van Eyken, A. P. (2009). Characteristics of ion upflow and downflow observed with the European Incoherent Scatter Svalbard radar. J. Geophys. Res. Space Phys. 114, A05305. doi:10.1029/2008JA013817
Oksavik, K., Greenwald, R. A., Ruohoniemi, J. M., Hairston, M. R., Paxton, L. J., Baker, J. B. H., et al. (2006). First observations of the temporal/spatial variation of the sub-auroral polarization stream from the SuperDARN Wallops HF radar. Geophys. Res. Lett. 33, L12104. doi:10.1029/2006GL026256
Rich, F. J., Gussenhoven, M. S., and Greenspan, M. E. (1987). Using simultaneous particle and field observations on a low altitude satellite to estimate joule heat energy flow into the high latitude ionosphere. Ann. Geophys. 5 (6), 527–534.
Rich, F. J., Hardy, D. D., and Gussenhoven, M. S. (1985). Enhanced ionosphere-magnetosphere data from the DMSP satellites. Eos, Trans. Am. Geophys. Union 66 (26), 513–514. doi:10.1029/EO066i026p00513
Schunk, R. W., Banks, P. M., and Raitt, W. J. (1976). Effects of electric fields and other processes upon the nighttime high-latitude F layer. J. Geophys. Res. 81 (19), 3271–3282. doi:10.1029/JA081i019p03271
Spiro, R. W., Heelis, R. A., and Hanson, W. B. (1979). Rapid subauroral ion drifts observed by atmosphere Explorer C. Geophys. Res. Lett. 6, 657–660. doi:10.1029/GL006i008p00657
Spiro, R. W., Reiff, P. H., and Maher, L. J. (1982). Precipitating electron energy flux and auroral zone conductances-An empirical model. J. Geophys. Res. 87 (A10), 8215–8227. doi:10.1029/ja087ia10p08215
Voiculescu, M., and Roth, M. (2008). Eastward sub-auroral ion drifts or ASAID. Ann. Geophys. 26, 1955–1963. doi:10.5194/angeo-26-1955-2008
Wahlund, J.-E., Opgenoorth, H. J., Häggström, I., Winser, K. J., and Jones, G. O. L. (1992). EISCAT observations of topside ionospheric ion outflows during auroral activity: revisited. J. Geophys. Res. Space Phys. 97 (A3), 3019–3037. doi:10.1029/91JA02438
Wang, H., and Lühr, H. (2013). Seasonal variation of the ion upflow in the topside ionosphere during SAPS (subauroral polarization stream) periods. Ann. Geophys. 31, 1521–1534. doi:10.5194/angeo-31-1521-2013
Wei, D., Yu, Y., and He, F. (2019). The magnetospheric driving source of double-peak subauroral ion drifts: double ring current pressure peaks. Geophys. Res. Lett. 46, 7079–7087. doi:10.1029/2019GL083186
Wei, D., Yu, Y., Ridley, A. J., Cao, J., and Dunlop, M. W. (2019). Multi-point observations and modeling of subauroral polarization streams (SAPS) and double-peak subauroral ion drifts (DSAIDs): A case study. Adv. Space Res. 63 (11), 3522–3535. doi:10.1016/j.asr.2019.02.004
Yeh, H.-C., Foster, J. C., Rich, F. J., and Swider, W. (1991). Storm time electric field penetration observed at mid-latitude. J. Geophys. Res. 96 (A4), 5707–5721. doi:10.1029/90ja02751
Yuan, Z. G., Deng, X. H., and Wang, J. F. (2008). DMSP/GPS observations of intense ion upflow in the midnight polar ionosphere associated with the SED plume during a super geomagnetic storm. Geophys. Res. Lett. 35 (19), L19110. doi:10.1029/2008GL035462
Zhang, Q.-H., Ma, Y. Z., Jayachandran, P. T., Moen, J., Lockwood, M., Zhang, Y.-L., et al. (2017). Polar cap hot patches: enhanced density structures different from the classical patches in the ionosphere. Geophys. Res. Lett. 44, 8159–8167. doi:10.1002/2017GL073439
Zhang, Q.-H., Zhang, B.-C., Liu, R.-Y., Dunlop, M. W., Lockwood, M., Moen, J., et al. (2011). On the importance of interplanetary magnetic field ∣B<i>y</i>∣ on polar cap patch formation: the formation of polar cap patch. J. Geophys. Res. Space Phys. 116, A05308. doi:10.1029/2010JA016287
Zhang, Q.-H., Zhang, B. C., Lockwood, M., Hu, H. Q., Moen, J., Ruohoniemi, J. M., et al. (2013). Direct observations of the evolution of polar cap ionization patches. Science 339 (6127), 1597–1600. doi:10.1126/science.1231487
Zhang, Q.-H., Zong, Q.-G., Lockwood, M., Heelis, R. A., Hairston, M., Liang, J., et al. (2016). Earth’s ion upflow associated with polar cap patches: global and in situ observations. Geophys. Res. Lett. 43, 1845–1853. doi:10.1002/2016GL067897
Zhang, Q., Liu, Y. C.-M., Zhang, Q.-H., Xing, Z.-Y., Wang, Y., and Ma, Y.-Z. (2020). Statistical study of ion upflow associated with subauroral polarization streams (SAPS) at substorm time. J. Geophys. Res. Space Phys. 125, e2019JA027163. doi:10.1029/2019JA027163
Zhang, S.-R., Erickson, P. J., Zhang, Y., Wang, W., Huang, C., Coster, A. J., et al. (2017). Observations of ion-neutral coupling associated with strong electrodynamic disturbances during the 2015 St. Patrick's Day storm. J. Geophys. Res. Space Phys. 122, 1314–1337. doi:10.1002/2016JA023307
Keywords: subauroral polarization streams, subauroral ion drift, double-peak subauroral ion drift, ion upflow, frictional heating
Citation: Zhang Q, Han D-S, Teng S-C, Wang Z-W, Zhang Q-H, Xing Z-Y, Wang Y and Ma Y-Z (2023) A statistical analysis and comparison of the fine structures of the ion upflow associated with the double-peak subauroral ion drift. Front. Astron. Space Sci. 10:1254243. doi: 10.3389/fspas.2023.1254243
Received: 06 July 2023; Accepted: 18 September 2023;
Published: 04 October 2023.
Edited by:
Igo Paulino, Federal University of Campina Grande, BrazilReviewed by:
Mauricio Bolzan, Federal University of Goiás, BrazilCopyright © 2023 Zhang, Han, Teng, Wang, Zhang, Xing, Wang and Ma. This is an open-access article distributed under the terms of the Creative Commons Attribution License (CC BY). The use, distribution or reproduction in other forums is permitted, provided the original author(s) and the copyright owner(s) are credited and that the original publication in this journal is cited, in accordance with accepted academic practice. No use, distribution or reproduction is permitted which does not comply with these terms.
*Correspondence: De-Sheng Han, aGFuZGVzaGVuZ0B0b25namkuZWR1LmNu
Disclaimer: All claims expressed in this article are solely those of the authors and do not necessarily represent those of their affiliated organizations, or those of the publisher, the editors and the reviewers. Any product that may be evaluated in this article or claim that may be made by its manufacturer is not guaranteed or endorsed by the publisher.
Research integrity at Frontiers
Learn more about the work of our research integrity team to safeguard the quality of each article we publish.