 Thomas S. Sotirelis
 Jesper W. Gjerloev
 Marc Hairston2
- 1Johns Hopkins University Applied Physics Laboratory, Laurel, MD, United States
- 2The University of Texas at Dallas, Richardson, TX, United States
The protons and electrons on newly reconnected field lines exhibit time-of-flight effects that have been observed and modelled on both the dayside and nightside, at both high and low altitudes. These reconnection signatures feature proton energy distributions that are cutoff toward low energy. In LEO the cutoff energy exhibits a dispersion with latitude, typically seen in the cusp on the dayside, and referred to as velocity dispersed ion structures on the nightside. Here, an automated algorithm for detecting such low-energy cutoffs in the energy spectra of precipitating ions was developed, without regard for any possible dispersion with latitude. The occurrences of LEC ion spectra were mapped over a year of DMSP observations. There are four distinct components to this map, two of which are produced by reconnection. On the dayside LEC ion spectra are seen in cusp, mantle, and open-LLBL precipitation, predominantly at sub-keV energies, as the result of dayside reconnection. On the nightside LEC ion spectra are seen at the poleward edge of the oval at supra-keV energies (usually dispersed with latitude), that indicate magnetotail reconnection. There is another supra-keV population seen on the dusk side at the equatorward edge of the oval, possibly indicating the onset of isotropy. Finally, there is a sub-keV population seen throughout the auroral oval that is thought to consist of ions accelerated out of the opposing hemisphere. The presence of the nightside reconnection signature is modulated by magnetic activity level. Superposed epoch analyses of the ionospheric flow velocity reveal flow through the open–closed boundary when reconnection signatures are present, and enhanced upflow on the dayside when reconnection signatures are present.
1 Introduction
Signatures of reconnection in low Earth orbit (LEO) have been reported near the poleward edge of the auroral oval on both the dayside and the nightside for some time now. On the dayside, low-energy cutoff (LEC) ion spectra are routinely observed on the newly open field lines of the cusp and mantle (Newell and Meng, 1995), and their production mechanism has been modeled (Onsager et al., 1993; Wing et al., 1996). On the nightside, velocity dispersed ion structures (VDIS), indicating recently reconnected field lines, also exhibit LEC ion spectra (Sotirelis et al., 1999), as well as associated polar rain drop offs (Shirai, et al., 1997). At higher altitudes counter streaming beams of ions and electrons,with low energy cutoffs in their spectra, are observed in the plasma sheet boundary layer (PSBL) (Takahashi and Hones, 1988), with the more energetic electrons headed tailward (Onsager et al., 1990).
The unifying interpretation of all these observations is one of time-of-flight effects acting on hot plasma recently introduced onto newly reconnected field lines. These newly introduced ions and electrons stream freely along the newly reconnected field lines as they convect, into the polar cap on the dayside, and out of the polar cap on the nightside (see Figure 1 of Sotirelis et al. (1999)). Higher energy particles reach the observer first, so that lower energy particles that have not yet had time to travel the intervening distance are missing from the observed spectra. Such spectra, with unnatural seeming drop-offs toward low energies are indicative of recently reconnected field lines. The longer a field line has been convecting since reconnection, the more time ions have had to travel to the observer, and so cutoff energies are lower on field lines that have convected farther from the reconnection site. Sotirelis et al. (1999) provides examples and analysis of the time-of-flight effects that produce such LEC ion spectra and VDIS in LEO on the nightside, estimating distances to the downtail reconnection site. These signatures are a remote sensing of recent reconnection at higher altitudes in the magnetotail.
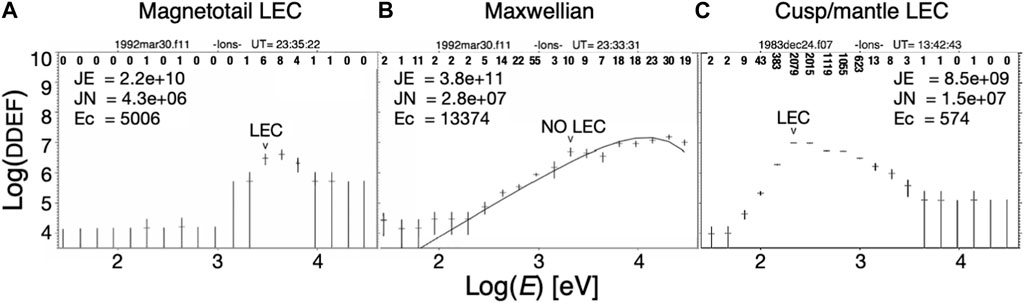
FIGURE 1. Example energy spectra showing differential directional energy flux (DDEF) [eV/(eV-cm2-sr-sec)] with vertical error bars reflecting Poisson uncertainties. Across the top are the number of counts in each channel. Summing over the channels, with the appropriate factors, gives the energy flux JE in eV/(cm2-sr-sec) and the number flux JN in #/(cm2-sr-sec). The characteristic energy is given by their ratio: Ec = JE/JN, equal to 2 kT for a Maxwell distribution. In (A) and (C) successful LEC determinations are shown. A Maxwellian fit to a spectrum that fails the LEC test is shown in (B).
While many of these studies make use of the velocity dispersion of the energy cutoffs, this study takes a simpler approach, identifying LEC ion spectra in DMSP observations of auroral precipitation regardless of the character of neighboring spectra, then placing them in context relative to auroral boundaries. The goal is to interpret the presence of LEC spectra without consideration of energy dispersion. We will see four separate populations reveal themselves. The ionospheric plasma velocity associated with these signatures will also be examined.
2 Automated LEC ion spectra identification
LEC ion spectra are identified in observations from the Defense Meteorological Satellite Program (DMSP) SSJ/4 sensor. The DMSP series of satellites are in sun-synchronous 800 km circular orbits. The SSJ/4 sensor is made up of four separate cylindrical electrostatic analyzers, one high-energy (1–30 keV) and one low-energy (30–1,000 eV), each, for both electrons and ions (Hardy et al., 1984). They have a single small upward field-of-view, which in the auroral region samples only within the loss cone. The SSJ/4 steps through 19 logarithmically spaced energy channels from 30 eV to 30 keV, numbered for i = 1, 19, once per second. Counts are processed into differential directional energy flux (DDEF). These observations were analyzed in magnetic latitude (MLAT) and magnetic local time (MLT) in altitude adjusted corrected geomagnetic (AACGM) coordinates (Baker and Wing, 1989). A small correction is applied to remove low level background counts due to penetrating radiation (Sotirelis et al., 2013).
The survey used only data between 55° and 80° absolute MLAT. Contiguous satellite passes had to cross 65° abs (MLAT) to be considered. Candidate ion spectra had to exceed 1 × 10⁸ eV/(cm2-sr-sec) in total energy flux to be considered by the LEC identification algorithm. Each ion spectrum in qualified passes was examined, from the peak flux toward lower energies, searching for a statistically significant sharp drop-off. Below its peak, a Maxwellian distribution is linear in log (DDEF) versus log(E) with a slope of 2 (see Figure 1B). Taking this Maxwellian slope of 2, and applying it to the SSJ/4 channel spacing, implies a ratio of rMaxw = 2.15 in the DDEF between adjacent energy channels, for Maxwellian distributions below their peak. Elsewhere the DDEF is falling less steeply, or not at all, so this is the worst case, and falling more steeply than this is clearly a deficit relative to a Maxwellian distribution. Spectra are required to fall off more sharply than this to qualify as a LEC. Specifically, by an additional factor of rMaxw. This can occur over one or two energy steps, two steps in case the cutoff falls in the middle of a channel. Thus, the DDEF must fall by a factor of rMaxw2 over one step, or a factor of rMaxw3 over two steps. There were a variety of additional criteria to ensure accurate identifications and to handle special cases.
The algorithm makes use of two quantities defined in each ion channel i = 1, … , 19, covering 30 eV to 30 keV: the differential directional energy flux (DDEF(i) [eV/(eV-cm2-sr-sec)]) and the counts registered (C(i)). The highest energy channel in the low-energy head is i = 10. Starting from the peak in energy flux and stepping toward lower energies, a candidate low energy cutoff channel in the ion spectrum is identified as such if the following conditions are met for candidate channel i, abbreviating log (DDEF) as LF.
• i ≥ 4 (95 eV)
• DDEF(i) ≥ 5 × 10⁵ eV/(eV-cm2-sr-sec)
• C(i) ≥ 4 counts
• Two of:
o (LF(i) > LF (i-1)/rMaxw2)
o (LF(i) > LF (i-2)/rMaxw3)
o (LF(i) > LF (i-3)/rMaxw4)
If a candidate LEC is identified, it is considered valid if the following two tests prove true.
•LF(i) > (LF (i-2)/rMaxw3 + LF (i-3)/rMaxw4 + LF (i-4)/rMaxw5)/3
•LF(i) > (LF (7)/rMaxwi−6 + LF (8)/rMaxw i−7 + LF (9)/rMaxw i−8)/3 if i > 11
If the preceding tests fail (in the case of a weak signal), the following tests are applied, and if all four hold true, the LEC is considered valid.
•C(i) ≤ 10 counts
•i > 11
•(C (i–1) + C (i–2) + C (i–3) + C (i–4) + C (i–5))/5 ≤ 0.6
•(C (5) + C (6) + C (7) + C (8) + C (9))/5 ≤ 0.8
These many conditions were developed to permit accurate identifications, even at the low count rates sometimes seen at the poleward edge of the nightside oval, and to take into account the different character of the high and low energy sensor heads.
Figure 1 shows three examples of the LEC algorithm in action. The three ion spectra are searched from their peak toward lower energies for a significant drop-off in flux. The algorithm finds LECs in (a) in the magnetotail and (c) in the cusp/mantle region, but fails to find a LEC in (b), which is, in fact, successfully fit with a Maxwellian. (A successful Maxwellian fit must have a chi squared within a factor of 3 of the 1% probability threshold. The fits might exclude up to 9 of the lowest energy channels (all exceeding 1-count level fluxes) since these fits were designed to capture the dominant ion population and to ignore any excesses at low energy.)
3 LEC ion spectra survey 1992
The initial LEC ion spectra survey was conducted using DMSP flights F8, F9, F10 and F11 over the year 1992. All ion spectra between 55° and 80° |MLAT| meeting the criteria listed in Section 2 were tested using the algorithm also described there, in order to target the auroral oval.
The locations of identified LEC ion spectra are shown in Figure 2A. The energy of the channel adjacent to the drop-off, referred to as the cutoff energy, is shown by color. It is clear that LEC ion spectra can be seen throughout the auroral region. The variation of the density of the points in local time is a reflection of the DMSP sun-synchronous orbits which can be either dawn–dusk, or pre-noon–pre-midnight. The cutoff at 80° does exclude some LEC spectra, particularly mantle precipitation, on the dayside in the polar cap (Newell and Meng, 1992).
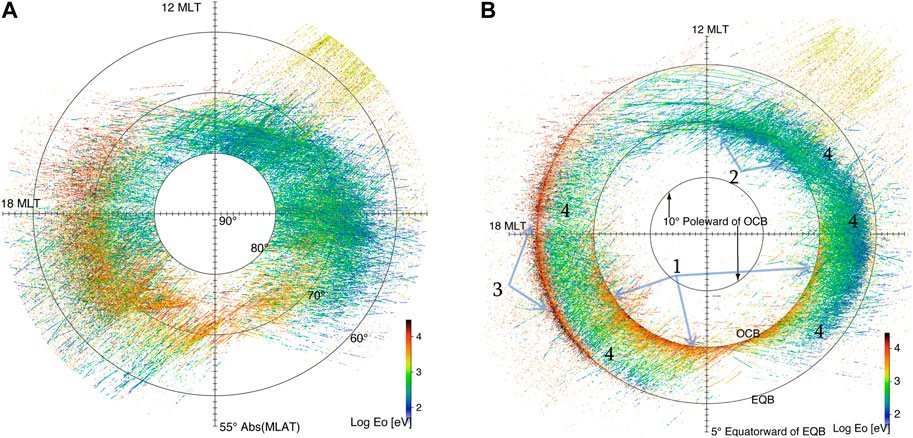
FIGURE 2. LEC ion spectra from 4 DMSP spacecraft combined for 1992. The cutoff energy Eo is indicated by color (A). In (B) the points have been shifted latitudinally so that the OCB from the DMSP pass containing the LEC spectrum lies at 70°, and the equatorward boundary at 60°.
It is helpful to plot these LEC identifications relative to the auroral boundaries from the same passes. We use the open-closed and equatorward boundary identifications from Sotirelis and Newell (2000). On the nightside, these are based Newell et al. (1996) from which the b6 boundary is used for the open-closed boundary (OCB), and the equatorward-most of b1e and b2i is used for the equatorward boundary (EQB). On the dayside, the boundaries are based on the dayside region identifications of Newell et al. (1991). Transitions from open regions (poleward void, polar rain, mantle, cusp, and open-LLBL (OLLBL)) to closed regions (CPS, BPS, LLBL) are parsed to find the OCB, and transitions from the closed regions to equatorward void are used to find the EQB. In Figure 2B the LEC spectra are shifted in latitude linearly using the concurrent particle boundaries, so that the OCB from the same pass sits at 70° MLAT and the EQB sits at 60°. Between the OCB and the EQB the distance is either stretched or compressed, as necessary, to put the OCB at 70° and the EQB at 60°. Outside of this interval the points are plotted by their distance from the nearby boundary.
The LEC ion spectra can now be seen to separate into four distinct populations. As expected, there are high-energy LEC ion spectra near the nightside OCB (1), indicative of magnetotail reconnection, and lower-energy LEC spectra near the dayside OCB (2) indicative of dayside magnetopause reconnection. There are two further populations apparent in Figure 2B: high-energy LEC spectra near the dusk-side EQB (3), and low-energy LEC spectra throughout the oval (4).
An example spectrogram of cusp/mantle precipitation is shown in Figure 3. This event has been previously studied by Newell and Meng (1995), and by Wing et al. (1996), focusing on its LEC ion spectra. The vertical red lines below the ion panel show where LEC have been identified by our algorithm. The entire cusp, exhibiting direct entry from the magnetosheath with intense DDEF peaks ∼108 eV/(eV-cm2-sr-sec) (black in the color bar), has LEC spectra revealing time-of-flight effects. Much of the mantle, the less direct entry poleward of the cusp, also exhibits LEC spectra. These dayside regions produce more counts than the weaker fluxes seen in nightside passes, such as the pass depicted in Figure 4.
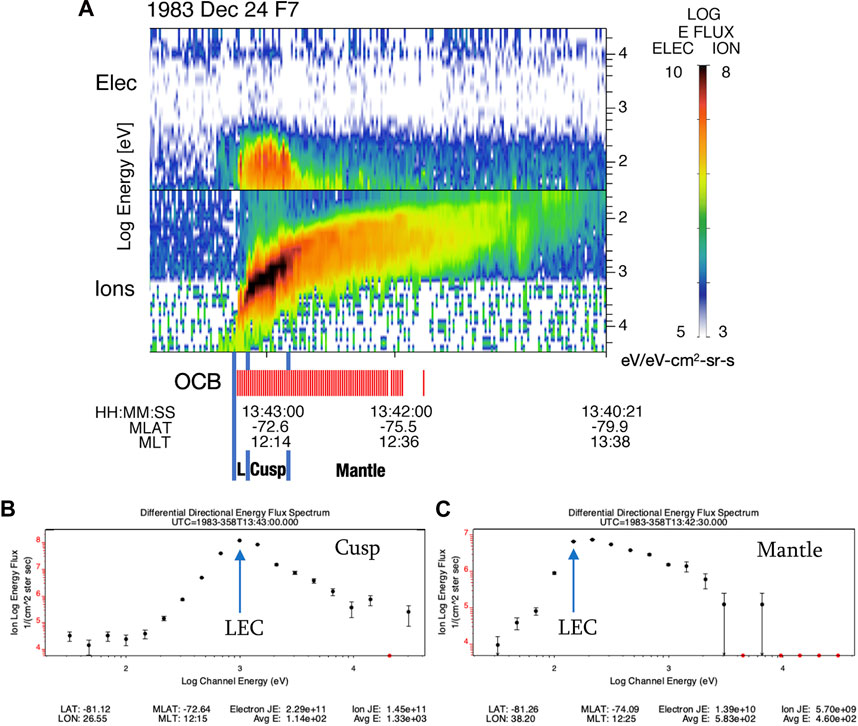
FIGURE 3. (A) An example spectrogram of a DMSP pass on the dayside showing cusp, mantle and open low-latitude boundary layer (OLLBL = L) precipitation. The log of the differential directional energy flux [eV/(eV-cm2sr-sec)] is depicted with the electrons in the top panel and ions in the bottom panel. The energy varies from 30 eV, where the two panels meet, to 30 keV at the top of the top panel and the bottom of the bottom panel. LEC ion spectra are marked by vertical red lines below the ion panel. Example LEC spectra are shown from cusp precipitation (B) at 13:43:00, and mantle precipitation (C) at 13:42:30. The energy fluxes JE are in eV/(cm2-sr-sec) and the average energies are in eV. The cutoff energies are at 1 keV and 140 eV for (B) and (C) respectively.
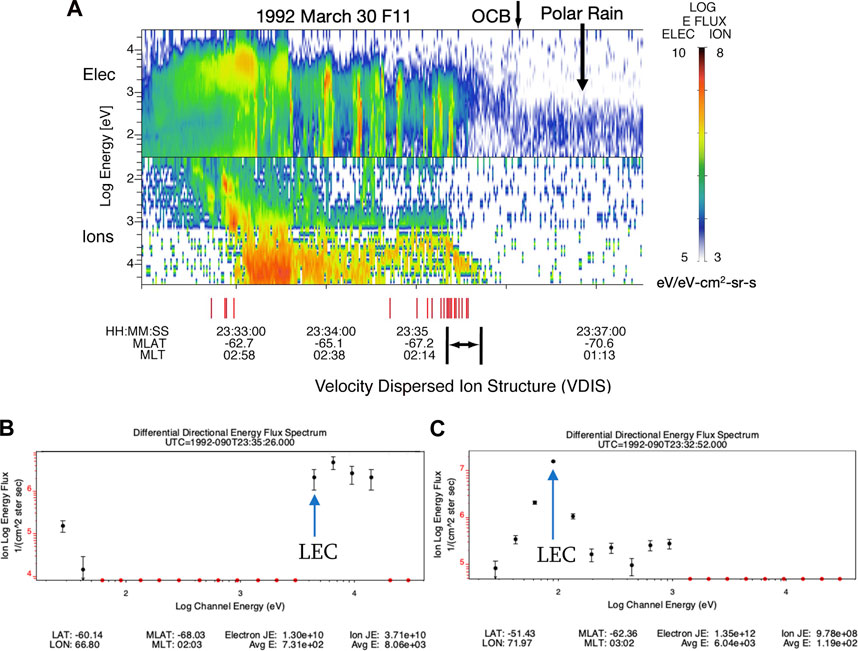
FIGURE 4. (A) An example spectrogram of a DMSP pass on the nightside showing a VDIS with LEC spectra near the poleward edge. The LEC spectra to the right (e.g. (B), which is cutoff at 4.4 keV) are at higher energy and indicative of magnetotail reconnection. Those to the left (e.g. (C), which is cutoff at 95 eV) are at lower energy, and are likely produced by a different mechanism. Units are the same as Figure 3.
The pass shown in Figure 4 is from the 1992 survey. It exhibits a VDIS made up of LEC spectra at the poleward edge of the oval, near the OCB. This is a classic signature of magnetotail reconnection (see Sotirelis et al., 1999 and references therein). Some of the spectra within the VDIS, that seem to have LEC spectra, do not pass the algorithm test due to their low count rates. The OCB is marked at the point where the ∼100 eV polar rain, which flows down on open field lines, is choked off when the field line reconnects (Shirai, et al., 1997), and is replaced by a faint higher energy signature (Sotirelis et al., 1999). Also, to the extreme left appear four low-energy LEC spectra. These are possibly due to ions accelerated out of the opposing hemisphere (Bosqued et al., 1986). The pass shown in Figure 5 is used by Newell et al. (1996) in a discussion of auroral boundaries. It shows an example of high energy cutoff ion spectra at the oval’s equatorward edge, during a period of prolonged quiet.
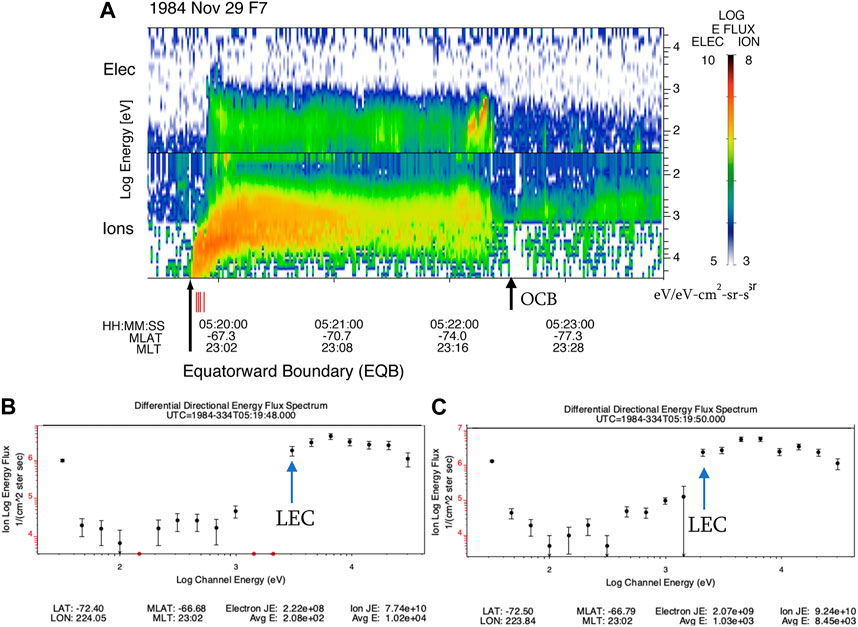
FIGURE 5. An example spectrogram of a DMSP pass showing spectra with cutoffs at high energies at the equatorward edge of the oval, possibly indicative of the presence of isotropy boundaries (A). Example LEC spectra are shown from two seconds apart. (B) is cutoff at 3 keV and (C) at 2 keV.
In Figure 6, four different populations of LEC ion spectra are evident. The supra-keV LEC spectra observed near the nightside OCB, and peaking near midnight, are indicative of nightside reconnection, as depicted in Figure 4. There is a second population also visible in the supra-keV LEC plot, at the equatorward edge, from ∼15 MLT to 02 MLT, as exampled in Figure 5, possibly reflecting energy dependent isotropy boundaries (Sergeev et al., 1993). “In this figure, this signature appears to go all the way to noon, but near noon such LEC could also be associated with cusp, as there is frequently little or no closed flux precipitation equatorward of cusp/OLLBL, as seen in Figure 3. For this reason, we remain silent on this LEC signature at the EQB between 12 and 15 MLT, using Figure 7B to decide where this ambiguity applies.
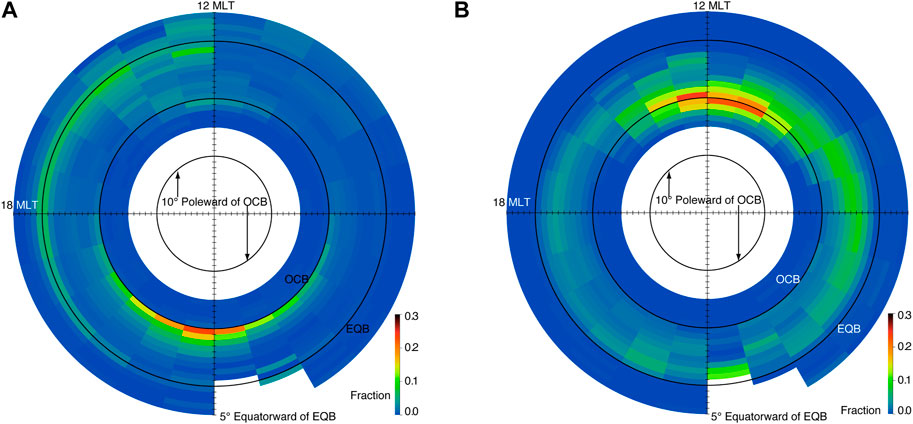
FIGURE 6. The fraction of ion spectra seen by DMSP in 1992 exhibiting a LEC as a function of location relative to the OCB and EQB. Spectra with cutoffs above 1 keV (supra-keV) are shown in (A) and those with cutoffs below 1 keV (sub-keV) are shown in (B). These fractions are calculated in 1-h MLT spatial bins that are spaced 1° in latitude above the OCB, and below the EQB. Between the OCB and the EQB the observations are placed into ten evenly spaced bins relative to the contemporaneous OCB and EQB from the observing passes.
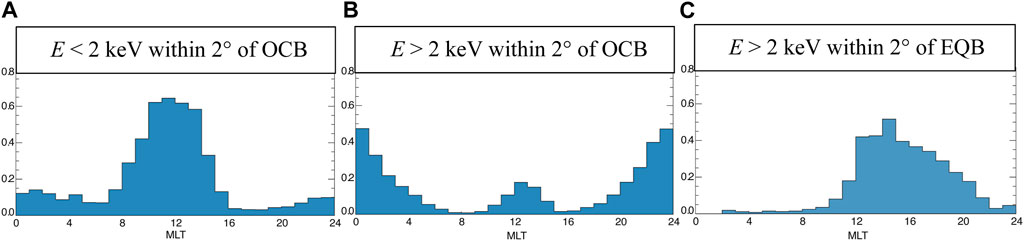
FIGURE 7. The probabilities of a DMSP pass encountering >4 LEC spectra within 2° of either the OCB or EQB are shown as a function local time. The probabilities for LEC spectra near the OCB are shown in (A) for LECs below 2 keV, and in (B) for LECs above 2 keV. Probabilities for spectra near the EQB with LEC above 2 keV are shown in (C).
The sub-keV cutoff spectra also fall into two separate populations. On the dayside, near the OCB between 08 and 15 MLT and peaking near noon, sub-keV cutoff spectra are indicative of dayside reconnection, such as that depicted in Figure 3. There is also a faint presence supra-keV LEC spectra at the OCB near noon as some cusp does cut off there, as seen in Figure 3. In the auroral zone away from noon, a sub-keV population is seen peaking closer to the EQB than the OCB. It is exampled on the left side of Figure 4, and is possibly caused by ions accelerated out of the opposing hemisphere (Bosqued et al., 1986).
It is useful to estimate the probability of seeing LEC on a per pass basis rather than on a per spectrum basis. Figure 7 shows the probability of encountering at least four LEC spectra near either the OCB or EQB. The low–high energy divide is set at 2 keV for this analysis as this threshold better separates dayside and nightside reconnection. Figure 7A shows that this signature of recently reconnected field lines is present ∼60% of the time within 2 h of noon. Figure 7B that this signature of nightside reconnection is present ∼50% of the time within 1 h of midnight. This is likely an underestimate since these nightside spectra near the OCB are close to the sensitivity limit of the instrument and would likely be seen more frequently by a more sensitive instrument. In Figure 7B there is also a small ∼10–20% population of dayside reconnection events near noon with cutoffs above 2 keV from the higher energy portion of the cusp and/or OLLBL, as exampled in Figure 3. Figure 7C shows the MLT distribution LEC spectra with cutoffs at high energies and near the EQB. These are thought to be reflect the presence of ion isotropy boundaries (Sergeev et al., 1993), but pitch-angle resolved observations are required to confirm this.
4 1998 survey of occurrence with geomagnetic activity
A further analysis was conducted using observations from 1998 using F11, F12 and F14, and making use of SuperMAG ground magnetometer collaboration (Gjerloev, 2009; 2012). The year 1998 was selected because the DMSP spacecraft flying in 1998 use the more advanced SSIES-2 instrument that provides the thermal plasma data used in the ionospheric flow analysis. The SSIES-2 dataset included a set of quality flags to weed out the accidental use of bad or problematic data providing more reliable plasma flow velocities. The LEC ion spectra from all of 1998 were analyzed similarly to the 1992 analysis, and obtained very similar results (not shown). Further analyses relative to geomagnetic activity are described next.
The occurrence rate of LEC reconnection signatures is analyzed as a function of activity. Activity is classified as either active, moderate, or quiet according to the following criteria:
where SMR, SMU and SML are the SuperMAG analogues of SYMH, AL and AU using 1-min cadence observations from more than 100 SuperMAG stations.
The probabilities of seeing a reconnection signature, as defined for Figure 7B, are moderately affected by activity level as shown in Figure 8. The probability of seeing a reconnection signature near midnight varies from ∼35% under quiet conditions to ∼60% during active times. Near noon, this signature reflects the probability of seeing LECs at the higher energies typical of the more energetic portion of the cusp that maps close to the reconnection site, exampled on the far-left side of Figure 3.
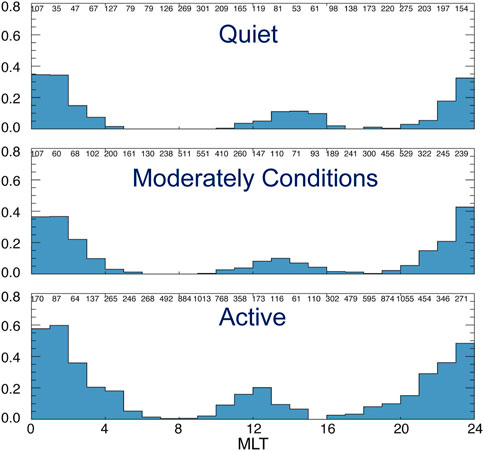
FIGURE 8. The probability of observing a reconnection signature with LEC above 2 keV in a DMSP pass as a function of local time is shown as a function of activity. The criterion is the same as in Figure 7B. The numbers of OCB boundary crossings at each local time are given at the top of the panel. This signature is typical of nightside reconnection, and the higher energy portions of the cusp and OLLBL that map close to the reconnection site.
5 Ion flow superposed epoch
The behavior of the ionospheric flow near the OCB, in the presence and absence of reconnection signatures, is examined using observations from the retarding potential analyzer (RPA) and driftmeter on the SSIES on DMSP (Greenspan et al., 1986). These plasma velocity observations have 4-s cadence. Each OCB was characterized as being associated with reconnection if at least 4 LEC ion spectra were found within 2° MLAT of the OCB, from that pass. OCB with no LEC were assigned to the “no LEC” category, and those with 1–3 LEC were discarded. On the nightside only LEC with cutoff energies above 2 keV were counted. On the dayside no such threshold was applied since cusp and OLLBL can sometimes exhibit supra-keV cutoffs. The OCB from 1998 are shown in Figure 9, color coded by these criteria.
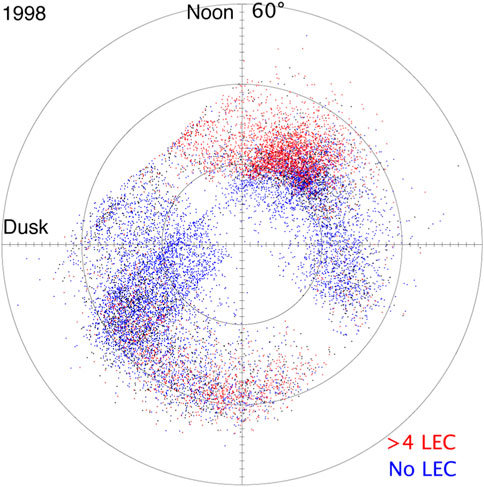
FIGURE 9. OCB crossings for 1998 are shown in MLAT and MLT. OCBs in red are associated with at least 4 LEC ion spectra, indicative of time-of-flight reconnection effects. OCBs in blue were associated with no LEC spectra.
Figure 10 shows the superposed epoch average flows as a function of MLAT relative to the OCB. The average flow on the dayside is depicted in Figure 10A. It shows poleward flow through the OCB when reconnection is indicated, as expected. It averages ∼100 m/s. The poleward flow through the OCB in the absence of a reconnection signature is approximately zero, also as expected. The upward flow is larger in the case of reconnection associated passes, than the no reconnection case, by approximately a factor of 3.
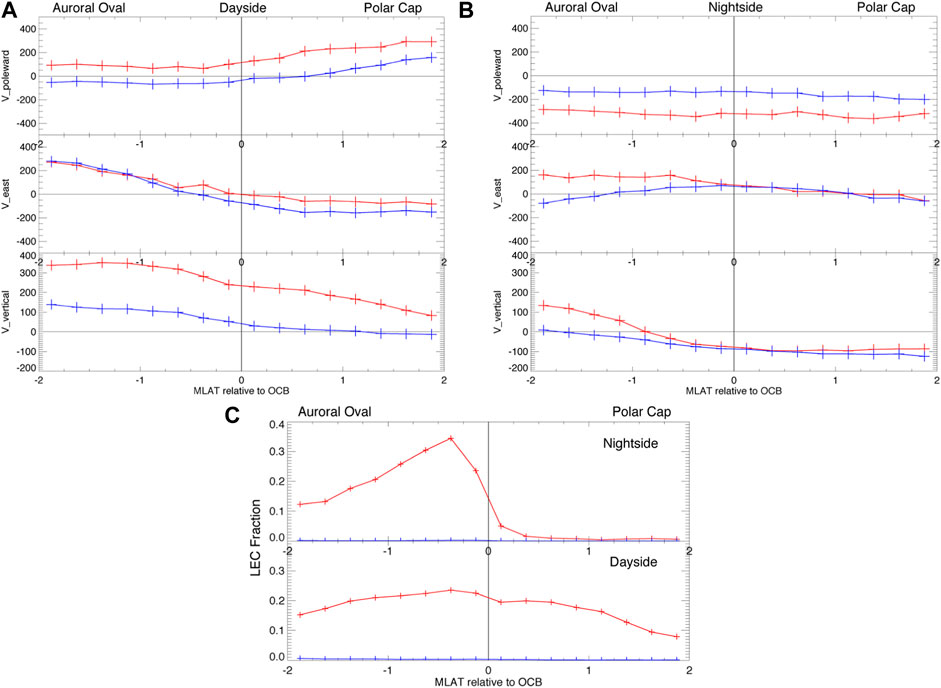
FIGURE 10. Superposed epoch plots of ionospheric flows associated with DMSP OCB crossings are shown in m/s versus MLAT relative to the OCB for (A) the dayside, (B) the nightside. The fraction of spectra with LEC are shown relative to the OCBs in (C). Flows associated with at least 4 nearby reconnection signatures are shown in red, and those with none are in blue.
Figure 10B shows the nightside flows. A flow of ∼300 m/s out of the polar cap through the nightside OCB is seen in the reconnection indicated case. The no-reconnection case also shows a flow out of the polar cap at ∼150 m/s. The reconnection signatures on the nightside are seen in much weaker fluxes, close to the sensitively limit of the instrument. It is possible that LEC spectra are present in the some of the no-reconnection cases, but at intensities too small for the SSJ4 to resolve. Perhaps this is why the average flow out of the cap on the nightside is not zero.
Figure 10C shows the fraction of ion spectra exhibiting LECs as a function of latitude relative to the OCB. On the nightside the LEC spectra are confined to the auroral oval as expected. On the dayside LEC spectra are seen on both sides of the OCB indicating flaws in the OCB algorithm. This is likely due to some combination of open-LLBL being misclassified as ordinary closed LLBL, and reconnection flows occurring before ions have had time to reach LEO.
6 Discussion
Ion spectra cutoff toward low energy have been surveyed, with an eye toward interpreting them without considering any velocity dispersion with latitude. Their association with dayside and nightside reconnection has been established, even in the absence of such dispersion in the cutoff energies. Near noon ∼60% and ∼15–20% of passes see spectra with LECs, below and above 2 keV, respectively. The ions with spectra cutoff at higher energies will have arrived on field lines connecting more closely to the reconnection site (Onsager et al., 1993; Wing et al., 1996). Nightside reconnection signatures are seen on ∼40% of passes near midnight, on average. This occurrence fraction rises to ∼60% during active times and falls to ∼35% during quiet times. These signatures provide a method of remotely sensing recent reconnection at high altitudes from LEO.
Two further populations of LEC spectra have been identified, those at the equatorward edge with LEC above 1 keV, and a population with cutoffs below 1 keV dispersed through most of the oval away from noon. The low-energy LEC population is seen in roughly 5%–10% of the spectra observed in the equatorward portion of the oval away from noon, with a preference for the dawn side. A possible cause is time-of-flight effects acting on ions accelerated out of the opposing hemisphere (Bosqued et al., 1986), though we did not investigate this as a possible mechanism.
The population of supra-keV LECs at the equatorward edge is seen in 20%–40% of passes between 20 MLT and noon. It is speculated here that between 15 and 20 MLT these LECs could be caused by the loss of isotropy as pitch-angle scattering fails for lower energies; as the gyroradius shrinks in relation to the field-line curvature seen at the high altitude extreme of the field line, causing the loss cone to empty at lower energies (Sergeev et al., 1993). We exclude the LEC spectra between 15 and noon as these could be associated with cusp. In order to test the isotropy boundary hypothesis, observations at different pitch angles are needed. Such a test will have to wait for such observations to become available.
A superposed epoch analysis of ionospheric flow near the OCB, in the presence and absence of LEC reconnection signatures, was carried out. On the dayside, flow through the OCB was seen when reconnection signatures were present and not seen in their absence. On the nightside, flow through the OCB was twice as large in the presence of reconnection signatures than when it was absent. This could be because the SSJ/4 sensor is not sensitive enough to see the weakest reconnection signatures. An idea supported by the VDIS in Figure 4, where only some of the VDIS spectra have enough counts to trigger our algorithm. On the dayside, there were indications that the OCB determinations there were not as accurate as those on the nightside.
Large differences were seen in the vertical motion of the ionosphere, in the presence and absence of reconnection signatures. Near the dayside OCB, in the presence of reconnection signatures, average upflow varied between 350 m/s and 80 m/s. The average upflow was much smaller when reconnection signatures were absent, varying from 140 m/s to −20 m/s over the same interval.
It has been shown that: velocity dispersion is not a necessary component of reconnection signature identification; reconnection is present even in quiet times; and reconnection has a strong influence on ionospheric upflow.
Data availability statement
Publicly available datasets were analyzed in this study. This SSJ/4 data can be found at https://www.ncei.noaa.gov/data/dmsp-space-weather-sensors/access/. The SSIES data are available through the Madrigal Data Center at http://cedar.openmadrigal.org/list. The SuperMAG data can be found at https://supermag.jhuapl.edu.
Author contributions
TSS performed the study. JWG provided insight on the SuperMAG observations. MH provided insight on the SSIES observations. All authors contributed to the article and approved the submitted version.
Funding
This work was supported by NASA grant 80NSSC22K1896 and NSF grant ATM-0541913. MH was supported by NASA grant 80NSSC20K1071.
Conflict of interest
The authors declare that the research was conducted in the absence of any commercial or financial relationships that could be construed as a potential conflict of interest.
Publisher’s note
All claims expressed in this article are solely those of the authors and do not necessarily represent those of their affiliated organizations, or those of the publisher, the editors and the reviewers. Any product that may be evaluated in this article, or claim that may be made by its manufacturer, is not guaranteed or endorsed by the publisher.
References
Baker, K. B., and Wing, S. (1989). A new magnetic coordinate system for conjugate studies at high latitudes. J. Geophys. Res. 94, 9139. doi:10.1029/ja094ia07p09139
Bosqued, J. M., Sauvaud, J. A., Delcourt, D., and Kovrazhkin, R. A. (1986). Precipitation of suprathermal ionospheric ions accelerated in the conjugate hemisphere. J. Geophys. Res. Space Phys. 91 (A6), 7006–7018. doi:10.1029/ja091ia06p07006
Gjerloev, J. W. (2009). A global ground-based magnetometer initiative. EOS 90, 230–231. doi:10.1029/2009EO270002
Gjerloev, J. W. (2012). The SuperMAG data processing technique. J. Geophys. Res. 117, A09213. doi:10.1029/2012JA017683
Greenspan, M. E., Anderson, P. B., and Pelagatti, J. M. (1986). Characteristics of the thermal plasma monitor (SSIES) for the Defense meteorological satellite Program (DMSP) spacecraft S8 through S10, AFGL-TR-86-0227. MA: Hanscom AFB.
Hardy, D. A., Schmitt, L. K., Gussenhoven, M. S., Marshall, F. J., Yeh, H. C., Schumaker, T. L., et al. (1984). “Precipitating electron and ion detectors (SSJ/4) for the block 5D/flights 6-10 DMSP satellites: calibration and data presentation,”. Rep. AFGL-TR-84-0317 (MA, USA: Air Force Geophysics Laboratory, Hanscom AFB).
Newell, P. T., Burke, W. J., Sanchez, E. R., Meng, C.-I., Greenspan, M. E., and Clauer, C. R. (1991). The low-latitude boundary layer and the boundary plasma sheet at low altitude: prenoon precipitation regions and convection reversal boundaries. J. Geophys. Res. 96, 21013. doi:10.1029/91ja01818
Newell, P. T., Feldstein, Y. I., Galperin, Y. I., and Meng, C.-I. (1996). The morphology of nightside precipitation. J. Geophys. Res. 101 (10), 10737–10748. doi:10.1029/95JA03516
Newell, P. T., and Meng, C.-I. (1995). Cusp low-energy ion cutoffs: A survey and implications for merging. J. Geophys. Res. 100, 21943–21951. doi:10.1029/95ja01608
Newell, P. T., and Meng, C.-I. (1992). Mapping the dayside ionosphere to the magnetosphere according to particle precipitation characteristics. GRL 19, 609–612. doi:10.1029/92gl00404
Onsager, T. G., Kletzing, C. A., Austin, J. B., and MacKiernan, H. (1993). Model of magnetosheath plasma in the magnetosphere: cusp and mantle particles at low-altitudes. Geophys. Res. Lett. 20, 479–482. doi:10.1029/93gl00596
Onsager, T. G., Thomsen, M. F., Gosling, J. T., and Bame, S. J. (1990). Electron distributions in the plasma sheet boundary layer: time-of-flight effects. Geophys. Res. Lett. 17, 1837–1840. doi:10.1029/gl017i011p01837
Sergeev, V. A., Malkov, M., and Mursula, K. (1993). Testing the isotropic boundary algorithm method to evaluate the magnetic field configuration in the tail. J. Geophys. Res. Space Phys. 98 (5), 7609–7620. doi:10.1029/92JA02587
Shirai, H., Maezawa, K., Fujimoto, M., Mukai, T., Yamamoto, T., Saito, Y., et al. (1997). Drop-off of the polar rain flux near the plasma sheet boundary. J. Geophys. Res. 102, 2271–2278. doi:10.1029/96ja02600
Sotirelis, T., Korth, H., Hsieh, S.-Y., Zhang, Y., Morrison, D., and Paxton, L. (2013). Empirical relationship between electron precipitation and far-ultraviolet auroral emissions from DMSP observations. J. Geophys. Res. Space Phys. 118, 1203–1209. doi:10.1002/jgra.50157
Sotirelis, T., Newell, P., Meng, C. I., and Hairston, M. (1999). Low-altitude signatures of magnetotail reconnection. J. Geophys. Res. Space Phys. 104 (8), 17311–17321. doi:10.1029/1999ja900116
Sotirelis, T., and Newell, P. T. (2000). Boundary-oriented electron precipitation model. J. Geophys. Res. Space Phys. 105 (8), 18655–18673. doi:10.1029/1999JA000269
Takahashi, K., and Hones, E. W. (1988). ISEE 1 and 2 observations of ion distributions at the plasma sheet-tail lobe boundary distributions at the plasma sheet-tail lobe boundary. J. Geophys. Res. 93, 8558–8582. doi:10.1029/ja093ia08p08558
Keywords: auroral particle precipitation, reconnection, upflow, particle spectra, reconnection flows, magnetosphere/ionosphere interactions, auroral ionosphere
Citation: Sotirelis TS, Gjerloev JW and Hairston M (2023) Survey of reconnection signatures in auroral oval ion precipitation. Front. Astron. Space Sci. 10:1200263. doi: 10.3389/fspas.2023.1200263
Received: 04 April 2023; Accepted: 01 September 2023;
Published: 20 September 2023.
Edited by:
Joseph E. Borovsky, Space Science Institute (SSI), United StatesReviewed by:
Yiqun Yu, Beihang University, ChinaSheng Tian, AOS UCLA, United States
Michael G. Henderson, Los Alamos National Laboratory (DOE), United States
Copyright © 2023 Sotirelis, Gjerloev and Hairston. This is an open-access article distributed under the terms of the Creative Commons Attribution License (CC BY). The use, distribution or reproduction in other forums is permitted, provided the original author(s) and the copyright owner(s) are credited and that the original publication in this journal is cited, in accordance with accepted academic practice. No use, distribution or reproduction is permitted which does not comply with these terms.
*Correspondence: Thomas S. Sotirelis, dG9tLnNvdGlyZWxpc0BqaHVhcGwuZWR1