95% of researchers rate our articles as excellent or good
Learn more about the work of our research integrity team to safeguard the quality of each article we publish.
Find out more
ORIGINAL RESEARCH article
Front. Astron. Space Sci. , 15 May 2023
Sec. Space Physics
Volume 10 - 2023 | https://doi.org/10.3389/fspas.2023.1198739
This article is part of the Research Topic Vertical Coupling in the Atmosphere-Ionosphere-Magnetosphere System View all 21 articles
This brief report examines the ground-based total electron content (TEC) in Asian sector during August–October 2019, covering the period of a stratosphere sudden warming (SSW) occurred in Antarctica. The analysis reveals pronounced ionospheric day-to-day variability with distinct periodicities. The most dominant and long-lasting periodicities are quasi-10 days and quasi 14-day during September and October, while a quasi 6-day also present in September. The 10-day and 6-day TEC oscillations were attributed by previous studies solely to the Antarctic SSW while assuming negligible geomagnetic effects. By comparing co-located ground mesospheric wind observations, along with the interplanetary electric field (IEF) and geomagnetic activity (Kp index), we demonstrate that the quasi 14-day oscillation is mainly driven by low-level geomagnetic activities, while quasi-6 days oscillation is driven by mesospheric wind changes during the SSW. The 10-day oscillation, on the other hand, is driven by both IEF and mesospheric wind in September, but by IEF in October. These results demonstrate that low-level geomagnetic activities traditionally classified as “quiet conditions” can induce significant day-to-day oscillations in TEC, and their impacts should not be ignored when studying meteorological (e.g., SSWs) impacts on the ionosphere.
Equatorial ionosphere is known to be sensitive to both solar/geomagnetic activities such as solar flares and geomagnetic storms, and meteorological conditions such as stratosphere sudden warming (SSW) (see reviews by Liu et al, 2021; Gonchalenko et al, 2021, and references therein). Geomagnetic activities have been generally thought to affect the ionosphere when the Kp index is above 3. However, Cai et al (2021) recently showed that minor geomagnetic activity below 2 can have significant effects on the ionosphere 24 total electron content (TEC). Siddiqui et al (2021) also demonstrated, using numerical simulation, that TEC variabilities during the January 2019 stratosphere sudden warming (SSW) were dominantly caused by geomagnetic activities with low Kp (mostly below 3), rather than by the lower atmosphere forcing during the SSW. These results thus call proper treatment of the impact of “quiet” geomagnetic activities with Kp below 3 when discussing meteorological impacts on the ionosphere.
The 2019 SSW occurred in the Antarctica has attracted intensive scientific attention due to its rareness (17 years after previous SSW in 2002, compared to Arctic SSWs that occur every year or every other year in recently years). Its impacts on the ionosphere have been studied, which revealed significant quasi-6 and-10 days oscillations in the equatorial TEC (e.g., Goncharenko et al, 2020; Lin et al, 2020; Yamazaki et al, 2020; Wang et al, 2021). The oscillations were all attributed to the occurrence of the SSW in these studies, with geomagnetic forcing being neglected. The Kp index in September 2019 did experience significant periodic variations, with 47% of its values above 2, and 23% above 3 (see Figure 4B). In light of the high ionospheric sensitivity to low geomagnetic activities (Cai et al, 2021; Siddiqui et al, 2021), it is natural to ask whether the varying geomagnetic forcing contributed to the ionospheric multi-day oscillations during the 2019 SSW? To answer this question, we examine the day-to-day variability of the ground-based TEC during August–October 2019, and their connection to the geomagnetic forcing and SSW forcing.
To examine the day-to-day variation in the ionosphere and mesosphere, we make use of ground observations co-located in southeast Asia between 90E−115E as shown in Figure 1. For the ionosphere, we use GPS-TEC observations in the crest regions of the equatorial ionization anomaly (EIA) at Bako (6.5S 107E geographic, 15.9S geomagnetic) and Juri (24.5N 92.1E geographic, 15.2N geomagnetic) (Otsuka et al, 2002). The equatorial electrojet (EEJ) near dip equator are obtained at Phuket (8.1N 98.3E geographic, 1S geomagnetic) from the difference between the horizontal magnetic field component at Phuket and Kototabang (0.2S, 100.3E geographic, 9.5S geomagnetic), which is a classical method given by Rusch and Richmond (1973). For the mesosphere, we use wind observations from the meteor radar at SanYa (18.0N, 110.0E geographic) that cover altitudes of 70–110 km. Diurnal and semidiurnal tides are derived from these wind measurements.
Compared to satellite observations used in previous studies(e.g., Yamazaki et al, 2020), these ground observations offer full 24 h local time coverage each day and thus afford us to examine TEC and mesospheric wind in terms of tidal components, which makes more physical sense as tides are the direct agents for atmosphere-ionosphere coupling. Hourly data for TEC, EEJ and mesospheric wind are used in the following analysis during August 1– 30 October 2019 (DoY 213–303), which covers the Antarctic SSW event (onset at DoY 237). The variability of the geomagnetic forcing are examined using the Kp index and the interplanetary electric field (IEF).
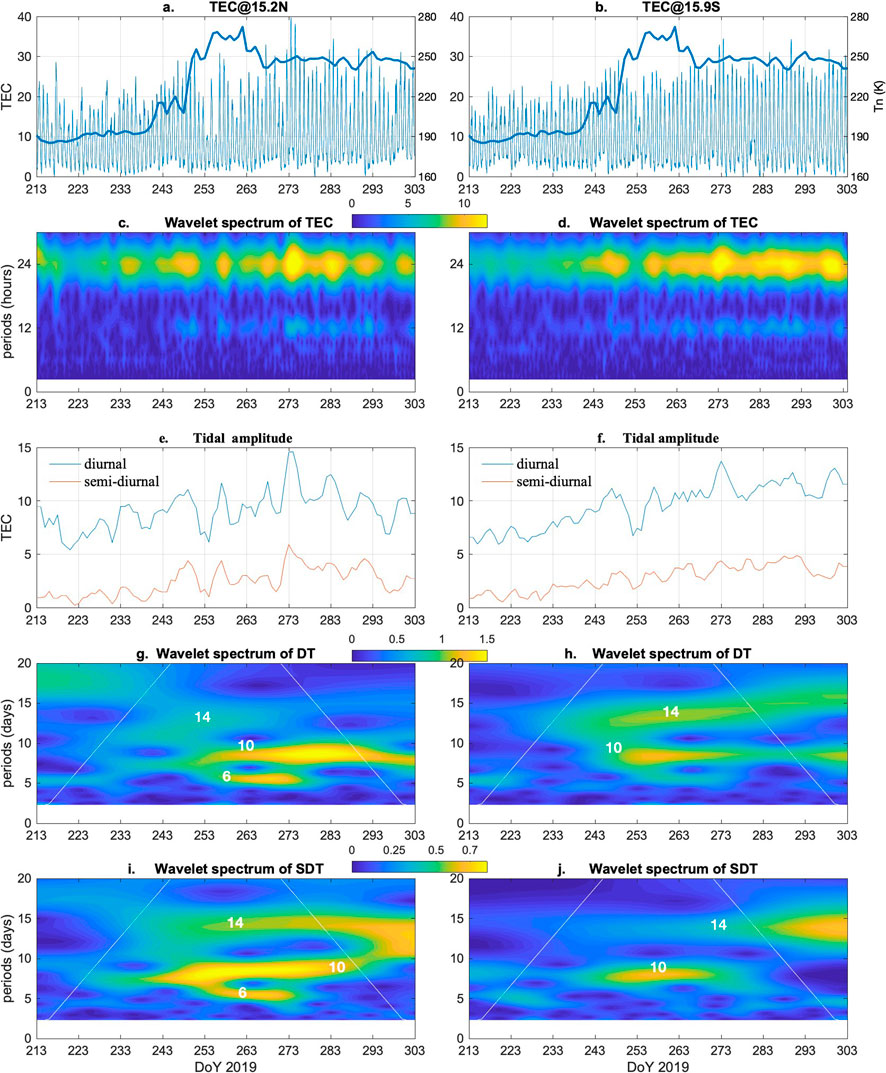
Figures 2A,B show TEC observed in the EIA northern and southern crests during DoY 213–303 2019. The stratosphere temperature at 90S at 10 hPa (from MERRA-2) is overlaid as the thick line to indicate the temporal development of the Antarctic SSW. The corresponding wavelet spectra of TEC are shown in 2c and 2d, revealing significant diurnal and semidiurnal components in both hemispheres. We extract these components using least-square fitting method with a window length of 3 days and the results are shown in Figures 3E,F. The magnitude of the diurnal component ranges between 5 and 15 TECU, about 3 times of that of the semidiurnal component. Both components exhibit the seasonal increasing trend from August towards October.

FIGURE 2. TEC in EIA crests and the day-to-day variability in its tidal components during DoY 213–303. (August 1—October 30), 2019. Row 1: TEC along with the stratosphere temperature at 90S at 10 hPa (thick line). Row 2: corresponding wavelet spectrum of TEC, revealing the diurnal and semidiurnal components. Row 3: amplitudes of the diurnal and semidiurnal tidal amplitudes extracted from TEC. Row 4: Wavelet spectrum of the diurnal (DT) and semidiurnal tidal components (SDT) in row 3, revealing dominant periods for the multi-day oscillations.

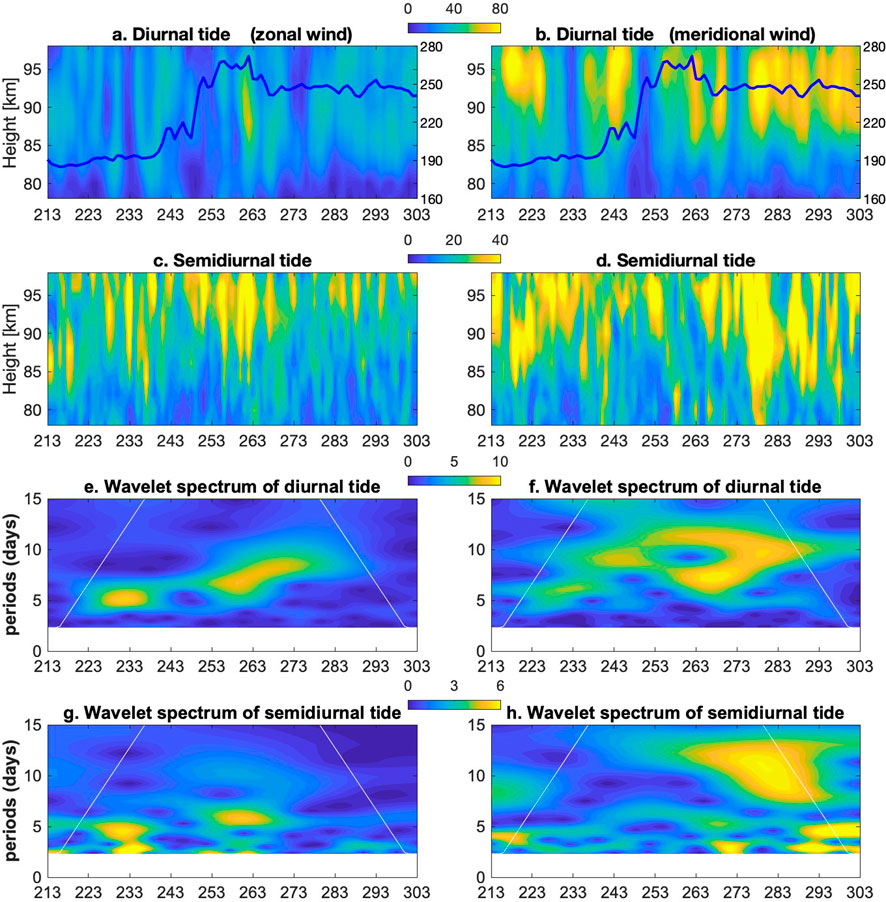
FIGURE 3. Tides in mesosphere winds (in unit of m/s) observed at SanYa during August 1—30 October 2019, with the left column for zonal wind and the right for meridional wind. Row 1: diurnal tide with the stratosphere temperature at 90S at 10 hPa is overlaid (thick line). Row 2: semidiurnal tide; third row: wavelet spectrum of diurnal tides averaged over 85–95 km; fourth row: wavelet spectrum of semidiurnal tides averaged over 85–95 km.
Riding on the seasonal trend are apparent day-to-day oscillations. As revealed in their wavelet spectra (Figures 2G–J), a prominent and persistent quasi 10-day periodicity occurs during DoY 243–293 in both hemispheres. A quasi 14-day oscillation enhances during DoY 243–303, best seen in Figures 2H,I. Furthermore, a quasi-6 days oscillation is evident in the northern crest during DoY 253–273, but is very weak in the southern crest. The weaker 6-day amplitude in the southern EIA crest was also noticed in the Antarctica SSW in year 2002 (Mo and Zhang, 2020), and was likely related to meridional wind that can cause hemispheric asymmetry in TEC.
The diurnal and semidiurnal tidal components are extracted from the meteor wind observations at SanYa and displayed in Figures 3A,C for the zonal wind, in Figures 3B,D for the meridional wind. The meridional wind generally has twice as large tidal amplitudes as that of the zonal wind, reaching over 80 m/s for the diurnal and 60 m/s for the semidiurnal components. Significant day-to-day variation are evident in the tidal amplitudes, persisting throughout most altitudes.
To quantitatively examine the periodicities and their temporal evolution, the wavelet spectrum of the tidal amplitudes averaged over 85–96 km are obtained. As shown in Figures 3E–H, a quasi 6-day periodicity occur in all tidal components, being more pronounced in the zonal wind with peaks around DoY 233 and 263 (see 3e, 3g). A quasi 10-day periodicity is prominent in the meridional wind, peaking around DoY 243 and 278 (3f). Satellite observations also showed the quasi 10-day oscillation mainly present in the meridional wind (Wang et al, 2021).
These 6- and 10-day periodicities in tides observed in tropical regions resemble those of planetary waves (PW) found in the mesosphere wind that are caused by the Antarctic SSW in 2019, such as the quasi 6-day (Yamazaki et al, 2020) and quasi 10-day waves (He et al, 2020; Wang et al, 2021), thus imply PW modulation of tides via tide-PW interaction during the SSW.
Tides propagating from the lower atmosphere are known to affect the ionospheric electric field via the wind dynamo, which directly drives the equatorial eletrojet (EEJ) around 110 km altitude. Previous studies have shown EEJ being highly sensitive to the occurrence of SSWs (e.g., Liu et al, 2011). Here we use the EEJ as an indicator for SSW to examine whether or not the 6-day and 10-day oscillations in mesospheric wind were transmitted to the ionosphere. At the same time, we examine the solar and geomagnetic forcing that could also affect the equatorial TEC.
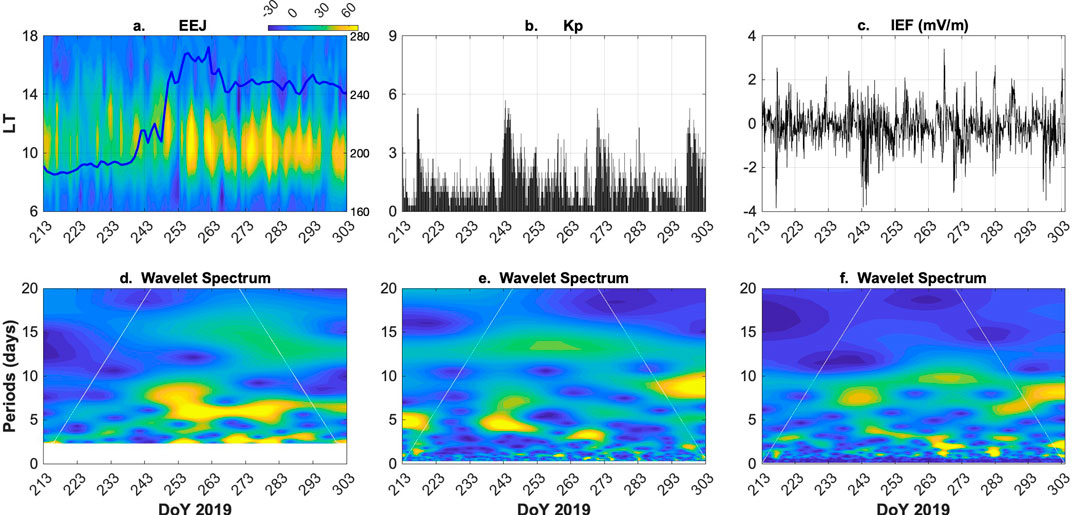
The EEJ and its wavelet spectrum are presented in Figures 4A,D, respectively. The spectrum reveals prominent quasi 6-day periodicity between DoY 253—283, and quasi 10-day periodicity between DoY 243—263. Periodicities around 2–3 days are discernible between DoY 253–293.

FIGURE 4. Top row: the equatorial electrojet (EEJ), Kp index, and the interplanetary electric field (IEF) during August 1—30 October 2019. Bottom row: the corresponding wavelet spectrum of top row. Note that panel Figure 4D is the wavelet spectrum of EEJ averaged over 10–14 LT.
The Kp index and interplanetary electric field (IEF) are used to represent the geomagnetic forcing. As shown in Figures 4B,C, both experience periodic strengthening around DoY 218, 243, 273, 298, which is a manifestation of the well-known quasi 27-day solar rotation. At shorter period, the wavelet spectrums reveal significant quasi 6-day and quasi 14-day oscillation in the Kp index (Figure 4E), with the former enhancing strongly around DoY 213 and 243, and the later persisting throughout DoY 233—283. In contrast, the IEF exhibits a persistent quasi 10-day signal during DoY 243—303. The absence of the quasi-10 days signal in Kp index demonstrate that IEF and Kp may represent different physical processes and both should be considered when examining geomagnetic activity effects on the ionosphere.
We note that solar radiation represented by the F10.7 index during the corresponding period varied between 64 and 75 solar flux unit, but with no periodic oscillations of 6-day, 10-day, or 14-day (see supplement Figure). Therefore, the solar radiation cannot be the cause for TEC oscillations discussed in this study.
The above analysis revealed prominent day-to-day variations of tides derived from ground-based TEC observations in Asian sector with major periodicities of ∼14 and ∼10 days in September–October, and ∼6 days in September 2019. To explore their potential drivers, we examined periodic variability in mesosphere tides as forcing from below, in Kp index and IEF as forcing from above. In the following, we attempt attributions for these three periodicities.
First, the ∼14-day periodicity in TEC is most likely driven by geomagnetic activity forcing represented by the Kp index. This attribution is straightforward as neither the mesospheric wind nor the IEF exhibited pronounced quasi 14-day signal. The timing of the enhanced signal in Kp during DoY 233–283 (see Figure 4E) also corresponds well with that in the TEC (see, e.g., Figure 2I). This Kp signal is likely a sub-harmonic of the ∼27-day solar rotation.
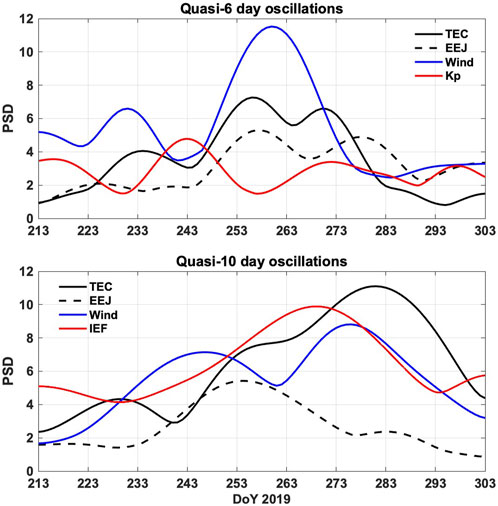
Next, we examine the ∼6- and ∼10-day periodicities. These periodicities occurred in both the mesospheric tides and the Kp index (6-day) or IEF (10-day). To better elucidate their relation to TEC oscillations, we extract the quasi 6- and 10-day signals in these parameters and compare their temporal evolution. The result is shown in Figure 5.

FIGURE 5. Upper: quasi-6 days oscillations in semidiurnal component of TEC at 15N, semidiurnal component of mesospheric zonal wind, EEJ and Kp index. Lower: quasi-10 days oscillations in diurnal component of TEC at 15N, diurnal component of mesospheric meridional wind, EEJ and IEF. Note that the PSDs are scaled arbitrarily to fit all parameters into one panel for easy comparison of their temporal variations but not for their absolute values.
As shown in the upper panel, the enhancement of ∼6-day oscillations in TEC between DOY 253–273 generally coincides with that in the EEJ and mesospheric wind. On the other hand, the ∼6-day oscillation in the Kp index is rather weak during the same interval, thus making its contribution less likely. Consequently the ∼6-day periodicity in TEC can be reasonably attributed to the mesospheric wind perturbations due to the SSW. Since the atmosphere-ionosphere coupling processes are largely dominated by tidal-driven electrodynamics, our tidal analysis strengthens the argument of the SSW origin of the ∼6-day periodicity of TEC in previously reported studies (e.g., Lin et al, 2020; Yamazaki et al, 2020) (which did not examine the tides). The co-location of TEC and mesosphere wind measurements in the same longitude sector in our study demonstrate their close connection at regional scales.
The lower panel of Figure 5 shows the quasi 10-day oscillations in TEC, EEJ, wind and IEF. The prominent 10-day oscillation in TEC starts growing around DoY 243 and peaks around DoY 283. The ∼10-day signal in IEF is strong during DoY 233–293, with its peak around DoY 273. The mesosphere wind also has a strong 10-day signal with peaks around DoY 243 and DoY 278. On the other hand, the EEJ only peaks around DoY 253, which is quite different from that of TEC. Since mesospheric wind affects the ionosphere TEC mainly via the wind dynamo that also affects the EEJ, the missing 10-day signal in EEJ after DoY 273 may suggest that the ∼10-day signal in the mesosphere was not transmitted into the ionosphere wind dynamo in this longitudinal sector (we have no immediate explanation at the moment). Consequently, it seems reasonable to attribute the 10-day TEC signal before DoY 273 to Both the SSW-induced mesospheric wind perturbation and the IEF, but to IEF alone after DoY 273. Significant geomagnetic impacts on the TEC in September 2019 was also reported by Aa et al (2021). Wang et al (2021) attributed the TEC 10-day oscillation before DoY 270 totally to lower atmosphere forcing by the SSW, but did not consider geomagnetic forcing from above.
The mechanism of IEF affecting equatorial TECs could be via thermosphere wind perturbations driven by Joule heating and/or prompt penetration electric field (PPEF) (e.g., Anghel et al, 2007), though detailed processes warrant further study and is out of the scope of current work. For our current case, both processes may have contributed before DoY 273, while PPEF was probably missing afterwards as implied by the missing 10-day signal in EEJ after DoY 273. In any case, to quantify the relative contribution from geomagnetic activity forcing and lower atmosphere forcing, one would need to carry out numerical experiments similar to that done in Hagan et al (2015); Pedatella (2016); Siddiqui et al (2021). However, we note that to capture impacts of low geomagnetic activities on the ionosphere requires models to have both good representation of PPEF and high model sensitivity to low-level geomagnetic forcing. Both features are missing in currently available whole atmosphere models like WACCM-X, WAM and GAIA (Jin et al, 2011; Fang et al, 2018; Liu et al, 2018). The MAGE model that self-consistently couples the solar wind—magnetosphere-ionosphere-thermosphere may provide a more accurate representation of the PPEF in the near future (Pham et al, 2022).
Publicly available datasets were analyzed in this study. This data can be found here: https://archive.iii.kyushu-u.ac.jp/public/ZX3QQA1Je4CAd04B84OAS-ll9UPxeM6CH42KnaRHsl9n.
HL initiated this study, analyzed the data and wrote up the manuscript. YO, KH, and TY provided the TEC, EEJ, and meteor wind data, respectively. All authors contributed to the interpretation of the results.
This work is supported by the JSPS KAKENHI grants 18H01270, 17KK0095, and JRPs-LEAD with DFG (JPJSJPR 20181602). KH was partially supported by the JSPS KAKENHI Grant Number 20H00197.
We thank M. Kogure for helping with part of data processing.
The authors declare that the research was conducted in the absence of any commercial or financial relationships that could be construed as a potential conflict of interest.
All claims expressed in this article are solely those of the authors and do not necessarily represent those of their affiliated organizations, or those of the publisher, the editors and the reviewers. Any product that may be evaluated in this article, or claim that may be made by its manufacturer, is not guaranteed or endorsed by the publisher.
Aa, E., Zhang, S.-R., Erickson, P. J., Coster, A. J., Goncharenko, L. P., Varney, R. H., et al. (2021). Salient midlatitude ionosphere-thermosphere disturbances associated with SAPS during a minor but geo-effective storm at deep solar minimum. J. Geophys. Res. (Space Phys. 126, e29509. doi:10.1029/2021JA029509
Anghel, A., Anderson, D., Maruyama, N., Chau, J., Yumoto, K., Bhattacharyya, A., et al. (2007). Interplanetary electric fields and their relationship to low-latitude electric fields under disturbed conditions. J. Atmos. Solar-Terrestrial Phys. 69, 1147–1159. doi:10.1016/j.jastp.2006.08.018
Cai, X., Burns, A. G., Wang, W., Qian, L., Solomon, S. C., Eastes, R. W., et al. (2021). Variations in thermosphere composition and ionosphere total electron content under geomagnetically quiet conditions at solar minimum. Geophys. Res. Lett. 48. doi:10.1029/2021gl093300
Fang, T.-W., Fuller-Rowell, T., Yudin, V., Matsuo, T., and Viereck, R. (2018). Quantifying the sources of ionosphere day-to-day variability. J. Geophys. Res. (Space Phys. 123, 9682–9696. doi:10.1029/2018JA025525
Gonchalenko, L., Harvey, L., Liu, H., and Pedatella, N. (2021). “Sudden stratospheric warming impacts on the ionosphere-thermosphere system: A review of recent progress,” in Space Physics and aeronomy collection volume 3: Ionosphere dynamics and applications, geophysical monograph 260. Editors C. Huang, and G. Lu (Washington, United States: American Geophysical Union).
Goncharenko, L. P., Harvey, V. L., Greer, K. R., Zhang, S. R., and Coster, A. J. (2020). Longitudinally dependent low-latitude ionospheric disturbances linked to the antarctic sudden stratospheric warming of september 2019. J. Geophys. Res. (Space Phys. 125, e28199. doi:10.1029/2020JA028199
Hagan, M. E., Hausler, K., Lu, G., Forbes, J. M., and Zhang, X. (2015). Upper thermospheric responses to forcing from above and below during 1-10 April 2010: Results from an ensemble of numerical simulations. J. Geophys. Res. (Space Phys. 120, 3160–3174. doi:10.1002/2014JA020706
He, M., Chau, J. L., Forbes, J. M., Thorsen, D., Li, G., Siddiqui, T. A., et al. (2020). Quasi-10-Day wave and semidiurnal tide nonlinear interactions during the southern hemispheric SSW 2019 observed in the northern hemispheric mesosphere. Geophys. Res. Lett. 47, e91453. doi:10.1029/2020GL091453
Jin, H., Miyoshi, Y., Fujiwara, H., Shinagawa, H., Terada, K., Terada, N., et al. (2011). Vertical connection from the tropospheric activities to the ionospheric longitudinal structure simulated by a new Earth’s whole atmosphere-ionosphere coupled model. J. Geophys. Res. (Space Phys. 116, A01316. doi:10.1029/2010JA015925
Lin, J. T., Lin, C. H., Rajesh, P. K., Yue, J., Lin, C. Y., and Matsuo, T. (2020). Local-time and vertical characteristics of quasi-6-day oscillation in the ionosphere during the 2019 antarctic sudden stratospheric warming. Geophys. Res. Lett. 47, e90345. doi:10.1029/2020GL090345
Liu, H.-L., Bardeen, C. G., Foster, B. T., Lauritzen, P., Liu, J., Lu, G., et al. (2018). Development and validation of the whole atmosphere community climate model with thermosphere and ionosphere extension (WACCM-X 2.0). J. Adv. Model. Earth Syst. 10, 381–402. doi:10.1002/2017MS001232
Liu, H., Yamamoto, M., Tulasi Ram, S., Tsugawa, T., Otsuka, Y., Stolle, C., et al. (2011). Equatorial electrodynamics and neutral background in the Asian sector during the 2009 stratospheric sudden warming. J. Geophys. Res. (Space Phys. 116, A08308. doi:10.1029/2011JA016607
Liu, H., Yamazaki, Y., and Lei, J. (2021). “Day-to-day variability of the thermosphere and ionosphere,” in Space Physics and aeronomy collection volume 4: Upper atmosphere dynamics and energetics,Geophysical monograph 261. Editors W. Wang, and Y. Zhang (Washington, United States: American Geophysical Union).
Mo, X. H., and Zhang, D. H. (2020). Six-day periodic variation in equatorial ionization anomaly region. J. Geophys. Res. (Space Phys. 125, e28225. doi:10.1029/2020JA028225
Otsuka, Y., Ogawa, T., Saito, A., Tsugawa, T., Fukao, S., and Miyazaki, S. (2002). A new technique for mapping of total electron content using GPS network in Japan. Earth, Planets Space 54, 63–70. doi:10.1186/bf03352422
Pedatella, N. M. (2016). Impact of the lower atmosphere on the ionosphere response to a geomagnetic superstorm. Geophys. Res. Lett. 43, 9383–9389. doi:10.1002/2016GL070592
Pham, K. H., Zhang, B., Sorathia, K., Dang, T., Wang, W., Merkin, V., et al. (2022). Thermospheric density perturbations produced by traveling atmospheric disturbances during August 2005 storm. J. Geophys. Res. (Space Phys. 127. doi:10.1029/2021JA030071
Rusch, C. M., and Richmond, A. D. (1973). The relationship between the structure of the equatorial anomaly and the strength of the equatorial electrojet. J. Atmos. Solar-Terrestrial Phys. 35, 1171–1180. doi:10.1016/0021-9169(73)90013-5
Siddiqui, T. A., Yamazaki, Y., Stolle, C., Maute, A., Lastoviˇcka, J., Edemskiy, I. K., et al. (2021). ˇ understanding the total electron content variability over europe during 2009 and 2019 SSWs. J. Geophys. Res. (Space Phys. 126, e28751. doi:10.1029/2020JA028751
Wang, J. C., Palo, S. E., Forbes, J. M., Marino, J., Moffat-Griffin, T., and Mitchell, N. J. (2021). Unusual quasi 10-day planetary wave activity and the ionospheric response during the 2019 southern hemisphere sudden stratospheric warming. J. Geophys. Res. (Space Phys. 126, e29286. doi:10.1029/2021JA029286
Keywords: SSW, day-to-day variability, ionosphere perturbation, atmosphere-ionosphere coupling, atmosphere tides
Citation: Liu H, Otsuka Y, Hozumi K and Yu T (2023) Day-to-day variability of the equatorial ionosphere in Asian sector during August–October 2019. Front. Astron. Space Sci. 10:1198739. doi: 10.3389/fspas.2023.1198739
Received: 02 April 2023; Accepted: 03 May 2023;
Published: 15 May 2023.
Edited by:
Yongliang Zhang, Johns Hopkins University, United StatesReviewed by:
Hyosub Kil, Johns Hopkins University, United StatesCopyright © 2023 Liu, Otsuka, Hozumi and Yu. This is an open-access article distributed under the terms of the Creative Commons Attribution License (CC BY). The use, distribution or reproduction in other forums is permitted, provided the original author(s) and the copyright owner(s) are credited and that the original publication in this journal is cited, in accordance with accepted academic practice. No use, distribution or reproduction is permitted which does not comply with these terms.
*Correspondence: Huixin Liu, bGl1Lmh1aXhpbi4yOTVAbS5reXVzaHUtdS5hYy5qcA==
Disclaimer: All claims expressed in this article are solely those of the authors and do not necessarily represent those of their affiliated organizations, or those of the publisher, the editors and the reviewers. Any product that may be evaluated in this article or claim that may be made by its manufacturer is not guaranteed or endorsed by the publisher.
Research integrity at Frontiers

Learn more about the work of our research integrity team to safeguard the quality of each article we publish.