 Sina Sadeghzadeh
 Jian Yang
 Frank Toffoletto
 Richard Wolf
 Ameneh Mousavi
 Chih-Ping Wang
- 1Department of Earth and Space Sciences, Southern University of Science and Technology, Shenzhen, China
- 2Physics and Astronomy Department, Rice University, Houston, TX, United States
- 3Department of Atmospheric and Oceanic Sciences, University of California, Los Angeles, CA, United States
Introduction: Accurate characterization of the plasma sheet source population in the ring current region and its outer boundary at geosynchronous orbit is crucial for understanding the dynamics of the Earth’s magnetosphere. The interaction between the ring current and plasma populations from the ionosphere is a focus of extensive research.
Methods: We used the Rice Convection Model (RCM) to simulate the transient meso-scale injections of fast flows or plasma sheet bubbles from the outer boundary into the inner magnetosphere and the associated impacts on the ionosphere. We compared our simulation results of the average properties of bulk plasma access to geosynchronous orbit to a number of empirical models. We also examined the role of plasma sheet bubbles in forming field-aligned currents (FACs).
Results: Our modeling results show that impulsive plasma sheet injections dramatically alter the average distribution of FACs in the ionosphere. We found both quantitative and qualitative agreements and disagreements when comparing our simulation results to empirical models. Furthermore, we demonstrated that several discrete auroral structures can be identified in the nightside ionosphere in accordance with theupward FACs.
Discussion: The significance of plasma sheet bubbles in modifying the averageplasma properties at geosynchronous orbit and FACs in the ionosphere is highlighted by oursimulation findings, offering novel understandings into the dynamics of Earth's magnetosphere,and emphasizing the necessity for further research in this field.
1 Introduction
The transport of particles and energy in the coupled system of solar wind-magnetosphere-ionosphere (SMI) during different geomagnetic conditions is still a debated topic in space science (Borovsky et al., 2020). The transport of hot magnetotail plasma to the central and inner (inside of
Field-aligned currents (FACs) play a key role in exchanging energy and momentum in the coupled magnetosphere-ionosphere system. Under quasi-steady conditions, the density of FACs in the closed magnetic field line region is related to the distribution of the flux tube volume (V) and plasma pressure (P) in the magnetosphere (Vasyliunas, 1970). While plasma distribution is an important factor in determining both region-1 and 2 FACs, its impact is generally considered to be more significant for region-2 FACs, which are primarily driven by the cross-tail electric field and are sensitive to the plasma sheet density and pressure distribution. In the northern hemisphere, the high-latitude region-1 FACs flow downward into the ionosphere at dawn and upward out of it at dusk. Whereas the region-2 FACs flow in the opposite directions equatorward of the region-1 currents (e.g., Zmuda and Armstrong, 1974; Iijima and Potemra, 1976a; 1976b). FAC distribution and intensity are found to be influenced by factors other than the plasma distribution in the magnetosphere, such as interplanetary magnetic field (IMF) orientation (e.g., Milan et al., 2000; Weimer, 2001), solar wind pressure (e.g., Edwards et al., 2017), and ionospheric conductance (Korth et al., 2010). Several studies have been conducted to determine the origins and characteristics of regions 1 and 2 FACs. In most of these studies, magnetic field data from spacecraft are used to calculate FACs at the ionospheric altitude. Observations from the THEMIS mission led Liu et al. (2016) to conclude that the region-1 and 2 Birkeland currents on the nightside have plasma sheet origins, likely related to pressure buildup or flow vortices. Their finding is consistent with the earlier work of Sato and Iijima (1979), who also revealed the source and distribution of region-1 and 2 currents. Apart from large-scale (
Our study focuses on two main topics: 1) particle fluxes and bulk plasma properties at geosynchronous orbit, and 2) the global ionospheric distribution of FACs and auroral morphology. To this end, we employ the inertial version of the Rice Convection Model (Yang et al., 2019) to simulate the average configuration of magnetosphere-ionosphere coupled system that includes the effects of fast plasma flows. In our simulation, sporadic, low-entropy bubble injections are imposed from the high latitude boundary of modeling region to alleviate the so-called “pressure-balance crisis” (Erickson and Wolf, 1980; Pontius and Wolf, 1990). This setup resembles a more realistic magnetospheric condition rather than a purely large-scale convection (Yang et al., 2014a). We used the same time-, local-time-, and energy-dependent boundary conditions as Sadeghzadeh et al. (2021) - henceforth referred to as Paper 1–to model random bubble injections through the nightside boundary. There are three low-entropy plasma flow channels with a width of 0.67 h in magnetic local time (MLT) that are randomly positioned between 21 and 3 h in MLT and operate over three different fixed periods of time (tens of minutes). Table 1 presents a summary of the similarities and differences between the RCM configuration used in this study and the one described in Paper 1. We conducted three separate 2-h runs of the RCM simulation, each with a different profile for the local time and degree of entropy depletion in the plasma flow channels. It is worth noting that there is no advantage of one run over another, but we chose to run the simulations multiple times and average the results to obtain a more accurate statistical picture for comparison with observational data. This decision was motivated by our observation that the mapping gets distorted when
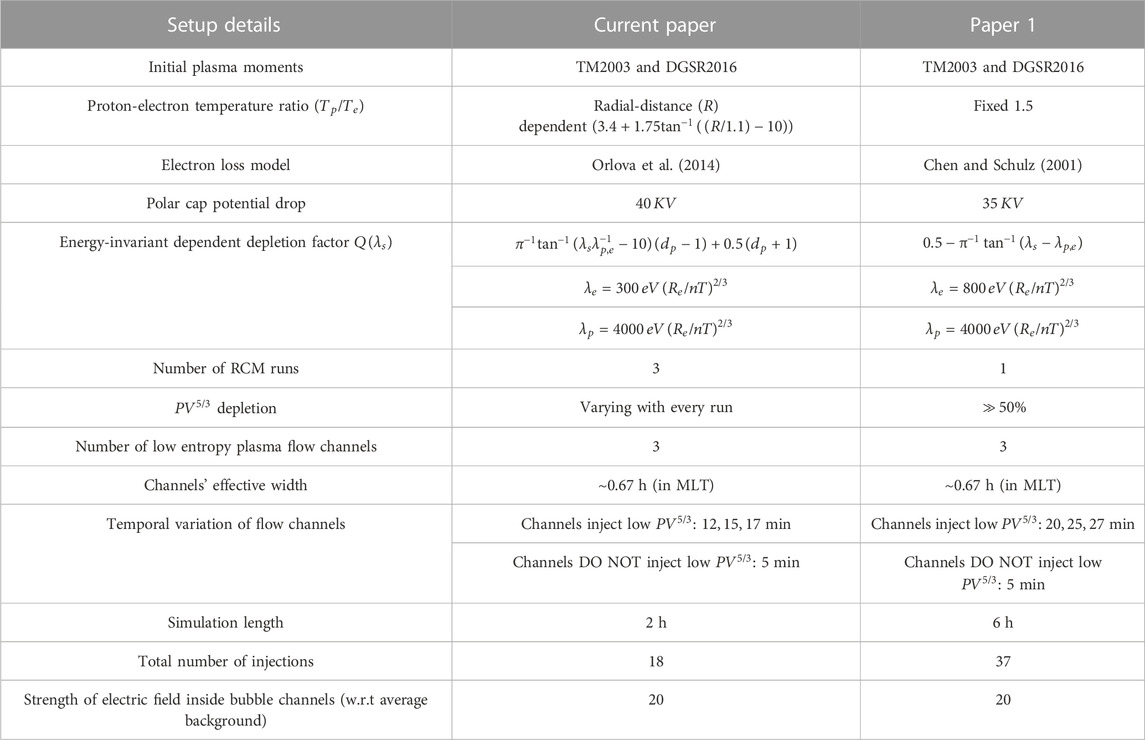
TABLE 1. RCM setup scheme in Paper 1 and the current paper.
2 Simulation setup
We describe our simulation setup in this section, including the initial and boundary conditions as well as the electron precipitation model. The initial plasma moments are taken from two empirical models, TM2003 and DGSR2016. The TM2003 (DGSR2016) model is based on Geotail (THEMIS) observations and is intended to provide bulk ions (electrons) properties at distances of
1. The radial-distance-dependent proton-to-electron temperature ratio (i.e.,
2. This study uses Orlova et al. (2014) electron loss model. They developed a comprehensive model of electron lifetimes by analyzing wave parameters from Combined Release and Radiation Effects Satellite (CRRES) observations. In contrast, in Paper 1, the electron loss model of Chen and Schulz (2001) was used, which assumed that the scattering rate is less than everywhere strong but is dependent on MLT. We found that using Orlova’s model, we can achieve much better consistency for electron distribution between our simulation results and the DGSR2016 empirical model at distance of
3. We have also modified the energy-invariant-dependent depletion function (
4. Because we are comparing findings of RCM simulation of idealized bubble injections to data/observations, we chose to run three RCM simulations—each lasting two hours—with the same setup but different
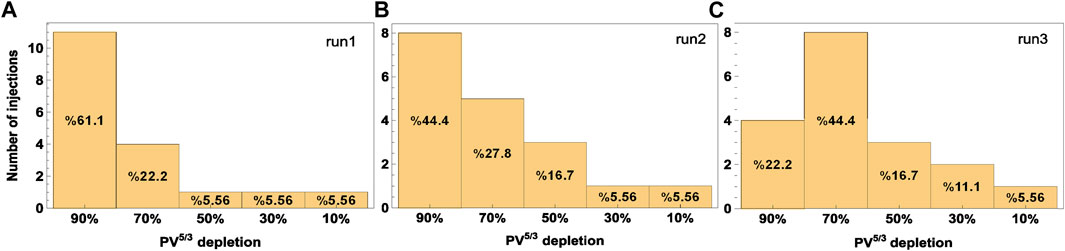
FIGURE 1. The three RCM simulations denoted by labels (A, B), and (C) and based on profiles of PV5/3 depletions. In panel (A), which represents run1, approximately 61% of all bubble injections had an average entropy parameter depletion (i.e., dp) of 90%.
It is worth noting that the magnetospheric particle distribution in the RCM modeling region follows the transport equation (i.e.,
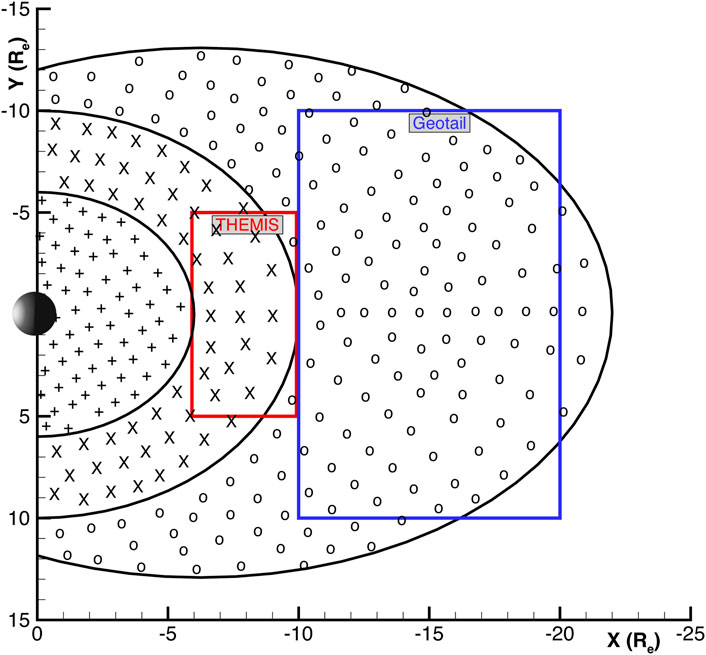
FIGURE 2. Different regions in the equatorial plane, each of which represents a different initial temperature and density distribution. The regions with symbols of circle (i.e., “o” inside
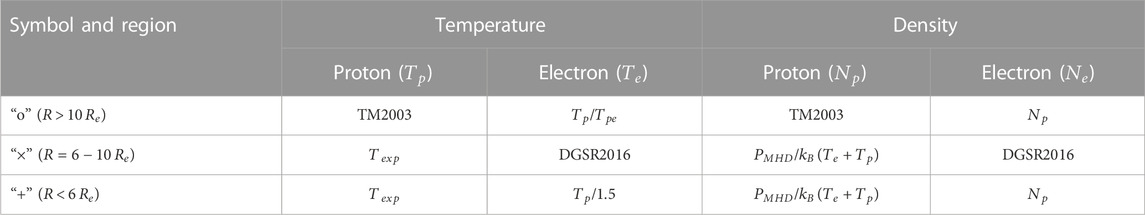
TABLE 2. The initial density and temperature settings inside the RCM modeling region.
3 Results
To demonstrate that our simulation results are consistent with the climatology of the plasma sheet, we compare our obtained results to observational data using two benchmarks. In Section 3.1, we examine the consistency of 1) calculated velocity probability density functions (PDFs) with Geotail and THEMIS observations, and 2) calculated plasma moments with the empirical models DGSR2016 and TM2003. We then analyze geosynchronous plasma moments and fluxes in Section 3.2 and ionospheric FAC distributions in Section 3.3. Note that going forward, all the parameters are averaged twice: once over the course of the 2-h RCM simulation, and then again, over the three RCM runs.
3.1 Constraint validation
Figure 3 compares the simulated PDFs of velocities (within the rectangular-shaped regions in Figure 1) to THEMIS (
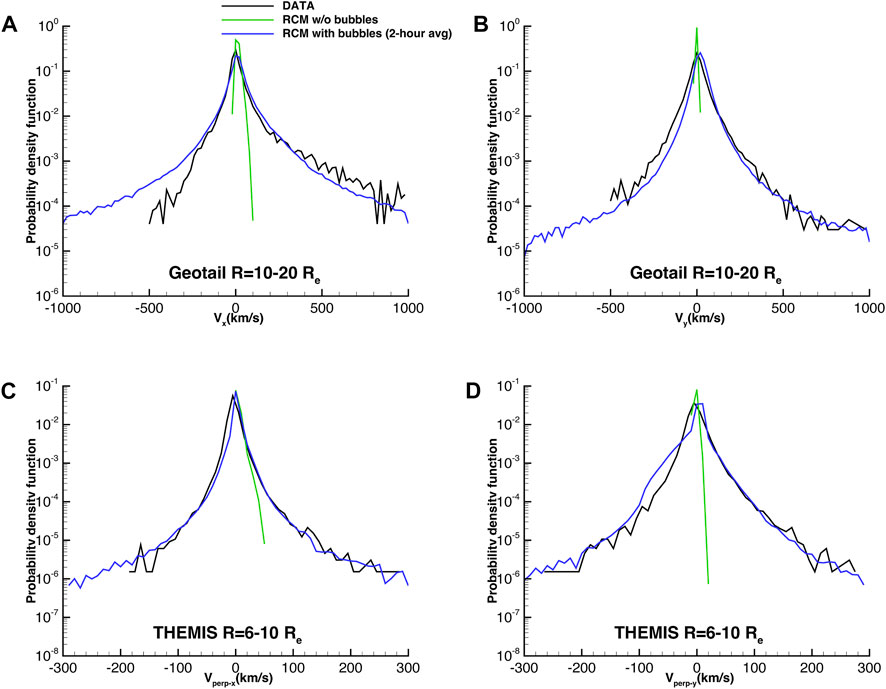
FIGURE 3. The averaged probability density functions (PDFs) of velocities from the RCM simulation with bubbles compared with Geotail observations of (A)
In Figure 4, we compare the calculated plasma moments to those of the DGSR2016 and TM2003 models along the noon-midnight meridian (i.e., Y = Z = 0) within
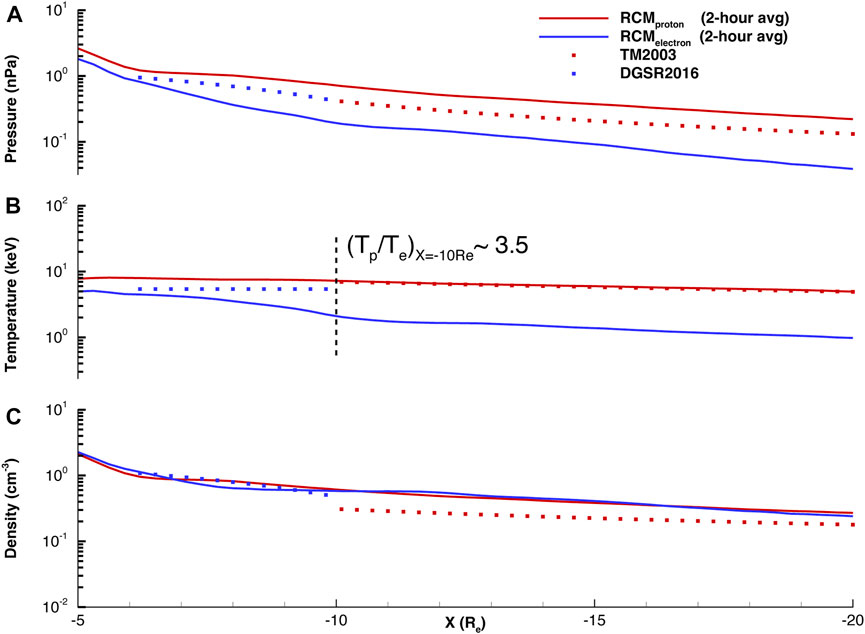
FIGURE 4. The average proton (solid red lines) and electron (solid blue lines) (A) pressure (B) temperature, and (C) density calculated by RCM are compared to the corresponding predictions made by the TM2003 (red dots) and DGSR2016 (blue dots) models. RCM estimates a 2-h average proton-to-electron temperature ratio of ∼3.5 at
3.2 Geosynchronous altitudes
Figure 5 illustrates the average variability of entropy parameter
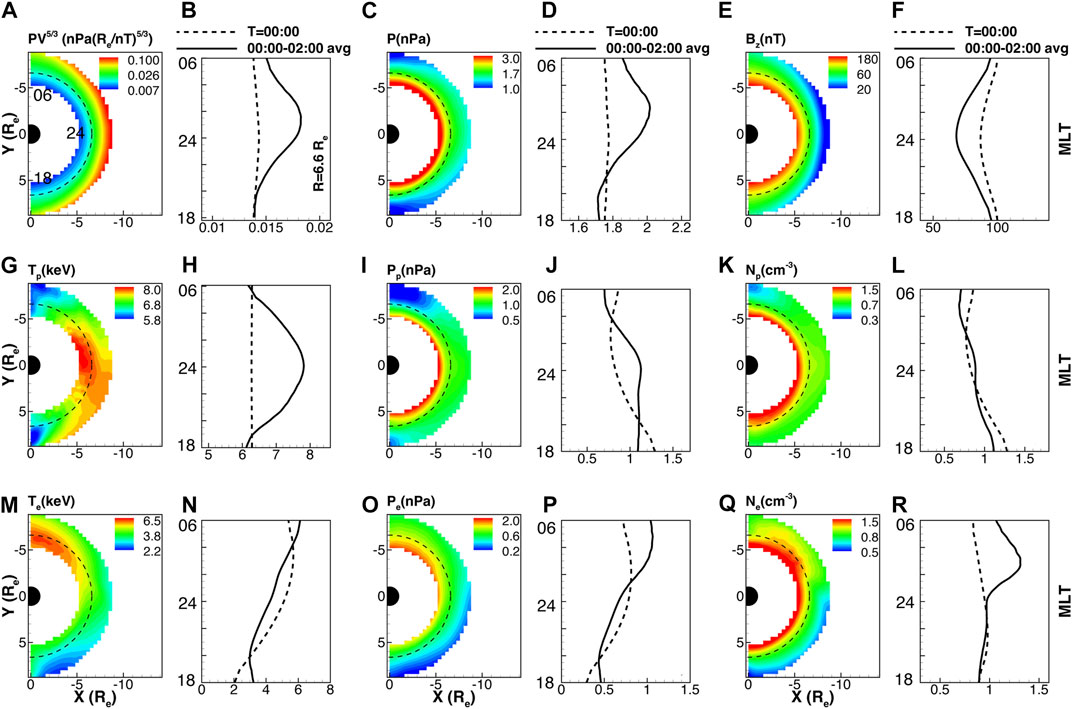
FIGURE 5. Equatorial distribution of RCM calculated (A) entropy parameter
Figure 6 compares our Figure 5 results to those from the Magnetospheric Plasma Analyzer (MPA) data onboard the Los Alamos National Laboratory’s (LANL) geosynchronous satellites (Denton et al., 2005). Their analyses include plots of averaged bulk plasma parameters (pressure, number density, and temperature) as a function of Kp and local time. To facilitate comparison, the original plots from Denton et al. (2005) (Figures 6A–F) are adapted and displayed along with RCM results in the smaller windows (labeled with RCM). The RCM’s estimated peak values in hot proton moments are roughly consistent with those measured by the MPA model (Figures 6A, C, E). However, the corresponding MLT locations do not exactly match the observed profiles, nor does a dawn-dusk asymmetry. The RCM calculated proton and electron number densities peak at the dusk and dawn terminators, respectively, whereas the peak proton and electron number densities can be seen around the midnight and midnight-to-post-midnight sectors based on MPA observations. Furthermore, the RCM computed electron temperature and pressure profiles do not satisfactorily fall within the range of the MPA observations. For example, around magnetic midnight, our simulation yields
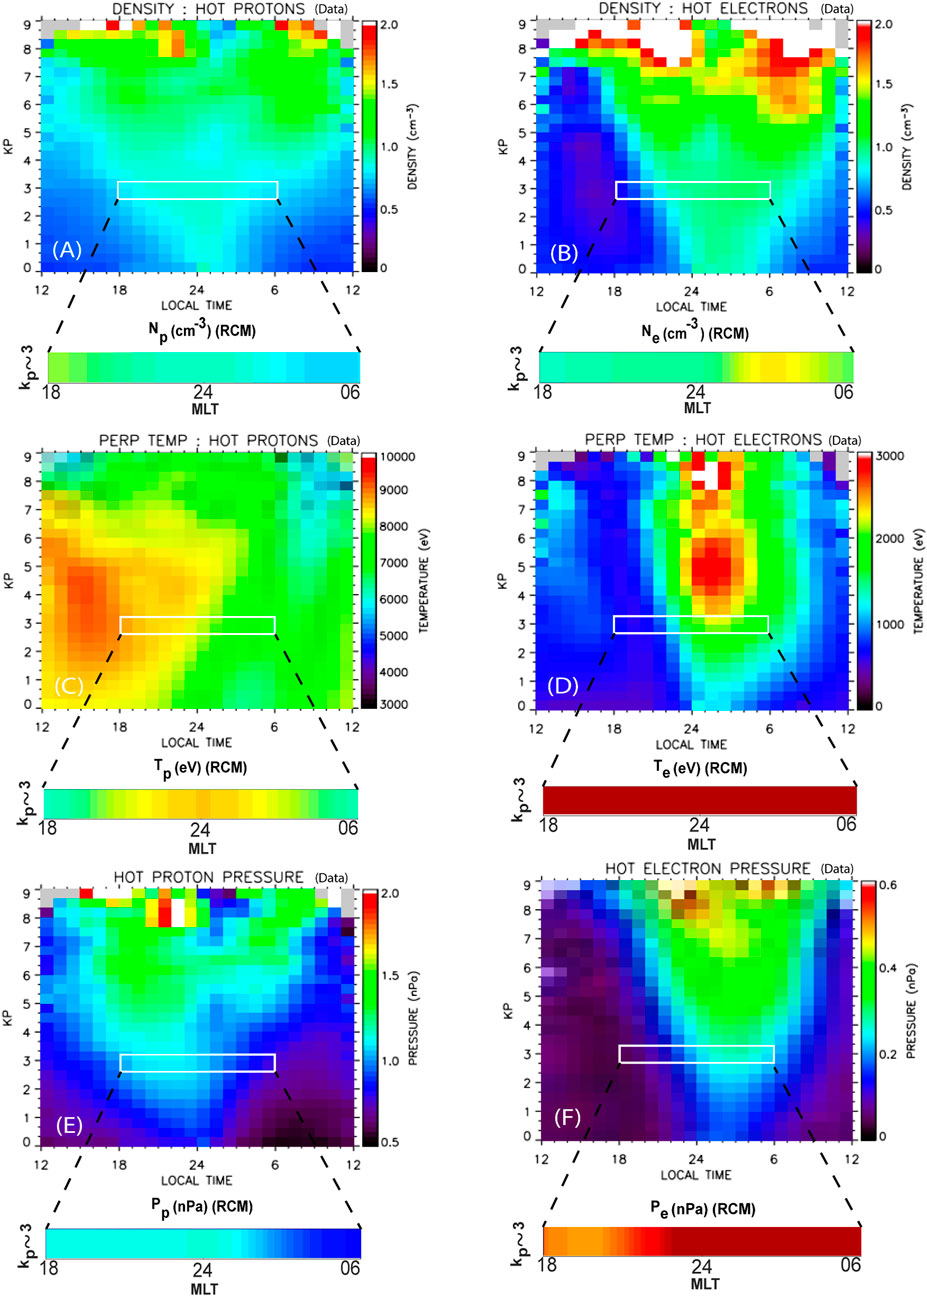
FIGURE 6. The average values of proton and electron (A,B) density (C,D) perpendicular temperature, and (E,F) pressure as a function of Kp index and magnetic local time based on MPA data (Denton et al., 2005) are compared against RCM calculated counterparts. The white box indicates the nightside region (MLT = 18–06) under a moderate geomagnetic condition with Kp∼3. The RCM results are comparable to the data within the white boxes. (A–F) are adapted from Denton et al. (2005).
Lemon and O’Brien (2008) developed an empirical model of bulk plasma properties based on solar wind parameters (e.g., solar wind flow pressure and the interplanetary magnetic field) and MPA data from geosynchronous LANL satellites. The MPA data in their model spans the years 1990–2005, and they have compiled hourly averages of the data during that time. Their model establishes the local time variation of proton and electron densities and temperatures by a user-specified solar wind parameter in the energy range of the MPA instrument, i.e., 1 eV–40 keV. Figure 7 presents the original plots from their model in which data are binned by MLT and IMF
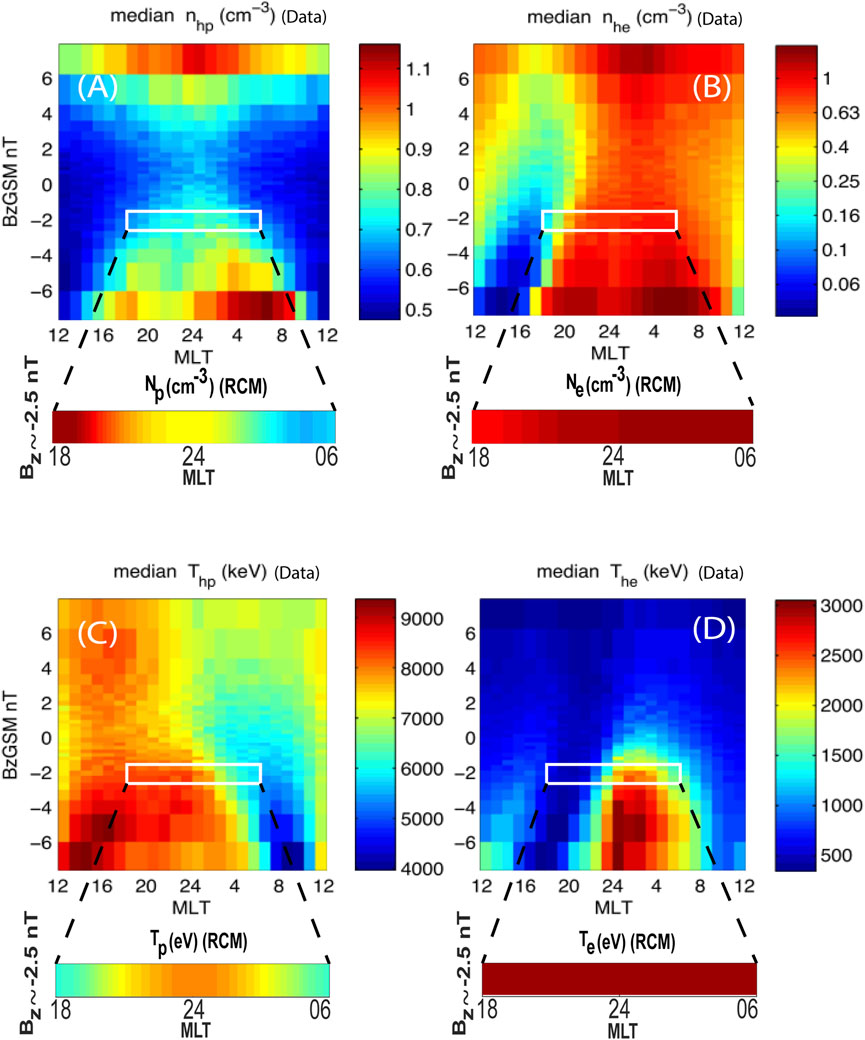
FIGURE 7. The average values of proton and electron (A,B) density and (C,D) temperature as a function of
Figures 8, 9 show, respectively, the RCM results of averaged differential proton and electron fluxes at different energy channels up to 300 keV near geosynchronous orbit. As with the moment profiles, the dawn-dusk asymmetry in proton and electron differential fluxes persists (e.g., Korth et al., 1999; Jordanova et al., 2006). In general, the energy-dependent proton and electron fluxes tend to be enhanced at dusk and dawn sectors, respectively. The high-energy plasma sheet protons follow gradient/curvature drift paths and can access the dayside through the dusk. However, low energy protons (i.e., 5–10 keV), as shown in Figure 8D, exhibit a dawnside shift in the differential flux profile. In fact, protons with energies ranging from a few eV to several keV
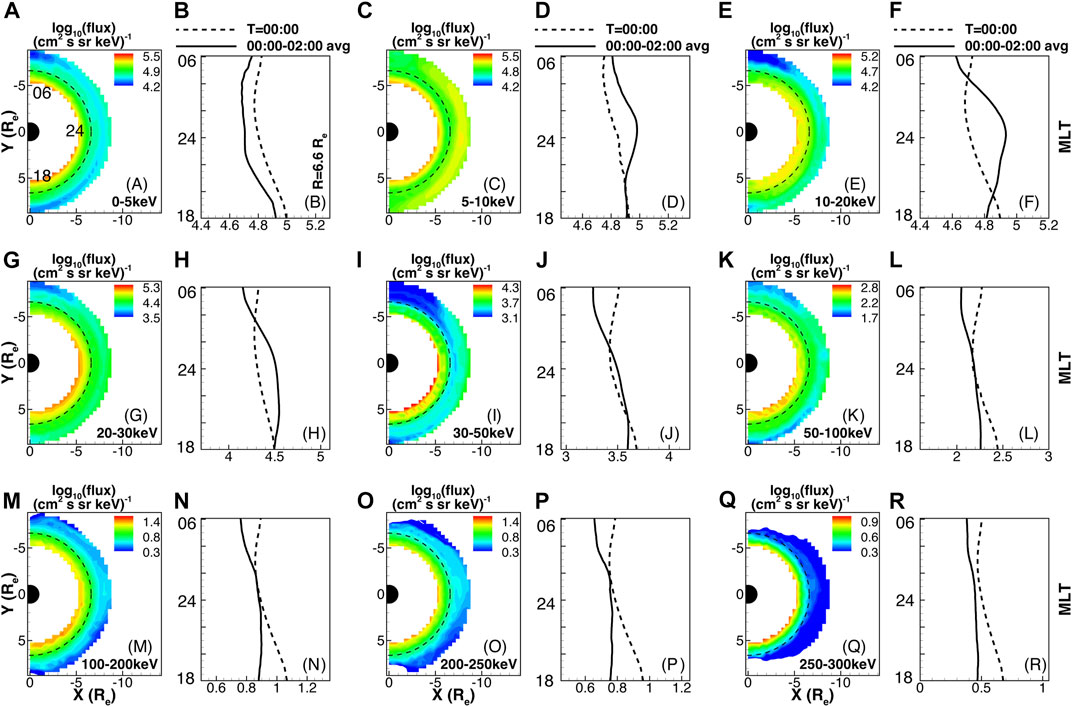
FIGURE 8. The initial (T = 00:00) and average variation of RCM calculated proton differential flux (in
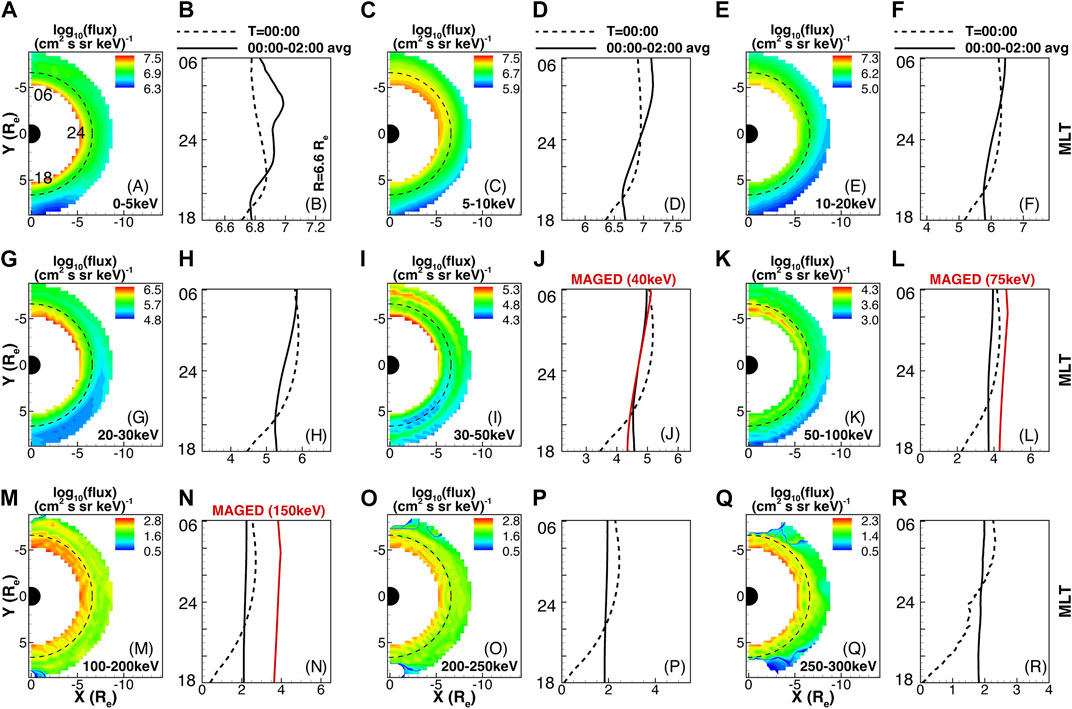
FIGURE 9. Similar to Figure 8, but for electrons. The energy ranges considered are as follows: 0–5 (A, B), 5–10 (C, D), 10–20 (E, F), 20–30 (G, H), 30–50 (I, J), 50–100 (K, L), 100–200 (M, N), 200–250 (O, P), and 250–300 keV (Q, R). The empirical model of electron flux at energies of 40 (J), 75 (L), and 150 keV (N), based on GOES-13 MAGED data are also displayed as red lines using the empirical equation 3 from Sillanpää et al. (2017).
The low energy electrons (i.e., a few keV) are mostly governed by the corotation electric field, resulting in a counterclockwise motion of the electrons around the Earth. Thus, the flux dominated by the lower energy tail of the plasma sheet electrons is elevated near the dawn sector (e.g., Figures 9B, D). On the other hand, the high energy electrons, which are influenced by the gradient/curvature drifts, flow westward along closed drift paths. We also compared the RCM calculated electron differential fluxes at geosynchronous orbit to measurements from the Geostationary Operational Environmental Satellite (GOES-13) MAGnetospheric Electron Detector (MAGED) instrument at three energies of 40, 75, and 150 keV, shown in Figures 9J, L, N (Sillanpää et al., 2017). It should be noted that the MAGED energy values are the midpoints of three energy ranges (i.e., 30–50, 50–100, and 100–200 keV). The RCM computed differential electron flux shows reasonable consistency with those of the empirical flux at the energy channels of 30–50 (Figure 9J) and 50–100 keV (Figure 9L). The simulated flux at energies of 150 keV is lower than that of the MAGED model, most likely due to the exclusion of near-Earth wave-particle interactions. The differential fluxes of electrons at energies of 40, 75, and 150 keV simulated by RCM (measured by MAGED) in
In addition, as shown in Figure 10, we compared the electron and proton differential fluxes in the RCM simulation to those in the Denton et al. (2015) model along geostationary orbit. Their model which is based on measurements from the LANL/MPA at geosynchronous orbit between 1990 and 2007, provides mean flux of electrons and protons with energies ranging from 1 eV to 40 keV as a function of local time, energy, and geomagnetic activity. Figure 10 shows the original plots adapted from Denton et al. (2015) (Figures 10A, B), as well as the RCM calculated fluxes indicated on the smaller red windows by dashed lines. Comparisons are made through the nightside sector (i.e., 18–06 MLT) and the flux and energy values are expressed in
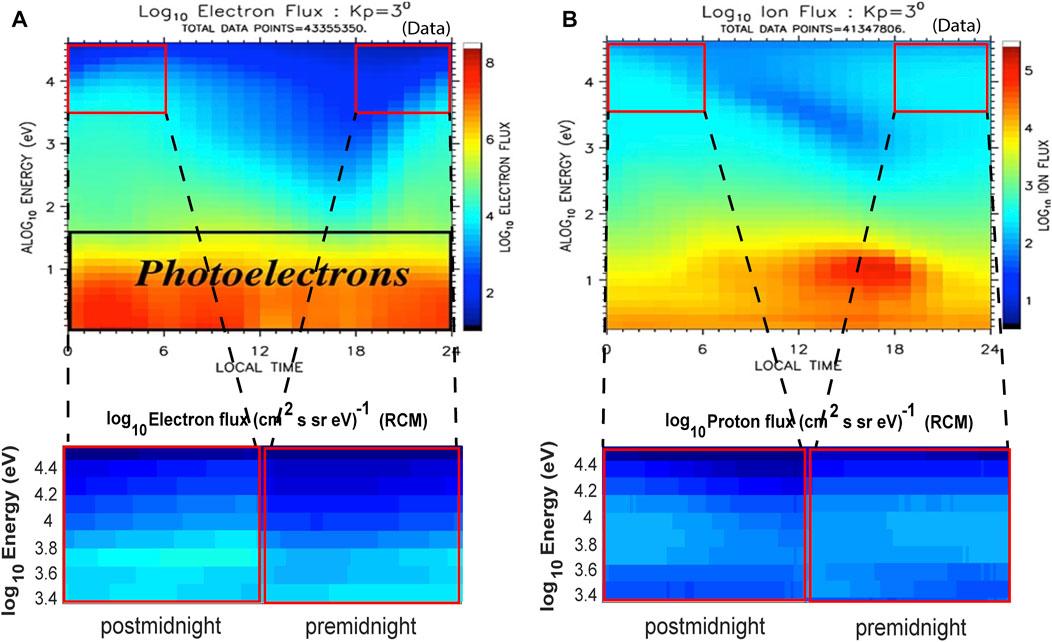
FIGURE 10. The mean (A) electron and (B) ion flux as a function of energy and magnetic local time based on MPA data (1990–2007) are compared against RCM calculated counterparts. The red boxes indicate the nightside region (i.e., premidnight with MLT = 18–24, and postmidnight with MLT = 24–06) with energies between
Denton et al. (2019) used Cluster/RAPID data to develop another empirical model for electron fluxes in the equatorial plane from

FIGURE 11. The equatorial distribution of mean electron flux from Cluster/RAPID observations at the energy range of (A) 185 keV, and (B) 110 keV. On the left, the RCM computed average electron flux at the same energy range are shown. The pink region indicates the nightside region (MLT = 18–06) and radial distances of
3.3 Ionospheric response
In the following section, we show the important role of bubbles on the dynamics of the ionosphere, with a particular importance given to the ionospheric FACs,
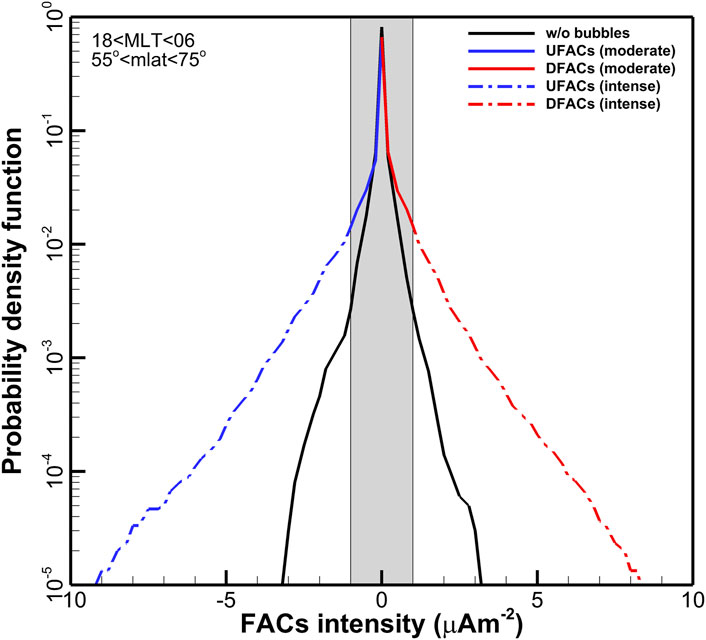
FIGURE 12. The RCM calculated average probability density function of FACs in the nightside ionosphere between
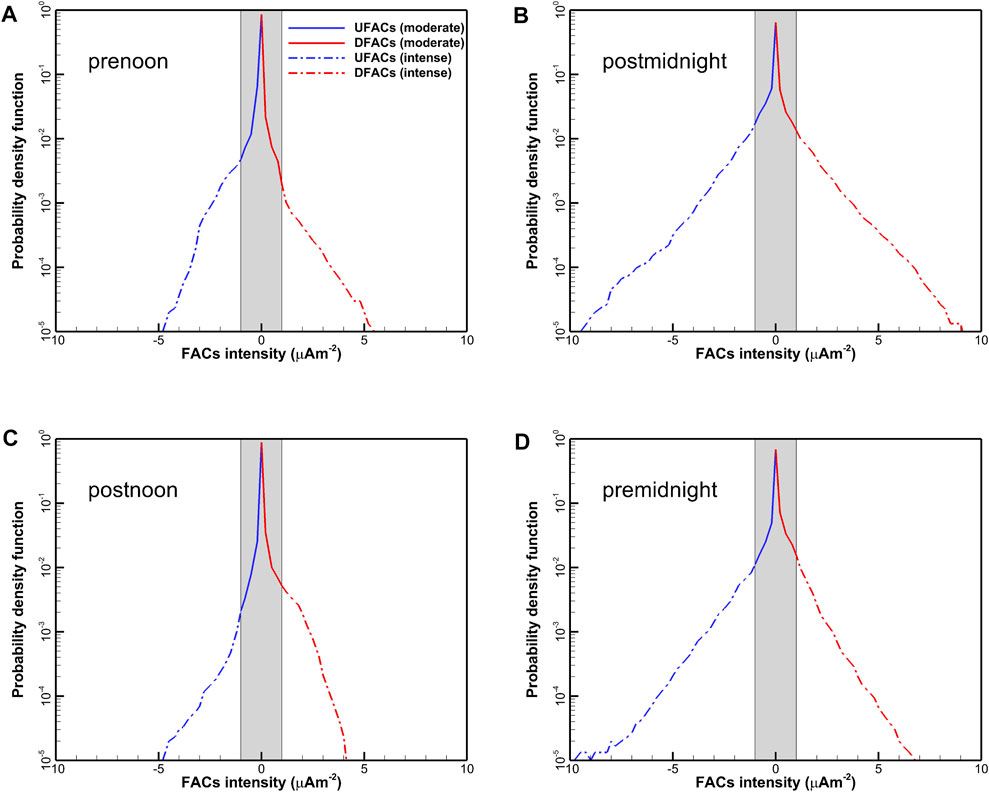
FIGURE 13. The averaged RCM calculated probability density function of FACs in different MLTs of the polar ionosphere; (A) 06–12, (B) 24–06 (C) 12–18, and (D) 18–24 MLT. The solid (dash-dotted) curve represents large-(meso-)scale FACs. The blue (red) color indicates upward (downward) FACs (labelled UFAC/DFAC). The inside (outside) of the gray rectangular region defines the large-scale (meso-scale) FACs features.
Figure 14 shows the average ionospheric
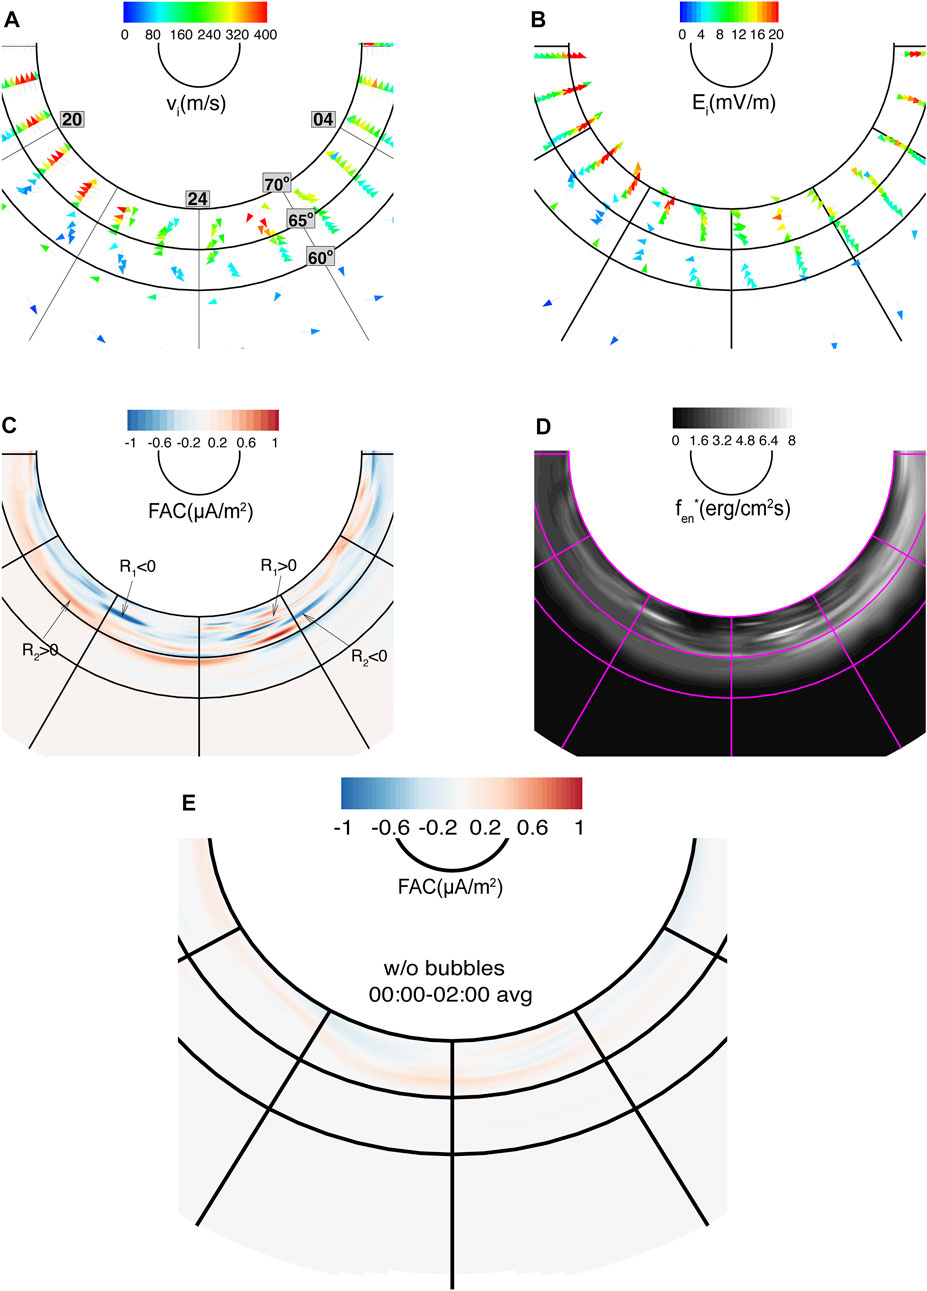
FIGURE 14. The average distribution of ionospheric (A)
First, when the bubbles are not launched (Figure 14E), the distribution of current systems is smoothed, and we can see the peak intensity of a confined premidnight downward region-2 currents.
Second, when bubbles are imposed through the RCM tailward boundary, they are initially elongated along the Sun-Earth direction due to
Third, a depleted bubble can result in two ionospheric manifestations: a streamer at the westward edge of the bubble as it moves earthward in the plasma sheet, and a subsequent thin arc associated with the disruption of the
We hypothesized that a high number of bubble injections could hinder the formation of streamers. The injection of bubbles into the plasma sheet can cause disturbances that affect the conditions required for streamer formation. Moreover, subsequent bubble injections might increase the brightness of preexisting thin arcs aligned in the east-west direction or trigger the formation of new ones. In our simulation, the ionospheric footprints of deformed bubbles are observed as only thin arcs that propagate in the east-west direction, and we do not observe the streamer-arc sequence. Despite the fact that a significant fraction (at least 50%) of bubble injections in our simulation exhibit a high degree of depletion (70% and more), the lack of a streamer propagating towards the equator (associated with the first bubble) and the presence of thin arcs extending in the azimuthal direction could also be attributed to inadequate depletion within that particular bubble and weak dipolarization.
Fourth, our method for calculating the energy flux of precipitating electrons is relatively simple and may result in the production of artificially bright synthetic aurora patches in areas where the upward FAC is strong. It is important to note, however, that a strong FAC does not always correspond to a strong energy flux in the ionosphere. The global configuration of the FACs, including the presence of field-aligned potential drops (FAPDs), can play a significant role. During the substorm expansion phase, for example, strong FAPDs can cause the FACs to become stronger, even if the energy flux is not particularly high. The Supplementary Material contains Supplementary Video S1 illustrating the evolution of plasma sheet entropy, pressure, current system, and synthetic aurora in run3 over a period of 2 hours.
4 Discussion and conclusion
This paper presents a data-model comparison of average bulk plasma properties near geosynchronous orbit and simulation of FACs in the ionosphere. The RCM model is used to study how the transport of transient meso-scale structures interacts with large-scale convection in the formation and electrodynamics of magnetosphere-ionosphere (M-I) coupling. We utilized the Inertialized version of the RCM (Yang et al., 2019) to examine the effects of MLT-dependent sporadic plasma bubble injections on the average configuration of the M-I coupled system. We believe that the current simulation results are much more realistic in this regard than previous RCM studies because the boundary conditions have been improved and, more importantly, time-dependent inertial effects due to bubble injections have been included. However, some major discrepancies between RCM simulated moments and fluxes and statistical models derived from MPA and MAGED data need to be discussed further. First, Figures 6, 7, 9 demonstrated that our RCM simulation could only produce acceptable quantitative average values. Second, the RCM-generated results could not reflect the observed general dawn-dusk asymmetry. Third, the RCM simulation yields an electron population temperature at GEO that was substantially different from the MPA data-driven model. Comparing Figures 6D, 7D, it is also interesting to see that even two MPA-based empirical models for electron temperature [i.e., Te (MLT, Kp) and Te (MLT,
1. There are cold plasma components coming from the flanks that we are missing (Wang et al., 2010). These populations may enter the magnetosphere via Kelvin-Helmholtz (KH) instability or diffusion, contributing to lower Te and some dawn-dusk asymmetry. Wang et al. (2010) showed that diffusive transport caused by flow fluctuations is a decisive factor in changing plasma number density and temperature. We did not include diffusive transport in our simulation. Wang et al. (2001) also discussed the contribution of cooler plasma components entering from the low latitude boundary layer.
2. In the RCM simulations, we assume that particles are subjected to strong elastic collisions to maintain the isotropy of the distribution function without changing their energies. But the electrons are not isotropic in the inner magnetosphere, and different kinds of wave-particle interactions are also MLT dependent (e.g., see Figure 1 of Thorne, 2010).
3. There have been reports of microinjection clusters from dusk to midnight (e.g., Fennell et al., 2016). These injections are not isotropic and are frequently observed in the presence of fluctuating magnetic fields. While they may contribute to the difference in electron temperature and dawn-dusk asymmetry, the RCM is not capable of modeling them.
4. The current RCM simulation excludes ion outflows from the ionosphere (Dandouras, 2021). However, even during quiet periods, a large number of cold plasma outflows may affect the magnetosphere.
Having said that, and having made it clear that considerable improvements are still needed to accomplish satisfactory simulations, here is a quick summary of the most important findings from this study:
1. Comparisons of RCM-computed average pressure, temperature, and density with observation-based empirical models TM2003 and DGSR2016 show that the properties of the plasma sheet populations with access to the inner magnetosphere and GEO derived in this work are more consistent with previous empirical models than those in Paper 1. The electron loss model developed by Orlova et al. (2014) delivers much better agreement between the RCM and the DGSR2016 model, though it is not perfect. Nonetheless, the imperfections are most likely due to our simulation’s inability to account for complex processes, such as wave-particle/wave interactions, diffusion, ion outflows, etc. The moment profiles of protons along GEO agree with two empirical models (Denton et al., 2005; Lemon and O’Brien, 2008) built upon the LANL MPA data, supporting our RCM simulation. However, the RCM calculated moment profiles of electrons along GEO differ from those obtained through the empirical models because the dynamics of high energy electrons in the near-Earth plasma sheet cannot be determined precisely by RCM physics alone, indicating the need for more comprehensive models and initialization.
2. As computed by RCM, the average differential fluxes of particles at different energy levels for both ions and electrons partially match those derived from MPA, Cluster, and MAGED models. RCM results of differential fluxes differ most from observations when compared qualitatively. This is due to our use of a highly idealized simulation, whereas the satellite-based models analyze their statistics using realistic settings and over the years. The access of the average plasma sheet to geostationary orbit is highly dependent on particle species, energy, and geomagnetic activity. During a moderate geomagnetic activity (e.g., Kp∼3), the Alfvén boundary moves closer to the Earth, exposing GEO to the plasma sheet particles almost at all local times (LT). The LT distribution of electrons across all energy channels is similar, whereas low (high) energy protons are more likely to be inclined at dawn (dusk). This is because the electric and magnetic fields cause the electrons to drift in the same direction, whereas the electric (magnetic) field controls the transport of low (high) energy protons from the tail.
3. In the ionosphere, the intensity and distribution of the FACs as simulated by the RCM resemble the classic description of the Iijima-Potemra current system. Furthermore, the inclusion of multiple bubble injections during the 2-hour simulation has resulted in region-1 and 2 sense FACs covering a broader latitude range, in contrast to the narrow FAC structures observed in a simulation without bubbles. When it comes to the average pattern and strength of the eastward/westward plasma flows (
It is worth mentioning that the differences that arose between RCM simulation and either of the empirical models do not necessarily raise doubts about their validity, as the values extracted from each data-driven empirical model are highly averaged and are model-dependent. Another important point is that even data-driven models can only provide a crude description of reality and can differ from one another. Checking the differential flux of 40 keV electrons along GEO using RAPID, MPA, and MAGED models, for example, reveals that they do not produce unique quantitative and qualitative results. As another example, the average plasma moments based on (1991–2001) and (1990–2005) MPA datasets show that the electron temperature at midnight can reach up to ∼2 and ∼3 keV, respectively (Figures 6D, 7D).
Data availability statement
The datasets presented in this study can be found in online repositories. The names of the repository/repositories and accession number(s) can be found below: https://doi.org/10.5281/zenodo.7478369.
Author contributions
Like a symphony, the collaborative efforts of this team produced a magnificent composition. SS composed the code and conducted the simulations with precision, while JY harmonized with the team in analyzing the simulation results and refining the manuscript. FT, RW, and C-PW contributed their technical expertise and artistic flair during stimulating discussions, inspiring new and innovative ideas. And finally, AM contributed her scientific prowess, conducting thoughtful and insightful discussions that elevated the quality of the work to new heights. All authors listed have made a substantial, direct, and intellectual contribution to the work and approved it for publication.
Funding
The work at SUSTech was supported by grants 41974187 and 42174197 of the National Natural Science Foundation of China (NSFC), the Stable Support Plan Program of Shenzhen Natural Science Fund (Grant No. 20200925153644003), and grant XDB41000000 of the Strategic Priority Research Program of Chinese Academy of Sciences. Work at Rice is supported by NASA HSR grant 80NSSC18K1226 and NASA TMS grant 80NSSC20K1276.
Conflict of interest
The authors declare that the research was conducted in the absence of any commercial or financial relationships that could be construed as a potential conflict of interest.
Publisher’s note
All claims expressed in this article are solely those of the authors and do not necessarily represent those of their affiliated organizations, or those of the publisher, the editors and the reviewers. Any product that may be evaluated in this article, or claim that may be made by its manufacturer, is not guaranteed or endorsed by the publisher.
Supplementary material
The Supplementary Material for this article can be found online at: https://www.frontiersin.org/articles/10.3389/fspas.2023.1189298/full#supplementary-material
References
Angelopoulos, V., Baumjohann, W., Kennel, C. F., Coroniti, F. V., Kivelson, M. G., Pellat, R., et al. (1992). Bursty bulk flows in the inner central plasma sheet. J. Geophys. Res. 97 (4), 4027–4039. doi:10.1029/91JA02701
Baumjohann, W., Paschmann, G., and Luehr, H. (1990). Characteristics of high-speed ion flows in the plasma sheet. J. Geophys. Res. 95, 3801–3809. doi:10.1029/JA095iA04p03801
Birn, J., and Hesse, M. (1991). The substorm current wedge and field-aligned currents in MHD simulations of magnetotail reconnection. J. Geophys. Res. 96 (2), 1611–1618. doi:10.1029/90JA01762
Birn, J., Liu, J., Runov, A., Kepko, L., and Angelopoulos, V. (2019). On the contribution of dipolarizing flux bundles to the substorm current wedge and to flux and energy transport. J. Geophys. Res. 124, 5408–5420. doi:10.1029/2019JA026658
Borovsky, J. E. (1993). Auroral arc thicknesses as predicted by various theories. J. Geophys. Res. 98 (4), 6101–6138. doi:10.1029/92JA02242
Borovsky, J. E., Delzanno, G. L., Valdivia, J. A., Moya, P. S., Stepanova, M., Birn, J., et al. (2020). Outstanding questions in magnetospheric plasma physics: The Pollenzo view. J. Atmos. Solar-Terrestrial Phys. 208, 105377. doi:10.1016/j.jastp.2020.105377
Borovsky, J. E., Thomsen, M. F., Elphic, R. C., et al. (1998). The driving of the plasma sheet by the solar wind. J. Geophys. Res. 103 (20), 17617–17639. doi:10.1029/97JA02986
Boynton, R. J., Balikhin, M. A., Billings, S. A., Reeves, G. D., Ganushkina, N., Gedalin, M., et al. (2013). The analysis of electron fluxes at geosynchronous orbit employing a NARMAX approach. J. Geophys. Res. 118, 1500–1513. doi:10.1002/jgra.50192
Chen, C. X., and Wolf, R. A. (1993). Interpretation of high-speed flows in the plasma sheet. J. Geophys. Res. 98 (12), 21409–21419. doi:10.1029/93JA02080
Chen, M. W., and Schulz, M. (2001). Simulations of diffuse aurora with plasma sheet electrons in pitch angle diffusion less than everywhere strong. J. Geophys. Res. 106 (12), 28949–28966. doi:10.1029/2001JA000138
Coleman, T., McCollough, J. P., Young, S., and Rigler, E. J. (2018). Operational nowcasting of electron flux levels in the outer zone of Earth's radiation belt. Space weather. 16, 501–518. doi:10.1029/2017SW001788
Cramer, W. D., Raeder, J., Toffoletto, F. R., Gilson, M., and Hu, B. (2017). Plasma sheet injections into the inner magnetosphere: Two-way coupled OpenGGCM-RCM model results. J. Geophys. Res. 122, 5077–5091. doi:10.1002/2017JA024104
Dandouras, I. (2021). Ion outflow and escape in the terrestrial magnetosphere: Cluster advances. J. Geophys. Res. 126, e2021JA029753. doi:10.1029/2021JA029753
Denton, M. H., Henderson, M. G., Jordanova, V. K., Thomsen, M. F., Borovsky, J. E., Woodroffe, J., et al. (2016). An improved empirical model of electron and ion fluxes at geosynchronous orbit based on upstream solar wind conditions. Space weather. 14, 511–523. doi:10.1002/2016SW001409
Denton, M. H., Taylor, M. G. G. T., Rodriguez, J. V., and Henderson, M. G. (2019). Extension of an empirical electron flux model from 6 to 20 Earth radii using Cluster/RAPID observations. Space weather. 17 (5), 778–792. doi:10.1029/2018SW002121
Denton, M. H., Thomsen, M. F., Jordanova, V. K., Henderson, M. G., Borovsky, J. E., Denton, J. S., et al. (2015). An empirical model of electron and ion fluxes derived from observations at geosynchronous orbit. Space weather. 13 (4), 233–249. doi:10.1002/2015SW001168
Denton, M. H., Thomsen, M. F., and Korth, H. (2005). Bulk plasma properties at geosynchronous orbit. J. Geophys. Res. 110, A07223. doi:10.1029/2004JA010861
Dubyagin, S., Ganushkina, N. Y., Sillanpaa, I., and Runov, A. (2016). Solar wind-driven variations of electron plasma sheet densities and temperatures beyond geostationary orbit during storm times. J. Geophys. R. 121, 8343–8360. doi:10.1002/2016JA022947
Dubyagin, S., Sergeev, V., Apatenkov, S., Angelopoulos, V., Runov, A., Nakamura, R., et al. (2011). Can flow bursts penetrate into the inner magnetosphere? Geophys. Res. Lett. 38, L08102. doi:10.1029/2011GL047016
Eastman, T. E., Frank, L. A., Peterson, W. K., and Lennartsson, W. (1984). The plasma sheet boundary layer. J. Geophys. R. 89 (3), 1553. doi:10.1029/JA089iA03p01553
Edwards, T. R., Weimer, D. R., Tobiska, W. K., and Olsen, N. (2017). Field-aligned current response to solar indices. J. Geophys. Res. 122, 5798–5815. doi:10.1002/2016JA023563
Erickson, G. M., and Wolf, R. A. (1980). Is steady convection possible in the Earth's magnetotail? Geophys. Res. Lett. 7 (11), 897–900. doi:10.1029/gl007i011p00897
Fennell, J. F., Turner, D. L., Lemon, C. L., Blake, J. B., Clemmons, J. H., Mauk, B. H., et al. (2016). Microinjections observed by MMS FEEPS in the dusk to midnight region. Geophys. Res. Lett. 43, 6078–6086. doi:10.1002/2016GL069207
Fridman, M., and Lemaire, J. (1980). Relationship between auroral electrons fluxes and field aligned electric potential difference. J. Geophys. Res. 85 (2), 664–670. doi:10.1029/JA085iA02p00664
Gkioulidou, M., Ukhorskiy, A. Y., Mitchell, D. G., Sotirelis, T., Mauk, B. H., and Lanzerotti, L. J. (2014). The role of small-scale ion injections in the buildup of Earth’s ring current pressure: Van Allen Probes observations of the 17 March 2013 storm. J. Geophys. Res. 119 (9), 7327–7342. doi:10.1002/2014JA020096
Gkioulidou, M., Wang, C.-P., and Lyons, L. R. (2011). Effect of self-consistent magnetic field on plasma sheet penetration to the inner magnetosphere: Rice convection model simulations combined with modified Dungey force-balanced magnetic field solver. J. Geophys. Res. 116 (12). doi:10.1029/2011JA016810
Haerendel, G. (1994). Acceleration from field-aligned potential drops. Int. Astron. Union Colloq. 142, 765–774.
Hasunuma, T., Nagatsuma, T., Kataoka, R., Takahashi, Y., Fukunishi, H., Matsuoka, A., et al. (2008). Statistical study of polar distribution of mesoscale field-aligned currents. J. Geophys. Res. 113, A12214. doi:10.1029/2008JA013358
Henderson, M. G., Reeves, G. D., and Murphree, J. S. (1998). Are north-south aligned auroral structures an ionospheric manifestation of bursty bulk flows? Geophys. Res. Lett. 25 (19), 3737–3740. doi:10.1029/98GL02692
Horne, R. B., and Thorne, R. M. (1998). Potential waves for relativistic electron scattering and stochastic acceleration during magnetic storms. Geophys. Res. Lett. 25, 3011–3014. doi:10.1029/98GL01002
Iijima, T., and Potemra, T. A. (1976b). Field-aligned currents in the dayside cusp observed by Triad. J. Geophys. Res. 81, 5971–5979. doi:10.1029/ja081i034p05971
Iijima, T., and Potemra, T. A. (1976a). The amplitude distribution of field-aligned currents at northern high latitudes observed by Triad. J. Geophys. Res. 81, 2165–2174. doi:10.1029/ja081i013p02165
Jordanova, V. K., Kozyra, J., Nagy, A., and Khazanov, G. V. (1997). Kinetic model of the ring current-atmosphere interactions. J. Geophys. Res., 102(7), 279–291. doi:10.1029/96JA03699
Jordanova, V. K., Miyoshi, Y. S., Zaharia, S., Thomsen, M. F., Reeves, G. D., Evans, D. S., et al. (2006). Kinetic simulations of ring current evolution during the Geospace Environment Modeling challenge events. J. Geophys. Res. 111, A11S10. doi:10.1029/2006JA011644
Kepko, L., McPherron, R., Amm, O., Apatenkov, S., Baumjohann, W., Birn, J., et al. (2015). Substorm current wedge revisited. Space Sci. Rev. 190, 1–46. doi:10.1007/s11214-014-0124-9
Khazanov, G. V., Liemohn, M. W., Krivorutsky, E. N., and Moore, T. E. (1998). Generalized kinetic description of a plasma in an arbitrary field-aligned potential energy structure. J. Geophys. Res. 103 (4), 6871–6889. doi:10.1029/97JA03436
Knight, S. (1973). Parallel electric fields. Planet. Space Sci. 21 (5), 741–750. doi:10.1016/0032-0633(73)90093-7
Korth, H., Anderson, B. J., and Waters, C. L. (2010). Statistical analysis of the dependence of large-scale Birkeland currents on solar wind parameters. Ann. Geophys. 28 (2), 515–530. doi:10.5194/angeo-28-515-2010
Korth, H., Thomsen, M. F., Borovsky, J. E., and McComas, D. J. (1999). Plasma sheet access to geosynchronous orbit. J. Geophys. Res. 104 (11), 25047–25061. doi:10.1029/1999JA900292
Lemon, C. L., and O'Brien, T. P. (2008). A solar wind driven model of geosynchronous plasma moments. Adv. Space Res. 41, 1226–1233. doi:10.1016/j.asr.2007.08.028
Lemon, C., Toffoletto, F. R., and Hesse, M. (2003). Computing magnetospheric force equilibria. J. Geophys. Res. 108 (6), 1237. doi:10.1029/2002JA009702
Liu, J., Angelopoulos, V., Chu, X., and McPherron, R. L. (2016). Distribution of region 1 and 2 currents in the quiet and substorm time plasma sheet from THEMIS observations. Geophys. Res. Lett. 43, 7813–7821. doi:10.1002/2016GL069475
Lühr, H., Park, J., Gjerloev, J. W., Rauberg, J., Michaelis, I., Merayo, J. M. G., et al. (2015). Field-aligned currents' scale analysis performed with the Swarm constellation. Geophys. Res. Lett. 42, 1–8. doi:10.1002/2014GL062453
Lyons, L. R., Evans, D. S., and Lundin, R. (1979). An observed relation between magnetic field aligned electric fields and downward electron energy fluxes in the vicinity of auroral forms. J. Geophys. Res. 84 (2), 457–461. doi:10.1029/JA084iA02p00457
McGranaghan, R. M., Mannucci, A. J., and Forsyth, C. (2017). A comprehensive analysis of multiscale field-aligned currents: Characteristics, controlling parameters, and relationships. J. Geophys. Res. 122 (11), 931–960. doi:10.1002/2017JA024742
Mende, S. B., Frey, H. U., Angelopoulos, V., and Nishimura, Y. (2011). Substorm triggering by poleward boundary intensification and related equatorward propagation. J. Geophys. Res. 116, A00131. doi:10.1029/2010ja015733
Milan, S. E., Lester, M., Cowley, S. W. H., and Brittnacher, M. (2000). Dayside convection and auroral morphology during an interval of northward interplanetary magnetic field. Ann. Geophys. 18, 436–444. doi:10.1007/s00585-000-0436-9
Morooka, M., Mukai, T., and Fukunishi, H. (2004). Current-voltage relationship in the auroral particle acceleration region. Ann. Geophys. 22, 3641–3655. doi:10.5194/angeo-22-3641-2004
Neubert, T., and Christiansen, F. (2003). Small-scale, field-aligned currents at the top-side ionosphere. Geophys. Res. Lett. 30 (19), 2010. doi:10.1029/2003GL017808
Nikolaev, A. V., Sergeev, V. A., Tsyganenko, N. A., Kubyshkina, M. V., Opgenoorth, H., Singer, H., et al. (2015). A quantitative study of magnetospheric magnetic field line deformation by a two-loop substorm current wedge. Ann. Geophys. 33 (4), 505–517. doi:10.5194/angeo-33-505-2015
Nishimura, Y., Lyons, L., Zou, S., Angelopoulos, V., and Mende, S. (2010). Substorm triggering by new plasma intrusion: THEMIS all-sky imager observations. J. Geophys. Res. 115, A07222. doi:10.1029/2009JA015166
Ochieng, A. A., Vichare, G., Baki, P., Cilliers, P., Kotze, P., Xiong, C., et al. (2019). Storm-time mesoscale field-aligned currents and interplanetary parameters. J. Atmos. Solar-Terrestrial Phys. 195, 105131. doi:10.1016/j.jastp.2019.105131
Ohtani, S., Singer, H. J., and Mukai, T. (2006). Effects of the fast plasma sheet flow on the geosynchronous magnetic configuration: Geotail and GOES coordinated study. J. Geophys. Res. 111, A01204. doi:10.1029/2005JA011383
Orlova, K., Spasojevic, M., and Shprits, Y. (2014). Activity-dependent global model of electron loss inside the plasmasphere. Geophys. Res. Lett. 41, 3744–3751. doi:10.1002/2014GL060100
Pontius, D. H., and Wolf, R. A. (1990). Transient flux tubes in the terrestrial magnetosphere. Geophys. Res. Lett. 17 (1), 49–52. doi:10.1029/GL017i001p00049
Runov, A., Angelopoulos, V., Gabrielse, C., Liu, J., Turner, D. L., and Zhou, X. (2015). Average thermodynamic and spectral properties of plasma in and around dipolarizing flux bundles. J. Geophys. Res. 120, 4369–4383. doi:10.1002/2015JA021166
Sadeghzadeh, S., Yang, J., Wang, C. P., Mousavi, A., Wang, W., Sun, W., et al. (2021). Effects of bubble injections on the plasma sheet configuration. J. Geophys. Res. 126. doi:10.1029/2021ja029127
Sato, T., and Iijima, T. (1979). Primary sources of large-scale Birkeland currents. Space Sci. Rev. 24 (3), 347–366. doi:10.1007/BF00212423
Scholer, M., and Otto, A. (1991). Magnetotail reconnection: Current diversion and field-aligned currents. Geophys. Res. Lett. 18 (4), 733–736. doi:10.1029/91GL00361
Sergeev, V. A., Chernyaev, I. A., Dubyagin, S. V., Miyashita, Y., Angelopoulos, V., Boakes, P. D., et al. (2012). Energetic particle injections to geostationary orbit: Relationship to flow bursts and magnetospheric state. J. Geophys. Res. 117, A10207. doi:10.1029/2012JA017773
Sergeev, V. A., Dmitrieva, N. P., Stepanov, N. A., Sormakov, D. A., Angelopoulos, V., and Runov, A. V. (2015). On the plasma sheet dependence on solar wind and substorms and its role in magnetosphere-ionosphere coupling. Earth Planets Space 67, 133. doi:10.1186/s40623-015-0296-x
Sillanpää, I., Ganushkina, N. Y., Dubyagin, S., and Rodriguez, J. V. (2017). Electron fluxes at geostationary orbit from goes MAGED data. Space weather. 15, 1602–1614. doi:10.1002/2017SW001698
Thomsen, M. F., Borovsky, J. E., and McComas, D. J. (1996). Observations of the Earth’s plasma sheet at geosynchronous orbit. AIP Conf. Proc. 383, 25. doi:10.1063/1.51535
Thomsen, M. F., Denton, M. H., Lavraud, B., and Bodeau, M. (2007). Statistics of plasma fluxes at geosynchronous orbit over more than a full solar cycle. Space weather. 5, S03004. doi:10.1029/2006SW000257
Thomsen, M. F., Noveroske, E., and Borovsky, J. E. (1999). Calculation of moments from measurements by the Los Alamos magnetospheric plasma analyzer. Los Alamos: Los Alamos National Lab.
Thorne, R. M., Ni, B., Tao, X., and Meredith, N. P. (2010). Scattering by chorus waves as the dominant cause of diffuse auroral precipitation. Nature 467, 943–946. doi:10.1038/nature09467
Thorne, R. M. (2010). Radiation belt dynamics: The importance of wave-particle interactions. Geophys. Res. Lett. 37, L22107. doi:10.1029/2010GL044990
Tsyganenko, N. A., and Mukai, T. (2003). Tail plasma sheet models derived from Geotail particle data. J. Geophys. Res. 108 (3), 1136. doi:10.1029/2002JA009707
Vasyliunas, V. M. (1970). Mathematical models of magnetospheric convection and its coupling to the ionosphere: In Particules and fields in the magnetosphere, M. Mc Cormac, and D. Reidel Dordrecht, Netherlands: Springer, 60–71.
Wang, C.-P., Gkioulidou, M., Lyons, L. R., and Angelopoulos, V. (2012). Spatial distributions of the ion to electron temperature ratio in the magnetosheath and plasma sheet. J. Geophys. Res. 117, A08215. doi:10.1029/2012JA017658
Wang, C.-P., Lyons, L. R., Chen, M. W., and Wolf, R. A. (2001). Modeling the quiet time inner plasma sheet protons. J. Geophys. Res. 106 (4), 6161–6178. doi:10.1029/2000JA000377
Wang, C.-P., Lyons, L. R., Nagai, T., Weygand, J. M., and Lui, A. T. Y. (2010). Evolution of plasma sheet particle content under different interplanetary magnetic field conditions. J. Geophys. Res. 115, A06210. doi:10.1029/2009JA015028
Wang, C.-P., Yang, J., Gkioulidou, M., Lyons, L. R., and Wolf, R. A. (2020). Generation and evolution of two opposite types of mesoscale plasma sheet bubbles. J. Geophys. Res. 125, e2020JA028072. doi:10.1029/2020JA028072
Weimer, D. R. (2001). Maps of ionospheric field-aligned currents as a function of the interplanetary magnetic field derived from Dynamics Explorer 2 data. J. Geophys. Res. 106 (7), 12889–12902. doi:10.1029/2000ja000295
Xing, X., and Wolf, R. A. (2007). Criterion for interchange instability in a plasma connected to a conducting ionosphere. J. Geophys. Res. 112 (12), A12209. doi:10.1029/2007JA012535
Yang, J., Toffoletto, F. R., Erickson, G. M., and Wolf, R. A. (2010). Superposed epoch study ofPV5/3during substorms, pseudobreakups and convection bays: Superposed epoch study of entropypv53 during substorms, pseudobreakups and convection bays. Geophys. Res. Lett. 37, L07102. doi:10.1029/2010GL042811
Yang, J., Toffoletto, F. R., and Wolf, R. A. (2016). Comparison study of ring current simulations with and without bubble injections. J. Geophys. Res. 121, 374–379. doi:10.1002/2015JA021901
Yang, J., Toffoletto, F. R., and Wolf, R. A. (2014b). RCM-E simulation of a thin arc preceded by a north-south-aligned auroral streamer. Geophys. Res. Lett. 41, 2695–2701. doi:10.1002/2014GL059840
Yang, J., Toffoletto, F. R., Wolf, R. A., and Sazykin, S. (2015). On the contribution of plasma sheet bubbles to the storm time ring current. J. Geophys. Res. 120, 7416–7432. doi:10.1002/2015JA021398
Yang, J., Toffoletto, F. R., Wolf, R. A., Sazykin, S., Ontiveros, P. A., and Weygand, J. M. (2012). Large-scale current systems and ground magnetic disturbance during deep substorm injections. J. Geophys. Res. 117, A04223. doi:10.1029/2011JA017415
Yang, J., Wolf, R. A., Toffoletto, F. R., Sazykin, S., and Wang, C. (2014a). RCM-E simulation of bimodal transport in the plasma sheet. Geophys. Res. Lett. 41, 1817–1822. doi:10.1002/2014GL059400
Yang, J., Wolf, R. A., Toffoletto, F., Sazykin, S., Wang, W., and Cui, J. (2019). The inertialized rice convection model. J. Geophys. Res. 124 (10), 294–317. doi:10.1029/2019JA026811
Yao, Z. H., Angelopoulos, V., Pu, Z. Y., Fu, S. Y., Kubyshkina, M., Liu, J., et al. (2013). Conjugate observations of flow diversion in the magnetotail and auroral arc extension in the ionosphere. J. Geophys. Res. Space Phys. 118, 4811–4816. doi:10.1002/jgra.50419
Yu, Y., Jordanova, V., Welling, D., Larsen, B., Claudepierre, S. G., and Kletzing, C. (2014). The role of ring current particle injections: Global simulations and Van Allen Probes observations during 17 March 2013 storm. Geophys. Res. Lett. 41, 1126–1132. doi:10.1002/2014GL059322
Yue, C., Bortnik, J., Chen, L., Ma, Q., Thorne, R. M., Reeves, G. D., et al. (2017). Transitional behavior of different energy protons based on Van Allen Probes observations. Geophys. Res. Lett. 44, 625–633. doi:10.1002/2016GL071324
Zaharia, S., Jordanova, V. K., Thomsen, M. F., and Reeves, G. D. (2006). Self-consistent modeling of magnetic fields and plasmas in the inner magnetosphere: Application to a geomagnetic storm. J. Geophys. Res. 111, A11S14. doi:10.1029/2006JA011619
Zesta, E., Donovan, E., Lyons, L., Enno, G., Murphree, J. S., and Cogger, L. (2002). Two-dimensional structure of auroral poleward boundary intensifications. J. Geophys. Res. Space Phys. 107, A11. doi:10.1029/2001JA000260
Zesta, E., Lyons, L. R., and Donovan, E. (2000). The auroral signature of earthward flow bursts observed in the magnetotail. Geophys. Res. Lett. 27 (20), 3241–3244. doi:10.1029/2000GL000027
Keywords: simulation-computers, plasma sheet, solar wind-magnetosphere-ionosphere coupling, plasma bubbles, field-aligned currents, geostationary orbit (GEO), space weather, rice convection model
Citation: Sadeghzadeh S, Yang J, Toffoletto F, Wolf R, Mousavi A and Wang C-P (2023) RCM modeling of bubble injections into the inner magnetosphere: geosynchronous orbit and the ionospheric responses. Front. Astron. Space Sci. 10:1189298. doi: 10.3389/fspas.2023.1189298
Received: 18 March 2023; Accepted: 09 May 2023;
Published: 22 May 2023.
Edited by:
Takashi Minoshima, Japan Agency for Marine-Earth Science and Technology (JAMSTEC), JapanReviewed by:
Michael G. Henderson, Los Alamos National Laboratory (DOE), United StatesOctav Marghitu, Space Science Institute, Romania
Copyright © 2023 Sadeghzadeh, Yang, Toffoletto, Wolf, Mousavi and Wang. This is an open-access article distributed under the terms of the Creative Commons Attribution License (CC BY). The use, distribution or reproduction in other forums is permitted, provided the original author(s) and the copyright owner(s) are credited and that the original publication in this journal is cited, in accordance with accepted academic practice. No use, distribution or reproduction is permitted which does not comply with these terms.
*Correspondence: Jian Yang, eWFuZ2ozNkBzdXN0ZWNoLmVkdS5jbg==