 Evgeny V. Mishin
95% of researchers rate our articles as excellent or good
Learn more about the work of our research integrity team to safeguard the quality of each article we publish.
Find out more
REVIEW article
Front. Astron. Space Sci. , 27 March 2023
Sec. Space Physics
Volume 10 - 2023 | https://doi.org/10.3389/fspas.2023.1118758
This article is part of the Research Topic Editor’s Challenge in Space Physics: Solved and Unsolved Problems in Space Physics View all 18 articles
An assessment of the status quo of fast subauroral flows—subauroral ion drifts (SAID) and subauroral polarization streams (SAPS), is presented. For a few decades, their development has been interpreted in terms of the voltage and current magnetospheric generators based largely on the drift motion of test particles. Recent multispacecraft observations revealed serious flaws in the generator paradigm and called for a new generation mechanism of fast-time subauroral flows and ring current (RC) injections. A novel model includes them in the overarching problem of the penetration of magnetotail plasma flow bursts (MPFs) into the plasmasphere and the substorm current wedge (SCW) development. SAID are created near the plasmapause, where inbound MPFs are short-circuited by the cold plasma. This stops the MPF’s electrons and forms the “dispersionless” plasma sheet (PS) boundary. The SAID electric field—the inherent part of the short-circuiting loop—stops the inward-moving MPF’s ions. In turn, SAPS are an integral part of the two-loop SCW system, or SCW2L, where the downward (R2) current emerges in response to the upward (R1) current in the SCW’s “head.” The meridional Pedersen current, which connects the R1 and R2 currents, leads to SAPS that ultimately drive the fast-time RC injections on the duskside.
The subauroral ionosphere is adjacent to the equatorward border of the auroral zone and maps along magnetic field lines into the inner magnetosphere adjacent to the electron plasma sheet (PS) boundary. Henceforth, the whole region, which overlaps with the ring current (RC), the outer radiation belt, and the plasmasphere, is termed the subauroral geospace. In addition to the radiation belt dynamics, the spatiotemporal variability of subauroral plasma during space storms and substorms remains among the key space weather topics for many years (Basu et al., 2008). The disturbed subauroral convection is dominated by westward,
Galperin et al. (1974) were the first to report on “polarization jets”—fast,
The first SAID model (Southwood and Wolf, 1978)—a voltage generator—(hereafter, VGSW) considers the drift motion of hot (≳1 keV) PS particles in the large-scale corotation, Ecor, and dawn-to-dusk, Edd, electric fields with electron precipitation included. This process creates an enhanced radial (outward) electric field, EΛ ∼
Anderson et al. (1993) proposed a current generator (hereafter, CGA) scenario. Here, the poleward electric field,
In addition to near-midnight narrow flows, significantly wider and relatively modest flows were documented on the duskside (LaBelle et al., 1988; Yeh et al., 1991; Burke et al., 1998, 2000). Both narrow and broad flows have been united under the generic term “sub-auroral polarization streams,” or SAPS (Foster and Burke, 2002). In other words, it was assumed that SAID and SAPS develop due to the same mechanism and that the SAID are a subset of the SAPS. Subsequently, the term “SAPS” is frequently used for near-midnight SAID, and the CGA paradigm is used for the interpretation and modeling of both (Galperin et al., 1974; Yu et al., 2015; Lin et al., 2019; Wei et al., 2019).
On the other hand, recent multispacecraft observations show that the underlying physics of SAIDs and SAPSs is different and that their salient features disagree with the paradigm (Mishin, 2013; Mishin et al., 2017; Mishin and Streltsov, 2021a, Chapter 5.1). Nonetheless, the generator paradigm remains in use by the community. This is consequent to the human mind’s “inertness” (Kahneman, 2011), which disregards the evidence contradicting the established paradigm even though an evolving novel concept consistently explains the data. Whatever the reason, that holds the key to progress in the understanding of fast subauroral flows and, hence, the development of a realistic model of space weather effects at mid-latitudes.
Therefore, the main objective of this paper is to survey satellite observations, highlighting the salient features of the fast-time SAID and SAPS events near the substorm onsets, denoted as tO, and to describe a novel concept and demonstrate its conformity with the data. We do not consider the ensuing SAID/SAPS evolution, including the ionospheric density (conductivity) reduction in the region of strong electric fields, which is important for maintaining flow channels (Wang et al., 2021; Liang et al., 2022). The essential elements and processes in the inner magnetosphere and magnetotail characteristic of magnetospheric substorms are introduced in Supporting Information (SI) to give the necessary background for readers unfamiliar with the problem.
Figure 1 shows three basic types of subauroral flows in the top ionosphere encountered during the expansion phase of stormtime substorms on March 17, 2013 and April 6, 2000 (Mishin et al., 2004, 2017). In these events, the SAID and SAPS channels differ mainly in the width,
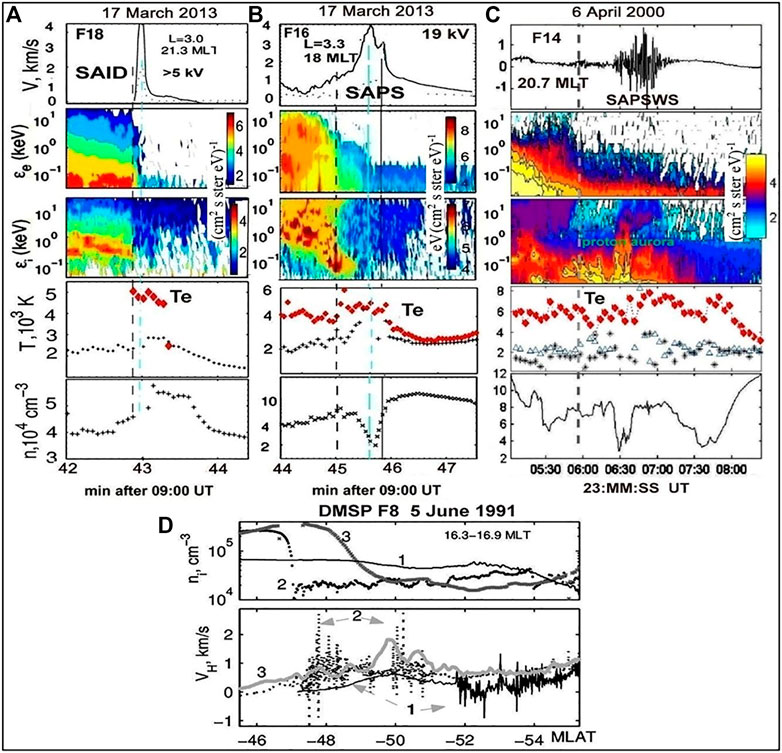
FIGURE 1. Examples of (A) SAID and (B) SAPS on March 17, 2013, and (C) strong SAPSWS on April 6, 2000. From top to bottom: The horizontal component of the convection velocity; energy–time spectrograms of electron and ion downcoming directional differential number fluxes from F18 and F14 and energy flux from F16; variations of the electron (red diamonds) and ion temperature; and 1-s averaged ion density. Vertical black and cyan dashed lines indicate the auroral boundary and the peak amplitude, respectively. The cross-channel voltage,
The third type (frame c) is the so-called “SAPS Wave Structure,” or SAPSWS, denoting the SAPS region with enhanced ultralow frequency (ULF, ∼0.5–10 mHz), electromagnetic, mostly Alfvén waves (Mishin et al., 2003,, 2004). The wave magnitude,
The SAPSWS features change throughout substorms (Mishin and Burke, 2005; Mishin and Mishin, 2007; He et al., 2019). Figure 1D shows the SAPSWS evolution over three successive orbits of DMSP F8 on June 5, 1991, with substorm breakups prior to the first two encounters. Clearly, the SAPSWS1 moved equatorward and turned into a more enhanced and structured SAPSWS2. A similar transition of a pre-substorm SAPSWS during a stormtime substorm was triggered by the arrival of the SCW’s head—the westward traveling surge (WTS)—at the adjacent auroral region (Mishin et al., 2002). By the time of the third crossing during the recovery phase, the SAPSWS2 had converted into a typical SAPS structure at roughly the same location but without short-scale oscillations in the flow velocity and density.
In addition, Figure 1 exemplifies the well-established feature that subauroral flows collocate with elevated ion, Ti, and electron, Te, temperatures (Anderson et al., 1991; Moffett et al., 1998; Mishin et al., 2004). Karlsson et al. (1998) and Figueiredo et al. (2004) explored statistical features of SAEF/SAID events in a 400–1750 km altitude range. These were largely detected during the substorm recovery phase, with some events lagging the onset by δtO ≤ 10 min during the expansion phase (Anderson et al., 1991, 2001; Khalipov et al., 2003). Note that the actual time lag, δtO, is uncertain, as a single satellite gives only its upper limit.
A vast majority of the SAID events surveyed by Figueiredo et al. (2004) occurred, like in Figure 1A, between 20.0 and 23.0 MLT and on the poleward side of the ionospheric density trough. However, as in Figure 1B, during storms or the recovery of substorms, subauroral flows usually collocate with deep density troughs in which the ion composition exhibits significant changes (Anderson et al., 1991). Namely, the density of the main F2-region ion, O+, drops, while the NO+ and O2+ densities increase. This change indicates enhanced charge exchange reactions, O++N2→NO+ +N and O++O2→O2++O, that, in ∼10 min, reduce the plasma density within flow channels (Schunk et al., 1976; Mishin et al., 2004). Figueiredo et al. (2004) have also reported that the SAID channels are wider at the beginning of the substorm expansion phase. The strongest fields (up to EΛ ∼ 400 mV/m) were encountered near 22 MLT earlier in the substorm recovery phase than at other local times. The cross-channel voltage was gradually decreasing during the substorm recovery from the initial ∼1–10 kV. The width and the peak amplitude were anticorrelated, like in a persistent magnetospheric voltage generator (VG).
The VG scenario agrees with Rich et al.’s (1980) observations of downward FACs between 0.2 and ∼1 μA/m2 associated with SAEFs of nearly the same peak amplitudes. In other words, there was no correlation between the net downward current and EΛ. Similarly, Anderson et al. (1991) found that though the ion drift persists at the conjugate point of the same orbit, the FACs fall off. Burke et al. (2000) reported on concurrent measurements in conjugate hemispheres, with one side of the field line in darkness and the other sunlit, that show almost the same potential drops across the channels with drastically different conductance. Alternatively, Figueiredo et al. (2004) found that SAID events in the substorm recovery were usually associated with a pair of downward and upward FACs of ∼3 μA/m2 on average. The strongest fields were located closer to the density (ΣP) minimum, suggesting EΛ ∝ j||/ΣP, as typical of a current generator. The overall results suggest that both types of magnetospheric generators contribute to the SAID evolution during the recovery of individual substorms and in the course of storms.
In conclusion, single, low-orbit satellite observations, mostly during the substorm recovery phase, have usually been interpreted in terms of the test-particle voltage (VGSW) and current (CGA) magnetospheric generators. In both generators, a slow, ≥1 h timescale of the SAID formation is predetermined by the relatively slow motion of test particles driven by the convection electric field. Fast-time, δtO
Long-period orbits of magnetospheric satellites make conjugate ionosphere-magnetosphere observations relatively rare. To name a few, earlier observations from the Dynamics Explorer (DE) 1 at altitudes of h1 ≈ 12,400 km and DE 2 at h2 ≈ 850 km explored the distribution of auroral electric fields over scale sizes (Weimer et al., 1985). The global electrodynamics of the inner magnetosphere (Burke et al., 1998; 2000) and SAPSWS (Mishin and Burke, 2005) has been studied using CRRES-DMSP conjunctions. Anderson et al. (2001) presented the first SAID observations from Akebono (
Puhl-Quinn et al. (2007) and Mishin and Puhl-Quinn (2007) explored the first near-equatorial (
Figure 2 depicts the salient features of these events, where the leading Cluster 1 (C1) satellite crossed the SAID channel during both the southern (inbound) and northern (outbound) segments of the inner-magnetospheric pass. The others followed in the succession shown in Figure 2Ac. Henceforth, the time lag between the Cluster satellites is taken into account in combined plots. The maximum separation between the Cluster satellites was ≈1,000 km (I) and 300 km (II). They detected almost identical characteristics not only in the southern but also in the later encountered northern channels. That refers to the peak magnitudes of
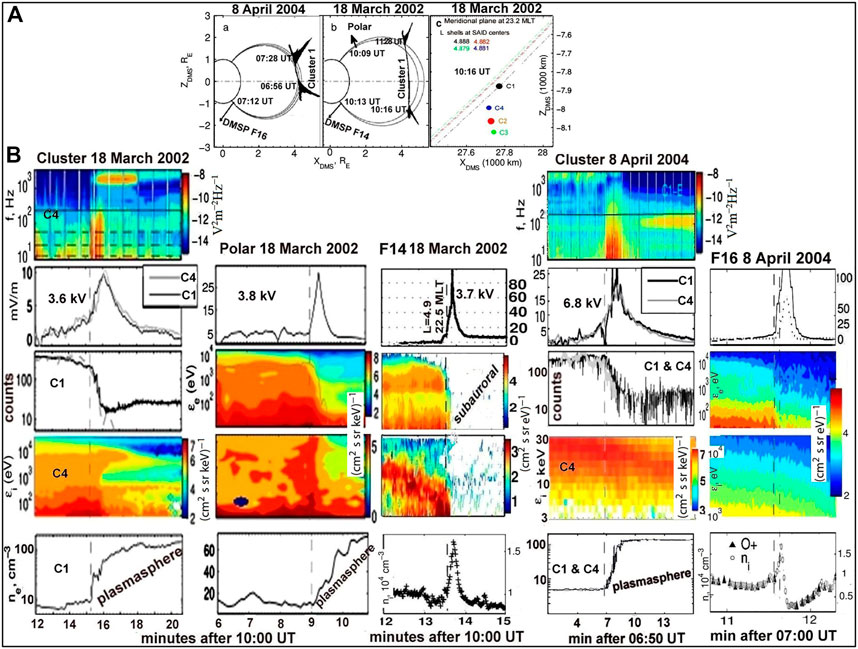
FIGURE 2. (A) World line plots of Cluster 1, Polar, and DMSP in the dipole meridional system (DMS). The XDMS–ZDMS plane is the meridional plane at 21.83 MLT (April 8, 2004) and 23.0 MLT (March 18, 2002). Electric field vectors are drawn at specific times, and dipolar magnetic field lines are drawn for reference. (B) (top row) Frequency–time spectrograms for the electric field in V2m−2Hz−1. The solid line shows the lower hybrid resonance, and the dashed lines indicate the second, fourth, and 10th harmonics of the proton gyrofrequency. The rest is in the same format as Figure 1 except that (1) the meridional (outward) electric fields are shown instead of the convection velocity and (2) 1-keV electron counts from Cluster with directional differential number fluxes from DMSP and Polar. The temperature plots have been removed. Color codes in the logarithmic scale for the particle fluxes and wave spectral energies are given to the right of the spectrograms. The gray curve in the C1 and Polar electron data shows the scaled 1-keV electron flux from F14 (see text). The cross-channel voltage ΦS in kV is indicated. Compiled from Puhl-Quinn et al. (2007), Mishin and Puhl-Quinn (2007), Mishin et al. (2010), and Mishin (2013).
In event I, DMSP F13, F14, and F15 observed SAID events in the near-midnight southern ionosphere resembling those of F16 (Figure 2). F16 had excellent magnetic and temporal conjugacy with Cluster (Figure 2Aa), while F14 crossed the channel in ∼8 min after the onset (Puhl-Quinn et al., 2007, Table 1). The electrostatic mapping of the C1 electric field to the DMSP altitude gives a perfect match of the widths of
It is evident that the outer/poleward edge of the SAID channel collocates with the plasma density surge at the plasmapause. It is coincident with the drop of ≥1 keV electron fluxes, as evident in 1-keV electron counts (Cluster) and the PS (Polar)/auroral (F14 and F16) boundary. In event II, the Polar ≥1 keV ion and electron fluxes are like those mapped from Cluster and F14, respectively. We underscore that “the hot ion population” in the plasmasphere actually means a “≥1 keV RC injection.” The maximal energy of the RC injection,
As in Figure 1A, the precipitating electron fluxes from Polar and F14/F16 have the “dispersionless” border (Newell and Meng, 1987). Furthermore, the overlaid scaled 1-keV flux from the pertinent DMSP satellite (the gray curve) perfectly matches the Cluster 1-keV counts. This suggests that the entire population of hot electrons, such as those from Polar, is halted at the plasmapause. At the same time, the suprathermal ≫1-≤300 eV, electron population is enhanced near the plasmapause and further earthward, along with a broadband wave spectrum featuring the “bursty” enhancement near the plasmapause. This novel magnetospheric feature—turbulent plasmasphere boundary layer, or TPBL—is an inherent part of the MPF-plasmasphere interaction resulting in SAID (Mishin et al., 2010; Mishin, 2013; Mishin and Sotnikov, 2017).
Figure 3 shows the insomuch strongest magnetospheric SAID events from Van Allen Probe B (RBSP-B) during the main phase of the March 17, 2013 major storm (Mishin et al., 2017) and from Polar on April 25, 1998 during the recovery phase of a weak magnetic storm (Kim et al., 2010). During the outbound (inbound) segment, RBSP-B (Polar) observed a SAID channel of
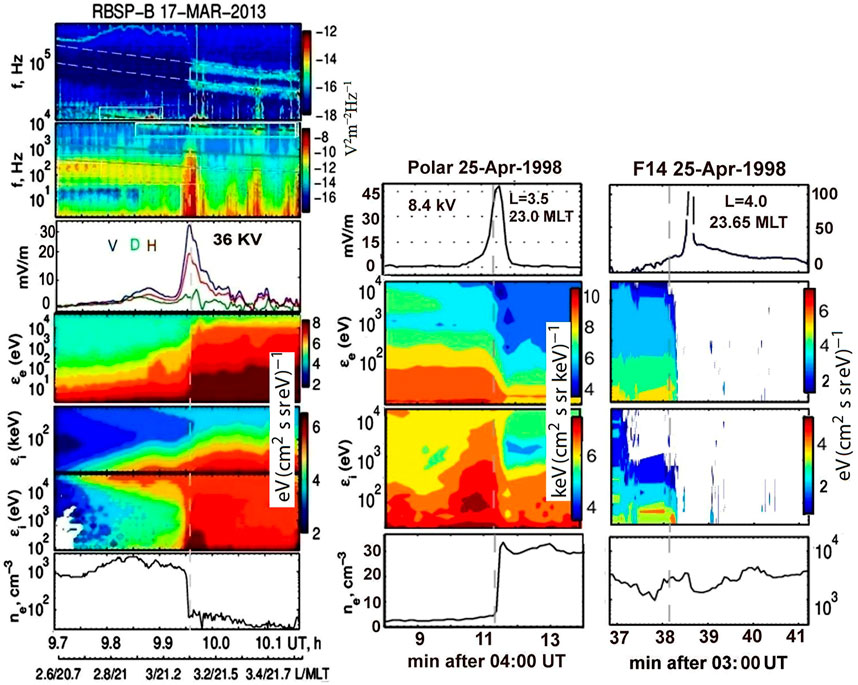
FIGURE 3. SAID events from Van Allen Probe B (RBSP-B) on March 17, 2013, and Polar and DMSP F14 on April 25, 1998. The same format as Figure 2 except that (1) the energy fluxes are shown instead of number fluxes, In the frequency–time spectrogram, the thin (thick) greenish lines show the upper hybrid resonance (electron cyclotron harmonic waves), light dashed lines show multiples of the electron cyclotron frequency, and the dark solid thick/thin line indicates the H+ and O+ lower hybrid resonance. The cross-channel voltage ΦS in kV is indicated. RBSP-B ephemeris data are shown at the bottom. Adapted from Mishin (2013) and Mishin et al. (2017).
Concluding remarks are in order. As Mishin and Puhl-Quinn (2007) have perceived, the cutoff of ∼10 keV electron fluxes at the plasmapause, as illustrated in Figures 2, 3, indicates that the cold plasma interrupts penetration of the MPF’s electrons into the plasmasphere. It was further substantiated (Mishin, 2013; Mishin et al., 2017; Nishimura et al., 2022) that the SAID channel is located between the electron PS boundary and the hot ion nose inside the plasmasphere, devoid of the ejected MPF’s electrons. In other words, inwardly penetrating MPF’s ions—near-midnight RC injections—create a fast-time voltage generator (henceforth, VGFT). The VGFT-associated RC ion nose and “dispersionless” electron border do not fit in the test particle Alfvén layer description (Supplementary Section S1.1). Notably, both features persist for more than an hour after the substorm onset, as witnessed by the THEMIS data on March 23, 2007 (Mishin and Sotnikov, 2017, Figure 5) and Cluster successive crossings of the southern and northern channels. An additional, non-test-particle approach that consistently explains the SAID/VGFT features is described in Section 3.1.
Puhl-Quinn et al. (2007) and Mishin and Puhl-Quinn (2007) used the Cluster data for events I and II to explore for the first time the SAID-related FACs in the equatorial magnetosphere. They isolated the small-scale magnetic structure,
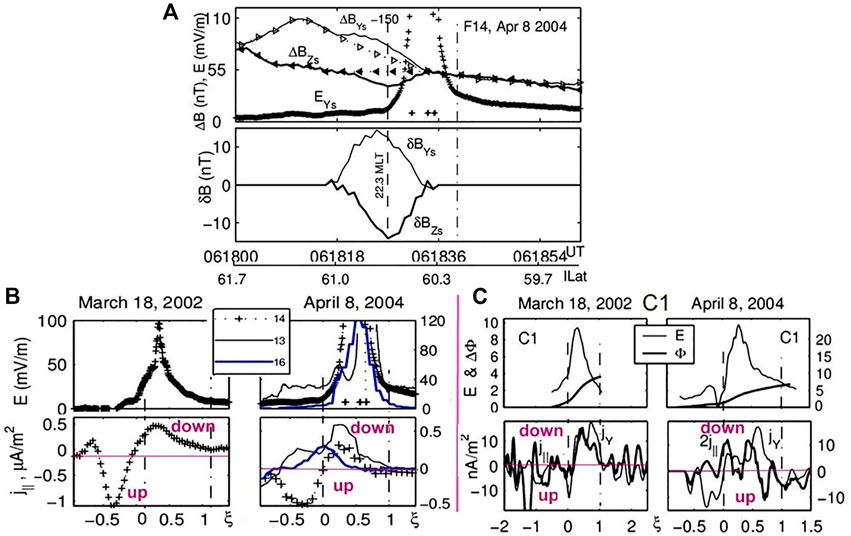
FIGURE 4. The March 18, 2002 and April 8, 2004 SAID events. (A) F14 data near the substorm onset on April 8, 2004: (top) The SAID electric field (pluses) and 2-s averages of
Antisymmetric
(Rich et al., 1980). Here,
In the magnetosphere, the VDH (geomagnetic spherical) coordinate system is used: eV = er (radial/outward), eD = eφ (azimuthal/eastward), and eH = eθ (meridional/northward). Here, φ and θ are counted from the dawn-dusk meridian and the geomagnetic North Pole, respectively; eJ is the unit vector along the J axis. In events I and II, the spacecraft crossed an almost one-dimensional magnetic structure with
The calculated currents in the southern hemisphere from DMSP (Figure 4B) and C1 (Figure 4C) are presented in the SAID system of reference with the origin at the plasmapause and the abscissa,
Next, we present a few examples of the fast-time subauroral events, with the time lag between their creation/change and the substorm onset significantly shorter than the slow, ≥1 h timescale predicted by the paradigm.
For the first time, the fast response of a pre-existing SAPSWS to the breakup of a stormtime substorm was revealed from concurrent multispacecraft, radar and magnetometer observations during the September 25, 1998, storm (Mishin et al., 2002; Mishin and Mishin, 2007). Figure 5 summarizes the results from DMSP F13, LANL 97A, and 1994-084, a 150-MHz incoherent scatter radar with a 2 min/20 km temporal/spatial resolution, and the chain of magnetometers at

FIGURE 5. The September 25, 1998, SAPSWS event: (A) DMSP F13 measurements of the meridional electric field near 17 MLT prior to and after the substorm onset at tO ≈ 08:18 UT. The vertical dashed line marks the auroral boundary. (B) The sidelobe coherent backscatter power from the region 53–58 ILAT in the 15.3–15.5 MLT sector; the time is shown on top. (C) A MLAT–MLT map of equivalent currents at 08:30 UT. Solid/dashed lines indicate the clockwise/counterclockwise direction; the magenta/cyan arrows mark the westward/eastward electrojet (WEJ/EEJ). The total intensities of downward/upward (+/−) FACs in kA are shown in the centers of vortices. Green and black dots mark the location of the LANL spacecraft and ground magnetometers, respectively. The blue (red) thick line shows the coherent backscatter region (the post onset track of F13). (D) Dispersive and (E) dispersionless enhancements of energetic ion fluxes from LANL 97A and LANL 1994-084, respectively, and (F) Pi2 pulsations in the dusk sector, with the dashed line indicating the local Pi2 onset. Adapted from Mishin et al. (2002; 2017).
As evident in Figure 5F, the magnitude of Pi2 (5–25 mHz) pulsations at each magnetometer site intensifies after local commencements. Their MLT-time dependence resembles a front (WTS) traveling from the earliest onset at ≈08:18 UT near 21 MLT to 16.5 MLT at a speed of ∼0.9 LT-h/min [see more details in Mishin et al. (2002, Figure 10)]. The Pi2/WTS expansion is indicative of the auroral westward electrojet (WEJ) development (Supplementary Section S3.1), which is consistent with the WEJ in Figure 5C (magenta arrows) with the “head” between ∼67◦ and 70◦ MLAT near 15.5 MLT fully developed between 08:20 and 08:30 UT [see Mishin et al. (2017) Supporting Information Figure S10]. An enhanced eastward electrojet (the cyan arrow) in the SAPS region near the center of the counterclockwise vortex—the signature of the downward R2 current—is also evident. This duskside, large-scale MLAT-MLT pattern is the same as the expansion-phase SCW2L pattern depicted in Supplementary Figure S1 and that from Ebihara and Tanaka (2015, Figure 1F).
Figure 5D shows the signatures of a substorm injection at geosynchronous orbit located in the auroral region. Namely, high-energy (>113 keV) ion fluxes from LANL 1994-084 near 15.5 MLT increased simultaneously at ∼08:20 UT. Dispersive ion enhancements at ∼08:21:30 UT from LANL 97A near 13 MLT are consistent with high-energy ions westerly drifting from ∼15:30 MLT. This suggests that the (dispersionless) injection front presumably related to the SCW2L system stopped between ∼15.5 and 13.0 MLT.
The F13 data in Figure 5A show that the post-onset SAPSWS is enhanced and more structured than its higher-latitude, pre-onset counterpart. The radar backscatter power is a good proxy for the electric field greater than a ∼20 mV/m threshold of the Farley–Buneman instability—the cause of radar echoes. The continuous radar data (Figure 5B) determined the start of the SAPSWS transition along the ∼15.5. MLT meridian
Similarly, the post-onset RC pressure buildup in the premidnight sector and SAPS-associated giant undulations of several hundred kilometers in wavelength were associated with the WTS expansion (Goldstein et al., 2005; Henderson et al., 2010; Henderson et al., 2018; Horvath and Lovell, 2021a). In addition, radar investigations described rapidly emerging or changing subauroral flows during substorm breakups (Erickson et al., 2002; Foster et al., 2004; Parkinson et al., 2005; Oksavik et al., 2006; Koustov et al., 2008; Makarevich and Dyson, 2008; Kunduri et al., 2018; Lyons et al., 2021).
Presented next are examples of multispacecraft events with a fortuitous conjunction of various spacecraft. The latter method resolved the ambiguity in determining the onset timing inherent to a single satellite, which cannot undeniably prove whether it is a freshly created channel or one from prior substorms.
Figure 6 presents a structured SAPS event during the May 6, 2003 substorm with two expansion onsets at
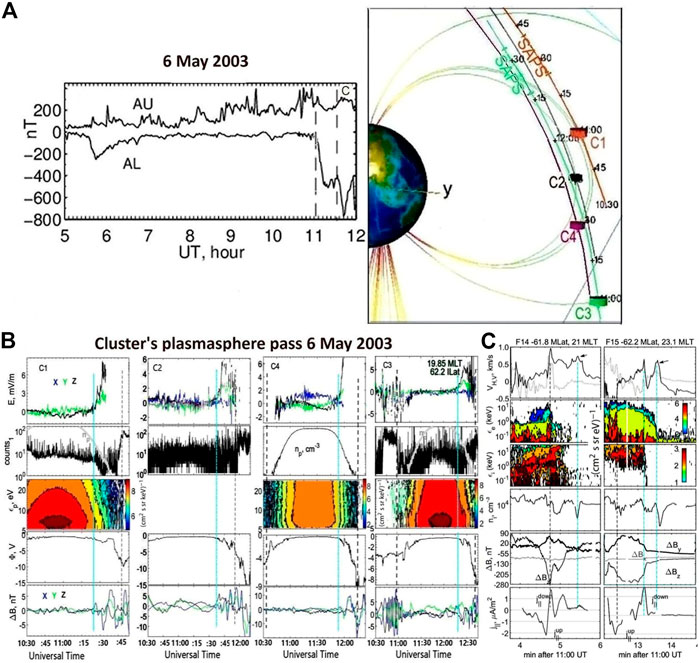
FIGURE 6. An individual substorm event on May 6, 2003. (A) AL and AU indices and Cluster orbits in the GSM coordinates. The dipole field lines at 11:00 UT for each satellite (colored squares) are shown with the superimposed 15-min time markers and the SAPS channels for C1 and C3. (B) C1–C4 data from top to bottom: the GSE electric field components, background 1 keV electron counts (with the superimposed cold plasma density indicated by gray curves), differential number fluxes of omnidirectional 5–27 eV H+ ions in (cm2 s sr keV)−1, floating potential, and the GSE magnetic field components. (C) DMSP F14 and F15 data in the same format as Figure 3 plus the magnetic field components and FACs. Vertical black and cyan lines indicate the PS/auroral boundary and the SAPS inner edge (C1–4) or peak (F14/F15), respectively. Adapted from Mishin (2016) and Mishin et al. (2017).
The absence of pre-onset subauroral flows during the inbound pass is justified by the average corotation field measured by the headmost C1 (and then C2) before crossing the SAPSWS inner boundary, Rin, at ≈11:24 UT. Variations of
Figure 6C shows subauroral flows detected by DMSP F14 and F15 near 21 and 23 MLT and L ≈ 4.6 in
Figure 7, 8 present two more “exemplary” events detected during weak isolated substorms (AE < 500 nT). Shown in Figure 7A are the meridional electric field and 1-keV electron counts from C1 during the April 18, 2005 inner-magnetospheric pass. The geomagnetic activity was quiet well before the entry in the plasmasphere at ≈10:48 UT, so the electric field was close to the corotation field until ULF oscillations were detected around the substorm onset at tO ≈ 12:00 UT. During the outbound pass, the foremost C1 encountered the inner boundary of a SAID channel (shown in green) near Lin = 5.3 and 21.1 MLT at ≈12:27 UT. Like in previous events, the outer boundary near 12:36 UT collocated with the drop of the background electron counts and the satellite floating potential.
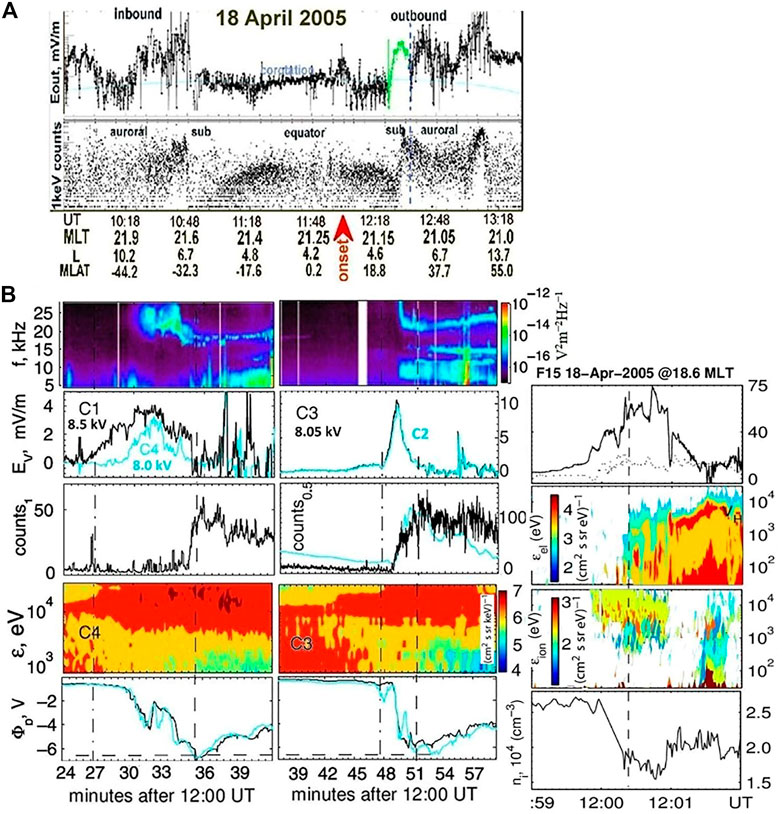
FIGURE 7. (A) Meridional electric fields and 1-keV electron background counts along the C1 inner-magnetospheric pass on April 18, 2005. The red arrowhead indicates the substorm onset. Ephemeris data are tabulated at the bottom. (B) Cluster C1–C4 and F15 data in the same format as Figure 2. Adapted from Mishin (2013).
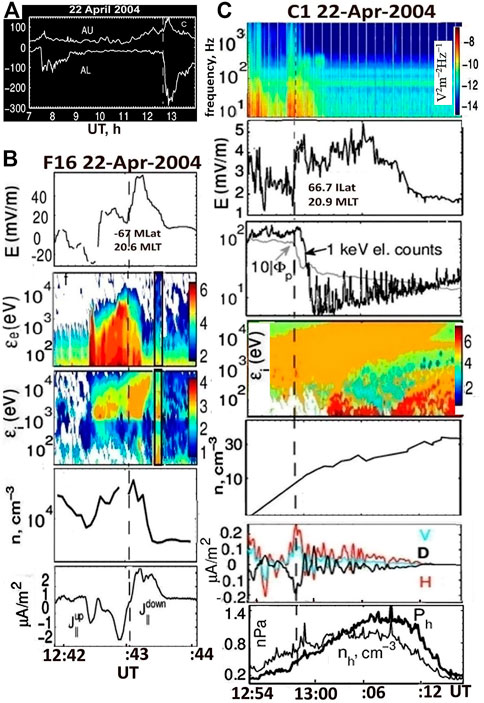
FIGURE 8. The April 22, 2004 event: (A) AL and AU indices and data from (B) DMSP F16 and (C) Cluster 1 in the same format as Figure 2 plus FACs and the C1 hot ion density and pressure. Encircled in the particle spectrograms are spurious counts from MeV RB particles penetrating the instrument. Adapted from Mishin et al. (2017).
An ion nose (a RC injection) near 21 MLT was encountered in ∼25 min after the onset. Much earlier, alongside the LANL 97A near-dusk proton injection (not shown), DMSP F15 observed a near-dusk SAPSWS and ∼10–20-keV ion injection near L = 6.3 in δtO ∼2 min. It is notable that the C4 and C3 hot ion distributions are remarkably alike, and the voltages across the C1 and C3 channels are practically the same, though the (earlier) C1 channel is significantly broader. This difference with a typical C3/SAID is due to the more oblique path of C1 (and C4) through the channel. The anticorrelation between the width and the peak intensity indicates a potential structure persisting for at least 20 min after its creation.
The April 22, 2004 substorm commenced at 12:37 UT. No distinct subauroral flows were found in the DMSP database for the prior 2 h. LANL 1991-080 near 1.3 MLT and 1994-084 near 22.5 MLT detected substorm injections at about 12:41:30 UT. During the inbound pass, each Cluster satellite, in a few minutes, encountered practically similar flow channels close to the geosynchronous orbit in the southern hemisphere. Though only F16 of the DMSP satellites was available near the substorm onset, it was fortuitously close to the Cluster’s ionospheric footpoint. The electric pattern in the plasmasphere (averaged over small-scale oscillations) and the hot ion population appear similar to that in the ionosphere.
C1 (F16) observed a SAID channel near 20.9 (20.6) MLT, lagging the substorm onset by δtO ≈ 20 (6) min. Taking the timing of the LANL injections into account, a 6-min time lag appears close to the actual creation time of the channel. As in the aforementioned events, the C1/SAID inner boundary collocates with the hot ion density/pressure drop in the ion nose, while a broadband wave spectrum and the currents are intensified near the outer boundary (cf. Mishin and Streltsov, 2021b, Figures 8.3, 8.6). F16 was moving almost across the SAID channel—well-matched for calculating small-scale FACs. Again, the FACs do not bracket the channel, while
In summary, subauroral flows and tens keV RC injections near midnight and dusk lag the substorm onset by a few to ≃20 min. This time lag is much shorter than the slow, ≳1 h timescale from the test-particle generator paradigm. In addition to that, the crucial features of fast-time subauroral flows disagree with such generator paradigm predictions as the channel enclosure by (small-scale) FACs and the peak location at the density (conductance) minimum. Additionally, in the fast-time events, the PS (auroral) boundary is dispersionless and located close to the ion boundary, even near dusk, contrary to the test-particle drift. On the other hand, the fast timescale and near-midnight MLT sector are characteristic of the earthbound-ejected substorm MPFs (cf. Gkioulidou et al., 2014; Wang et al., 2019).
The fact that the SAID region is devoid of ≳1 keV (hot) electrons implies that plasma quasineutrality in this hot ion-abundant region is maintained by the short-circuiting current system (Supplementary Section S2.2). Therefore, Mishin and Puhl-Quinn (2007) introduced the short-circuiting of an MPF at the plasmapause as the cause of the fast-time SAID and RC ion nose near midnight. In turn, the fast-time duskside events indicate that tens of keV ions in the plasmasphere move westward much faster than the gradient-curvature drift. Taking into account their relationship with the SCW/WTS documented in some events, Mishin (2016) and Mishin et al. (2017) suggested that SAPS/SAPSWS are an integral part of the SCW2L circuit depicted in Supplementary Figure S1. These conjectures are discussed next.
Figure 9A (Streltsov and Mishin, 2018) depicts the SAID formation by the MPF’s polarization-shorting at the plasmapause. It is worth noting that the explored SAID events safely satisfy the self-polarization limit for the MPF’s density,

FIGURE 9. (A) Schematic illustration of the SAID formation via short-circuiting of earthbound mesoscale (hot) plasma flows, indicated by red arrows. The green and magenta curves depict the plasmapause and the SAID field, and the yellow arrow indicates precipitating electrons into an auroral arc at the equatorward edge of the auroral oval. White curves show the dipole magnetic field lines. Adapted from Streltsov and Mishin (2018). (B) The fine structure of the PS boundary: (upper row) hot electron density, Ne, and perpendicular pressure, Pe, and (bottom row) the r.m.s. amplitudes of the lower hybrid (black), fast magnetosonic (green), and EMIC (dashed–dotted) wave modes. (C) Meridional electric fields in the fast-time SAID events and (D) coincident directional differential number fluxes of precipitating electrons with energies 1–4.5 keV, indicated by the color. Adapted from Mishin and Streltsov (2020).
As the incoming hot electrons accumulate near Lmin, they create a narrow peak in the density and pressure, as seen in Figure 9B, along with enhanced waves in the TPBL. In a steady state, the pressure buildup is balanced by precipitation and the diamagnetic drift,
It is important that the principal condition for the SAID creation is that a MPF penetrates into the stopping point, Lmin, at the plasmapause. However, as discussed in Supplementary Section S3.2, not every streamer “touching” the PBA initiates the onset. As it intuitively makes sense, Fukui et al. (2020) have statistically shown that the key factor in the “choice” between the breakup and pseudobreakup is the “strength” of MPFs, including their persistence, total pressure, and earthward magnetic flux transport rate. Anyway, in the substorm/pseudobreakup events facilitated by streamers, SAID can emerge just before the onset/after the prebreakup arc brightening. In the case of streamers resulting in torches that eventually intensify and grow into onsets (Henderson, 2012; 2022), SAID could be seen as being substantially ahead of the latter.
Now, let us consider the behavior of the hot MPF’s ions that penetrate further inward of Lmin, thus forming an RC injection in the near-midnight plasmasphere. Recall that the SAID innermost boundary collocates with the density/pressure drop in the ion nose with the increasing lowermost energy,
The demagnetization/chaotization condition (Supplementary Eq. S10) is satisfied in intense events with wave “bursts” of the root mean square magnitude of
Figures 9C, D exemplify meridional electric fields and precipitating fluxes of soft electrons in a narrow region adjacent to the auroral border near substorm onsets during fast-time SAID events. Mishin and Streltsov (2020) explained this feature by the Landau resonance interaction,
The MPF’s polarization shorting approach, where the plasmapause separates the SAID from the “fresh,” innermost border of PS electrons, provides a consistent explanation of the long-known statistical facts. First, since the main ionospheric trough is adjacent to the ionospheric footprint of the plasmapause (Yizengaw and Moldwin, 2005; Heilig et al., 2022), “fresh” SAID channels are mapped on the trough’s poleward boundary. Then, the plasmasphere’s shrinkage due to the increasing convection and erosion (Goldstein et al., 2003) makes the plasmapause move closer to Earth. A successive MPF will form a new SAID channel interior to the “new” plasmapause. This way, sequential substorm breakups or pseudobreakups can create a sequence of SAID channels. Of those, the earlier channels remaining in the presently high-conductance auroral zone will eventually disappear. This assumes that each subsequent MPF moves freely through the plasma sheet regardless of its modification by the initial MPF. A rigorous solution to this problem is not known at this time. During the recovery phase, the plasmasphere expands so that the plasmapause moves outwards. That leaves the most recent, innermost channels in place—most frequently, a double-SAID structure (He et al., 2016; Nishimura et al., 2019; Horvath and Lovell, 2021b).
Figure 10 illustrates this scenario by the data from the THEMIS all-sky imager FSMI-west and DMSP F17 during the expansion phase of an isolated substorm with an auroral onset at tEO ≈ 03:54 UT on March 2, 2013 (Gallardo-Lacourt et al., 2017). The top frame is a keogram from FSMI-west showing four post-onset streamers. Their average equatorward speed is about
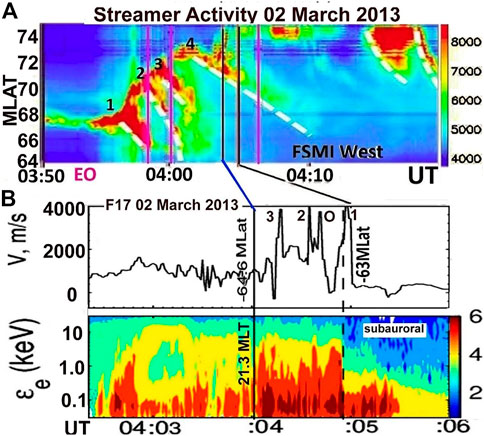
FIGURE 10. (A) A keogram from Fort Smith ASI west. The color scale represents auroral luminosity. EO marks the expansion onset, and numbers 1–4 mark the subsequent streamers. Pink vertical lines indicate the times when the CVW radar observed westward flow enhancements near
At such a speed, only streamer 1 could reach the auroral boundary prior to the F17 crossing at ≈04:05 UT. In other words, in addition to the onset-related MPF, only the streamer 1-related MPF had reached the PS boundary. Therefore, given the plasmasphere’s contraction after the onset, the first post-breakup MPF formed the PS boundary and SAID (marked “1”) closer to the Earth. The onset-related SAID (“O”) was left in the “fresh” auroral zone. Similarly, the two auroral flow/flux spikes (“2”and “3”) can be related to the later streamers 2 and 3 that lagged behind the satellite. The spiky fields of ∼20–25 km in latitude map to tailward fields in the central plasma sheet between L ≈ 5–5.5 of the radial extent ∼300–400 km. These are typical of the dipolarization fronts of earthbound MPFs (Supplementary Section S2). Furthermore, the coincident streamer-associated “spiky” precipitation is consistent with intensified electron scattering from the turbulent MPF’s (DF) forefront.
To conclude, the polarization shorting of reconnection-ejected fast mesoscale flows over the near-midnight plasmapause consistently explains observations of the fast SAID formation. Similarly, weak transient SAPS during quiet times correlate with auroral streamers (Makarevich et al., 2011; Lyons et al., 2015; Gallardo-Lacourt et al., 2017). This hints at a common process underlying SAID and SAPS generation and the overarching problem of the penetration of magnetotail plasma flows into the inner magnetosphere. Notably, the state-of-the-art global numerical models that do not include fast mesoscale flows but traditionally employ test-particle models of the inner magnetosphere (Yu et al., 2015; Lin et al., 2019; Wei et al., 2019) were unable to capture the observed fast-time events nor had these models addressed the narrow width of SAID channels, abrupt dispersionless PS/auroral boundary, and their connection with the plasmapause.
In short, the simulations are consistent with the global development of the Region 2 FACs and the average position of the subauroral channels after 2–3 h in the storm. Because of a slow buildup of the simulated ring current by gradient-curvature drifting ions, even in the modeled perturbed magnetic field, the simulations missed the channels during the initial phase of the March 17, 2013, and 2015 storms. The simulated magnitudes are smaller, and both the simulated width of the channel and the PS boundary (the Alfvén layer) greatly exceed the observed values. The latter does not seem to be consequent only to the insufficient spatial resolution but rather the spatial dependence of the particles’ drift, which is determined largely by the geomagnetic field gradient.
Notably, Wang et al. (2021) simulated the fast SAID creation using the “inertialized” Rice Convection Model (RCM-I), which includes the inertial effects and allows modeling of MPFs as bubbles in the plasma sheet. This approach somewhat helps to ease the time limitation but still significantly overestimates the widths of the PS boundary and flow channel. The effects of the cold plasma and plasma turbulence on the bubble’s propagation (Supplementary Section S2.1) have not been considered.
The fast-time duskside events coincident with the WTS development suggest a causal WTS–SAPS connection (Mishin, 2016). Mishin et al. (2017) suggested a tentative scenario based on the SCW2L model depicted in Supplementary Figure S1. Specifically, they conclude that SAPS are an integral part of the SCW2L circuit. Here, the Pedersen current continuity between the R2L and R1 loops requires the poleward electric field,
Yet, the SCW2L model deals with the current circuit and does not directly address the fast RC buildup on the duskside by the sunward transport of tens of keV ions interior to the plasmapause at a speed faster than
In a steady state,
The front’s irregular structure and intermittent development with strongly enhanced MHD waves are potentially capable of breaking the drift motion of energetic particles, most easily, ions. In this case, they could be simply picked up by the sunward-moving front, such as in the dipolarization pulse scenario. The emerging polarization field may further complicate the overall process, making it even more non-stationary. The apparent consequences of this scenario are as follows: according to the SCW concept (Supplementary Section S3), faster/denser MPFs with greater ram pressure result in SCWs that develop faster with greater LT extents, viz., stronger substorms. Faster WTS fronts tend to preserve the shape of the PS/auroral boundary and the ion nose along the path from midnight to dusk. This way, as is consistent with the data, the abrupt PS/auroral boundary can be formed even near dusk. In weak substorms, the front stops at larger MLTs so that higher-energy electrons (ions) lag (get ahead of) the lower-energy ones, thus making the electron boundary (ion nose) more extended and dispersive along the pass to dusk.
The presented examples of many multispacecraft observations make evident the shortcomings of the subauroral generator paradigm based on the single (test) particle approach. Specifically, SAID, SAPS, and RC injections lag the substorm onset by much shorter time than predicted by standard single particle drift. The freshly formed SAID reside between the PS inner boundary near the plasmapause and the earthward tip of the hot (RC) ion flux but are not enclosed by a pair of enhanced small-scale upward and downward FACs. At the same time, the time lags are consistent with the propagation of earthward bursts of mesoscale hot plasma flows (MPFs) from the tail to the near-midnight plasmasphere and the substorm current wedge (SCW) to dusk. In accordance with the known association of flow bursts with magnetic field dipolarization, the fast SAPS and RC injections on the duskside are coincident with the SCW/WTS development in the adjacent auroral region.
Thus, it seems conceivable to consider a common process underlying the SAID and SAPS generations and the overarching problem of the penetration of MPFs into the inner magnetosphere and the substorm expansion. Namely, smaller-scale SAID interior to the near-midnight plasmapause result from short-circuiting of MPFs by the cold plasma. Polarization shorting naturally explains the narrow width of SAID channels, the abrupt dispersionless PS/auroral boundary, and their intimate relation with the plasmapause, which is not explained by the test-particle Alfvén layer. This concept also views SAID as an inherent part of a turbulent plasmasphere boundary layer formed between the PS inner boundary and the earthward tip of the hot ion flux, viz., the inner edge of the RC injection. Enhanced plasma waves in the TPBL and the SAID channel play a vital role in the penetration of the MPF’s ions into the plasmasphere and the precipitation of the MPF’s particles into the ionosphere, as well as in the energization of the plasmaspheric particles.
While SAID can be created during pseudobreakups, fast-time SAPS are an integral part of a two-loop circuit of the substorm current wedge (SCW2L). The SAPS poleward electric field emerges to support the Pedersen current along the front’s meridian and transports the plasma particles sunward with the front’s speed, thereby creating RC injections on the duskside. This major new approach to understanding SAPS is opposite to the standard paradigm where R2 currents form as the RC pressure builds up. Still, more careful studies, both experimental and numerical, are needed in order to identify and specify the processes involved.
The Author listed have made a direct and intellectual contribution to the work and approved it for publication.
This research was supported by the Air Force Office of Scientific Research, LRIR 22RVCOR011. Approved for public release; distribution is unlimited. Public Affairs release approval # AFRL-2022-5856.
I acknowledge fruitful discussions with Dr. Anatoly Streltsov of Embry-Riddle Aeronautical University and his invention of a catchy image of the plasmapause as a power plant in the magnetosphere.
The author declares that the research was conducted in the absence of any commercial or financial relationships that could be construed as a potential conflict of interest.
All claims expressed in this article are solely those of the authors and do not necessarily represent those of their affiliated organizations, or those of the publisher, the editors, and the reviewers. Any product that may be evaluated in this article, or claim that may be made by its manufacturer, is not guaranteed or endorsed by the publisher.
The views expressed are those of the authors and do not reflect the official guidance or position of the United States Government, the Department of Defense, or of the United States Air Force.
The Supplementary Material for this article can be found online at: https://www.frontiersin.org/articles/10.3389/fspas.2023.1118758/full#supplementary-material
Anderson, P., Carpenter, D., Tsuruda, K., Mukai, T., and Rich, F. (2001). Multisatellite observations of rapid subauroral ion drifts (SAID). J. Geophys. Res. 106, 29585–29599. doi:10.1029/2001JA000128
Anderson, P., Hanson, W., Heelis, R., Craven, J., Baker, D., and Frank, L. (1993). A proposed production model of rapid subauroral ion drifts and their relationship to substorm evolution. J. Geophys. Res. 98, 6069–6078. doi:10.1029/92JA01975
Anderson, P., Heelis, R., and Hanson, W. (1991). The ionospheric signatures of rapid subauroral ion drifts. J. Geophys. Res. 96, 5785. doi:10.1029/90ja02651
Basu, Su., Makela, J. J., MacKenzie, E., Doherty, P., and Wright, J. W. (2008). Large magnetic storm-induced nighttime ionospheric flows at midlatitudes and their impacts on GPS-based navigation systems. J. Geophys. Res. 113, A00A06. doi:10.1029/2008JA013076
Burke, W. J., Maynard, N. C., Hagan, M. P., Wolf, R. A., Wilson, G. R., Gentile, L. C., et al. (1998). Electrodynamics of the inner magnetosphere observed in the dusk sector by CRRES and DMSP during the magnetic storm of June 4 –6, 1991. J. Geophys. Res. 103, 29399–29418. doi:10.1029/98ja02197
Burke, W. J., Rubin, A. G., Maynard, N. C., Gentile, L. C., Sultan, P. J., Rich, F. J., et al. (2000). Ionospheric disturbances observed by DMSP at middle to low latitudes during the magnetic storm of June 4 – 6, 1991. J. Geophys. Res., 105, 18391–18405. doi:10.1029/1999ja000188
De Keyser, J., Roth, M., and Lemaire, J. (1998). The magnetospheric driver of subauroral ion drifts. Geophys. Res. Lett. 25, 1625–1628.
De Keyser, J. (1999). Formation and evolution of subauroral ion drifts. J. Geophys. Res. 104, 12,339–12,349.
Ebihara, Y., and Tanaka, T. (2015). Substorm simulation: Formation of westward traveling surge. J. Geophys. Res. Space Phys. 120 (10), 10,466–10,484. doi:10.1002/2015JA021697
Erickson, P., Foster, J., and Holt, J. (2002). Inferred electric field variability in the polarization jet from Millstone Hill E-region coherent scatter observations. Radio Sci. 37, 11.1–11.14. doi:10.1029/2000RS002531
Figueiredo, S., Karlsson, E., and Marklund, G. (2004). Investigation of subauroral ion drifts and related field-aligned currents and ionospheric Pedersen conductivity distribution. Ann. Geophys. 22, 923–934.
Foster, J., and Burke, W. (2002). Saps: A new categorization for sub-auroral electric fields. Eos, Trans. AGU 83 (36), 393–394. doi:10.1029/2002EO000289
Foster, J., Erickson, P., Lind, F., and Rideout, B. (2004). Millstone Hill coherent-scatter radar observations of electric field variability in the sub-auroral polarization stream. Geophys. Res. Lett. 31, L21803. doi:10.1029/2004GL021271
Frey, H., Mende, S., Angelopoulos, V., and Donovan, E. (2004). Substorm onset observations by IMAGE-FUV. J. Geophys. Res. 109, A10304. doi:10.1029/2004JA010607
Fukui, K., Miyashita, Y., Machida, S., Miyoshi, Y., Ieda, A., Nishimura, Y., et al. (2020). A statistical study of near-Earth magnetotail evolution during pseudosubstorms and substorms with THEMIS data. J. Geophys. Res. Space Phys. 125, e2019JA026642. doi:10.1029/2019JA026642
Galinsky, V., and Shevchenko, V. (2012). A stochastic mechanism of electron heating. Phys. Plasmas 19, 082506. doi:10.1063/1.4742988
Gallardo-Lacourt, B., Nishimura, Y., Lyons, L., Mishin, E., Ruohoniemi, J., Donovan, E., et al. (2017). Influence of auroral streamers on rapid evolution of ionospheric SAPS flows. J. Geophys. Res. Space Phys. 122, 420. doi:10.1002/2017JA024198
Galperin, Yu., Ponomarev, V., and Zosimova, A. (1974). Plasma convection in the polar ionosphere. Ann. Geophys. 30, 1–7.
Galperin, Y. (2002). Polarization jet: Characteristics and a model. Ann. Geophys. 20, 391–404. doi:10.5194/angeo-20-391-2002
Gjerloev, J. (2012). The SuperMAG data processing technique. J. Geophys. Res. 117, A09213. doi:10.1029/2012JA017683
Gkioulidou, M., Ukhorskiy, A. Y., Mitchell, D. G., Sotirelis, T., Mauk, B. H., and Lanzerotti, L. J. (2014). The role of small-scale ion injections in the buildup of Earth’s ring current pressure: Van Allen Probes observations of the 17 March 2013 storm. J. Geophys. Res. Space Phys. 119, 7327–7342. doi:10.1002/2014JA020096
Goldstein, J., Burch, J., Sandel, B., Mende, S., C:son Brandt, P., and Hairston, M. (2005). Coupled response of the inner magnetosphere and ionosphere on 17 April 2002. J. Geophys. Res. 110, A03205. doi:10.1029/2004JA010712
Goldstein, J., Sandel, B., Hairston, M., and Reiff, P. (2003). Control of plasmaspheric dynamics by both convection and subauroral polarization stream. Geophys. Res. Lett. 30, 2243–2246. doi:10.1029/2003gl018390
He, F., Zhang, X., Wang, W., and Chen, B. (2016). Double-peak subauroral ion drifts (DSAIDs). Geophys. Res. Lett. 43 (11), 5554–5562. doi:10.1002/2016gl069133
Heilig, B., Stolle, C., Kervalishvili, G., Rauberg, J., Miyoshi, Y., Tsuchiya, F., et al. (2022). Relation of the plasmapause to the midlatitude ionospheric trough, the sub-auroral temperature enhancement, and the distribution of small-scale field aligned currents as observed in the magnetosphere by THEMIS, RBSP, and Arase, and in the topside ionosphere by Swarm. J. Geophys. Res. Space Phys. 127, e2021JA029646. doi:10.1029/2021JA029646
Henderson, M. (2022). Association of mesoscale auroral structures and breakups with energetic particle injections at geosynchronous orbit. Front. Astron. Space Sci. 9, 742246. doi:10.3389/fspas.2022.742246
Henderson, M. (2012). “Auroral substorms, poleward boundary activations, auroral streamers, omega bands, and onset precursor activity,” in Auroral phenomenology and magnetospheric processes: Earth and other planets. Editors A. Keiling, E. Donovan, F. Bagenal, and T. Karlsson (New York, United States: Wiley Online Library).
Henderson, M., Donovan, E., Foster, J., Mann, I., Immel, T., Mende, S., et al. (2010). Start-to-end global imaging of a sunward propagating SAPS-associated giant undulation event. J. Geophys. Res. 115, A04210. doi:10.1029/2009JA014106
Henderson, M., Morley, S., and Kepko, L. (2018). SAPS-associated explosive brightening on the duskside: A new type of onset-like disturbance. J. Geophys. Res. Space Phys. 123, 197–210. doi:10.1002/2017JA024472
Henderson, M., Skoug, R., Donovan, E., Thomsen, M. F., Reeves, G. D., Denton, M. H., et al. (2006). Substorms during the 10–11 August 2000 sawtooth event. J. Geophys. Res. 111, A06206. doi:10.1029/2005JA011366
Horvath, I., and Lovell, B. (2021b). Complex sub-auroral flow channel structure formed by double-peak sub-auroral ion drifts (DSAID) and abnormal sub-auroral ion drifts (ASAID). J. Geophys. Res. Space Phys. 126 (1), e2020JA028475. doi:10.1029/2020JA028475
Horvath, I., and Lovell, B. (2021a). Subauroral flow channel structures and auroral undulations triggered by Kelvin-Helmholtz waves. J. Geophys. Res. Space Phys. 126, e2021JA029144. doi:10.1029/2021JA029144
Kapitanov, V., and Mishin, E. (1978). Precipitation of fast electrons in an interaction with a plasma jet from a rocket in the ionosphere. Sov. J. Plasma Phys. 4, 628–630.
Karlsson, T., Marklund, G. T., Blomberg, L. G., and Mlkki, A. (1998). Subauroral electric fields observed by the Freja satellite: A statistical study. J. Geophys. Res. 103, 4327–4341.
Khalipov, V., Galperin, Y., Stepanov, A., and Bondar’, E. (2003). Formation of polarization jet during injection of ions into the inner magnetosphere. Adv. Space Res. 31, 1303–1308. doi:10.1016/s0273-1177(03)00016-4
Kim, K.-H., Mozer, F., Lee, D.-H., and Jin, H. (2010). Large electric field at the nightside plasmapause observed by the Polar spacecraft. J. Geophys. Res. 115, A07219. doi:10.1029/2010JA015439
Koustov, A., Nishitani, N., Ebihara, Y., Kikuchi, T., Hairston, M., and Andre, D. (2008). Subauroral polarization streams: Observations with the hokkaido and king salmon SuperDARN radars and modeling. Ann. Geophys. 26, 3317–3327. doi:10.5194/angeo-26-3317-2008
Kunduri, B., Baker, J., Ruohoniemi, J., Nishitani, N., Oksavik, K., Erickson, P., et al. (2018). A new empirical model of the subauroral polarization stream. J. Geophys. Res. Space Phys. 123, 7342–7357. doi:10.1029/2018JA025690
LaBelle, J., Treumann, R., Baumjohann, W., Haerendel, G., Sckopke, N., Paschmann, G., et al. (1988). The duskside plasmapause/ring current interface: Convection and plasma wave observations. J. Geophys. Res. 93, 2573. doi:10.1029/ja093ia04p02573
Liang, J., St-Maurice, J. P., and Donovan, E. (2022). Model simulation of SAID intensification in the ionosphere under a current generator: The role of ion pedersen transport. J. Geophys. Res. Space Phys. 127, e2022JA030960. doi:10.1029/2022JA030960
Lin, D., Wang, W., Scales, W. A., Pham, K., Liu, J., Zhang, B., et al. (2019). SAPS in the 17 March 2013 storm event: Initial results from the coupled magnetosphere-ionosphere-thermosphere model. J. Geophys. Res. Space Phys. 124, 6212–6225. doi:10.1029/2019JA026698
Lyons, L., Nishimura, Y., Gallardo-Lacourt, B., Nicolls, M., Chen, S., Hampton, D., et al. (2015). Azimuthal flow bursts in the inner plasma sheet and possible connection with SAPS and plasma sheet earthward flow bursts. J. Geophys. Res. Space Phys. 120, 5009–5021. doi:10.1002/2015JA021023
Lyons, L. R., Liu, J., Nishimura, Y., Reimer, A. S., Bristow, W. A., Hampton, D. L., et al. (2021). Radar observations of flows leading to substorm onset over Alaska. J. Geophys. Res. Space Phys. 126, e2020JA028147. doi:10.1029/2020JA028147
MacDonald, E., Donovan, E., Nishimura, Y., Case, N., Gillies, D. M., Gallardo-Lacourt, B., et al. (2018). New science in plain sight: Citizen scientists lead to the discovery of optical structure in the upper atmosphere. Sci. Adv. 4 (3), eaaq0030. doi:10.1126/sciadv.aaq0030
Makarevich, R., and Dyson, P. (2008). Dual HF radar study of the subauroral polarization stream. Ann. Geophys. 25, 2579–2591. doi:10.5194/angeo-25-2579-2007
Makarevich, R., Kellerman, A., Devlin, J., Ye, H., Lyons, L., and Nishimura, Y. (2011). SAPS intensification during substorm recovery: A multi-instrument case study. J. Geophys. Res. 116, A11311. doi:10.1029/2011JA016916
Malaspina, D., Wygant, J., Ergun, R., Reeves, G., Skoug, R., and Larsen, B. (2015). Electric field structures and waves at plasma boundaries in the inner magnetosphere. J. Geophys. Res. Space Phys. 120, 4246–4263. doi:10.1002/2015JA021137
Maynard, N., Aggson, T., and Heppner, J. (1980). Magnetospheric observation of large subauroral electric fields. Geophys. Res. Lett. 7, 881–884. doi:10.1029/gl007i011p00881
Meredith, N., Horne, R., Johnstone, A., and Anderson, R. (2000). The temporal evolution of electron distributions and associated wave activity following substorm injections in the inner magnetosphere. J. Geophys. Res. 105 (12), 12907–12917. doi:10.1029/2000ja900010
Mishin, E., and Blaunstein, N., (2008). “Irregularities within subauroral polarization stream-related troughs and GPS radio interference at midlatitudes,” in MidLatitude ionospheric dynamics and disturbances, geophysical monograph series. Editor T. Fuller-Rowell (Washington, DC: AGU).
Mishin, E., Burke, W., Huang, C., and Rich, F. (2003). Electromagnetic wave structures within subauroral polarization streams. J. Geophys. Res. 108, 1309. doi:10.1029/2002JA009793
Mishin, E., and Burke, W. (2005). Stormtime coupling of the ring current, plasmasphere and topside ionosphere: Electromagnetic and plasma disturbances. J. Geophys. Res. 110, A07209. doi:10.1029/2005JA011021
Mishin, E., Burke, W., and Viggiano, A. (2004). Stormtime subauroral density troughs: Ion-molecule kinetics effects. J. Geophys. Res. 109, A10301. doi:10.1029/2004JA010438
Mishin, E., Foster, J., Potekhin, A., Rich, F., Schlegel, K., Yumoto, K., et al. (2002). Global ULF disturbances during a stormtime substorm on 25 September 1998. J. Geophys. Res. 107 (12), SMP 40-1–SMP 40-11. doi:10.1029/2002JA009302
Mishin, E. (2013). Interaction of substorm injections with the subauroral geospace: 1. Multispacecraft observations of SAID. J. Geophys. Res. Space Phys. 118, 5782–5796. doi:10.1002/jgra.50 548
Mishin, E., Nishimura, Y., and Foster, J. (2017). SAPS/SAID revisited: A causal relation to the substorm current wedge. J. Geophys. Res. Space Phys. 122, 8516–8535. doi:10.1002/2017JA024263
Mishin, E., and Puhl-Quinn, P. (2007). SAID: Plasmaspheric short circuit of substorm injections. Geophys. Res. Lett. 34, L24101. doi:10.1029/2007GL031925
Mishin, E., Puhl-Quinn, P., and Santolik, O. (2010). Said: A turbulent plasmaspheric boundary layer. Geophys. Res. Lett. 37, L07106. doi:10.1029/2010GL042929
Mishin, E. (2016). SAPS onset timing during substorms and the westward traveling surge. Geophys. Res. Lett. 43, 6687–6693. doi:10.1002/2016GL069693
Mishin, E., and Sotnikov, V. (2017). The turbulent plasmasphere boundary layer and the outer radiation belt boundary. Plasma Phys. control. Fusion 59, 124003. doi:10.1088/1361-6587/aa8481
Mishin, E., and Streltsov, A. (2021b). “Meso- and small-scale structure of the subauroral geospace,” in Space physics and aeronomy collection V.3: Ionosphere dynamics and applications. Editors C. Huang, and G. Lu (New York, United States: Wiley and Sons). Geophysical Monograph Series, vol. 260.
Mishin, E., and Streltsov, A. (2021a). Nonlinear wave and plasma structures in the auroral and subauroral geospace. Cambridge, MA, USA: Elsevier. 9780128207604.
Mishin, E., and Streltsov, A. (2020). Prebreakup arc intensification due to short circuiting of mesoscale plasma flows over the plasmapause. J. Geophys. Res. Space Phys. 125, e2019JA027666. doi:10.1029/2019JA027666
Mishin, E. V., and Mishin, V. M. (2007). Prompt response of SAPS to stormtime substorms. J. Atm. Sol.-Terr. Phys. 69, 1233–1240. doi:10.1016/j.jastp.2006.09.009
Moffett, R., Ennis, A., Bailey, G., Heelis, R., and Brace, L. (1998). Electron temperatures during rapid subauroral ion drift events. Ann. Geophys. 16, 450–459. doi:10.1007/s00585-998-0450-x
Newell, P., and Meng, C.-I. (1987). Low altitude observations of dispersionless substorm plasma injections. J. Geophys. Res. 92, 10063. doi:10.1029/ja092ia09p10063
Nishimura, Y., Gallardo-Lacourt, B., Zou, Y., Mishin, E., Knudsen, D. J., Donovan, E. F., et al. (2019). Magnetospheric signatures of STEVE: Implications for the magnetospheric energy source and interhemispheric conjugacy. Geophys. Res. Lett. 46, 5637–5644. doi:10.1029/2019GL082460
Nishimura, Y., Hussein, A., Erickson, P. J., Gallardo-Lacourt, B., and Angelopoulos, V. (2022). Statistical study of magnetospheric conditions for SAPS and SAID. Geophys. Res. Lett. 49, e2022GL098469. doi:10.1029/2022GL098469
Nishimura, Y., Mrak, S., Semeter, J., Coster, A., Jayachandran, P., Groves, K., et al. (2021). Evolution of mid-latitude density irregularities and scintillation in North America during the 7–8 September 2017 storm. J. Geophys. Res. Space Phys. 126, e2021JA029192. doi:10.1029/2021JA029192
Oksavik, K., Greenwald, R., Ruohoniemi, J., Hairston, M., Paxton, L., Baker, J., et al. (2006). First observations of the temporal/spatial variation of the sub-auroral polarization stream from the SuperDARN Wallops HF radar. Geophys. Res. Lett. 33, L12104. doi:10.1029/2006GL026256
Parkinson, M. L., Pinnock, M., Wild, J. A., Lester, M., Yeoman, T. K., Milan, S. E., et al. (2005). Interhemispheric asymmetries in the occurrence of magnetically conjugate sub-auroral polarization streams. Ann. Geophys. 23, 1371–1390.
Puhl-Quinn, P., Matsui, H., Mishin, E., Mouikis, C., Kistler, L., Khotyaintsev, Y., et al. (2007). Cluster and DMSP observations of SAID electric fields. J. Geophys. Res. 112, A05219.
Rich, F., Burke, W., Kelley, M., and Smiddy, M. (1980). Observations of field-aligned currents in association with strong convection electric fields at subauroral latitudes. J. Geophys. Res. 85 (5), 2335–2340. doi:10.1029/ja085ia05p02335
Schunk, R., Banks, P., and Raitt, W. (1976). Effect of electric fields and other processes upon the nighttime high-latitude F layer. J. Geophys. Res. 81, 3271.
Sinevich, A., Chernyshov, A., Chugunin, D., Oinats, A., Clausen, L., Miloch, W., et al. (2022). Small-scale irregularities within polarization jet/SAID during geomagnetic activity. Geophys. Res. Lett. 49, e2021GL097107. doi:10.1029/2021GL097107
Smiddy, M., Kelley, M. C., Burke, W., Rich, F., Sagalyn, R., Schuman, B., et al. (1977). Intense poleward-directed electric fields near the ionospheric projection of the plasmapause. Geophys. Res. Lett. 4, 543–546.
Spiro, R., Heelis, R., and Hanson, W. (1979). Rapid subauroral ion drifts observed by Atmosphere Explorer C. Geophys. Res. Lett. 6 (8), 657e660. doi:10.1029/GL006i008p00657
Streltsov, A., and Mishin, E. (2018). Ultralow frequency electrodynamics of magnetosphere-ionosphere interactions near the plasmapause during substorms. J. Geophys. Res. Space Phys. 123, 7441–7451. doi:10.1029/2018JA025899
Tsyganenko, N., Singer, H., and Kasper, J. (2003). Storm-time distortion of the inner magnetosphere: How severe can it get? J. Geophys. Res. 108 (5), 1209. doi:10.1029/2002JA009808
Wang, W., Yang, J., Nishimura, Y., Sun, W., Wei, D., Zhang, F., et al. (2021). Magnetospheric source and electric current system associated with intense SAIDs. Geophys. Res. Lett. 48, e2021GL093253. doi:10.1029/2021GL093253
Wang, Z., Zou, S., Shepherd, S. G., Liang, J., Gjerloev, J. W., Ruohoniemi, J. M., et al. (2019). Multi-instrument observations of mesoscale enhancement of subauroral polarization stream associated with an injection. J. Geophys. Res. Space Phys. 124, 1770–1784. doi:10.1029/2019JA026535
Wei, D., Yu, Y., Ridley, A., Cao, J., and Dunlop, M. (2019). Multi-point observations and modeling of subauroral polarization streams (SAPS) and double-peak subauroral ion drifts (DSAIDs): A case study. Adv. Space Res. 63, 3522–3535. doi:10.1016/j.asr.2019.02.004
Weimer, D., Goertz, C., Gurnett, D., Maynard, N., and Burch, J. (1985). Auroral zone electric fields from DE 1 and 2 at magnetic conjunctions. J. Geophys. Res. 90, 7479–7494. doi:10.1029/ja090ia08p07479
Yeh, H., Foster, J., Rich, F., and Swider, W. (1991). Storm time electric field penetration observed at mid-latitude. J. Geophys. Res. 96 (A4), 5707–5721. doi:10.1029/90ja02751
Yizengaw, E., and Moldwin, M. (2005). The altitude extension of the mid-latitude trough and its correlation with plasmapause position. Geophys. Res. Lett. 32, L09105. doi:10.1029/2005GL022854
Keywords: subauroral ion drifts, subauroral polarization streams, current and voltage generators, plasmasphere boundary layer, polarization shorting, two-loop substorm current wedge
Citation: Mishin EV (2023) The evolving paradigm of the subauroral geospace. Front. Astron. Space Sci. 10:1118758. doi: 10.3389/fspas.2023.1118758
Received: 07 December 2022; Accepted: 08 March 2023;
Published: 27 March 2023.
Edited by:
Joseph E. Borovsky, Space Science Institute, United StatesReviewed by:
Michael G. Henderson, Los Alamos National Laboratory (DOE), United StatesCopyright © 2023 Mishin. This is an open-access article distributed under the terms of the Creative Commons Attribution License (CC BY). The use, distribution or reproduction in other forums is permitted, provided the original author(s) and the copyright owner(s) are credited and that the original publication in this journal is cited, in accordance with accepted academic practice. No use, distribution or reproduction is permitted which does not comply with these terms.
*Correspondence: Evgeny V. Mishin, ZXZnZW55Lm1pc2hpbkBzcGFjZWZvcmNlLm1pbA==
Disclaimer: All claims expressed in this article are solely those of the authors and do not necessarily represent those of their affiliated organizations, or those of the publisher, the editors and the reviewers. Any product that may be evaluated in this article or claim that may be made by its manufacturer is not guaranteed or endorsed by the publisher.
Research integrity at Frontiers
Learn more about the work of our research integrity team to safeguard the quality of each article we publish.