 Alexander Y. Drozdov
 Dmitri Kondrashov
 Kirill Strounine3
 Yuri Y. Shprits
95% of researchers rate our articles as excellent or good
Learn more about the work of our research integrity team to safeguard the quality of each article we publish.
Find out more
ORIGINAL RESEARCH article
Front. Astron. Space Sci. , 19 May 2023
Sec. Space Physics
Volume 10 - 2023 | https://doi.org/10.3389/fspas.2023.1072795
This article is part of the Research Topic Radiation Belt Dynamics: Theory, Observation and Modeling View all 13 articles
We present a reconstruction of radiation belt electron fluxes using data assimilation with low-Earth-orbiting Polar Orbiting Environmental Satellites (POES) measurements mapped to near equatorial regions. Such mapping is a challenging task and the appropriate methodology should be selected. To map POES measurements, we explore two machine learning methods: multivariate linear regression (MLR) and neural network (NN). The reconstructed flux is included in data assimilation with the Versatile Electron Radiation Belts (VERB) model and compared with Van Allen Probes and GOES observations. We demonstrate that data assimilation using MLR-based mapping provides a reasonably good agreement with observations. Furthermore, the data assimilation with the flux reconstructed by NN provides better performance in comparison to the data assimilation using flux reconstructed by MLR. However, the improvement by adding data assimilation is limited when compared to the purely NN model which by itself already has a high performance of predicting electron fluxes at high altitudes. In the case an optimized machine learning model is not possible, our results suggest that data assimilation can be beneficial for reconstructing outer belt electrons by correcting errors of a machine learning based LEO-to-MEO mapping and by providing physics-based extrapolation to the parameter space portion not included in the LEO-to-MEO mapping, such as at the GEO orbit in this study.
The radiation belts consist of electrons and protons trapped by the Earth’s magnetic field (Lyons and Thorne, 1973) and are a major source of damaging space weather effects on near-Earth spacecraft. The inner electron belt is located typically between 1.2 and 2.0 Earth radii RE, while the outer belt extends from about 3 to ∼8 RE. Relativistic electron fluxes in the outer belt are highly variable; this variability is due to the competing effects of source and loss processes, both of which are forced by solar-wind-driven magnetospheric dynamics and by resonant interactions of plasma waves and particles (Thorne, 2010; Shprits et al., 2008a; 2008b).
Understanding the mechanisms of build-up and decay of radiation belt electron fluxes is one of the fundamental problems of modern space physics having an important application in relation to human technological systems. While significant progress has been achieved in understanding the electron radiation belt dynamics using physics-based models, it is still incomplete, due to the limited number of satellites in mapping the global radiation environment in space at any given time. Here, data assimilation techniques become very important and helpful, as they combine measurements that are irregularly distributed in space and time with a physics-based model to estimate the evolution of the system’s state in time; both the model and observations typically include errors. The Kalman filter (K-filter, hereafter) (Kalman, 1960) technique of data assimilation represents so-called sequential filtering or sequential estimation, and its various generalizations have been successfully applied in various engineering fields, including autonomous or assisted navigation systems, as well as in atmospheric, oceanic, and climate studies (Ghil and Malanotte-Rizzoli, 1991; Kalnay, 2003). Data assimilation for radiation belts by K-filter techniques had been pioneered at UCLA in collaboration with Richard Thorne and Michael Ghil (Kondrashov et al., 2007; Shprits et al., 2007; Daae et al., 2011; Kondrashov et al., 2011) starting with the Versatile Electron Radiation Belt (VERB) 1-D code, where only radial diffusion is included, similar to study of (Koller et al., 2007) about the same time. For the VERB-3D code, where the state vector is of a very large size
Before the launch of the Van Allen Probes (Mauk et al., 2013) that provided unprecedented measurements of the radiation belts, several works attempted reconstruction of the electron flux variation at geostationary orbit using a neural network (e.g., Koons and Gorney, 1991; Fukata et al., 2002; Ling et al., 2010; Kitamura et al., 2011), which was important for space weather applications and for the understanding of the physical processes driving radiation belt dynamics. The neural network approach of the electron flux prediction showed decent agreement with observations and other models (Perry et al., 2010). Lately, machine learning methods including neural networks became increasingly commonly used in reconstructing and forecasting relativistic electrons in radiation belts, using solar wind conditions, geomagnetic indices and other inputs (e.g., Batusov et al., 2018; Pires de Lima et al., 2020; Sarma et al., 2020; Chu et al., 2021; Landis et al., 2022; Ma et al., 2022; Wing et al., 2022; Zhelavskaya et al., 2016; 2017; 2018; 2021).
Kanekal et al. (2001) have found a remarkable global coherency in ultrarelativistic electron populations (
Chen et al. (2019) developed a linear filter model to predict distributions of electrons within Earth’s outer radiation belt using measurements from the Polar Operational Environmental Satellite (POES) and LANL GEO. This PreMevE model provided a prediction spanning several hours as well as a 1-day forecasts of the spin-averaged ∼MeV radiation belt electrons near the equator. The extended PreMevE 2.0 (Pires de Lima et al., 2020) and 2E (Sinha et al., 2021) models further evaluated multiple machine learning models that fall into four different classes of linear and neural network architectures and utilized electron intensities from Polar Operational Environmental Satellite (POES) and LANL GEO to map into 1 MeV and
Claudepierre and O’Brien (2020) also developed the neural net SHELLS model nowcasting daily 350 keV and 1 MeV electron fluxes in the outer radiation belt by using as input the electron fluxes from the POES satellite, and the model was built for spin-averaged flux. A new version of the SHELLS model was recently developed by Boyd et al. (2023) which incorporates the radial, angular and energy dependence as well as finer temporal resolution, and can accurately nowcast the outer electron radiation belt dynamics using both out-of-sample data from the Van Allen Probes and GPS.
In this work, we use machine learning to enhance existing satellite observations for data assimilation purposes. Our main goal is to build a model that will map the low-Earth-orbit satellite data to near-equatorial regions. Mapping the POES data to the equatorial region enables data assimilation (DA) of the electron radiation belts with the Versatile Electron Radiation Belt (VERB) code, in particular providing the state of the radiation belts in the wide range of equatorial pitch-angles and energies. The fully reconstructed state of the radiation belts is particularly useful for space weather applications, as it allows to fly virtual satellites with arbitrary orbital parameters. Using POES data is ideal for this task because of its long history and availability in the near future.
Our work extends earlier studies and is different in several important ways. First, we use POES data for mapping (nowcasting) the newly available Van Allen Probes ECT dataset (Boyd et al., 2021) in an extended range of available energies and equatorial pitch angles, which is essential for the DA and radiation belts reconstruction because it is necessary for the computation of the PSD in the adiabatic invariant space, that is used in the physics-based model, e.g. VERB. Secondly, we explore two machine learning methods for mapping: multivariate linear regression (MLR) and neural net (NN).
This is an initial study that is aimed to test if the considered machine learning models (MLR and NN) can be used by data assimilation to reconstruct radiation belts. We test the entire workflow including first mapping to the equator and then assimilating ML model results into the VERB model. In the particular case described in this study, we only use POES satellites (specifically, NOAA-15, NOAA-16, NOAA-18, and NOAA-19) for mapping from LEO to MEO (Van Allen Probes), to reconstruct the entire radiation belts and along any satellite trajectory, such as GOES. Furthermore, data assimilation allows us to combine measurements from different sources and different satellites, and this will be explored in future studies.
To summarize, the machine learning (ML) based mapping of LEO to MEO can be interpreted as creating high-quality Van Allen Probes-like satellite measurements even after the end of the Van Allen Probes mission, and which can be used to reconstruct radiation belts via data assimilation. Such use of ML-based “virtual satellite” is a very powerful and novel concept that could be potentially applied to other Earth sciences. Our approach represents the combination of physics-based (via data assimilation with VERB) and ML approaches, known as gray box (Camporeale, 2019), and takes into account errors (uncertainties) in both.
In this study, we utilize measurements from the National Aeronautics and Space Administration (NASA) Van Allen Probes (Mauk et al., 2013) and from the National Oceanic and Atmospheric Administration (NOAA) Polar Orbiting Environmental Satellites (POES) (Evans and Greer, 2004).
The Van Allen Probes included two identical spacecraft (RBSP-A and RBSP-B) that were orbiting through the Earth’s radiation belts between a perigee and apogee of 1.1 and 5.8 RE (medium Earth orbit, MEO), respectively, with a low inclination
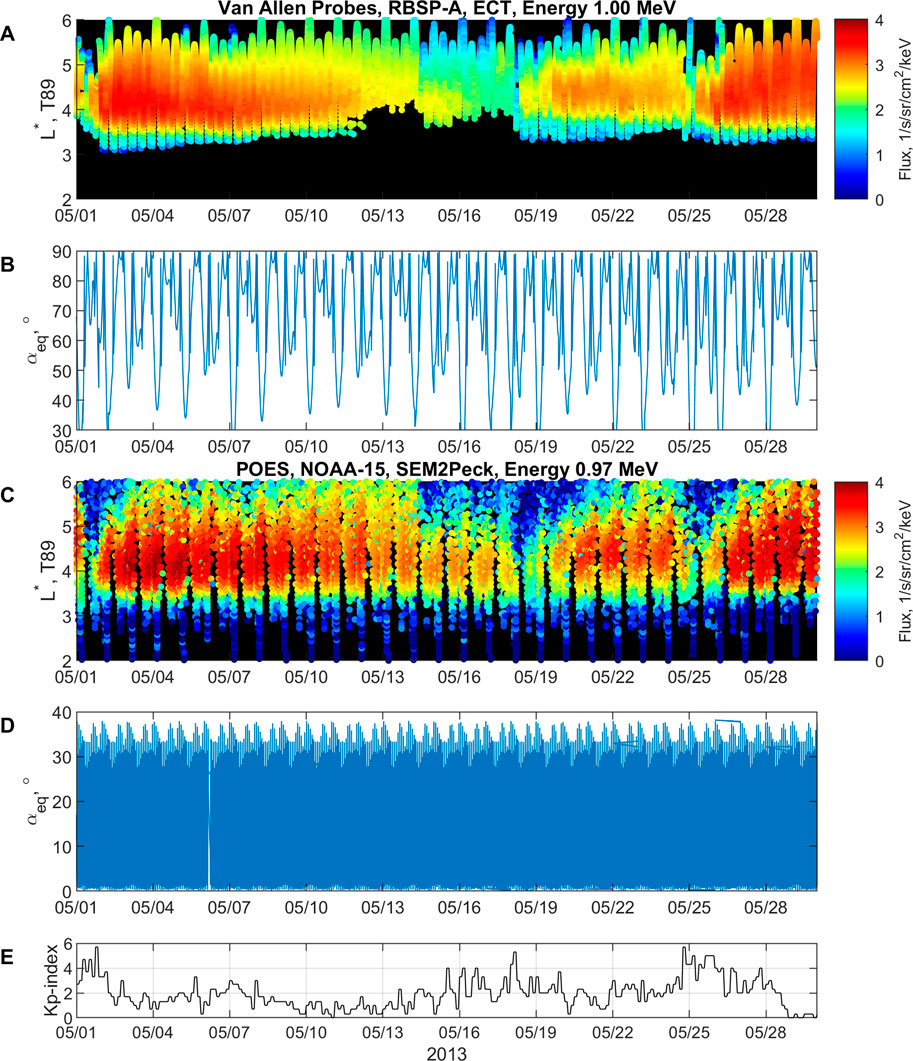
FIGURE 1. Example of the data used in this study: (A) Van Allen Probes observation from RBSP-A satellite (ETC data set), 1 MeV electron flux and (B) corresponding equatorial pitch angle αeq. (C) POES observations from NOAA-15 satellite (SEM2Peck data set), 0.97 MeV electron flux and (D) corresponding equatorial pitch angle αeq. (E) Kp index.
The POES are multiple Sun-synchronous low-orbiting satellites (altitude of ∼800 km or lower Earth orbit, LEO), which provide comprehensive coverage in L-shell and magnetic local time (MLT). The orbital period of each satellite is ∼100 min. The satellites provide measurements with two telescopes oriented to zenith (0°) and perpendicular (90°). Two telescopes enable us to distinguish between particles in the loss cone and trapped (or quasi-trapped) population. In this study, we use 4 satellites: NOAA-15, NOAA-16, NOAA-18, and NOAA-19. We use a contamination-corrected dataset of differential electron flux that is available from 1998 until 11 May 2014 (Peck et al., 2015). In this study, we limit the energy range in the selected dataset from ∼30 keV up to ∼1.9 MeV, providing 20 energy channels. Figure 1C shows electron flux measurements from a single POES satellite (NOAA-15) using the perpendicular telescope-maximizing corresponding equatorial pitch-angle coverage on Figure 1D. In comparison to the Van Allen Probes, observations from POES are limited in equatorial pitch-angle coverage but have a much finer temporal resolution, which makes them highly advantageous for the reconstruction of the radiation belts.
GOES spacecraft at geosynchronous orbit measures electrons in several integral flux channels using the Energetic Proton, Electron, and Alpha particle Detector (EPEAD) (e.g., Rodriguez et al., 2014). In this study we use
For all missions, the adiabatic invariants μ, K, and L* (Roederer, 1970) are computed with The International Radiation Belt Environment Modeling (IRBEM) library, utilizing the International Geomagnetic Reference Field (IGRF) internal field model, and the T89 external field model (Tsyganenko, 1989).
The adiabatic motion of energetic charged particles in these belts consists of three basic periodic components: gyro-motion about Earth’s magnetic field lines; bounce motion of the gyration center up and down a given magnetic field line; and the azimuthal drift of particles around the Earth, perpendicular to the meridional planes formed by the magnetic polar axis and the field lines. There are three adiabatic invariants, each associated with one of these motions, and by averaging over the gyro, bounce, and drift motions, we can describe the evolution of the particles’ phase-space density (PSD) solely in terms of these invariants — (μ, J, Φ), respectively. In the collisionless magnetospheric plasma, resonant wave-particle interactions provide the dominant mechanism for violation of the adiabatic invariants, resulting in changes in the outer radiation belt structure. For small wave amplitudes and a broad wave spectrum, such resonant interaction can be described within a framework of the quasi-linear (QL) theory, which is based on the 3-D Fokker-Planck diffusion equation (Shultz and Lanzerotti, 1974). The three-dimensional Versatile Electron Radiation Belt (VERB-3D) code (Subbotin and Shprits, 2009) solves the Fokker-Planck equations for PSD of electrons f written in term operators describing the radial diffusion, equatorial pitch angle (αeq) and energy (or momentum p) diffusion:
where
By using common nomenclature for data assimilation (DA), in the K-filter formulation for a numerically discretized model (such as VERB-3D), the observational data yo and dynamically evolving fields of the model forecast xf are combined into analysis xa:
Here xk represents a state column vector composed of all model variables on a numerical grid–for our case, it is PSD f in Eq. 1, k is the time-stepping index, and the time-dependent matrix Mk of the VERB numerical model is obtained by numerically discretizing the partial differential equations that govern the physical system under study, i.e. Fokker-Plank equations for PSD (Eq. (1)). The use of the full Kalman filter for a three-dimensional model is a challenging task, as it requires the operation of O(N3) in computational complexity, where N is the number of all points in the grid. In this study, we use a 31 × 30 × 29 grid in the coordinates of L*, p, αeq, respectively. Instead of using the full Kalman filter, we use an alternative method of split-operator approach Shprits et al. (2013), where the Kalman filter is applied for each grid direction. The model matrices Mk correspond to each of the diffusion operators in Eq. 1. The grid is selected to cover the L* ∈ [1, 7], with pitch angle and energy covering αeq ∈ [0.3°, 89.7°], E ∈ [0.01, 10] MeV at L* = 7.
The matrix Hk represents a map between the model state xk and the observations of that state. The last term on the right-hand side of Eq. 2,
is the innovation vector that represents the mismatch between the model and observations and is used to drive the model state closer to the observations.
Specifying the model and observational errors Q and R allows us to follow the time evolution of the forecast-error Pf and analysis-error Pa covariance matrices.
This knowledge of the error-covariance matrices provides, in turn, the optimal Kalman gain matrix Kk, which gives the proper weight to the observations vs. the model prediction:
Information obtained in the error-covariance matrices is crucial in modifying the state vector xk in observation-void regions.
In the standard formulation of the Kalman filter, the noise covariances Q and R are assumed to be known. This rarely happens in practice, and usually, some simple approximations are made. Assuming the log-normal distribution of errors for PSD and uncorrelated errors in different locations, both Q and R are specified as diagonal matrices, and the diagonal terms of Q and R are taken simply as
To map POES measurements to the high equatorial pitch-angle region, we use the following data processing. Van Allen Probes data is interpolated into the regular grid of equatorial pitch angles from 5° to 85° with a step of 10°. Then the data is interpolated onto the same energy grid as the energy channels on the POES satellites. The interpolated flux from RBSP-A and RBSP-B is merged and binned in time and L*
Next, we calculated the standard deviation of the log10 of POES flux (j) at all POES energies and found very high variations as revealed by very high standard deviation values. The high variation of the flux is considered to be an outlier of the unrealistically low or high values of the measured fluxes. To remove the unrealistic measurements, we exclude the data that is below the threshold based on the visual inspection of measurements. The threshold is calculated for the 1-year period of 01 March 2013–01 March 2014 for each energy channel for the entire L* range
The results of this method were inspected at all energies for several months of POES measurements. The inspection included the analysis of the flux vs. L* dependence with a determined threshold level. The threshold level was selected to be significantly below the reliable flux level.
To obtain the extrapolated pitch-angle distribution, we assume a simplified functional dependence of the flux as shown by the following equation:
where αeq is an equatorial pitch angle and j0 is the flux of the trapped population at 90°. Then the POES measurements are extrapolated to the equatorial pitch angles on the grid (
where
Then, we calculate the ratio
Using the logarithm of the obtained ratio (log10(r)), we perform a multivariate linear regression analysis. We obtain calibration coefficients (ξ) that depend on Kp, L*, energy (E) and pitch angle (αeq) based on this analysis:
where b0…b4 are regression coefficients. The calibration coefficients ξ can be used to obtain the fluxes at given αeq, namely

FIGURE 2. Observed and reconstructed using NOAA-15 satellite electron flux at 1 MeV and αeq =75° for the training/testing period of 1 year from 01 March 2013 until 01 March 2014. (A) Van Allen Probes observations. (B) Reconstructed with multivariate linear regression analysis flux. (C) Reconstructed with neural network flux. (D) Kp index.

FIGURE 3. Observations and reconstruction using NOAA-15 satellite electron flux at 1 MeV and αeq =75° for the interval outside of the training/testing period, from 01 April 2014 until 01 May 2014. (A) Van Allen Probes observations. (B) Reconstructed with multivariate linear regression analysis flux. (C) Reconstructed with neural network flux. (D) Kp index.
The constructed neural network (NN) model predicts Van Allen Probes ECT electron flux jRBSP for a specific energy channel and a local pitch angle channel using one fully connected layer with 32 neurons and the rectified linear unit (“relu”) activation function in the hidden layer. Our NN model design choices are generated by using best practices and an extensive parameter search and testing. We have compared various designs of NN model with different number of hidden layers and neurons (not shown here), and selected 32 hidden neurons based on the minimal validation error.
Thus, in total, we independently train NE * Nα = 180 NN models, where NE = 20 and Nα = 9 are the number of selected energy and local pitch angle channels from the ECT dataset, respectively. The 20 selected energy channels from the ECT dataset are chosen to be close to the selected energy channels from POES dataset by Peck et al. (2015). The pitch angles are selected from 10° up to 90° with the step of 10°. Thus, the single network input data consists of the POES fluxes in all 20 energy channels (1.20), one POES equatorial pitch angle (selected only from a perpendicular telescope), and one Van Allen Probes equatorial pitch angle (selected from a local pitch angle channel) and L* (as explained below and computed with T89 model), as well as Kp index:
Both POES and Van Allen Probes fluxes are transformed into logarithmic space and normalized before fitting the network. The outliers of the unrealistically low or high values of the POES flux measured are removed similarly as described in Section 2.4. All of the inputs and output are aggregated to and averaged at specific time t (within 1 hour) and L* location (within 0.1 L*) of ECT output, and are also standardized to have zero mean and unit variance. The network minimizes the mean-squared error loss (MSE) function using the stochastic gradient descent ‘adam’ method with initial learning rate as 0.005, piecewise learn rate schedule for dropping the learning rate every 125 epochs by multiplying by a factor of 0.2. In order to avoid overfitting, we have used training, validation, and test datasets. We randomly select 90% of data from 01 March 2013 until 01 March 2014 as training, and 10% as the validation set (see Figure 2). We have used validation-based early stopping, that is the training process stops when the MSE of the validation set stops improving for several consecutive epochs.
The test period from 01 April 2014 until 01 May 2014 (see Figure 3) is used to assess out-of-sample model performance and is included into data assimilation (Section 3). Once the neural network is trained, the Van Allen Probes data are no longer needed; only the POES fluxes, locations in space and pitch angle, and the Kp index are required to specify the outer electron belt environment. While
Figure 2 shows the electron flux at 1 MeV and αeq = 75° for a 1-year period (01 March 2013–01 March 2014). This period is used to obtain calibration coefficients using the MLR method (Figure 2B) and to train and validate the NN (Figure 2C). Figure 2 serves an illustrative purpose and demonstrated both methods (MLR and NN) provide a reasonable reconstruction of the electron flux at a higher equatorial pitch angle than POES can observe. For the testing of the methods and for the following data assimilation, we use a different period (01 April 2014–01 May 2014), which is shown in Figure 3. For the quantitative estimation of the MLR and NN models, we use metrics presented in Claudepierre and O’Brien (2020). Namely, we use coefficients of determination [r2; Eq. (1) from (Claudepierre and O’Brien, 2020)] and correlation coefficients calculated in logarithmic (rlog) and linear (rlin) space between Van Allen Probes, RBSP-A and reconstituted flux from NOAA-15. The metrics are calculated for the full range of L* and since RBSP-A and NOAA-15 data have different time resolutions, the data is binned with the time step of 4 h and L* step of 0.1 prior to calculating the coefficients. The coefficients are presented in Table 1 and are computed values for 3 energies (0.5, 1.0, 1.5 MeV) and separately for 3 different pitch-angle values (35°, 55°, 75°). Although the selection of energy and pitch angle is limited, both models indicate similar performance albeit the NN model is at least noticeably better than MLR in term of r2.
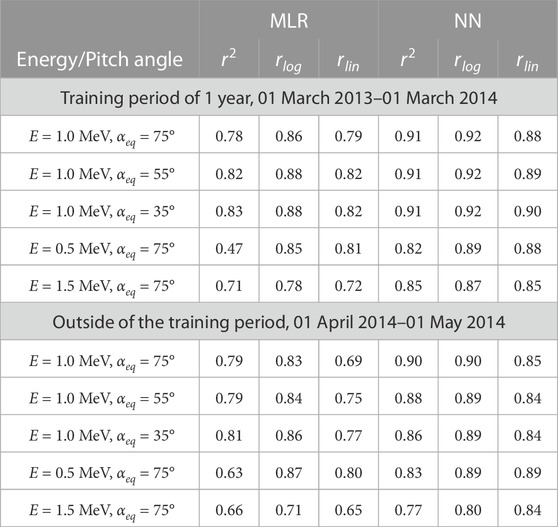
TABLE 1. Coefficients of determination (r2) and correlation coefficients calculated in logarithmic (rlog) and linear (rlin) space between Van Allen Probes, RBSP-A and reconstituted from POES NOAA-15 data using MLR and NN models.
The predicted flux j by MLR and NN models is converted to PSD f as f = j/(p ⋅ c)2 for convenience, where p is momentum, and c is the speed of light. The first (μ) and second (K) invariants are calculated from the energy and equatorial pitch angles using a dipole field and preserving the third adiabatic invariant (L*) that is calculated using the T89 magnetic field. The resulting PSD from POES-based MLR- and NN- reconstructed fluxes at multiple energies based on POES data and equatorial pitch angles
Next we compare DA results using POES-based NN- and MLR-reconstructed fluxes in the validation period from 01 April 2014 until 01 May 2014. Figure 4A shows the binned Van Allen Probes observations as a ground truth at 1 MeV and αeq = 75°, in comparison to DA results using MLR-reconstructed fluxes, shown in Figure 4B. Figure 4C show the logarithmic difference between Van Allen Probes observations and DA results.
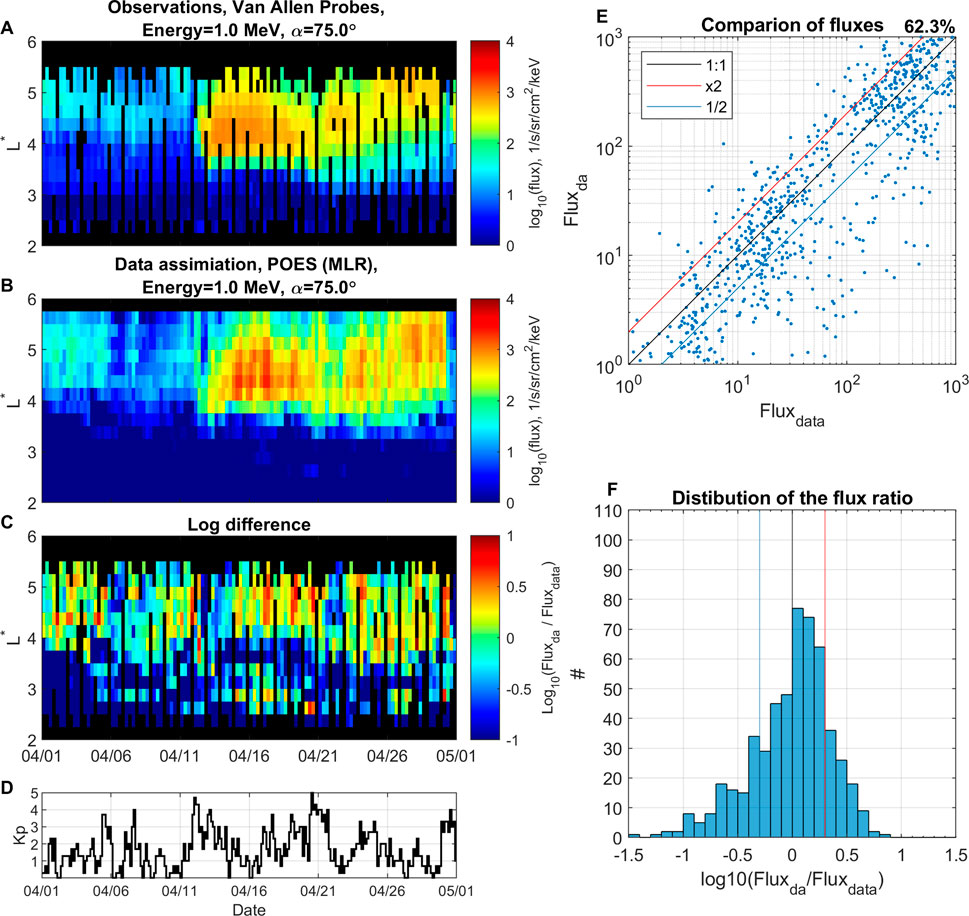
FIGURE 4. Data assimilation using reconstructed with multivariate linear regression analysis data. Electron flux at 1 MeV and αeq =75° for the period from 01 April 2014 until 01 May 2014. (A) Binned Van Allen Probe observations. (B) Data assimilation using reconstructed flux from POES data. (C) Logarithmic difference between flux from data assimilation and observations. (D) Kp index. (E) Comparison of fluxes between observations Fluxdata and DA results Fluxda, (F) distribution of the logarithmic flux ratio.
Figure 4E shows a quantitative comparison of fluxes between observations Fluxdata and data assimilation using MLR-reconstructed fluxes Fluxda, with 62.3% of points being within a factor of 2. Figure 4F shows a histogram of their corresponding logarithmic ratio. The histogram is nearly normally distributed with slight overestimation of Fluxda in comparison to Fluxdata.
Figure 5 is in the same format as Figure 4 but shows DA results with NN-reconstructed fluxes and indicating an improved accuracy with 72.9% of points within the factor of 2 (Figure 5E). The histogram on Figure 5F shows that data assimilation using NN-reconstructed fluxes results in almost no overestimation larger than a factor of 2, and its peak is shifted towards underestimation of Fluxda in comparison to Fluxdata.
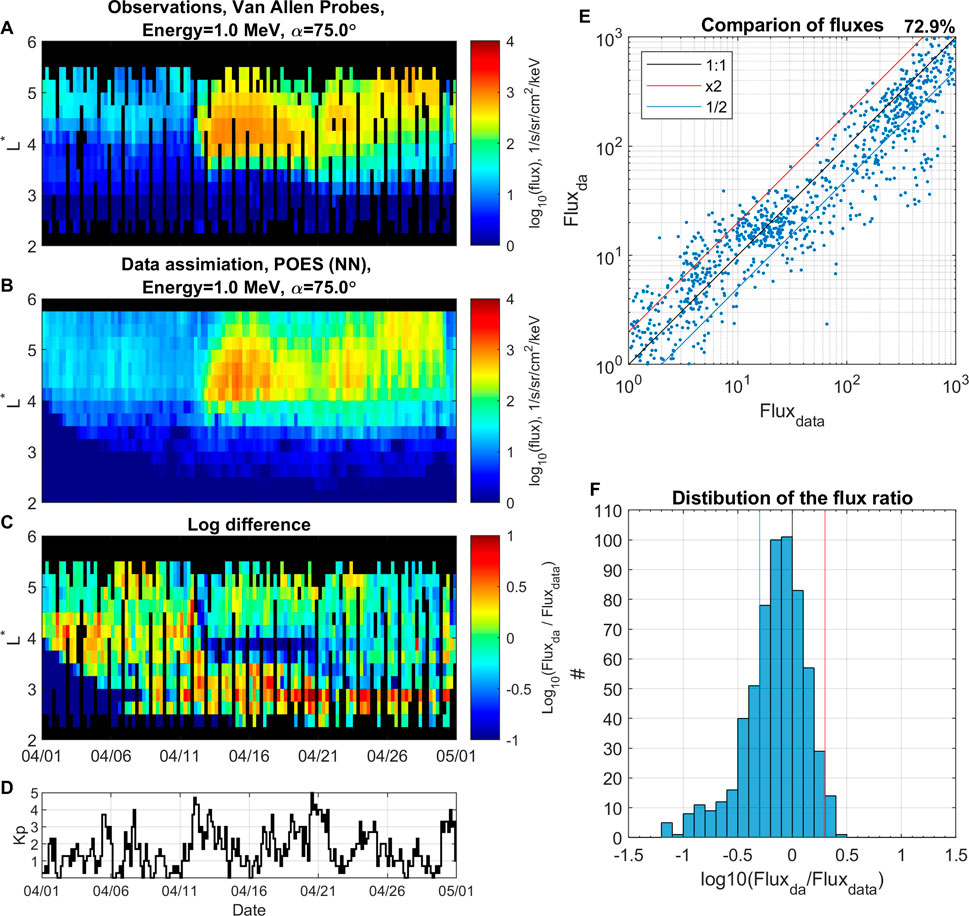
FIGURE 5. Data assimilation using reconstructed with neural network data. Electron flux at 1 MeV and αeq =75° for period from 01 April 2014 until 01 May 2014. (A) Binned Van Allen Probe observations. (B) Data assimilation using reconstructed flux from POES data. (C) Logarithmic difference between flux from data assimilation and observations. (D) Kp index, (E) comparison of fluxes between observations Fluxdata and DA results Fluxda, (F) distribution of the logarithmic flux ratio.
Furthermore, Table 2 shows that DA improves accuracy (as measured by r2) of reconstructed fluxes in the heart of radiation belts (L* ∈ [3.5, 6.0], where election dynamics is the most significant) in comparison with standalone machine learning model results. Such improvement by DA is more pronounced when using MLR-based fluxes, and accuracy is only marginally better when using NN-based fluxes. We chose the narrower L* region because physics-based VERB code simulation provides a very low PSD level in the slot region in comparison to the observations for the selected period as seen on Figure 3, which are defined by the instrumental noise level. The similar comparison at lower L* < 3.5 (below heart of radiation belts Reeves et al. (2013)) results in fitting to observations when DA is applied to NN-based fluxes (not shown).
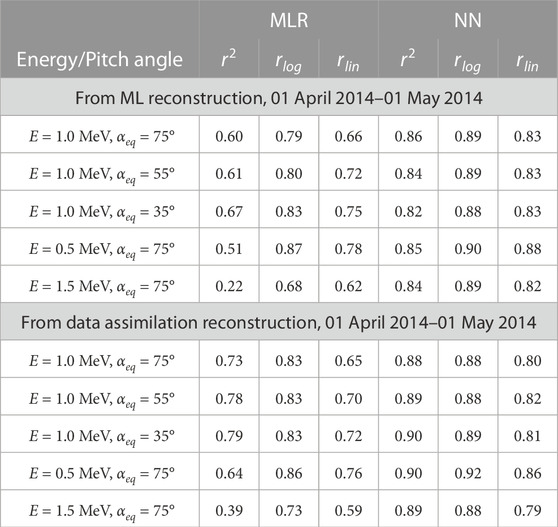
TABLE 2. Coefficients of determination (r2) and correlation coefficients calculated in logarithmic (rlog) and linear (rlin) space between Van Allen Probes, RBSP-A and reconstituted from POES NOAA-15 data using MLR and NN models (first 5 rows, similar to Table 1); and the same comparison with data assimilation with POES NOAA-15 using MLR and NN models (last 5 rows). The calculation of coefficients is limited to L*∈ [3.5,6.0], which represents the heart of the radiation belts.
One of the main advantages of using DA is that it provides a full and complete reconstruction of radiation belts. This enables a virtual flyby of arbitrary satellites retrieving the accurate representation of electron flux/PSD along the trajectory, similar to the Observing System Simulation Experiments (OSSEs) study recently supported by NOAA (Schiller et al., 2022) in so called “fraternal twin” assimilation experiments (Kondrashov et al., 2007; Shprits et al., 2007; Kondrashov et al., 2011), where synthetic data from virtual satellites along different orbits (LEO, GTO, MEO) of VERB simulation with one set of physical parameters is assimilated into VERB with different physical parameter settings with a goal to best reconstruct at GEO. We achieve such reconstruction using physics-based extrapolation of LEO observations with VERB code and machine learning. To demonstrate such capability, Figures 6, 7 show DA results in comparison to GOES observations at 1 MeV and αeq = 55° in the validation period from 01 April 2014 until 01 May 2014 and using the same format as in Figures 4, 5. As one can see, the accuracy of DA reconstruction using NN-based fluxes is significantly better than using the MLR method, such as 70.9% of points being within a factor of 2 for the former vs. 55.1% for the latter. In addition, we perform a comparison of the GOES fluxes reconstructed from LEO using ML methods and DA. The wide L-shell coverage provided by POES allow us to reconstruct the flux level in the region of GEO. However, none of our ML models (MLR and NN) were trained on the data outside of Van Allen Probes spatial coverage in L*, which is below GEO. Hence, the physics-based extrapolation imposed by DA may become more important for such a task. Table 3 provides details of the comparison of DA and our ML models at extrapolation to GEO at different energies and pitch angles, in a format similar to Table 2. The agreement of the observed and reconstructed fluxes at GEO using DA is better than for our ML models, although the accuracy of the DA-NN model is lower than in Table 2. This is expected result because our ML models did not include training on GEO data. Also, there already exist much better predictive ML models that includes GEO electron data for training (e.g., Boynton et al., 2013; Shin et al., 2016; Zhang et al., 2020; Wang et al., 2023). However, such models usually rely on the knowledge of the solar wind data, while demonstrated in this paper DA technique only use Kp-index as a indicator of geomagnetic activity, with is available at near real-time (e.g., Matzka et al., 2021). Also, the demonstrated method of reconstruction of the fluxes at GEO using LEO measurements is of an interest of the community (e.g., Drozdov et al., 2022).
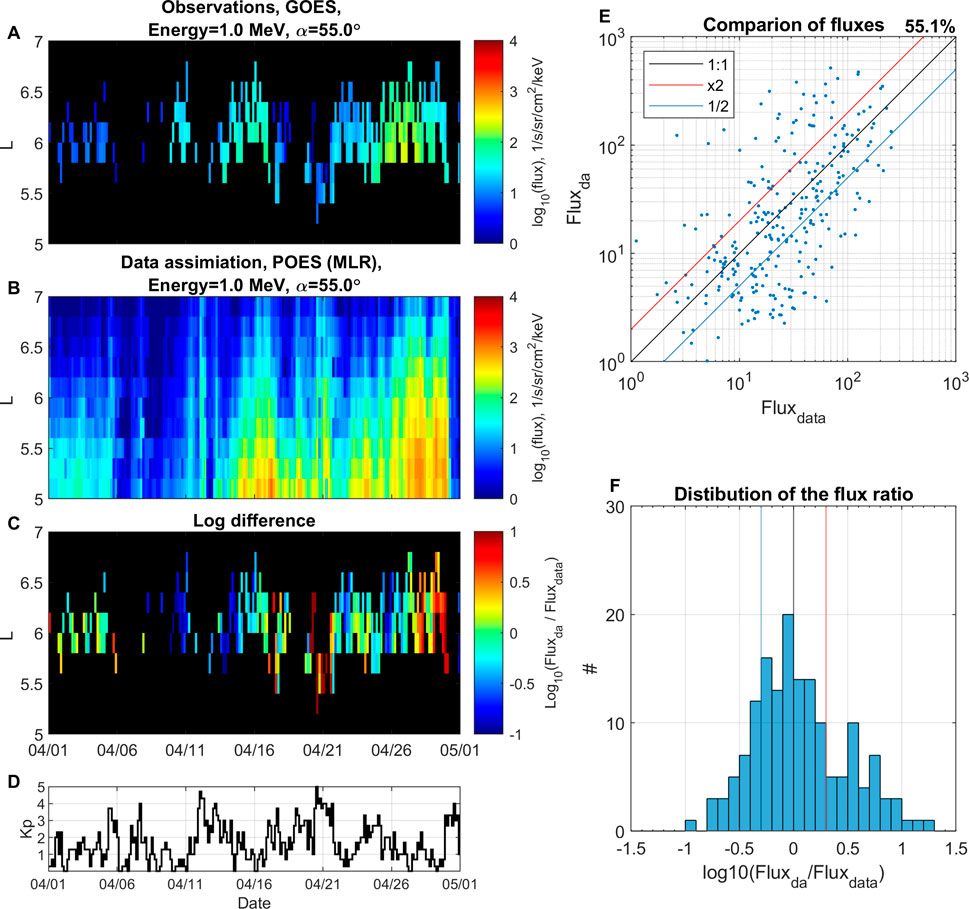
FIGURE 6. Data assimilation using reconstructed with multivariate linear regression analysis data. Electron flux at 1 MeV and αeq =55° for the period from 01 April 2014 until 01 May 2014. (A) Binned GOES observations. (B) Data assimilation using reconstructed flux from POES data. (C) Logarithmic difference between flux from data assimilation and observations. (D) Kp index. (E) Comparison of fluxes between observations Fluxdata and DA results Fluxda, (F) distribution of the logarithmic flux ratio.
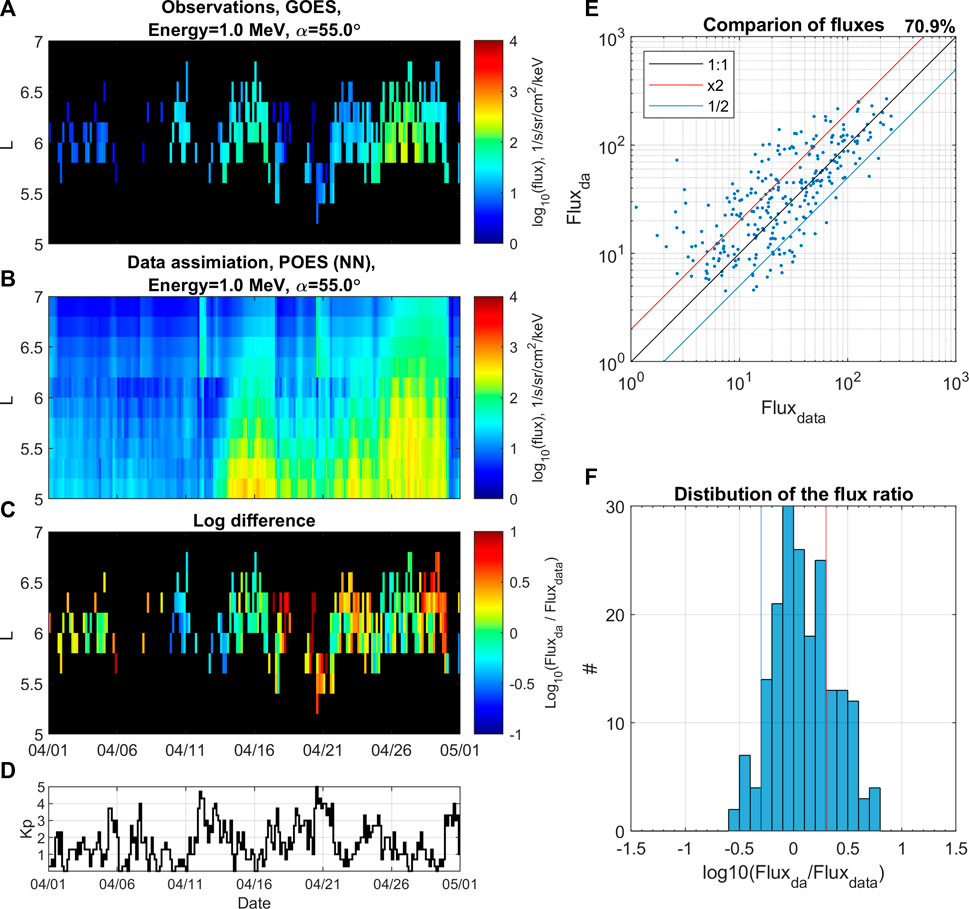
FIGURE 7. Data assimilation using reconstructed with neural network data. Electron flux at 1 MeV and αeq =55° for period from 01 April 2014 until 01 May 2014. (A) Binned GOES observations. (B) Data assimilation using reconstructed flux from POES data. (C) Logarithmic difference between flux from data assimilation and observations. (D) Kp index, (E) comparison of fluxes between observations Fluxdata and DA results Fluxda, (F) distribution of the logarithmic flux ratio.
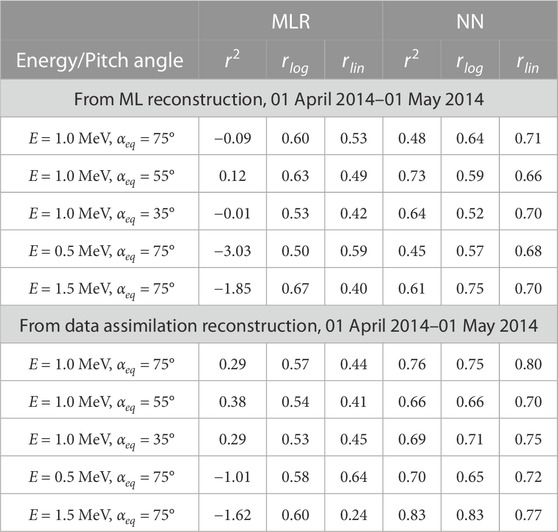
TABLE 3. Coefficients of determination (r2) and correlation coefficients calculated in logarithmic (rlog) and linear (rlin) space between GOES-13, GOES-15 and reconstituted from POES NOAA-15 data using MLR and NN models (first 5 rows); and the same comparison with data assimilation with POES NOAA-15 using MLR and NN models (last 5 rows). The calculation of coefficients is limited to L*∈ [5.0,7.0], the GOES coverage.
In this work, we demonstrated that electron radiation belt flux observed by the MEO satellite can be successfully reconstructed using LEO POES measurements with various machine learning methods. We used 2 ML methods: multivariate linear regression analysis (MLR) and neural network (NN). The reconstructed flux was included in data assimilation (DA) with VERB code and compared with Van Allen Probes and GOES observations. The MLR method represents a reference model which is easy to implement in space weather applications that require reconstruction of the radiation belt dynamics. We found that data assimilation using MLR-reconstructed flux can provide a reasonable agreement with observations. However, the data assimilation with the flux reconstructed using a NN provided only a limited improvement. Therefore, our main conclusion is that, in the case an optimized machine learning model is not possible, our preliminary results suggest that data assimilation can be beneficial for reconstructing outer belt electrons by correcting errors of a subpar machine learning based LEO-to-MEO mapping (e.g., the MLR case), as well as by providing physics-based extrapolation to the parameter space portion that is inadequately covered by existing measurements (e.g., GEO is used as the pretended case here). Meanwhile, when a well-trained ML model is feasible (e.g., the NN case), the application of DA shows only limited improvement.
Although both methods (MLR and NN) in combination with DA showed applicability in the reconstruction of radiation belts, this study includes several assumptions and limitations. The selected implementation of the MLR reconstructed flux has limitations, as we used a simplified sin-function extrapolation of electron flux. The use of the more realistic reconstruction of the pitch-angle distribution (e.g., Allison et al., 2018; Zhao et al., 2018; Smirnov et al., 2022), as well as MLT dependence, may be used in future studies to improve the results. Additionally, we used the convenient for this study POES data set presented by Peck et al. (2015), which has limited temporal coverage (1998–2014) and thus short overlap with Van-Allen Probes to allow for robust comparison of DA-MLR and DA-NN results between quiet and disturbed geomagnetic activity, including extreme geomagnetic storms. The future work will consider the near real-time POES measurements, a comprehensive analysis of PSD (e.g., Wing et al., 2022), as well as, the detailed analysis of a wider range of energies and pitch angles remains a subject of future research. In addition, future work will include the combination of different measurements with various errors into a data assimilative model.
The main advantage of data assimilation is that it can help with the reduction of the errors that can arise from the inaccuracies of measurements, inaccuracies associated with the mixing of trapped and quasi-trapped populations, and inaccuracies associated with extrapolation to the equator. In the case an optimized machine learning model is not possible, our results suggest that data assimilation can be beneficial for reconstructing outer belt electrons by correcting errors of a machine learning based LEO-to-MEO mapping and by providing physics-based extrapolation to the parameter space portion not included in the LEO-to-MEO mapping, such as at GEO orbit. Machine learning models can be also inaccurate especially when applied outside of the training interval and during extreme geomagnetic conditions. In these situations, we may consider rebalancing using a similar approach as by Shprits et al. (2019) or using different machine learning models (e.g., MLR and NN) depending on the geomagnetic activity, when DA can compensate for the possible machine learning errors during extreme geomagnetic storms (see Zhelavskaya et al., 2021).
The ML and DA-based reconstruction of the radiation belts with the presented methodology enables continuous monitoring of the radiation belt state even without in situ near-equatorial radiation belt measurements. This is particularly crucial for space weather applications and space weather prediction. Such an approach can also be used to study the global long-term dynamics of radiation belts. Furthermore, analysis of the pitch-angle distributions of the reconstructed from LEO measurements radiation belts can inform about the dominant physical mechanism that drives radiation belts dynamics and will be addressed in future research.
We thank the Van Allen Probe ECT team for providing the data: https://rbsp-ect.newmexicoconsortium.org/. The POES measurements are available at the NOAA NGDC website: https://satdat.ngdc.noaa.gov/sem/poes/data/processed/ngdc/corrected/peck/. The GOES measurements are available at the NOAA-NGDC website: https://www.ngdc.noaa.gov/stp/. The authors used geomagnetic indices provided by OMNIWeb: https://omniweb.gsfc.nasa.gov/.
AD led the work, performed the analyses, and assisted in writing the paper. DK developed the NN model, advised AD on the DA details and interpretation of the results, and wrote the paper. KS assisted in DA analysis. YS conceptualized the study. All authors contributed to the article and approved the submitted version.
This research is funded by contract FA9453-19-C-0619 submitted to ARFL STTR topic AF17C-T03. DK is supported by NSF grant AGS-2211345.
The authors acknowledge the developers of the International Radiation Belt Environment Modeling (IRBEM) library. We thank Drew Turner, Quintin Schiller and Geoff Reeves for their useful discussions and Sharon Uy for proofreading this manuscript.
AD, KS and YS have a significant financial interest in Space Sciences Innovations Inc.
The remaining author declares that the research was conducted in the absence of any commercial or financial relationships that could be construed as a potential conflict of interest.
All claims expressed in this article are solely those of the authors and do not necessarily represent those of their affiliated organizations, or those of the publisher, the editors and the reviewers. Any product that may be evaluated in this article, or claim that may be made by its manufacturer, is not guaranteed or endorsed by the publisher.
The views expressed are those of the author and do not necessarily reflect the official policy or position of the Department of the Air Force, the Department of Defense, or the U.S. government. The appearance of external hyperlinks does not constitute endorsement by the United States Department of Defense (DoD) of the linked websites, or the information, products, or services contained therein. The DoD does not exercise any editorial, security, or other control over the information you may find at these locations.
Allison, H. J., Horne, R. B., Glauert, S. A., and Del Zanna, G. (2018). Determination of the equatorial electron differential flux from observations at low Earth orbit. J. Geophys. Res. Space Phys. 123, 9574–9596. doi:10.1029/2018ja025786
Batusov, R., Dolenko, S., and Myagkova, I. (2018). Neural network prediction of daily relativistic electrons fluence in the outer radiation belt of the earth: Selection of delay embedding method ⁎ ⁎this study has been conducted at the expense of Russian science foundation, grant no. 16-17-00098. Procedia Comput. Sci. 123, 86–91. doi:10.1016/j.procs.2018.01.014
Boyd, A. J., Spence, H. E., Reeves, G. D., Funsten, H. O., Skoug, R. M., Larsen, B. A., et al. (2021). RBSP-ECT combined pitch angle resolved electron flux data product. J. Geophys. Res. Space Phys. 126. doi:10.1029/2020ja028637
Boynton, R. J., Balikhin, M. A., Billings, S. A., Reeves, G. D., Ganushkina, N., Gedalin, M., et al. (2013). The analysis of electron fluxes at geosynchronous orbit employing a narmax approach. J. Geophys. Res. Space Phys. 118, 1500–1513. doi:10.1002/jgra.50192
Brautigam, D. H., and Albert, J. M. (2000). Radial diffusion analysis of outer radiation belt electrons during the october 9, 1990, magnetic storm. J. Geophys. Res. 105, 291–309. doi:10.1029/1999ja900344
Camporeale, E. (2019). The challenge of machine learning in space weather: Nowcasting and forecasting. Space Weather 17, 1166–1207. doi:10.1029/2018SW002061
Cervantes, S., Shprits, Y. Y., Aseev, N. A., and Allison, H. J. (2020a). Quantifying the effects of emic wave scattering and magnetopause shadowing in the outer electron radiation belt by means of data assimilation. J. Geophys. Res. Space Phys. 125, e2020JA028208. doi:10.1029/2020ja028208
Cervantes, S., Shprits, Y. Y., Aseev, N. A., Drozdov, A. Y., Castillo, A., and Stolle, C. (2020b). Identifying radiation belt electron source and loss processes by assimilating spacecraft data in a three-dimensional diffusion model. J. Geophys. Res. Space Phys. 125. doi:10.1029/2019ja027514
Chen, Y., Reeves, G. D., Cunningham, G. S., Redmon, R. J., and Henderson, M. G. (2016). Forecasting and remote sensing outer belt relativistic electrons from low Earth orbit. Geophys. Res. Lett. 43, 1031–1038. doi:10.1002/2015GL067481
Chen, Y., Reeves, G. D., Fu, X., and Henderson, M. (2019). Premeve: New predictive model for megaelectron-volt electrons inside Earth’s outer radiation belt. Space Weather 17, 438–454. doi:10.1029/2018SW002095
Chu, X., Ma, D., Bortnik, J., Tobiska, W. K., Cruz, A., Bouwer, S. D., et al. (2021). Relativistic electron model in the outer radiation belt using a neural network approach. Space Weather 19, e2021SW002808. doi:10.1029/2021SW002808
Claudepierre, S. G., and O’Brien, T. P. (2020). Specifying high-altitude electrons using low-altitude leo systems: The shells model. Space Weather 18, e2019SW002402. doi:10.1029/2019sw002402
Daae, M., Shprits, Y. Y., Ni, B., Koller, J., Kondrashov, D., and Chen, Y. (2011). Reanalysis of radiation belt electron phase space density using various boundary conditions and loss models. Adv. Space Res. 48, 1327–1334. doi:10.1016/j.asr.2011.07.001
Drozdov, A., Schiller, Q., Shprits, Y., Kondrashov, D., and Strunin, K. (2022). “An OSSE using the VERB code for outer electron radiation belt,” in Presented at 2022 mini-GEM, 11 Dec.
Drozdov, A. Y., Allison, H. J., Shprits, Y. Y., Elkington, S. R., and Aseev, N. A. (2021). A comparison of radial diffusion coefficients in 1-d and 3-d long-term radiation belt simulations. J. Geophys. Res. Space Phys. 126. doi:10.1029/2020ja028707
Drozdov, A. Y., Shprits, Y. Y., Orlova, K. G., Kellerman, A. C., Subbotin, D. A., Baker, D. N., et al. (2015). Energetic, relativistic, and ultrarelativistic electrons: Comparison of long-term verb code simulations with van allen probes measurements. J. Geophys. Res. Space Phys. 120, 3574–3587. doi:10.1002/2014JA020637
Drozdov, A. Y., Shprits, Y. Y., Usanova, M. E., Aseev, N. A., Kellerman, A. C., and Zhu, H. (2017). Emic wave parameterization in the long-term verb code simulation. J. Geophys. Res. Space Phys. 122, 8488–8501. doi:10.1002/2017JA024389
Drozdov, A. Y., Usanova, M. E., Hudson, M. K., Allison, H. J., and Shprits, Y. Y. (2020). The role of hiss, chorus, and emic waves in the modeling of the dynamics of the Multi-MeV radiation belt electrons. J. Geophys. Res. Space Phys. 125, 2628. doi:10.1029/2020JA028282
Evans, D. S., and Greer, M. S. (2004). “Polar orbiting environmental satellite space environment monitor - 2 instrument descriptions and archive data documentation,” in NOAA technical memorandum OAR SEC (Boulder, Colorado), 93.
Fukata, M., Taguchi, S., Okuzawa, T., and Obara, T. (2002). Neural network prediction of relativistic electrons at geosynchronous orbit during the storm recovery phase: Effects of recurring substorms. Ann. Geophys. 20, 947–951. doi:10.5194/angeo-20-947-2002
Ghil, M., and Malanotte-Rizzoli, P. (1991). “Data assimilation in meteorology and oceanography,” in Advances in geophysics (New York: Academic Press), 33, 141–266.
Kalman, R. E. (1960). A new approach to linear filtering and prediction problems. Trans. ASME–Journal Basic Eng. 82, 35–45. doi:10.1115/1.3662552
Kalnay, E. (2003). Atmospheric modeling, data assimilation and predictability. Cambridge University Press.
Kanekal, S. G., Baker, D. N., and Blake, J. B. (2001). Multisatellite measurements of relativistic electrons: Global coherence. J. Geophys. Res. Space Phys. 106, 29721–29732. doi:10.1029/2001JA000070
Kellerman, A. C., Shprits, Y. Y., Kondrashov, D., Subbotin, D., Makarevich, E., Donovan, R. A., et al. (2014). Three-dimensional data assimilation and reanalysis of radiation belt electrons: Observations of a four-zone structure using five spacecraft and the VERB code. J. Geophys. Res. Space Phys. 119, 8764–8783. under review. doi:10.1002/2014ja020171
Kitamura, K., Nakamura, Y., Tokumitsu, M., Ishida, Y., and Watari, S. (2011). Prediction of the electron flux environment in geosynchronous orbit using a neural network technique. Artif. Life Robot. 16, 389–392. doi:10.1007/s10015-011-0957-1
Koller, J., Chen, Y., Reeves, G. D., Friedel, R. H. W., Cayton, T. E., and Vrugt, J. A. (2007). Identifying the radiation belt source region by data assimilation. J. Geophys. Res. Space Phys. 112. doi:10.1029/2006JA012196
Kondrashov, D., Ghil, M., and Shprits, Y. (2011). Lognormal kalman filter for assimilating phase space density data in the radiation belts. Space Weather 9. doi:10.1029/2011sw000726
Kondrashov, D., Shprits, Y., Ghil, M., and Thorne, R. (2007). A Kalman filter technique to estimate relativistic electron lifetimes in the outer radiation belt. J. Geophys. Res. 112, A10227. doi:10.1029/2007JA012583
Koons, H. C., and Gorney, D. J. (1991). A neural network model of the relativistic electron flux at geosynchronous orbit. J. Geophys. Res. 96, 5549. doi:10.1029/90ja02380
Landis, D. A., Saikin, A. A., Zhelavskaya, I., Drozdov, A. Y., Aseev, N., Shprits, Y. Y., et al. (2022). Title: Narx neural network derivations of the outer boundary radiation belt electron flux. Space Weather 20. doi:10.1029/2021sw002774
Ling, A. G., Ginet, G. P., Hilmer, R. V., and Perry, K. L. (2010). A neural network–based geosynchronous relativistic electron flux forecasting model. Space Weather 8. doi:10.1029/2010SW000576
Lyons, L. R., and Thorne, R. M. (1973). Equilibrium structure of radiation belt electrons. J. Geophys. Res. 78, 2142–2149. doi:10.1029/ja078i013p02142
Ma, D., Chu, X., Bortnik, J., Claudepierre, S. G., Tobiska, W. K., Cruz, A., et al. (2022). Modeling the dynamic variability of sub-relativistic outer radiation belt electron fluxes using machine learning. Space Weather 20, e2022SW003079. doi:10.1029/2022sw003079
Matzka, J., Stolle, C., Yamazaki, Y., Bronkalla, O., and Morschhauser, A. (2021). The geomagnetic kp index and derived indices of geomagnetic activity. Space Weather 19. doi:10.1029/2020sw002641
Mauk, B. H., Fox, N. J., Kanekal, S. G., Kessel, R. L., Sibeck, D. G., and Ukhorskiy, A. (2013). Science objectives and rationale for the radiation belt storm probes mission. Space Sci. Rev. 179, 3–27. doi:10.1007/s11214-012-9908-y
Merkin, V. G., Kondrashov, D., Ghil, M., and Anderson, B. J. (2016). Data assimilation of low-altitude magnetic perturbations into a global magnetosphere model. Space Weather 14, 165–184. doi:10.1002/2015sw001330
Peck, E. D., Randall, C. E., Green, J. C., Rodriguez, J. V., and Rodger, C. J. (2015). POES MEPED differential flux retrievals and electron channel contamination correction: POES MEPED correction. J. Geophys. Res. Space Phys. 120, 4596–4612. doi:10.1002/2014ja020817
Perry, K. L., Ginet, G. P., Ling, A. G., and Hilmer, R. V. (2010). Comparing geosynchronous relativistic electron prediction models. Space Weather 8. doi:10.1029/2010sw000581
Pires de Lima, R., Chen, Y., and Lin, Y. (2020). Forecasting megaelectron-volt electrons inside earth’s outer radiation belt: PreMevE 2.0 based on supervised machine learning algorithms. Space Weather 18, e2019SW002399. doi:10.1029/2019SW002399
Reeves, G. D., Spence, H. E., Henderson, M. G., Morley, S. K., Friedel, R. H. W., Funsten, H. O., et al. (2013). Electron acceleration in the heart of the van allen radiation belts. Science 341, 991–994. doi:10.1126/science.1237743
Rodriguez, J. V., Krosschell, J. C., and Green, J. C. (2014). Intercalibration of goes 8-15 solar proton detectors. Space Weather 12, 92–109. doi:10.1002/2013sw000996
Roederer, J. G. (1970). Dynamics of geomagnetically trapped radiation. Springer Berlin Heidelberg. doi:10.1007/978-3-642-49300-3
Saikin, A. A., Shprits, Y. Y., Drozdov, A. Y., Landis, D. A., Zhelavskaya, I. S., and Cervantes, S. (2021). Reconstruction of the radiation belts for solar cycles 17–24 (1933–2017). Space Weather 19, e2020SW002524. doi:10.1029/2020SW002524
Sarma, R., Chandorkar, M., Zhelavskaya, I., Shprits, Y., Drozdov, A., and Camporeale, E. (2020). Bayesian inference of Quasi-Linear radial diffusion parameters using van allen probes. J. Geophys. Res. Space Phys. 125, A04222. doi:10.1029/2019JA027618
Schiller, Q., Shprits, Y., Drozdov, A., Kondrashov, D., and Strunin, K. (2022). “An OSSE using the VERB code for outer electron radiation belt situational awareness,” in Presented at 2022 Fall Meeting, 12-16 Dec (AGU).
Shin, D.-K., Lee, D.-Y., Kim, K.-C., Hwang, J., and Kim, J. (2016). Artificial neural network prediction model for geosynchronous electron fluxes: Dependence on satellite position and particle energy. Space Weather 14, 313–321. doi:10.1002/2015sw001359
Shprits, Y. Y., Castillo, A. M., Aseev, N., Cervantes, S., Michaelis, I., Zhelavskaya, I., et al. (2023). “Data assimilation in the near-earth electron radiation environment,” in Applications of data assimilation and inverse problems in the earth sciences. Editor A. Ismail-Zadeh (Cambridge University Press - IUGG Special Publication Series). (In Press).
Shprits, Y. Y., Elkington, S. R., Meredith, N. P., and Subbotin, D. A. (2008a). Review of modeling of losses and sources of relativistic electrons in the outer radiation belt I: Radial transport. J. Atmos. Sol. Terr. Phys. 70 (14), 1679–1693. doi:10.1016/j.jastp.2008.06.008
Shprits, Y., Kellerman, A., Kondrashov, D., and Subbotin, D. (2013). Application of a new data operator-splitting data assimilation technique to the 3-D VERB diffusion code and CRRES measurements. Geophys. Res. Lett. 40, 4998–5002. doi:10.1002/grl.50969
Shprits, Y., Kondrashov, D., Chen, Y., Thorne, R., Ghil, M., Friedel, R., et al. (2007). Reanalysis of relativistic radiation belt electron fluxes using CRRES satellite data, a radial diffusion model, and a Kalman filter. J. Geophys. Res. 112, A12216. doi:10.1029/2007JA012579
Shprits, Y. Y., Subbotin, D. A., Meredith, N. P., and Elkington, S. R. (2008b). Review of modeling of losses and sources of relativistic electrons in the outer radiation belt II: Local acceleration and loss. J. Atmos. Sol. Terr. Phys. 70 (14), 1694–1713. doi:10.1016/j.jastp.2008.06.014
Shprits, Y. Y., Vasile, R., and Zhelavskaya, I. S. (2019). Nowcasting and predicting the k p index using historical values and real-time observations. Space Weather 17, 1219–1229. doi:10.1029/2018sw002141
Shultz, M., and Lanzerotti, L. (1974). Particle diffusion in the radiation belt. New York: Springer.
Sinha, S., Chen, Y., Lin, Y., and Pires de Lima, R. (2021). Premeve update: Forecasting ultra-relativistic electrons inside Earth’s outer radiation belt. Space Weather 19. doi:10.1029/2021SW002773
Smirnov, A., Shprits, Y., Allison, H., Aseev, N., Drozdov, A., Kollmann, P., et al. (2022). Storm-time evolution of the equatorial electron pitch angle distributions in Earth’s outer radiation belt. Front. Astron. Space Sci. 9. doi:10.3389/fspas.2022.836811
Spence, H. E., Reeves, G. D., Baker, D. N., Blake, J. B., Bolton, M., Bourdarie, S., et al. (2013). Science goals and overview of the radiation belt storm probes (RBSP) energetic particle, composition, and thermal plasma (ECT) suite on NASA’s van allen probes mission. Space Sci. Rev. 179, 311–336. doi:10.1007/s11214-013-0007-5
Subbotin, D. A., and Shprits, Y. Y. (2009). Three-dimensional modeling of the radiation belts using the versatile electron radiation belt (VERB) code. Space Weather 7, S10001. doi:10.1029/2008SW000452
Thorne, R. M. (2010). Radiation belt dynamics: The importance of wave-particle interactions. Geophys. Res. Lett. 37. doi:10.1029/2010GL044990
Tsyganenko, N. A. (1989). A magnetospheric magnetic field model with a warped tail current sheet. Planet. Space Sci. 37, 5–20. doi:10.1016/0032-0633(89)90066-4
Wang, D., Shprits, Y. Y., Zhelavskaya, I. S., Effenberger, F., Castillo, A., Drozdov, A. Y., et al. (2020). The effect of plasma boundaries on the dynamic evolution of relativistic radiation belt electrons. J. Geophys. Res. Space Phys. 125. doi:10.1029/2019JA027422
Wang, J., Guo, D., Xiang, Z., Ni, B., Liu, Y., and Dong, J. (2023). Prediction of geosynchronous electron fluxes using an artificial neural network driven by solar wind parameters. Adv. Space Res. 71, 275–285. doi:10.1016/j.asr.2022.10.013
Wing, S., Turner, D. L., Ukhorskiy, A. Y., Johnson, J. R., Sotirelis, T., Nikoukar, R., et al. (2022). Modeling radiation belt electrons with information theory informed neural networks. Space Weather 20, e2022SW003090. doi:10.1029/2022SW003090
Zhang, H., Fu, S., Xie, L., Zhao, D., Yue, C., Pu, Z., et al. (2020). Relativistic electron flux prediction at geosynchronous orbit based on the neural network and the quantile regression method. Space Weather 18. doi:10.1029/2020sw002445
Zhao, H., Friedel, R. H. W., Chen, Y., Reeves, G. D., Baker, D. N., Li, X., et al. (2018). An empirical model of radiation belt electron pitch angle distributions based on van allen probes measurements. J. Geophys. Res. Space Phys. 123, 3493–3511. doi:10.1029/2018JA025277
Zhelavskaya, I. S., Aseev, N. A., and Shprits, Y. Y. (2021). A combined neural network- and physics-based approach for modeling plasmasphere dynamics. J. Geophys. Res. Space Phys. 126. doi:10.1029/2020ja028077
Zhelavskaya, I. S., Shprits, Y. Y., and Spasojevic, M. (2018). “Chapter 12 - Reconstruction of plasma electron density from satellite measurements via artificial neural networks,” in Machine learning techniques for space weather. Editors E. Camporeale, S. Wing, and J. R. Johnson (Elsevier), 301–327. doi:10.1016/B978-0-12-811788-0.00012-3
Zhelavskaya, I. S., Shprits, Y. Y., and Spasojević, M. (2017). Empirical modeling of the plasmasphere dynamics using neural networks: Global dynamic plasmasphere model. J. Geophys. Res. Space Phys. 122 (11), 11,227–11,244. doi:10.1002/2017JA024406
Zhelavskaya, I. S., Spasojevic, M., Shprits, Y. Y., and Kurth, W. S. (2016). Automated determination of electron density from electric field measurements on the Van Allen Probes spacecraft. J. Geophys. Res. Space Phys. 121 (5), 2015JA022132. doi:10.1002/2015JA022132
Zhu, H., Shprits, Y. Y., Spasojevic, M., and Drozdov, A. Y. (2019). New hiss and chorus waves diffusion coefficient parameterizations from the van allen probes and their effect on long-term relativistic electron radiation-belt VERB simulations. J. Atmos. Sol. Terr. Phys. 193, 105090. doi:10.1016/j.jastp.2019.105090
Keywords: radiation belts, neural network, multiple linear regression, VERB code, data assimilation, machine learning
Citation: Drozdov AY, Kondrashov D, Strounine K and Shprits YY (2023) Reconstruction of electron radiation belts using data assimilation and machine learning. Front. Astron. Space Sci. 10:1072795. doi: 10.3389/fspas.2023.1072795
Received: 17 October 2022; Accepted: 03 May 2023;
Published: 19 May 2023.
Edited by:
Qianli Ma, Boston University, United StatesReviewed by:
Binbin Ni, Wuhan University, ChinaCopyright © 2023 Drozdov, Kondrashov, Strounine and Shprits. This is an open-access article distributed under the terms of the Creative Commons Attribution License (CC BY). The use, distribution or reproduction in other forums is permitted, provided the original author(s) and the copyright owner(s) are credited and that the original publication in this journal is cited, in accordance with accepted academic practice. No use, distribution or reproduction is permitted which does not comply with these terms.
*Correspondence: Dmitri Kondrashov, ZGtvbmRyYXNAYXRtb3MudWNsYS5lZHU=
Disclaimer: All claims expressed in this article are solely those of the authors and do not necessarily represent those of their affiliated organizations, or those of the publisher, the editors and the reviewers. Any product that may be evaluated in this article or claim that may be made by its manufacturer is not guaranteed or endorsed by the publisher.
Research integrity at Frontiers
Learn more about the work of our research integrity team to safeguard the quality of each article we publish.