 Carl Björn Kjellstrand
 Bifford P. Williams
94% of researchers rate our articles as excellent or good
Learn more about the work of our research integrity team to safeguard the quality of each article we publish.
Find out more
TECHNOLOGY AND CODE article
Front. Astron. Space Sci., 14 April 2023
Sec. Space Physics
Volume 10 - 2023 | https://doi.org/10.3389/fspas.2023.1023550
This article is part of the Research TopicSnakes on a Spaceship—An Overview of Python in Space PhysicsView all 31 articles
SkyWinder is an open-source Python package useful for instrument control, telemetry, and image analysis. It is adapted from software that successfully managed flight control, telemetry, preliminary image analysis, and data visualization for a balloon-borne mission and it has broad uses for mid- and upper-atmosphere science instrumentation including aurora, cloud, and airglow imagers. SkyWinder will save future aeronomy experiments significant time and money, and lowers the barrier to entry in analyzing data hosted in public available repositories. Our software consists of two distinct parts: the flight and analysis modules. The SkyWinder flight package includes modular distributed flight control including telemetry and subsystem coordination for running mobile aeronomy experiments such as balloon-borne payloads, airplanes, sounding rockets, and suborbital reusable launch vehicles (sRLVs), as well as isolated semi-autonomous ground instruments. The SkyWinder analysis software provides functionality more broadly useful in neutral upper atmosphere dynamics, such as pointing reconstruction, image projection, preliminary image processing, and various image analysis techniques.
NASA Heliophysics research extends from the upper atmosphere to the sun. The Python in Heliophysics Community (PyHC) codebase is currently better developed for the solar, plasma, and magnetospheric physics than for the upper neutral atmosphere. To fill this need, we developed a Python Value Added Enhancement in coordination with the PyHC project. We named it “SkyWinder” to reference the aeronomy uses and reference the “sidewinder” snake species that have an unusual method of locomotion since snake motifs are commonly used in Python packages. The sidewinder snake’s body motion is wavelike and has the phase and group velocity mostly perpendicular like GWs. Also, many types of GWs “wind” up into the sky. We refined and published existing heliophysics mission and analysis code from the successful Polar Mesospheric Cloud Turbulence (PMC-Turbo) experiment. This package is comprised of two distinct parts: the SkyWinder flight and SkyWinder analysis submodules.
The SkyWinder flight software provides modular flight control functionality useful for a variety of balloon-borne and other suborbital experiments, including telemetry and subsystem coordination. This includes functionality for running mobile aeronomy experiments such as balloon-borne payloads, airplanes, sounding rockets, and suborbital reusable launch vehicles (sRLVs). These features will also be useful for remote off-the-grid ground stations. We designed the software specifically to work with balloon platforms and telemetry channels provided by the Columbia Science Balloon Facility (CSBF), which is a NASA facility that launches and manages large unmanned balloons. However, much of the functionality is broadly useful to semi-autonomous experiments. The SkyWinder software is a refinement of the flight and analysis software for the PMC-Turbo experiment. The software ran during a successful science flight July 2018 and a successful secondary (“piggyback”) payload December-January 2019-2020 described in Kjellstrand et al. (2020) and Kjellstrand (2021).
The SkyWinder flight package provides redundant and distributed functionality for flight control, instrument control and coordination, and telemetry. SkyWinder allows for a framework for a distributed communication system in which several networked computers can each assume flight control duties in the event of any individual hardware failure. It communicates to and from the ground control station in a channel-agnostic manner that has been used with Tracking and Data Relay Satellite System (TDRSS) and Iridium satellite constellations. The package runs at a low level to provide commands to the hardware and exposes the handles of that interface on the experiment network. It selects, compresses, and packages data for downlink in such a way that the ground station can locate lost data packets, identify corrupted data, and estimate downlink times. It provides a convenient graphical user interface (GUI) for the ground station to monitor a remote experiment status, look at downlinked data, and send and track commands to the remote experiment.
The SkyWinder analysis software provides functionality more broadly useful in neutral upper atmosphere dynamics, such as pointing reconstruction, image projection, preliminary image processing, and various image analysis techniques. The SkyWinder analysis package includes procedures for flat-fielding and removing time-varying stray light from images, star identification and pointing reconstruction from the stars, projection from rectilinear projection to accurate on-the-sky geometry. Data visualization tools such as stitching image arrays together and movie-making (both projected and unaltered) are included. The SkyWinder analysis code will also include data visualization tools to combine imaging and lidar data. This has proven to be critical in analysis for PMC-Turbo and we anticipate many mobile aeronomy platforms will have multiple instruments. For example, the National Science Foundation (NSF) DeepWave mission described in Fritts et al. (2016) included a sodium lidar, Rayleigh lidar, advanced mesospheric temperature mapper (AMTM), two OH imagers, dropsondes, and many other supporting instruments. This was analyzed largely using commercial languages such as Interactive Data Language (IDL) and Matlab, making sharing code with outside data users more difficult.
PMC-Turbo imaged dynamics located about 80 km above the Earth surface, while itself lofted aboard a balloon-borne payload at nearly 40 km altitude. It included 8 science instruments on board: seven optical cameras and a Rayleigh lidar. Each of these cameras collected data at a high rate—a burst of four 20 MB images every 2 s. Balloon-borne payloads include experimental risks that can result in the loss of collected data. PMC-Turbo was the first experiment of its type, so our predictions accounted for a large uncertainty in sky conditions and optimal viewing strategy. Therefore, the science objectives of the PMC-Turbo experiment imposed the following requirements on our software design.
1. The software needed to manage the data throughput from cameras to the hard drives.
2. The software needed to be robust to failure of individual computers, communication components, or other subsystems.
3. We needed to have the ability to command the payload from the ground, monitor each subsystem through aggregated housekeeping, and sample imager data.
Our requirement for data handling drove our selection of computer hardware in turn since the large data volume generated by our cameras required a server-grade motherboard to store to disk. Since we required powerful computers for data storage, we found no downside to including flight control capabilities in each individual computer, as opposed to the more common design of using a dedicated flight control computer. This allowed us to greatly improve the resilience of our system to single-point failures since any instrument computer could assume responsibility of the communication between local systems and our telemetry connections. To reduce the impact of an isolated disk failure, each computer ran software to grab data from the connected instrument and distribute the images to the four hard drives connected to the computer.
To reduce the risk inherent in balloon-borne platforms and to allow for adaption of our observation strategies in real time, we developed a robust telemetry system. We continuously monitored our instrument statuses and we downlinked as much data as possible to retain some scientifically useful data in the event our payload could not be recovered. We used the telemetry channels made available by NASA to send compressed and packetized science and housekeeping data to the ground. To monitor the data received on the ground, we developed software to track data sent down and send commands to the payload.
While we wanted to monitor and command the payload as much as possible, we needed to account for expected communication outages and the resulting absence of commands. We implemented these procedures to ensure that our camera systems captured and stored images to disk even if we lost contact with them. Our cameras had no real-time control requirements, although we did have the ability to control them at times we could communicate with the experiment from the ground. The operating system uses a Linux program (supervisor) to automatically start the data acquisition and communication software in a useful state and when the instrument module receives power, the motherboard automatically boots the operating system. The data acquisition software includes a watchdog that restarts the operating system after 10 min without new images. The default camera settings included an auto-exposure algorithm to maintain useful exposure times and a nominal focus sufficient to capture good data.
We wrote the bulk of our software in the Python programming language. This language allows for speedy development and is widespread in the scientific programming community. We developed the software on the Linux operating system since it is commonly used for scientific instrument applications and our developers were experienced with it. We used industry standard continuous integration tools to ensure reliable and speedy software development.
The distributed flight control structure of the SkyWinder flight control software requires consistent communication between the individual computers capturing experiment data. We use the Python Remote Object (Pyro) package to abstract much of this communication. This package allows programs running on one computer to seamlessly call classes and functions running on another. Pyro enables each process to use a Uniform Resource Identifier (URI) on the local network. After registering a URI, one process (such as the Controller, described in this section) can call another (such as the Pipeline) as a Python object. Not only does this facilitate communication between processes running on one machine, but our network structure allows each registered process to be visible and accessible to the entire network. Section 2.2, Section 2.3, and Section 2.4 describe the programs running on our computers and which were accessible to each other on our local network.
Figure 1 shows an overview of the final PMC-Turbo network as an example for how one can structure a distributed flight control hardware network to work with SkyWinder. Seven pressure vessels contain primary science instruments and the associated computers. The two RS-232 Ethernet converters, two Ethernet switches, and a direct Ethernet connection to Iridium Pilot ensure that no single point of failure removes communication to all the channels. Our telemetry box includes two Ethernet switches connected to each other. Three or four of the pressure vessels, one of the two power boxes, and one RS232-Ethernet converter connect to each Ethernet switch. This ensures that if either Ethernet switch failed or one SIP connection failed, we would not lose communication to the entire payload. We distribute the computers interfacing with our science instruments across the two Ethernet switches to avoid losing communication with all instruments if either Ethernet switch failed. The expanded view labelled “Pressure Vessel Interior” in Figure 1 shows the primary software processes of our software architecture described in this section. While PMC-Turbo included seven computers running the precursor to the SkyWinder software, we have also used the software to run a single instrument (during the piggyback flight). As far as we are aware, the upper limit for the number of instances of SkyWinder running on a local network is set by the hardware of that network and the computational resources available, rather than the SkyWinder software.
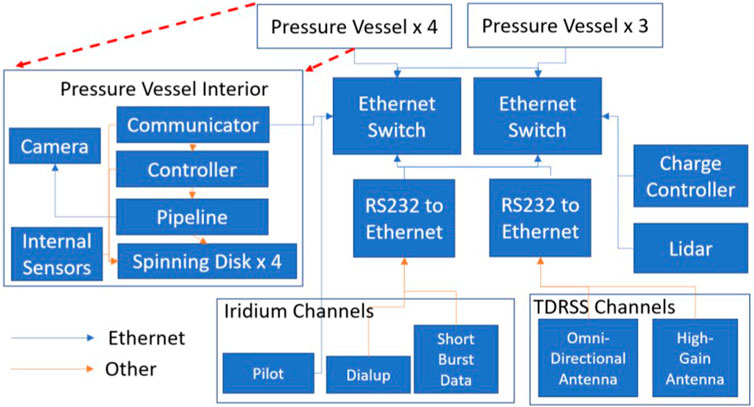
FIGURE 1. An overview of the PMC-Turbo network. The instrument suites within the pressure vessels, charge controllers, lidar, and telemetry antenna primary communicate over a local ethernet network. The expanded box labelled “Pressure Vessel Interior” shows the communication links between the subsystems associated with each computer. Figure originally published in Kjellstrand et al. (2020).
The Communicator class coordinates between the instrument computers contained within the pressure vessels and communicates with ground software. It aggregates housekeeping data, provides status reports, and receives, relays, and responds to commands. Each camera computer runs a Communicator instance. While all Communicator instances listen for commands from the ground, one Communicator is designated the “leader” and it assumes the bulk of the communication duties. One specific camera computer is designated leader by default, but the ground operators can change which camera computer assumes leader duties remotely since each Communicator instance includes the leader functionality.
Upon booting up, each Communicator reads a configuration file to set operational parameters. These parameters include the initial assignment of leader duties to one Communicator, the instrument hardware associated with each computer, other instrument statuses monitored by individual communications (such as power system metrics and exterior temperature monitors), and the peer polling order prescribing the order and frequency subsystems are polled. Each Communicator also instantiates SkyWinder HirateDownlink, LowrateDownlink, and Uplink objects. These objects include the IP and ports used for the experiment’s telemetry connections. The LowrateDownlink is responsible for the low-bandwidth connections made available by the ballooning hardware and only sends messages 255 bytes and less. The HirateDownlink is used for all other downlinks. It packetizes data and sends an appropriate number of packets given the configured bandwidth when prompted. The Uplink receives packets sent from the ground. All of the links use Python socket objects for communication and use UDP packets due to a potentially unstable connection to ground.
The configuration file should be tailored to each experiment’s needs. Experiments will use difference telemetry links, numbers of computers, and include distinct hardware to monitor. Operational parameters can be changed during operation. For example, if a group lost contact over the Iridium Pilot channel, they may want to decrease the downlink bandwidth on that link to avoid sending data on that link that they will never receive. Alternately, they may want to change the peer polling order if an interesting feature were observed in one specific instrument but not others.
Listing 1 shows a simplified version of the main_loop method of the Communicator class. While the main_loop includes other functionality in the PMC-Turbo, including monitoring specific hardware (e.g., charge controllers or batteries) and weaving status updates into several downlink streams, at it’s core the Communicator looks for data uplinked to the experiment network, responds to them, and sends data on the available downlinks. Recall that every computer on the network runs a Communicator instance, but only one Communicator instance is assigned as leader.
Listing 1. Simplified version of the main communicator loop.
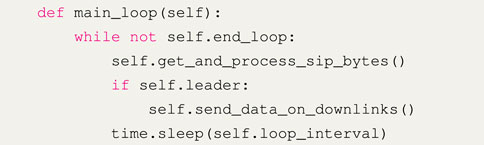
The get_and_process_sip_bytes looks for data on every Uplink and executes the packets. The CSBF Support Instrumentation Package (SIP) sends three types of message to the network: science data request messages at a regular cadence, science command messages relayed from the ground, and location information (e.g., GPS data).
The PMC-Turbo experiment responded to regular science data requests by aggregating a short (255 byte) status and sending it on the LowrateDownlink. SkyWinder includes this procedure in the Communicator get_next_status_summary method. The leader kept track of which computer to query, and each computer pulled metrics from saved logs and packaged them when prompted. While this code is included in SkyWinder, the metrics for each experiment will be unique to that experiment’s hardware, so each science group will need to craft such aggregation to their own needs.
SkyWinder includes functionality to package, interpret, and execute command messages in the Command object. Commands include changing downlink attributes such as downlink bandwidth and peer polling order, changing hardware settings such as exposure time and aperture width, and requests for a specific file or files or instructions about how to prepare files for downlink generally (level of downsampling, whether to downlink a full image or selection, etc.).
Finally, any other data that is received on the uplink (most likely position data) is logged. One notable feature of the uplink monitoring functionality of the Communicator is that every computer on the network receives every uplinked message. However, generally only the assigned leader responds to commands and science data requests. The exceptions are when the command is flagged as a “super command”. This behavior is intended to allow for switching which Communicator assumes leader duties, even (and especially) when the previous leader has ceased to communicate successfully.
Listing 2. Streamlined data sending method with error catching removed for clarity.
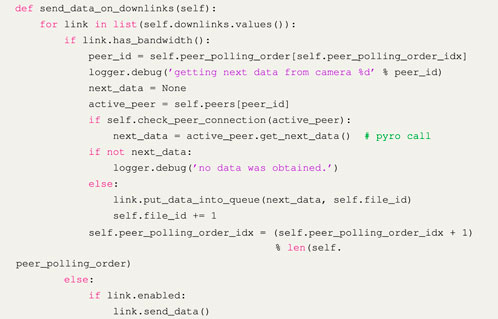
Listing 2 shows a simplified version of the sending process. The leader goes through each of its downlinks and checks whether it has bandwidth. If the HirateDownlink currently has packets queued, the leader simply tells it to send some more packets. The number of packets is calculated by the HirateDownlink, which keeps track of the assigned downlink speed, time it sent data, and amount of sent data. If the HirateDownlink does not have packets to send, the leader pings the next peer in the list peer_polling_order. The Communicator attribute peers is a dictionary of the peer Pyro URIs. The leader finds the URI using the next entry in peer_polling_order as the key and tries pinging the peer to ensure it is responsive. If it is, the leader requests data from the peer and puts that data into the HirateDownlink data queue. Since each experiment ground has a different system for saving data from their experiment, each experiment will need a custom Communicator method for retrieving data. This may be as simple as finding the newest file in a specific directory. The PMC-Turbo Communicator calls the Controller, which compresses the raw image data with configurable settings and keeps track of a queue of files to downlink. This is typically the latest file, but can include a series of requested images.
The HirateDownlink packetized data passed to it in chunks of 1,000 bytes. We developed a packet format to maximize the bandwidth available to us on multiple communication channels with distinct communication protocols and track missing or incomplete files with the ground-side software.
Our custom packet format identifies itself with respect to all data we have downlinked. While the SkyWinder software can use many different telemetry channels, the PMC-Turbo experiment received data from Iridium Pilot at a fixed IP address on Columbia University campus in Manhattan, data from the LOS link at our launch location in Sweden, and the TDRSS data at computers in Texas. During flight, we could access all these geographically separated computers remotely, but we needed metadata generated from the communicator to identify the files. For example, the Nth file could be sent over the Iridium Pilot link to New York while the N+1st file could have arrived in Texas over the TDRSS link.
We needed our software to account for missing packets and incomplete files. We expected regular and sometimes a significant percentage, of missing packets and early on we had decided to use UDP packets. Unlike TCP packets, UDP packets include no handshaking to determine whether data has arrived at the destination, so we had no built-in method of knowing whether data was missing. However, the absence of arrival verification meant UDP packets made for more robust communications. In the event of low quality connections, we prioritized maximizing the chance that packets would get through, rather than jeopardize the communication by requiring a TCP response. Instead of using built-in packet verification, when the communicator prepares data for downlink, it includes metadata with the packetized chunks indicating the communication channel and the packet number, along with the total packet numbers. This allows the ground-side software to track missing packets and aggregate packetized data back into complete files. We also include a checksum to verify that individual bytes for packets had not been corrupted or lost (for example, one packet losing its “tail” and another losing its “head”).
When a Communicator retrieves a file using the get_next_data method, it requests data from the Controller (described in the next section) running on the same machine. While each Controller is callable to each Communicator on the local network via Pyro, a Communicator only interfaces with the Controller running on the same computer in the functions we have implemented so far. Unlike the leader assignment of the Communicators, Controllers have identical responsibilities. After the Controller selects and prepares a file (typically with compression), it wraps it using one of the classes inheriting from the FileBase object in the file_format_classes module. While each of the inheritors are somewhat different, they essentially all wrap the file in a Python class that includes useful metadata. This object is then converted to a buffer of bytes and passed by the Communication to one of its HirateDownlink instances. This buffer is split into chunks of 1,000 bytes, which are then wrapped using the FilePacket objects from the packet_classes module and sent to the HirateDownlink socket to be sent as UDP packets.
On the ground, the packets can arrive wrapped in different states, depending on the link. The ground software (described in Section 2.6) processes and metadata from the telemetry link, tracks and reassembles the FilePacket objects, and writes both the FileBase object and the payload file in that object to disk.
The Controller class interprets commands from the communicator and relays them to our hardware interface (the pipeline, described in Section 2.4) in order to control camera settings and retrieves images from the data disks. It also handles grabbing files from the hard drives and compressing these files to prepare them for downlinking. While simple experiments may be able to skip using the Controller, the image preparation, file compression, and command interpretation functionality of the Controller will be useful to many groups. However, the SkyWinder software can work without using a Controller, and some science groups may chose to use only the Communicator.
As one monitors the experiment from the ground, they often want to review specific images and files. The Controller can also prepare specific images upon request or raw files (such as a raw housekeeping log or uncompressed image). Since the PMC-Turbo experiment dealt primarily with images, we also included the functionality of requesting specific regions of the image. A ground-based user could request the default downlinked image to be an arbitrary pixel area (such as 512 × 512) selected from any location in the image at any possible downsample resolution (that is a resolution reachable via integer division of the original resolution of the image).
The Controller can also interpret and run multi-step processes, such as a focus sweep where the camera cycles through a range of focus steps, capturing an image at each step, and downlinks the images for ground review. The Controller interprets the focus sweep command from the communicator and automatically prepares and relays commands to adjust focus step settings and retrieve images taken at each focus step for evaluation on the ground.
While the Controller primarily acts as an interface between the communicator and the pipeline, it has some automated duties as well. On a periodic interval, it checks for completed commands, executes steps in multi-step commands (such as focus sweeps or downlinking a series of images), and updates the merged index of images and commands. It can also run a custom configurable auto-exposure algorithm if required.
We anticipate that most science groups using the SkyWinder flight control software will need to write their own hardware-software interface due to unique science instruments. However, we have included the PMC-Turbo pipeline in SkyWinder as an example and for our own use. It sends commands to our instrument hardware, arms the camera to capture an image, receives the image data, and writes the image to one of the four data disks. The Pipeline classes manages these process
The primary responsibility of the Pipeline is moving data from the camera buffers to the hard drives. Upon initialization, the Pipeline creates a configurable number of raw image buffers and puts them into an input queue. The Pipeline also instantiates an output queue, where the buffers will be moved when filled with image data. The Pipeline starts one AcquireImageProcess class and several WriteImageProcess classes which watch the input and output queues instantiated by the Pipeline. The AcquireImageProcess passes the buffers of the input queue to camera via the SDK. It periodically checks whether these buffers have been filled and it moves them to the output queue once they have been filled. The WriteImageProcess instances periodically check the output queue and write these buffers to disk. The WriteImageProcess then move the now empty buffer back to the input queue. The Pipeline performs lossless compression on the images when it stores them on the spinning disks using the Blosc library.
Due to the structure of the Vimba software development kit (SDK) released for our cameras, the Pipeline also acts as our interface with our specific camera hardware. The Pipeline acts as our software-hardware interface with the cameras via the SDK. Allied Vision publishes the Vimba SDK with functionality including image capture, setting parameters for the camera (exposure time) and lens (aperture, focus), and capturing bursts of images. While the SDK is written in C++, our own software includes a Cython wrapper to allow our Python code to interface with the SDK.
The Pipeline instantiates a command queue and acts as the final destination for commands received by the communicator and interpreted by the Controller. When a command is put into that queue by the Controller, the Pipeline process will execute the command by calling the SDK function that directly commands the camera.
SkyWinder includes software to command the payload from the ground in nearly real time. The CommandSender class in the commanding module provides the central commanding functionality. It sends commands to the appropriate socket or Serial instance and translates human-readable commands into a compressed telemetry-hardware-appropriate format.
Since the uplink bandwidth is very low, the SkyWinder commanding packages commands as few bytes as possible—typically less than twenty. The format for each command is defined in the command_table module. The CommandManager object reads these definitions and constructs Command objects from them. When called with the appropriate arguments, each Command object will return a byte-string readable by the Communicator. Each Command object also describes the arguments and types it expects for this call using the Command.__doc__ method. The user-interface CommandSender adds each Command as an attribute for convenience. The user can then send a Command simply with as shown in the pseudo-code in Listing 3.
Listing 3. Pseudo-code showing a command sending example.

We designed this software to operate with the CSBF telemtery hardware, but we believe our software is general enough to easily adapt to the telemetry hardware science groups will use. The CommandSender packages the command bytes appropriately for the various telemetry uplink channels (wrapping the bytes in a GSECommandPacket or CommandPacket) and logs the commands sent. The Communicator also keeps track of received commands and will send the logs to the ground upon request. With PMC-Turbo, we also included the latest executed command in our short status summary.
We developed custom ground software to display status updates and files received from our payload. The software reassembles the packetized files prepared by the communicator and displays included metadata. The telemetry software on both the ground and payload side worked with all of our telemetry channels. The ground side software also communicated with the NASA SIP module for an additional channel for basic housekeeping metrics.
The core part of the SkyWinder ground software is the GSEReceiver. GSEReceiver receives data from a socket or Serial instance. It sorts through the raw data buffer to identify packets and their origin. It uses packet metadata to reassemble files from the packet payload and verify that no data has been corrupted in the downlinking process. The GSEReceiver logs the received packets, their origin, writes status packets to disk, and writes the reassembled FileBase inheriting objects to disk for review of the attached metadata. It also writes the payload of the FileBase objects—the original file—for quick survey of the downlinked files.
We wrote quality of life software that interfaces with the GSEReceiver. The lowrate_monitor_gui module launches a GUI that displays the status updates from all computers received by the GSEReceiver in an organized table that updates every few seconds. The gse_receiver_monitor module shows individual packets as the GSEReceiver identifies them and shows how many packets out of the total have arrived of each new file that the GSEReceiver identifies.
The pmc_viewer module displays JPEGs saved by the GSEReceiver along with image metadata. We built this software specifically for PMC-Turbo’s image viewing needs. However, experiments that want to view image data as it arrives on the telemetry downlink will likely find this software valuable. Figure 2 displays a screenshot of the pmc_viewer showing an image including interesting science features. This screenshot was taken during the 2018 PMC-Turbo flight. The dynamic range has been adjusted using the GUI software to emphasize the PMCs, visible as bright stripes oriented diagonally within the image. The left column displays metadata, including exposure time, aperture stop, file id, and focus step. The metadata also informs the viewer of the level of downsampling of the image and the time stamp of the image. In the upper left corner of the image within the GUI is a selection tool, which can be dragged and re-sized. The text below the image changes as the user adjusts the selection and gives a command argument to request the selected region of the image. To the right a histogram of the image allows a viewer to change the display grey scale range live and see image statistics.
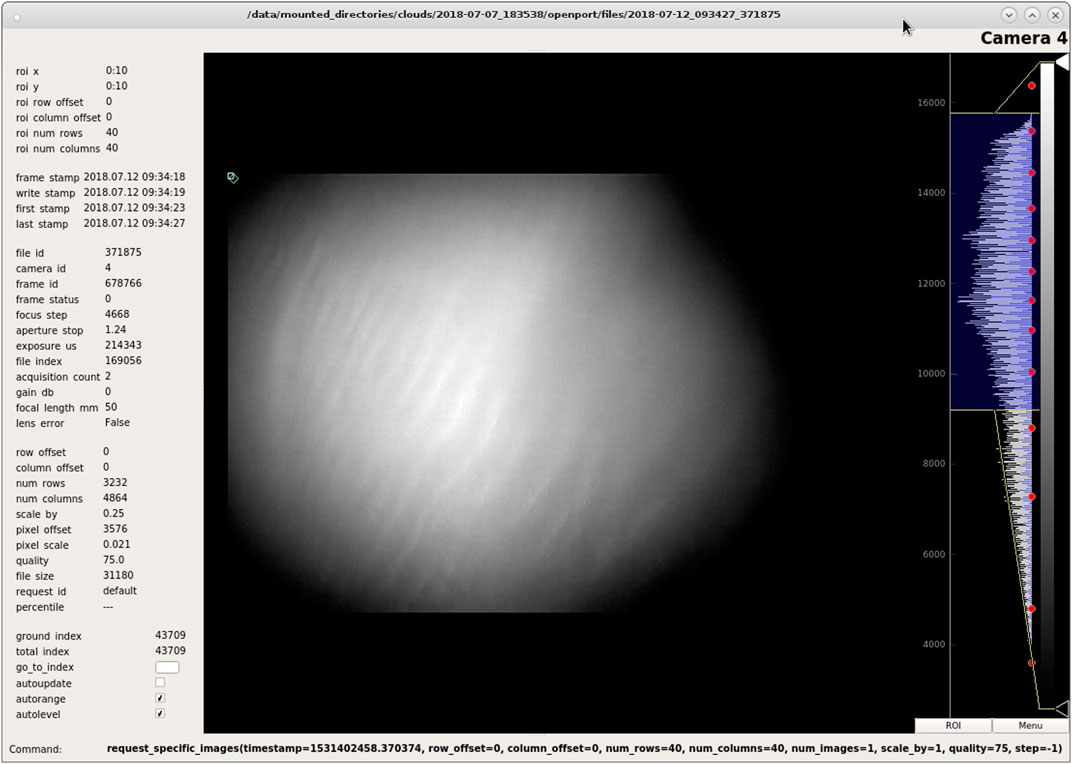
FIGURE 2. The pmc_viewer software during the 2018 PMC-Turbo flight. The diagonal striations in the image are Kelvin-Helmholtz Instabilities traced by PMCs. Figure originally published in Kjellstrand et al. (2020).
The LDB EBEX Analysis Pipeline (LEAP) [described in Chapman (2015)] successfully analyzed PMC images from the balloon-borne E and B experiment (EBEX). While the primary science of the experiment was to detect signatures in the cosmic microwave background, its star cameras serendipitously recorded images of PMCs during its 2012-2013 Antarctic flight. These images provided the motivation and basic design for the PMC-Turbo experiment. We used the same analysis structure for our analysis software. The software is structured such that “apps” generate specific data products while importing generalized procedures from shared libraries of code. This structure is standard for the development of software projects, which makes publishing and maintaining this code as an open-source package straightforward. The consistent structure helps when a user wants to generate data products while using previous products as a reference.
The libraries include functions we frequently use in analysis programs. The intention behind this structure is that these tools will continue to be refined and developed, rather than duplicated during individual analysis projects. Libraries include broadly useful functions performing image processing and projection, movie making, power spectrum calculation, and data handling and manipulation.
While the libraries included code designed to perform frequently used tasks, each app generated a specific data product. For example, I wrote separate apps to generate image series, power spectra statistics, and Lomb-Scargle periodograms. All these example apps drew from the shared image processing and projection libraries.
Each app inherited a framework and associated functionalities from a parent class. This class defined a common template imposing requirements and providing features for each app. This included receiving input parameters in a dedicated settings file. For example, the image series app settings included timestamps for images, which camera data to include, which flat-field procedures to use, which region of the sky to show, which color scale to use, whether to show timestamps, and whether to output a series of individual images or a movie file. Another important feature of the app parent class was generation of an output file. This file included the data product generated by the app, logs from running the app, and the settings used.
Each app includes “default_settings” file included in its directory. This file includes all the configurable settings for any analysis procedure. The user writes a separate “custom_settings” to input any settings other than the default. For example, an image-generating app takes timestamps, resolution, and selection criteria from the settings files.
Along with the specialized data product (images, movies, etc.), each app writes the default_settings and custom_settings files to disk. It also writes a text file including the settings used and a log file from the run.
We implemented image correction techniques to examine our data, and these became the first entries to our software libraries described in Section 3.1. Furthermore, our cameras captured a rectilinear projection of the sky due to their geometry, so we needed to convert this projection back to the physical plane of the PMCs in order to correctly analyze scales and morphology of observed dynamics. These data reduction procedures are standard for imaging of the sky using standard lenses, and we anticipate that they will be broadly useful to many atmospheric science groups.
We calibrate a raw image R with a flat-field image F, dark image D, and simulated sky brightness image S. In this process we use the following calibration data.
• A dark image D defined before flight to account for the dark current in the CCD.
• A simulation of sky brightness S accounting for brightness due to air mass and the scattering angle between each pixel’s view and the sun.The model for the sky brightness is geometric based on the position of the sun and the viewing angle of the camera, the derivation of which is outlined in Geach (2020). To quote the result derived there, the sky brightness Sunscaled is
where θ and ϕ are the azimuth angle and off-zenith angle of a pixel and θS and ϕS are the azimuth angle and off-zenith angle of the sun. As discussed in the next section, the location of each pixel is determined with imaged star fields, and the GPS included on the payload allowed us to know the position of the sun in the sky when our cameras recorded an image.
Since the signal of a raw image is dominated by sky brightness, to account for pixel sensitivity and exposure time Sunscaled was scaled to S as
where brackets note scalar mean values.
• A flat field F defined before flight from twilight images with varying brightnesses to account for vignetting, illumination differences due to the lens hardware, and variations in pixel sensitivity. Since we did not have access to a uniformly illuminated flat-field, this flat-field was corrected not by removing the dark image D, but by removing sky brightness S. In an ideal case, the flat field image F is found by imaging a uniformly illuminated field and normalizing that image after subtracting D. However, F can be found with any known illumination field instead if a uniform field is not available. We used the dusk sky for this purpose since we needed to use it for our pre-flight pointing verification. At dusk, the sun is below the horizon, but light still reaches the Earth’s surface because air masses at higher altitudes have a further horizon than the ground and reflect incident sunlight. The integrated brightness scales with atmospheric density. Since the density falls off exponentially with altitude, the amount of light scattered to the ground can be well-approximated as proportional to the lowest altitude illuminated by the sun. When we know pointing and sun coordinates, the lowest illuminated altitude can be calculated for each pixel. Therefore, multiplying the sky brightness model S by a value proportional to the atmospheric density at the lowest illuminated altitude for each pixel provides a known illumination field which we use to calculate F for each camera. This procedure was repeated for several hundred images taken at different times during dusk and the results were co-added and normalized to find the final flat field F. This procedure is described in detail in Geach (2020).
During out image calibration process, we first apply a flat field correction using the standard method (using the corrected flat field described above):
where
where texposure is the exposure time and brackets denote scalar means.
During the PMC-Turbo flight, insufficient baffling between the cameras and balloon allowed stray light varying with timescales of minutes to hours into our cameras’ fields of view as the relative position of the sun and balloon-borne platform changed. To correct for this stray light contamination, we subtract a moving average of the calibrated images from our final image. This step may not be necessary for all experiments, but stray light contamination is a common challenge in ballooning, so we have included these procedures in the SkyWinder image correction procedures. We subtract a moving average image Istray accounting for stray light from our final image Ifinal:
We construct Istray by taking a pixelwise average of calibrated images in a window of time centered around the image to be corrected (typically 10 min). The ith, jth pixel value in Istray is the mean value of the ith, jth pixel in each calibrated image within that window. To minimize loading time and memory usage during this process, we save calculated Istray instances at a 1-min cadence throughout flight and use these saved images to construct the Istray for any specific time rather than finding it from scratch each time we apply the image processing procedure. This allows us to load about 10 files per stray-light-removal application rather than 1,000. The pre-constructed Istray files reduce the time resolution available for our window, so we use interpolation to construct the subtracted Istray from them.
Figure 3 shows a raw image to the left and an image corrected using the steps above in the center. Of these corrections, the removal of the moving average is by far the most significant and simply removing the average can deliver sufficient signal-to-noise ratio to quickly survey data.

FIGURE 3. From left to right: raw false-colored image of one of the wide-field cameras containing PMCs; the same image after flat-fielding; and the same image after flat-fielding and projection based on the pointing solution. Up orientation in the first two images corresponds to the zenith, and up orientation in the projected image corresponds to the longitude of the sun. We projected the image looking from below. Figure originally published in Kjellstrand et al. (2020).
Balloon-borne experiments must record data at some off-zenith angle to avoid the highly-reflective balloon. Pointing off-zenith with a rectangular CCD and a standard lens introduces rectilinear distortion. While some lenses (such as fisheye lenses) will require different projection techniques, many images can use the projection techniques included with SkyWinder.
We remove rectilinear distortion by finding the pointing of the images using background star fields. For each camera we found the sky location of an evenly-spaced grid of pixels (spaced every quarter of the CCD, including the edges). We interpolated over this grid to map each pixel in the CCD to the proper location on the sky.
We found that we could use the tracking software package Astrometry to get the right-ascension and declination (ra/dec) of an evenly spaced grid of pixel locations. From right ascension and declination we converted to azimuth and elevation of the grid using GPS timestamps and locations from the flight. However, this software required the pixel locations of stars. Since the PMC Turbo pressure vessel design was based on the star camera design from the EBEX mission, we used a procedure based on the star finding procedure used in EBEX described in depth in Chapman (2015) and used the image manipulation python package CV2 python, which wraps the well-known library OpenCV. The star identification algorithm operates as follows.
1. We mask previously identified “hot pixels”.
2. We convolve the image with a Gaussian kernel of configurable size and sigma in order to smooth the image.
3. We divide the image into sections - or “cells” - of configurable size.
4. In each cell we look for values above a configurable threshold level.
5. We compare the pixel brightness values at above-threshold levels to the pixel brightness values in a dilated version of the same image. If the values are the same we have found a local maximum.
6. We select a configurable number (typically 1) of local maxima for each cell and return their coordinates.
7. As an optional additional step, we fit 2-dimensional Gaussian distributions to each blob. We can filter by the sigma of the Gaussian fit to filter out unphysical results caused by CCD artifacts that have slipped through our other filters.
Figure 4A shows stars identified following these steps. Figure 4B shows the location of these stars in the corrected image before projection.
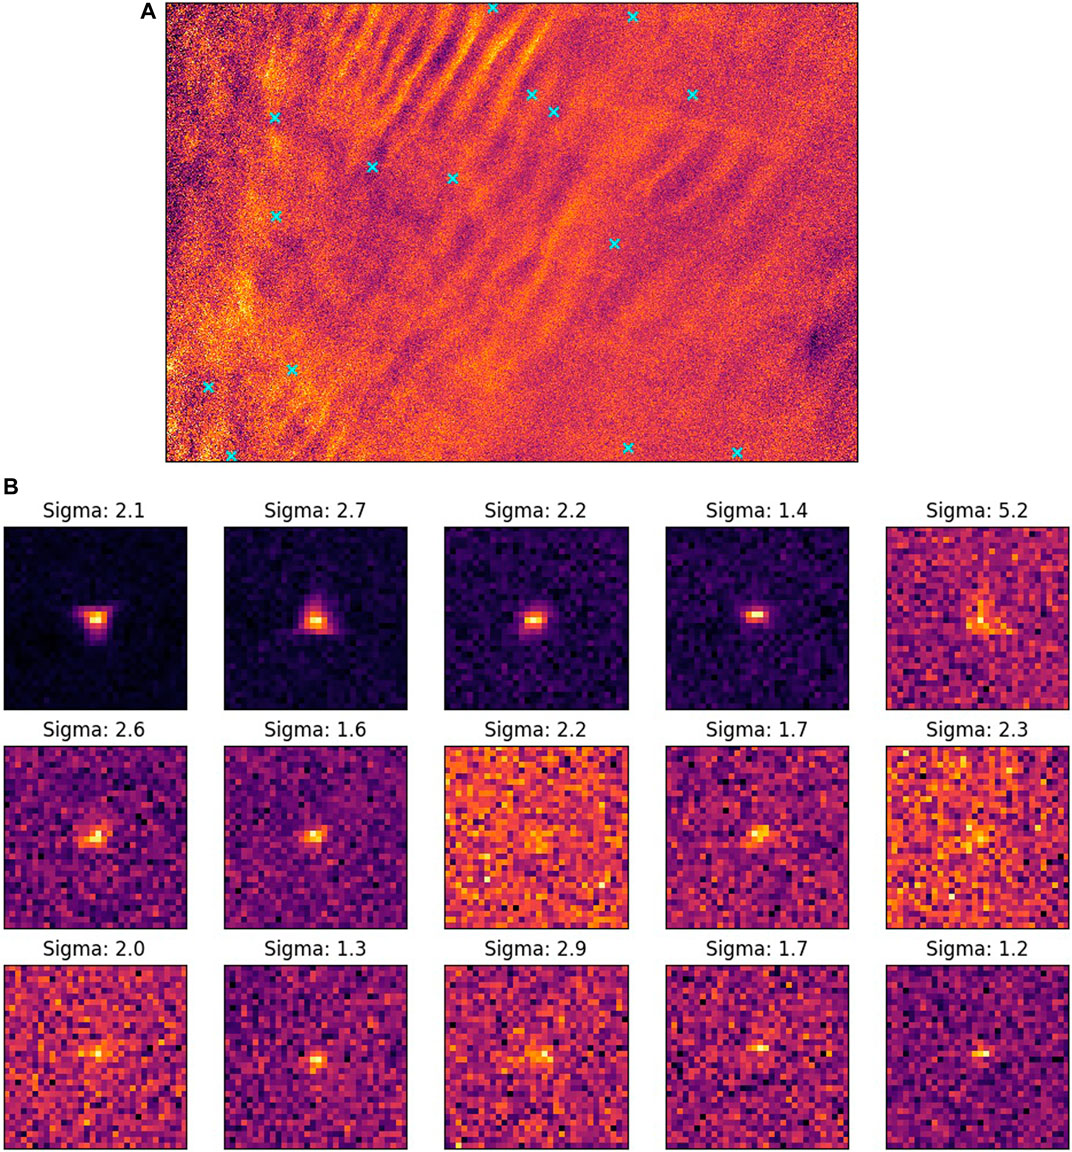
FIGURE 4. An example of star identification. Figure originally published in Kjellstrand (2021). (A) Cyan X’s mark the location of stars found with the SkyWinder star identification algorithm. The image shown has been calibrated and stray light have been removed, but not projected. (B) Close up view of fifteen of the stars identified in (A).
Once we have a pointing solution for the evenly-spaced grid of pixels for each image, we project the raw image onto the plane of the PMCs to reconstruct their true scale and morphology. From the grid we interpolate the location of every pixel in the raw image. SkyWinder includes two processes to use these pixel locations to project the image. Each has unique benefits and drawbacks.
One technique is pixel projection. This technique maps the pixel brightness value to the location of the pixel on an x-y plane at the PMC altitude determined by the pointing solution. Compared to the method described below, this method is fast. However, this method did not generate evenly-sampled data as pixels at large off-zenith angles gathered light from a larger area than those at small off-zenith angles. This method can more easily rotate the projected FOV with changing pointing due to the rotation of the sun through coordinate transforms—an often useful feature in ballooning since instruments typically have active anti-sun pointing.
The second technique developed is grid mapping. In this method, an evenly spaced grid representing the sky at the PMC altitude is filled in the pixel brightness values. These values are found from the source image by mapping each grid pixel to the corresponding image pixel. A Cartesian grid on the PMC plane is chosen, with the origin chosen to be the location of the gondola and the -Y direction corresponding to the anti-sun direction. The grid can be instantiated at any resolution, so the spatial resolution of the final data product is limited by the raw image spatial resolution. While this process has been optimized to use standard look-up tables rather than calculating the pixel corresponding to each grid, the pixel-by-pixel fill still takes longer than the pixel projection. As a result, we tend to use this method during short duration events where the sun’s rotation does not have a large effect or when we do not care about the cardinal direction of the dynamics. The evenly spaced grid facilitates many quantitative analysis techniques such as 2D power spectra.
The SkyWinder analysis code includes a variety of data visualization procedures useful for imager data sets. While specific science groups will want to develop their own analysis procedures, SkyWinder includes some generally useful apps. Images can be stitched together in projected and unprojected states so dynamics can be viewed over a large composite field of view. These images can be aggregated into movies and image series at configurable cadence and pixel-binning. We also include power spectrum-per-image frame generation, keogram creation, and basic statistic reporting.
The SkyWinder flight software has been used in the field three times. It ran during the 6-day PMC-Turbo flight during 2018 and again for about a month on a single PMC-Turbo instrument suite contained within a pressure vessel that flew as a secondary (“piggyback”) experiment on the 2019-2020 Super Trans-Iron Galactic Element Recorder (SuperTIGER) flight. The trajectories of these flights are shown in Figure 5. Additionally, the flight software has been integrated with the BALloon Based Observations for Sunlit Aurora (BALBOA), which had a North American test flight September 2022 and is scheduled for an Antarctic science flight 2023-2024.
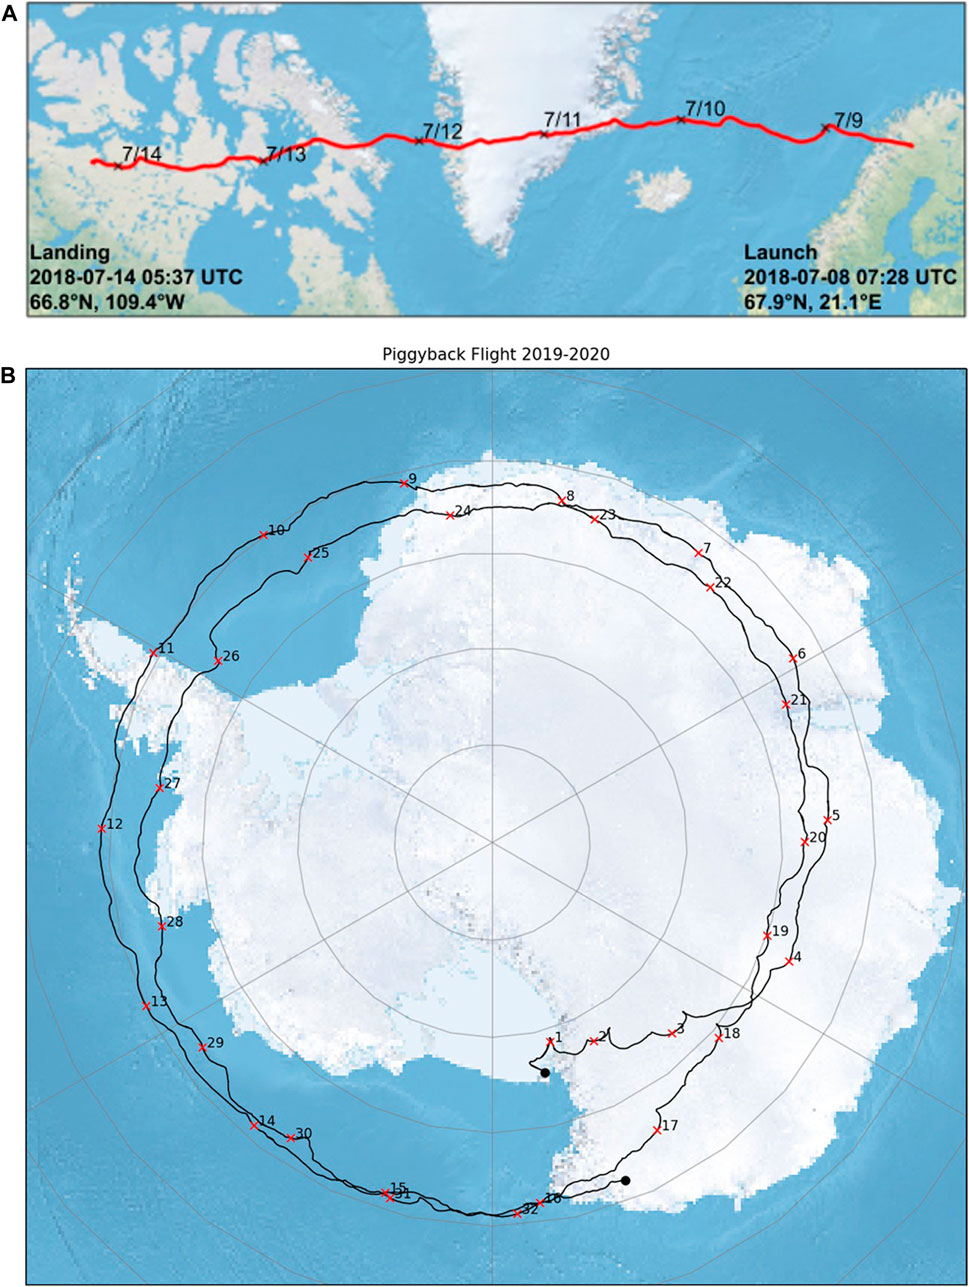
FIGURE 5. PMC-Turbo flight trajectories using SkyWinder flight control software. (A) The PMC-Turbo flight trajectory from Kjellstrand (2021). (B) Piggyback flight trajectory with marked days of flight from Kjellstrand (2021).
During the primary science flight we successfully sent commands in real time in response to the changing sky conditions, we observed PMCs even in low quality downlinked images, as shown in Figure 2, and we used the communication channels to run several live tests including using stars to dial in our focus settings with focus sweeps and measuring the sky brightness as a function of sun angle. During flight we downlinked over 37,000 files over the LOS link, 245,000 files over Iridium Pilot, and 257,000 files over TDRSS. Of these 540,000 files, about a third were compressed images.
The piggyback also successfully downlinked images for the first half of flight. While issues with the downlink channel prevented us from receiving files or communicating with the piggyback for the second half of flight, the instrument was retrieved and found to have recorded data as designed in spite of the communication blackout.
The data from the PMC-Turbo primary science flight and piggyback were successfully retrieved. Analysis is continuing and has already resulted in notable science results in gravity wave breaking, vortex ring formation, mesospheric bores, and the role of turbulence in gravity wave momentum deposition in the middle atmosphere [see Fritts et al. (2019); Geach et al. (2020); Fritts et al. (2020)].
The SkyWinder flight software is suitable for experiments which have relatively low performance requirements for communication speed and which therefore prioritize ease of implementation and testing more highly. The use of Python rather than a compiled language limits the ability of the user to optimize for computational efficiency, but greatly increases implementation speed. Many balloon-borne experiments will match this characterization. The downlink speeds currently available to balloon-borne experiments are hundreds of kilobits per second, so data throughput does not exceed the rates possible with Python. Furthermore, experimental complexity is limited by the power, weight, and volume requirements of the balloon-borne platform. We expect many of these limitation to complexity to be shared with other mobile experiment platforms.
We designed and tested the SkyWinder flight software on the Linux operating system. Python will work on other operating systems, but in our experience the science group using SkyWinder needs to have in-depth knowledge of the alternate operating system to successfully implement the SkyWinder flight control that relies heavily on Pyro. Fortunately, Linux is commonly used for scientific computing.
We are distributing and managing the package with the Python in Heliophysics Community (PyHC) project. PyHC is a project consisting of scientists developing a comprehensive set of Python packages useful in Heliophysics and establishing a set of agreed standards and best practices for the quality and preparation of open-source Python packages. We are maintaining our code to meet Heliophysics code development standards.
The PyHC group has assembled Heliophysics python packages on their website in an effort to provide a common hub for Python-based heliophysics modules. We will add the SkyWinder repository link to that hub. We will also provide the appropriate documentation and installation information for other scientific groups to use the code at the PyHC hub.
Our instrument data will also be publicly available. Both the data reduction software and the raw data will be easily accessible to interested scientists. This will greatly facilitate collaborations and future research, and ensure continued value from the NASA data set. The PMC-Turbo data will be hosted in the NASA Space Physics Data Facility (SPDF). The SkyWinder analysis code will include methods to pull the PMC-Turbo data from the SPDF. The SkyWinder package can also be used with the extensive imaging and lidar data on the NSF Madrigal database, which the PI has contributed to and used extensively.
The original contributions presented in the study are included in the article/supplementary material, further inquiries can be directed to the corresponding author.
CK wrote the manuscript, was a member of the team that wrote the PMC-Turbo software, and adapted that legacy code to the SkyWinder project. BW acted as the principal investigator of SkyWinder and provided feedback on the manuscript.
NASA Grant 80NSSC20K0178 funded the PyHC SkyWinder development. NASA Contract 80NSSC18K0050 funded the PMC-turbo mission from which the SkyWinder code was developed.
We would like to acknowledge the contributions of our PMC-Turbo team members, especially those who made substantial contributions to the experiment software included in the SkyWinder modules. Glenn Jones played a central role in the development of the PMC-Turbo flight software. Christopher Geach developed analysis procedures including much of our image correction method.
Authors BW was employed by GATS.
The remaining author declares that the research was conducted in the absence of any commercial or financial relationships that could be construed as a potential conflict of interest.
All claims expressed in this article are solely those of the authors and do not necessarily represent those of their affiliated organizations, or those of the publisher, the editors and the reviewers. Any product that may be evaluated in this article, or claim that may be made by its manufacturer, is not guaranteed or endorsed by the publisher.
Chapman, D. (2015). Ebex: A balloon-borne telescope for measuring cosmic microwave background polarization. Ph.D. thesis (Columbia University).
Fritts, D. C., Kaifler, N., Kaifler, B., Geach, C., Kjellstrand, C. B., Williams, B. P., et al. (2020). Mesospheric bore evolution and instability dynamics observed in pmc turbo imaging and Rayleigh lidar profiling over northeastern Canada on 13 july 2018. J. Geophys. Res. Atmos. 125, e2019JD032037. doi:10.1029/2019jd032037
Fritts, D. C., Miller, A. D., Kjellstrand, C. B., Geach, C., Williams, B. P., Kaifler, B., et al. (2019). Pmc turbo: Studying gravity wave and instability dynamics in the summer mesosphere using polar mesospheric cloud imaging and profiling from a stratospheric balloon. J. Geophys. Res. Atmos. 124, 6423–6443. doi:10.1029/2019jd030298
Fritts, D. C., Smith, R. B., Taylor, M. J., Doyle, J. D., Eckermann, S. D., Dörnbrack, A., et al. (2016). The deep propagating gravity wave experiment (deepwave): An airborne and ground-based exploration of gravity wave propagation and effects from their sources throughout the lower and middle atmosphere. Bull. Am. Meteorological Soc. 97, 425–453. doi:10.1175/bams-d-14-00269.1
Geach, C., Hanany, S., Fritts, D., Kaifler, B., Kaifler, N., Kjellstrand, C., et al. (2020). Gravity wave breaking and vortex ring formation observed by pmc turbo. J. Geophys. Res. Atmos. 125, e2020JD033038. doi:10.1029/2020jd033038
Geach, C. P. (2020). Gravitational and gravity waves: The EBEX and PMC turbo balloon experiments. Ph.D. thesis (The University of Minnesota, Minneapolis).
Kjellstrand, C. B., Jones, G., Geach, C., Williams, B. P., Fritts, D. C., Miller, A., et al. (2020). The pmc turbo balloon mission to measure gravity waves and turbulence in polar mesospheric clouds: Camera, telemetry, and software performance. Earth Space Sci. 7, e2020EA001238. doi:10.1029/2020ea001238
Keywords: flight control, Python, software, PMC-turbo, telemetry, ballooning, image projection
Citation: Kjellstrand CB and Williams BP (2023) SkyWinder: A Python package for flight control, telemetry, and image analysis. Front. Astron. Space Sci. 10:1023550. doi: 10.3389/fspas.2023.1023550
Received: 19 August 2022; Accepted: 28 February 2023;
Published: 14 April 2023.
Edited by:
K-Michael Aye, Freie Universität Berlin, GermanyReviewed by:
Nickolay Ivchenko, Royal Institute of Technology, SwedenCopyright © 2023 Kjellstrand and Williams. This is an open-access article distributed under the terms of the Creative Commons Attribution License (CC BY). The use, distribution or reproduction in other forums is permitted, provided the original author(s) and the copyright owner(s) are credited and that the original publication in this journal is cited, in accordance with accepted academic practice. No use, distribution or reproduction is permitted which does not comply with these terms.
*Correspondence: Carl Björn Kjellstrand, YmtqZWxsQGdtYWlsLmNvbQ==
Disclaimer: All claims expressed in this article are solely those of the authors and do not necessarily represent those of their affiliated organizations, or those of the publisher, the editors and the reviewers. Any product that may be evaluated in this article or claim that may be made by its manufacturer is not guaranteed or endorsed by the publisher.
Research integrity at Frontiers
Learn more about the work of our research integrity team to safeguard the quality of each article we publish.