- National Institute for Space Research, São José dos Campos, Brazil
Camera characterization is critical for solar observation instruments such as spectropolarimeters. This paper presents the characterization of the proof-of-concept spectropolarimeter sCMOS image sensor. The report is divided into two parts. The first is to analyze the behavior of each pixel due to changes in the camera’s operation mode. Analyze the camera’s sensor cooling, shutter, and corrections and filters. The second part is the characterization of the camera, analyzing linearity, gain, and polarization effects. For this first phase of the project, the commercial sCMOS image sensor successfully acquired images of the Stokes parameters in an agile manner. However, a new camera with less non-linearity will be necessary for the project’s next phase.
1 Introduction
Despite being an ordinary star, the Sun significantly affects the Earth. The primary driver of solar activity is the Sun’s magnetic field, inducing diversified phenomena, from sunspots to coronal heating and solar eruptions to coronal mass ejections (Choudhuri, 2007). Solar activity can inject energetic particles into low Earth orbit and these events can damage spacecraft and satellites, as well as damage power lines and electronic systems. It can also cause telecommunication interference and affect GPS signals (Bothmer and Daglis, 2007).
Therefore, in order to better understand how the Sun and its phenomena work, it is crucial to understand how the solar magnetic field operates. The most accurate technology for measuring the solar magnetic field is based on spectropolarimetry, in which the solar spectrum is analyzed in intensity and polarization (del Toro Iniesta, 2003).
Several groups have been developing ground and space-based instruments employing these effects (Kano et al., 2008; Gandorfer et al., 2010; Schou et al., 2012; De Pontieu et al., 2014; Solanki et al., 2020; de Wijn et al., 2022). However, even with the advancement of technology, these instruments can still not achieve the necessary spatial, temporal, and spectral resolutions. Iglesias and Feller (2019) present a review of the instrumentation for solar spectropolarimetry. There is a detailed report of components that constitute a spectropolarimeter and a description of designs and trade-offs of different instruments.
Working with data from this and several other instruments, the Heliophysics Group at the Brazilian National Institute for Space Research (INPE) has been contributing to the international community to comprehend our nearby star (Chicrala et al., 2016; Dal Lago et al., 2017; Rodríguez Gómez et al., 2019; Muralikrishna et al., 2022).
The group started in 2014 a project to develop instruments for solar observations. It is the first national collaborative effort to measure the Sun’s magnetic field (Vieira, 2014). The Galileo Solar Space Telescope (GSST) mission is being developed at INPE, which has the following primary scientific goals: (a) Understanding the development of the magnetic structures of the solar corona; (b) Understanding the Sun’s influence on Earth’s climate; and, (c) Understanding the Sun’s effect on the Geospace.
To achieve the mission’s goals, the GSST was separated into three phases and different instruments, including a spectropolarimeter and an electrical substitution radiometer (ESR) (Vieira et al., 2015; CPRIME, 2018; Vieira et al., 2019; Carlesso et al., 2020; Carlesso et al., 2021; Carlesso et al., 2022; Vieira et al., 2022). In the early stage of the spectropolarimeter, a magnetograph and a visible light imaging device are developed in a laboratory-controlled environment. Putting the advanced prototype in an uncontrolled environment and installing it in a ground-based observatory at Pico dos Dias make up the second phase. The third phase is related to developing instruments for space-based platforms.
2 Proof-of-concept prototype of the spectropolarimeter
The proof-of-concept prototype of the spectropolarimeter is a functional version of the instrument. Its purpose is to acquire knowhow and test the control system, synchronization, data acquisition and image concept, and optical design restrictions.
Knowing every development, operation, and calibration step are one of the advantages of developing a prototype. Despite differences in operation, construction, and data analysis between a proof-of-concept and a spectropolarimeter (e.g., the possibility of process changes, performance in a vacuum, and the influence of the Earth’s atmosphere), actual observations from the PCPS can be utilized. The main goal of the proof-of-concept is to learn how a spectropolarimeter works and to specify the requirements for the project’s subsequent phases.
The PCPS consists of a Ritchey-Chrétien telescope, a polarization modulation package, a Fabry-Pérot Etalon interferometer, sCMOS camera, pre-filters, and narrowband filters. The optical telescope used for the proof-of-concept has a 150 mm aperture. The intermediate optics were modified for a system with two-inch lenses and a focal length of 1370 m (f/9).
The pre-filter is one of the components of the entire system, as it eliminates unwanted wavelengths by reflecting them. The light goes through the two pre-filters in the PCPS immediately following its passage through the telescope. They have a 7.5 Å spectral window, centered on the selected line, 6302.5 Å.
Two variable liquid crystal retarders (LCVR) and a linear polarizer constitute the polarization system. By altering the combination of LCVRs voltages, sixteen states of polarization (SoP) can be selectable. It is significant to note that the position of LCVR1 is distinct from that of LCVR2 while the linear polarizer is fixed.
The Fabry-Pérot interferometer (Etalon) is a tunable filter composed of parallel mirrors with a high degree of reflection (95%). The Etalon employed in the proof-of-concept is the ET70 from IC OPTICAL SYSTEMS LTD, in which piezoelectric actuators are built into the Etalon. The system control is done by CS100 also from IC OPTICAL SYSTEMS LTD. This three-channel system uses the piezoelectric actuators to monitor and adjust mirror spacing and parallelism flaws. Therefore, two channels manage parallelism while a third one preserves spacing. The Etalon can choose between 6301.5 and 6302.5 as its operational wavelengths. It is the element in charge of spectral scanning, achieving up to 64 spectral positions for the proof-of-concept. One can obtain these positions by altering the voltage that supplies the Etalon as the distance between the mirrors varies as the voltage change (IC OPTICAL SYSTEMS, 2022).
It is not possible to mount the spectropolarimeter linearly. In order to bend the light beam and thereby reduce the device’s size, one can introduce mirrors into the optical path. Figure 1A shows the side view of the spectropolarimeter’s mechanical model. This perspective allows one to see the telescope and the red rectangles that represent the pre-filters. Figure 1B presents the front view is shown in Figure 1B. Here, the mirrors and the other parts are visible in full detail.
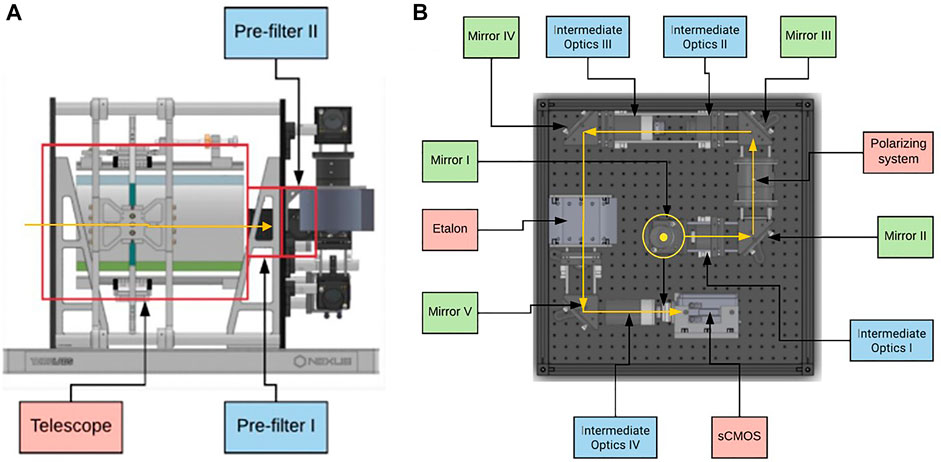
FIGURE 1. Mechanical model of the spectropolarimeter’s proof-of-concept. (A) represents the side view and (B) is the front view. Yellow arrows indicate the path of light on both panels. The light enters the telescope and then passes through the other components in the optical path after passing through the pre-filters.
A Zyla5.5 sCMOS camera serves as the output sensor for the data acquisition system. Every pixel in the array of the CMOS sensor (Complementary Metal-Oxide Semiconductor) has a photodiode, a capacitor, a charge-to-voltage conversion stage, and an amplifier (Meseguer, 2013).
3 Imaging detectors for solar spectropolarimeter
The detector has the crucial function of quantifying the number of photons at a given exposure time. The time scale for solar phenomena can vary greatly. Phenomena such as flares are as fast and, depending on the wavelength of observation, can have a duration of tens of milliseconds to hours (Fletcher et al., 2011). Therefore, spectropolarimeters’ high resolution and accuracy is strongly dependent on camera performance (Iglesias and Feller, 2019).
Fast and low-noise sensors have been made possible by developments in sensor technology. Both CMOS and CCD (charge-coupled devices) sensors are commonly used in solar spectropolarimeters, though the first is more common in recent models. The only difference between the two sensors’ modes of functioning is the location and timing of each phase within the detector. Unlike CCDs, a single CMOS pixel performs the charge creation, collecting, and voltage conversion (Waltham, 2013; Iglesias and Feller, 2019).
With the advancement of technology, there has been a significant reduction in readout noise for the CMOS sensors. Another advantage is an independent pixel; thus, it can have two types of readouts: rolling and global shutter. In global mode, each pixel in the sensor starts and ends the exposure simultaneously. In rolling mode, each row of pixels’ exposure start and end are slightly offset in time (10μs) from their neighbors, beginning from the center and moving towards extremities. Rolling shutter can achieve a frame rate that is two times higher than global shutter, which is one of its key benefits (Andor Technology, 2014).
The choice of operating mode depends on the purpose of the image acquisitions. In addition to the simplicity of acquisition, other advantages of the Global Exposure mode are a lower risk of spatial distortion and a high synchronization between pixels. However, the Rolling mode has the lowest noise and fastest non-synchronized frame rates. Another significant advantage is that no photons are wasted for Rolling Shutter since it has a 100% duty cycle. A new exposure of the pixels begins after each line has been read out. However, one disadvantage of the Rolling mode is spatial distortion. This phenomenon is most noticeable when objects move at speeds that the readout cannot match (Andor, 2020). Thus, for fast solar phenomena being observed, spatial distortion can be a problem.
Statistical uncertainties and noise occur at various stages of image acquisition. The evaluation of noise is an essential aspect of camera characterization (Seitz, 1997). Noise sources are diverse in sensors such as CCDs and scientific CMOS. However, the three major noise sources are dark noise, readout noise, and shot noise (Reibel et al., 2003).
The dark current is the signal electrons produce when they are excited thermally rather than photoelectrically. As a result, even when no photons strike the camera, a current flows. It is affected by sensor temperature and dark current increases with long exposures. Cooling can help to reduce the dark current. The random fluctuation inherent in this dark current is known as dark noise, which is approximately equal to the square root of the dark current (Seitz, 1997).
Read noise is inherent in the reading process generated during the production of an electronic signal, as electrons are subjected to the conversion, amplification, and analog to digital processing steps that allow the production of an image. The readout noise is caused by the sensor’s design, but the camera’s electronics can also influence it. It is unaffected by the sensor’s temperature and is the primary source of noise at low light levels (Chi et al., 2007).
The statistical noise that photons enter the pixel is known as shot noise. Because most light sources emit photons independently, the observed photon numbers have a Poisson noise distribution even when the light source is stable. The sensor’s temperature does not affect it, but the shot noise increases as the signal incident on the sensor increases. Furthermore, the photodetector’s signal-to-noise performance is constrained by Poisson noise (Seitz, 1997).
Characterizing the camera as a subsystem is essential because it is vital to know the uncertainties of the individual pixels without the influence of the instrument’s optics as a whole. Equally important is the camera calibration, which occurs periodically along with the instrument optics.
On-board spectropolarimeters such as Hinode/Spectro-Polarimeter (SP), calibration is performed periodically to ensure measurement quality. For example, since 2009, SP has been making repeated measurements of dark images of the spacecraft’s eclipse season. Before 2009, data from the beginning of the mission was used before opening the entrance door of the instrument. Likewise, flat-field corrections are obtained from observing the quiet Sun. Vignette and per-pixel gain variation are also analyzed. Raw level0 data is transmitted, and processing takes place on the ground (Lites and Ichimoto, 2013).
Another example is the Polarimetric and Helioseismic Imager (PHI) on board the Solar Orbiter (SO) spacecraft. Here the data for calibration is also done on-board. However, the processing of the data also happens on-board. This is due to the difficulties imposed by the telemetry limitations present in SO orbit (Albert et al., 2018).
The cameras, one of the components that can cause uncertainties and noise in the readings, are in charge of determining the light intensity. Therefore, it plays a crucial role in achieving a polarimeter’s high spatial resolution and sensitivity. This paper presents the calibration process and methodology to determine the operating procedure of the PCPS camera, an Andor Zyla 5.5.
4 Materials and methods
Andor Zyla 5.5 is a scientific commercially available off-the-shelf (COTS) camera with low readout noise (1.2-2.6 RMS) and was used in a ground base spectropolarimeter, the Visible Spectro-Polarimeter of the Daniel K. Inouye Solar Telescope (de Wijn et al., 2022).
For PCPS, Andor Zyla 5.5 air-cooled camera was used. It is a front-illuminated scientific CMOS with 2560 × 2160 active pixels of 6.5 µm × 6.5 µm. With a maximum quantum efficiency of 60% at 600nm, the spectrum of operation is 300–1000 nm. Furthermore, the sensor can operate at approximately 0°C when cooled and up to 30°C ambient. The camera does the readout in two separated halves with a 560 MHz pixel readout rate for the whole sensor. Images are converted from analog to digital at 16-bit resolution. The sCMOS with the Camera Link have a frame rate of 100 fps. Zyla 5.5 provides two shutter operating modes, a rolling shutter and a global shutter. It has a pixel well depth of 30,000 e− and a readout noise of 1.2 e− for the Rolling shutter and 2.4 e− for the Global shutter (Andor, 2020).
Additionally, the camera provides two other sorts of corrections: Spurious Noise Filter (SNF) and Blemish Correction (BC). The first one recognizes erroneous high noise pixels and makes adjustments. The final one reduces hot pixel spots. Understanding how each pixel behaves on its own is the goal of camera characterization. Identifying the optimal camera operating mode for PCPS is also the goal.
This paper reports the characterization method which determines the Shutter mode, cooling mode, Spurious Noise Filter, and Blemish Correction parameters and calibration procedures for the camera in the context of the spectropolarimeter.
4.1 Experimental setup and procedure
Figure 2 shows the setup design for the calibration. The USS-4000C integrating sphere was utilized in this characterization. It has a 14-inch aperture, a 40-inch diameter, and ten internal tungsten filament halogen bulbs that are spaced evenly around the exit door. It ran in a class 10,000 cleanroom at a set temperature. We chose this sphere for its homogeneity. The entire sensor must receive the same amount of light, making it feasible to analyze the pixels.
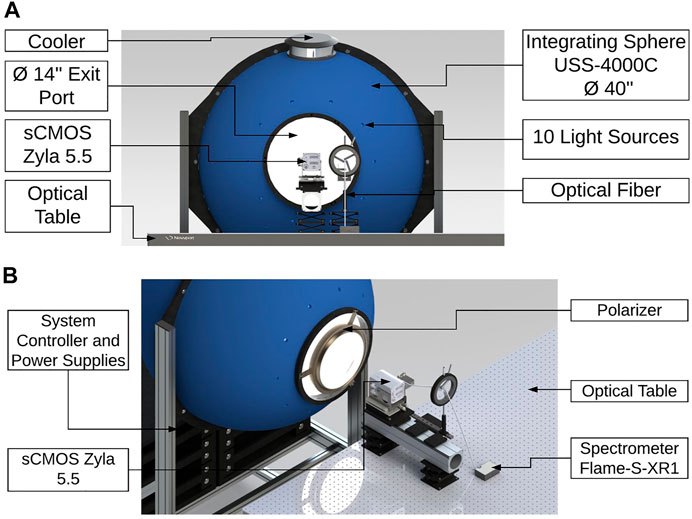
FIGURE 2. Setup design for the PCPS camera calibration. Figure (A) shows the front view of the setup, highlighting the sphere and the camera. Figure (B) shows the 3D view, focusing on the polarizer present in some tests and the Spectrometer Flame S-XR1.
After the alignment of the system, the position for the camera in relationship with the sphere was chosen considering the theoretical uniformity values for a perfectly Lambertian source from Labsphere (2008).
The characterization can be divided into two parts. The first was concerning the camera’s operating mode, analyzing the cooling, the shutter mode, and the filters (Spurious Noise Filter and Blemish Correction) in the pixels. In the second part, parameters such as the linearity, the gain and the polarization effect on the pixel are examined.
In a spectropolarimeter, the light is analyzed in both spectra and polarization. However, the Stokes parameter measured by the device differs from the Stokes parameters that enter the instrument. It happens due to the polarization errors that the optics of the instruments introduced in the Stokes parameters. Fortunately, the Mueller Matrix can describe this induced error. Accordingly, it is essential to know how the camera isolated responds to the polarization of the light. Ideally, there would be no difference in the measured intensity of the light when it has different polarization states.
Three data sets were acquired, POLN, POL90, and POL0, to study the behavior of the pixels concerning polarization. The difference between them is how the light source is polarized. The first data set is without the reference polarizer (POLN); hence, the light is entirely unpolarized. At POL90 and POL0, the linear reference polarizer placed in front of the sphere was set at 90° and 0°, respectively.
Understanding how the camera reads under various conditions is crucial to comprehending each pixel’s behavior. As a result, data were gathered for each set utilizing two separate shutter operations (Rolling and Global mode), two temperature options (ON and OFF), different combinations of SNF and BC (ON and OFF), and with various exposure periods. Analyzing the sensor’s temperature is crucial since the camera’s noise increases with temperature.
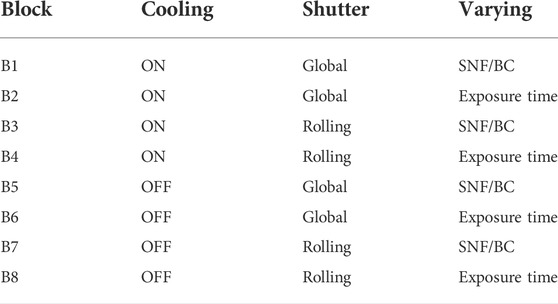
Table 1 demonstrates how the blocks of gathered data were separated for analysis. Each image has a dark taken without a light source, and there are 50 frames in each test. The dark was removed from all image analyses after averaging the 50 frames. The dark analysis is crucial because it ensures that no other light source interferes with data collection. All characterizations in this work were done for a 500 × 500 pixel area in the sensor’s middle.
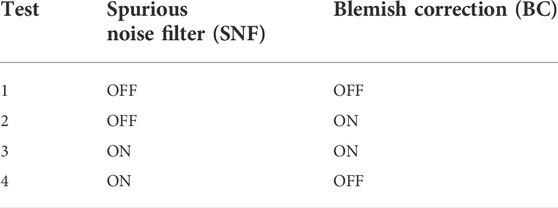
Each odd block (B1, B3, B5, B7) has four tests with various Spurious Noise Filter and Blemish Correction combinations, all of which have the same exposure time, 9 × 10⁻⁶ s. Table 2 shows the combination of SNF and BC. The even blocks (B2, B4, B6, B8), on the other hand, include ten tests with various exposure periods and both filters (SNF and BC) OFF. The difference between the blocks is the combination of Shutter mode (Global or Rolling) and cooling (ON or OFF). The exposure times were the same for the blocks 9 × 10⁻⁶, 5 × 10⁻⁵, 1 × 10⁻⁴, 5 × 10⁻⁴, 1 × 10⁻³, 5 × 10⁻³, 1 × 10⁻², 2 × 10⁻², 3 × 10⁻², and 5 × 10⁻² s. In which 9 × 10⁻⁶ s is the shortest exposure time the camera can operate. From the exposure time of 5 × 10⁻² s, the pixels reached full saturation. Therefore, longer exposure times were avoided due to camera saturation. All data were acquired while the sensor was kept at a constant temperature. The temperature was −0.44°C when the cooling was turned ON. The temperature was 25.83°C when the cooling was turned OFF.
5 Results
5.1 Operating mode analysis: Cooling and shutter influence
Different combinations of shutter and cooling were analyzed to investigate the influence of shutter and temperature on the sensor. Here we present data obtained with non-polarized light (POLN). With the Global Shutter in B2 and B6 and Shutter Rolling in B4 and B8. Cooling ON in B2 and B4 and Cooling OFF in B6 and B8. The various exposure times were averaged, including all pixels, even the saturated ones.
Figure 3 pictures the average intensities for ten different exposure times for the even blocks with POLN, data acquired without the reference polarizer, and its histograms. In Figure 3A, different behaviors in the pixel reading out are apparent with the Global Shutter (B2 and B6), clearly showing the two halves of the sensor. Pixel intensity reached higher values when the cooling was OFF (B6, B8) than ON (B2 and B4). It reveals that the pixels are more uniform when the cooling is ON.
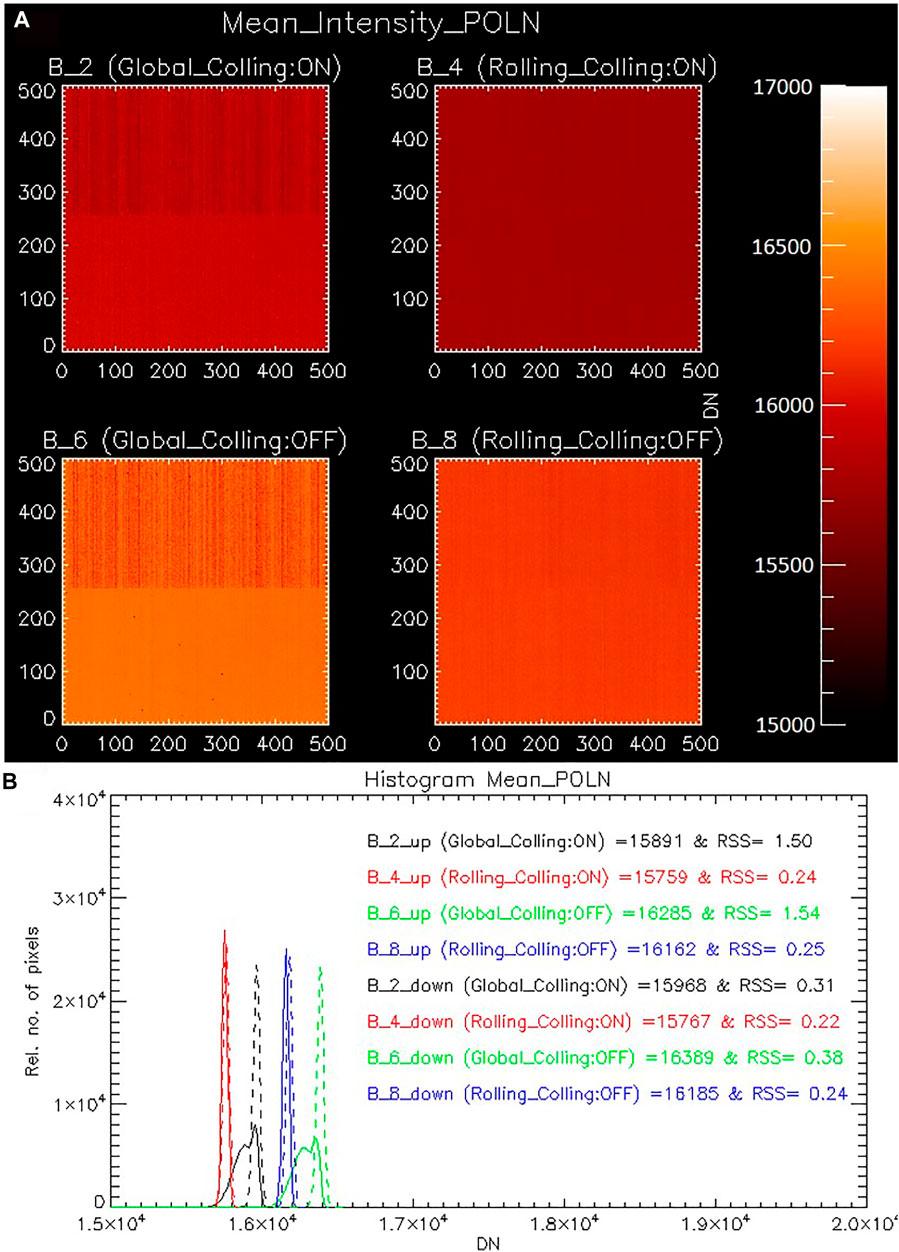
FIGURE 3. Comparison between Shutter types (Global and Rolling) and cooling. Average of ten different exposure times. Data acquired without a reference polarizer (POLN). Blocks 2 and 6 are from Global Shutter and blocks 4 and 8 are from Rolling Shutter. B2 and B4 have the cooling ON, B6 and B8 do not. Panel (A) 2D plots, panel (B) histograms. The data is split between the two halves of the sensor in the histogram. The solid line represents the sensor’s top (up), and the dashed line represents its bottom (down).
One can notice that in the upper part of the sensor, the pixels have a non-uniform behavior. Pixels in the same column have similar behavior but vary in intensity from column to column in Shutter Global (B2 and B6). This column error is due to the CMOS camera reading mode and occurs throughout the sensor, as shown in the 2D gain map in Section 5.4. However, this readout error is more noticeable in the upper region of the sensor for Global Shutter when the pixels are close to saturation.
Figure 3B shows the histogram of the data, but these are divided between the two halves of the sensor. The solid lines show data from the top, while the dashed lines show data from the bottom of the sensor. The histogram curves for Rolling (B4 and B8) have Gaussian behavior, as expected. However, only the bottom has this behavior for Global (B2 and B6). This is due to a readout error present at the top of the sensor during the Global Shutter process. When many photons arrive at the sensor, causing the sensor to reach saturation, the top of the sensor does not reach saturation like the pixels on the bottom. However, this problem does not occur in Rolling Shutter.
The values in Figure 3B represent the mean value for each curve. That is, it represents the average value of all exposure times and all pixels. The error associated with this measure takes into account:
• The average error of the 50 frames of each pixel;
• The average error of all pixels in a single exposure time;
• The error associated with different exposure times.
As a result, the error was calculated for each exposure time. Then, a root sum square (RSS) calculation was performed to determine the error associated with the average of the different exposure times. The difference between the pixels in the analyzed area is the most relevant source of errors at all exposure times. The error associated with the 50 frames for exposure time 9 × 10⁻⁶ and 5 × 10⁻⁵ s is proportionally relevant to the RSS calculation. However, the error associated with pixel difference is considerably more significant for longer exposure times.
As expected, the error increases as the exposure time increases. POLN data, obtained without the reference polarizer, reveals a significant difference in RSS between the top and bottom of the sensor for B2 and B6 (Global Shutter). This is due to the non-uniform behavior at the sensor’s top during high intensities. This non-uniform reading behavior between is not visible when using Rolling Shutter because all pixels saturate evenly. As a result, the difference in intensity value between pixels is minimal (RSS ∼ 0.01).
It is essential to state that this non-uniform reading behavior appears only near saturation. All data showed a normal distribution for low exposure times regardless of Shutter type and cooling type. The reasons contributing to this distribution are pixel-to-pixel gain variation and also shot noise.
5.2 Operating mode analysis: Impact of spurious noise filter and blemish correction on image acquisition
As previously mentioned, the SNF and BC correction systems are built into the camera and can be turned on or off when acquiring images. Images were acquired with various combinations to study their influence on pixels. The data obtained without the polarizer (POLN) for Block 5 (Global Shutter, Cooling OFF) and Block 7 are presented here (Rolling Shutter, Cooling OFF).
Each block has four tests with different Spurious Noise Filter and Blemish Correction combinations, as shown in Table 2. Fifty frames were acquired for each test, all with the same exposure time (9 × 10⁻⁶ s). The shortest possible exposure time was chosen to investigate the influence of SNF and BC when readout noise is significant.
Figure 4A shows the 2D map of the influence of SNF and BC on pixels for B5 (Global Shutter, Cooling OFF). Figure 4B displays data from B7 (Rolling Shutter, Cooling OFF). The images were obtained by subtracting the image where the Spurious Noise Filter and Blemish Correction are both disabled (Test_1 (SNF: OFF and BC: OFF)) from all other tests (SNF and/or BC ON). The scale intensity has been reduced to show that Spurious Noise Filter and Blemish Correction influence the vast majority of the pixels.
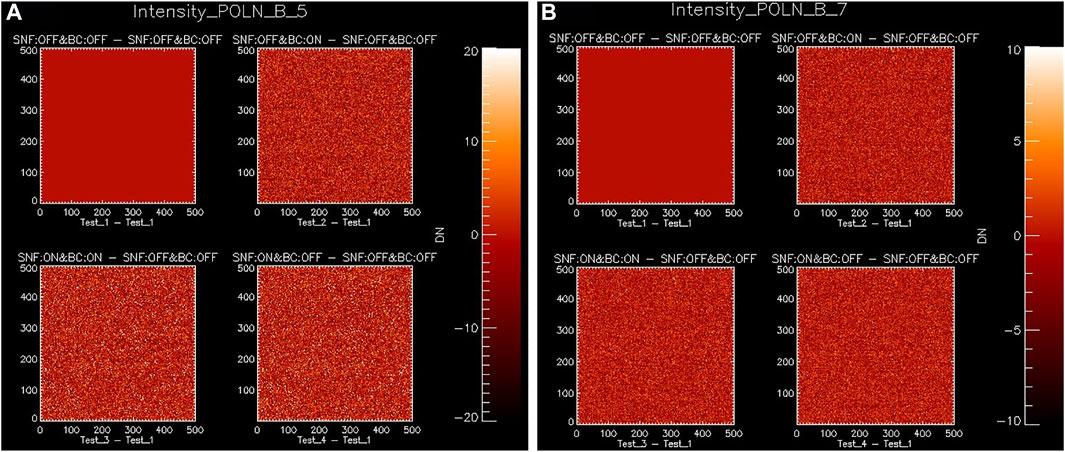
FIGURE 4. 2D map of the influence of SNF and BC on pixels. The images of the data obtained with the SNF and/or BC ON was subtracted from the image obtained with the SNF and BC OFF. (A) represents the analysis for Block 5 (Global and Cooling OFF) and (B) for Block 7 (Rolling and Cooling OFF). All images have the same exposure time (9 × 10⁻⁶ s).
The first panel contains Test_1—Test_1. Because it is the same image, the result is null, but it serves as a baseline for comparison with the other panels. Panel 2 shows the effects of Blemish Correction. The image was acquired after making Test_2 (SNF: OFF and BC: ON) minus Test_1 (SNF: OFF and BC: OFF). The third panel depicts the combined effects of Spurious Noise Filter and Blemish Correction. The image was captured after subtracting Test_1 (SNF: OFF and BC: OFF) from Test_3 (SNF: ON and BC: ON). Panel 4 only displays the effects of Spurious Noise Filter. The image was obtained after subtracting Test_1 (SNF: OFF and BC: OFF) from Test_4 (SNF: ON and BC: OFF).
SNF and/or BC influence 99.90% of the pixels in B5 (Global Shutter, Cooling OFF). In B7 (Rolling Shutter, Cooling OFF), 99.80% of the pixels have a non-zero value. However, the percentage of pixels with considerably changed intensity due to Spurious Noise Filter and BC Blemish Correction is low. For B5, pixels with an intensity greater than 10 or less than −10 are 7.84% of the total for Test_4 (SNF: ON and BC: OFF)—Test_1 (SNF: OFF and BC: OFF). SNF and BC ON both changed 7.62% of the total pixels (Test 3 (SNF: ON and BC: ON)—Test 1). While BC alone modified 4.73% of the pixels (Test 2 (SNF: OFF and BC: ON)—Test 1). For B7, pixels with an intensity greater than 3.5 or less than −3.5 are 9.37% of the total for Spurious Noise Filter only [Test_4 (SNF: ON and BC: OFF)—Test_1 (SNF: OFF and BC: OFF)]. SNF and BC ON both changed 9.42% of the total pixels (Test 3 (SNF: ON and BC: ON)—Test 1). While BC alone modified 8.97% of the pixels (Test 2 (SNF: OFF and BC: ON)—Test 1).
For these conditions, one can see that Spurious Noise Filter has a more significant influence on pixels than Blemish Correction. The short exposure time contributes to this, as does the low intensity measured. Even though SNF and BC have influenced many pixels, the change does not affect the average behavior of the pixels, as shown in Figure 5.
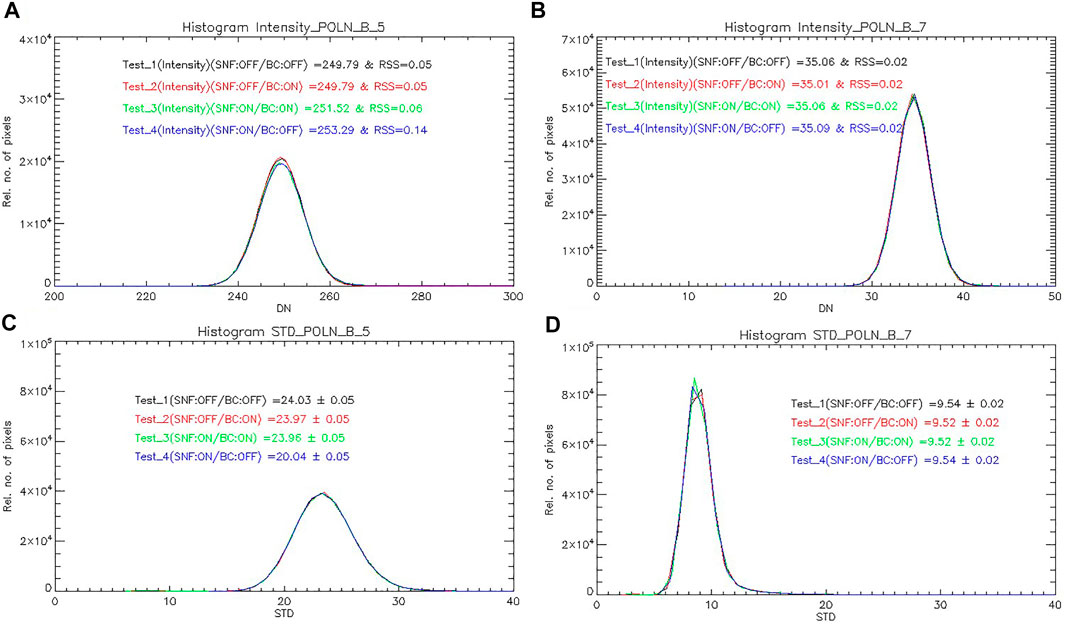
FIGURE 5. Analysis of the influence of the Spurious Noise Filter and Blemish Correction on the sensor. Panel (A) is the histogram of the mean intensity of B5 (Global Shutter, Cooling OFF) for POLN. Likewise, (B) is for B7 (Rolling Shutter, Cooling OFF). Panel (C,D) are histograms for the standard deviation (STD) of B5 and B7, respectively. Test_1 stands for filter OFF, correction OFF. Test_2 represents filter OFF, correction ON. Test_3 expresses filter ON, correction ON. Test_4 means filter ON, correction OFF.
Figures 5A,B present the histogram for the mean intensity of the single tests for B5 (Global Shutter, Cooling OFF) and B7 (Rolling Shutter, Cooling OFF), respectively. Figures 5C,D are histograms of the standard deviation of the single tests.
In Figures 5A,B, one can see that the behavior of the curves is significantly similar. However, Test_3 (SNF: ON and BC: ON) and Test_4 (SNF: ON and BC: OFF) slightly presents a higher average. In contrast to Figures 5A,B, the histogram shown in Figures 5C,D does not vary in intensity between the different types of Spurious Noise Filter and Blemish Correction combinations available. Moreover, B7 (Rolling) analysis has an average intensity lower than set B5 (Global).
The error associated with Figure 5 panels A and B were calculated using the average of the 50 frames for each pixel and the error of the average pixel intensity for each test. In block 7 (Rolling Shutter, Cooling OFF), the error between the different combinations is very close, and the predominant source of errors is the difference between the 50 frames of each pixel. The same occurs for B5 (Global Shutter, Cooling OFF), except for Test_4 (SNF: ON and BC: OFF), where the error between the pixels of the analyzed area is more relevant. In panels, C and D of Figure 5, only the source of errors in standard deviation calculation was considered.
We analyze the data with cooling OFF, as it is expected that they will have higher noise. When the temperature rises, the effect of dark noise increases and, consequently, that the influence of the SNF and BC will be more significant. A standard deviation analysis was performed to investigate the influence of Spurious Noise Filter and Blemish Correction.
Figure 4 has a low percentage of pixels that vary more than the standard deviation range of Figure 5. As a result, SNF and BC have no significant impact on pixels in this data set.
5.3 Camera characterization: Polarization
Figure 6 presents a similar analysis as Figure 3. However, the data set was acquired with the reference polarizer at 0° (POL0) for (A) and (C) and 90° (POL0) for (B) and (D). As shown in Figures 3A, 6 B2 and B6 (Global) show the sensor division due to reading the global shutter. Nevertheless, one can also notice the division into B4; Rolling Shutter and cooling is ON. However, the division appears subtly for B8 (Rolling Shutter and cooling OFF). The fact that it appears more prominently in B4 than in B8 may be due to the heat load created, implying that there is a dependency on the speed of the readout pixel highlighting the central division (Andor Technology, 2014).
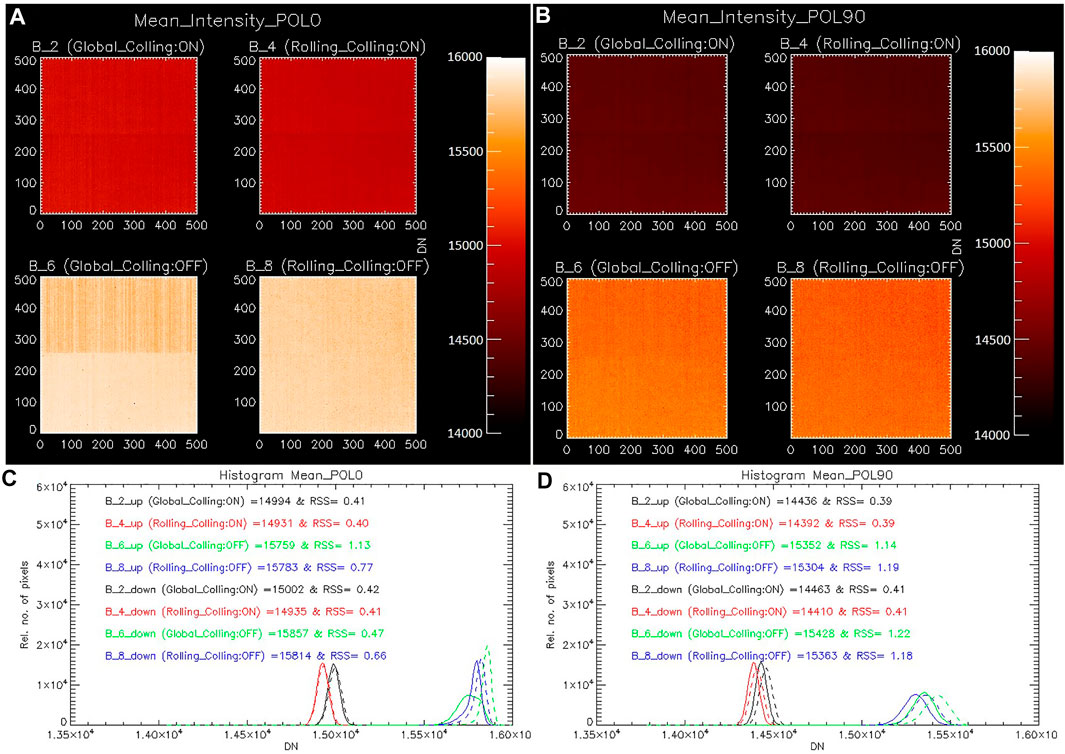
FIGURE 6. Comparison between Shutter types (Global and Rolling) and cooling. Average of ten different exposure times. Data acquired with the reference polarizer. Blocks 2 and 6 are from Global Shutter and blocks 4 and 8 are from Rolling Shutter. B2 and B4 have the cooling ON, B6 and B8 do not. Panel (A,B) are 2D plots for POL0 and POL90, respectively. Panel (C,D) are histograms of the mean intensity for POL0 and POL90.
Figure 6’s histograms show the pixels’ behavior divided into the sensor’s two parts. The solid line represents the sensor’s top, while the dashed line represents its bottom. Interestingly, just like the POLN data (Figure 3B), the POL0 data (Figure 6C) shows different pixel behavior for the upper and lower parts of the sensor for B6 (Global Cooling OFF). However, this is not the case for POL90 (Figure 6D). This is due to the sensor reading problem when the pixels are close to saturation.
In addition to having a lower average than POL0 concerning all blocks, POL90 also presents a more noticeable dispersion of the data concerning Blocks 6 and 8 (both cooling OFF, Shutter Global, and Rolling, respectively). This represents that there is an influence of polarization on the behavior of the pixels for both shutter modes when the cooling is OFF. This is due to a film that present at the camera. The Zyla 5.5 sCMOS has a single input window with dual anti-reflection (AR) coating to ensure maximum photon transfer rate1. This film may be one reason that influences polarization, which is more evident at higher operating temperatures.
The errors associated with the means (RSS) depicted in Figure 6 were calculated in the same manner as those depicted in Figure 3. Unlike POLN, data acquired with polarized light has a more significant error when cooling is OFF. In POL0, the error associated with the sensor reading appears only in B6. This occurs because only with the cooling OFF does the sensor reach high-intensity values in the last exposure time. When the cooling is turned off, both the upper and lower parts of the POL90 sensor have a high measurement error. (B6 and B8). This high error, as in POLN, is related to the last exposure time (5 × 10⁻² s). Without this exposure time, the associated measurement error would range between 0.26–0.29 for all POL0 and POL90 blocks.
The film, unlike the Spurious Noise Filter and Spot Correction, cannot be removed or turned off in order to acquire images. However, the Mueller Matrix takes this polarization effect on pixels into account when calculating the spectropolarimeter’s overall uncertainty.
5.4 Camera characterization: Gain
The process to acquire an image starts with photons reaching the camera sensor and arriving at the active pixels. Depending on the sensor’s quantum efficiency (QE), these photons are converted into photoelectrons at the pixel. Subsequently, photoelectrons are converted into voltage. The last is then converted into digital signals (grayscale). The camera’s gain is the value that describes the number of photoelectrons converted into digital signals. Therefore, cameras with lower gain are more sensitive to changes in the signal (Li et al., 2016; Diekmann et al., 2017).
The Flat-field correction is the main objective of gain analysis. It ensures that each pixel responds uniformly to a particular amount of light. Here, the gain was calculated by the Mean-Variance Analysis. Thus, the slope of the linear regression line of the mean intensity and the variance describes the gain. For this analysis, pixels with an intensity greater than 5000 DN (digital number) were disregarded as they were considered saturated.
Figure 7 shows the 2D gain map for data acquired without the reference polarizer (POLN) (A) and with data acquired with the reference polarizer at 0° (POL0) (B). Here, the gain of each pixel was calculated individually. The data with Global Shutter is Block 2 and Block 6, while Block 4 and Block 8 are from Rolling Shutter. B2 and B4 have the cooling ON, while B6 and B8 cooling is OFF.
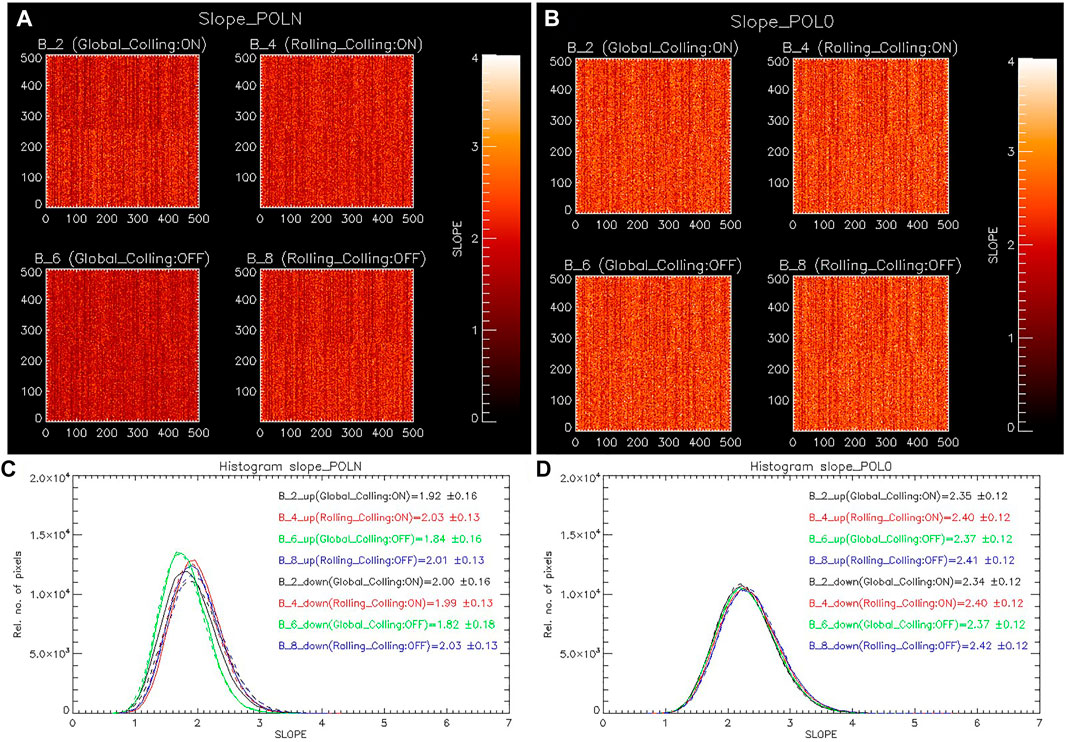
FIGURE 7. 2D plot of the gain per pixel for each block of the (A) POLN (without the reference polarizer) and (B) POL0 (with the reference polarizer at 90°). Blocks 2 and 6 are from Global Shutter and blocks 4 and 8 are from Rolling Shutter. B2 and B4 have the cooling ON, while B6 and B8 have the cooling OFF. Panel (C,D) show the POLN and POL0 data histograms, respectively. The data here is split between the two halves of the sensor. The solid line represents the top (up) of the sensor, and the dashed line the bottom (down).
Figure 7’s two panels show that pixels suffer from the column effect in all blocks. The pixels in the same column behave similarly, but the gain varies from column to column. The CMOS reading mode is to blame for this. Each pixel in sCMOS has its own amplifier, as previously stated. The pixel voltages are then transferred to the column bus and converted from analog to digital at the converters in each column. As a result, there is more variability within individual pixels and within individual columns.
The separation of the sensor into two parts is also visible as a result of the behavior of the columns because each sensor column has two column buses, one for the top of the sensor and one for the bottom.
Data acquired with the polarizer at 0° (POL0) has a higher average gain than data acquired without the polarizer (POLN). The difference in camera gain between data acquired with the polarizer (POL0) and data acquired without the polarizer (POLN) is not caused by the polarization. It is more likely that this asymmetry results from systematic errors in the measurements. Furthermore, for both data sets, the blocks acquired using Rolling Shutter (B4 and B8) have a higher gain than the Global Shutter (B2 and B6).
The gain behavior seems to be more consistent in POL0 than in POLN. For POLN, B2 and B8 exhibit more variation between the sensor halves. Another intriguing feature is how B6 behaves more differently than the other blocks, a condition that does not exist in POL0.
The error in the figure refers to the calculation of the slope. For POL0, regardless of shutter mode or cooling, this error is constant for both parts of the sensor. However, there is some variation between the blocks in POLN. They are being more significant for the Global mode. Nevertheless, there is a slight variation between the sensor’s segments.
The gain behavior for the POL90 data set (data acquired with the reference polarizer at 90°) was also analyzed, and its behavior is very similar to POL0.
5.5 Camera characterization: Non-linearity
Here are the data acquired without polarization in the even blocks with different exposure times. Figure 8 shows the sensor linearity for the even blocks of POLN. Figure 8A is the linearity of Global Shutter with cooling ON (Block 2). Figure 8B is Rolling Shutter with cooling ON (Block 4). Blocks 6 and 8 (Global Shutter and Rolling Shutter with cooling OFF) are represented in panels (C) and (D), respectively. The x-axis represents exposure time in seconds, while the y-axis expresses intensity in DN.
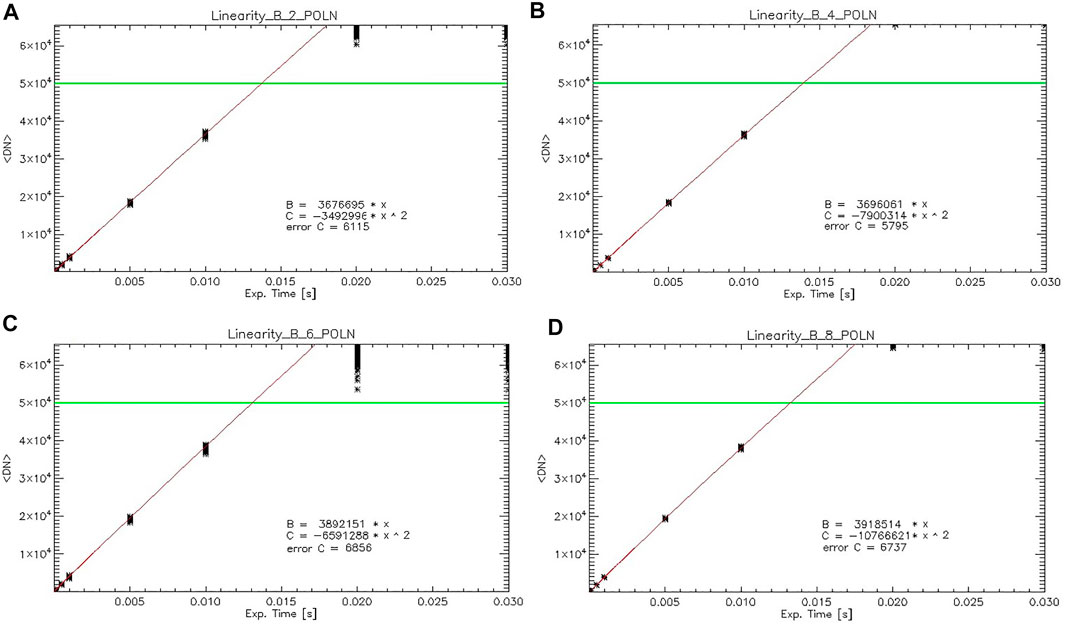
FIGURE 8. Linearity for POLN blocks 2 (A) and 6 (C) are from Global Shutter, and blocks 4 (B) and 8 (D) are from Rolling Shutter. B2 and B4 have the cooling ON, B6 and B8 do not. The red line represents the polynomial adjustment of least squares between the exposure time and the intensity. The green line defines the intensity threshold. The coefficients present in the plot represent the coefficients of the line y = A + Bx + Cx2.
A least-squares polynomial fit was calculated for all pixels with intensities below 5000 DN for this study. Above the threshold, the pixel value approaches saturation, so they need to be ignored. The red line represents the least-squares polynomial fit, and the green line represents the intensity threshold.
The graph’s parameters were fitted with least-squares polynomials. B is the term times x, and C is the times x2. The inaccuracy in the calculation of C for all blocks is under 0.2% for Global and 0.08% for Rolling.
In the Figure 8, each asterisk illustrates a pixel. As the exposure time increases, the pixel intensity variance also increases. As expected, this effect is most visible on the Global Shutter (B2 and B6) and for cooling off (B6 and B8).
The camera non-linearity of POLN data was estimated as a comparison between the intensity obtained by the line equation and the measured value. The non-linearity is about 2–3% for all blocks, which is substantial. The ideal for spectropolarimeters is that sensors reach a polarimetric sensitivity of 1 × 10⁻⁴ of the intensity (Keller, 1996). Consequently, the non-linearity must be a maximum of 1% to achieve this polarimetric precision.
6 Conclusion
The camera utilized in the GSST mission’s spectropolarimeter’s proof-of-concept is described in this study.
As expected, the sensor presents a higher noise when the cooling system is OFF, since dark noise increases as the temperature rises. The same occurs when the images are acquired in the Global mode. Global mode produces more read noise than Rolling Shutter. With the analysis, it was possible to detect the division of the sensor into two parts. The sensor divides the upper and lower parts between shutters and cooling modes. This division is due to read out, and it is more intense for Global Shutter (B2 and B6).
Despite the Spurious Noise Filter (SNF) and Blemish Correction (BC) changing the value of most pixels, the value of a few pixels has changed significantly. The vast majority of differences fall within the standard deviation range. However, because the camera’s SNF and BC change the pixel intensity value, they are typically not used when operating instruments. Modifications for hot, dead or high noise pixels are applied as needed during data processing.
The difference between the data acquired with (POL90 and POL0) or without (POLN) the reference polarizer is clear regarding the polarization effect. As expected, images captured without the polarizer have greater intensity than data captured with the reference polarizer. However, the difference in intensity between POL90 and POL0 was not foreseen. Since the light source is not polarized, the transmittance of the polarizer should be the same despite the angle of the reference polarizer. The possible reason is that the pixel may have a polarization tendency. This reinforces the importance of estimating the Mueller Matrix for the instrument. It would be interesting to collect more data with different positions of the reference polarizer to understand pixel polarization’s influence.
Despite the high non-linearity, the camera efficiently acquired the data for the proof-of-concept. However, for the next phase of the GSST Mission, a camera with lower non-linearity will be required.
The analysis makes it evident how crucial it is to understand how each camera pixel behaves. For PCPS, cooling will be turned ON during data acquisition, and the Spurious Noise Filter and Blemish Correction will always be turned off. The Rolling shutter was ultimately selected because it offers lower readout noise despite the potential for spatial distortion. For this first phase of the project, the sCMOS Zyla 5.5 successfully acquired images of the Stokes parameters in an agile manner.
Data availability statement
The data presented in this article are not currently available but may be obtained from the authors upon request.
Author contributions
Conceptualization, AB, FC, and LV; validation, FC and LV; formal analysis, AB and FC; investigation, AB and FC; resources, LV; data curation, AB and FC; writing—original draft preparation, AB; writing—review and editing, FC and LV; visualization, FC and LV. All authors have read and agreed to the published version of the manuscript.
Funding
AB thanks the financial support from FAPESP (2019/13181-0 and 2019/25255-8), Capes (88887.607304/2021-00) and CNPq (141449/2021-7). FC: FAPESP grant No. 2021/13309-6 and PCI/CNPq for the grant No. 300274/2022-0. LV thanks CNPq (grant number 308355/2020-2) and the Brazilian Space Agency (grant number TED AEB 2020—20VB—PO 0009) and the Brazilian Ministry of Science, Technology and Innovations (MCTI).
Acknowledgments
The authors are grateful for the technical assistance and development of the proof of concept provided by Bráulio Fonseca Carneiro de Albuquerque, Alisson Dal Lago, Marlos Rockenbach da Silva, Wellington Rodrigues Guimares, Marcio Vital de Arruda and the GSST working group, as well as the drawings provided by Willian Luis Dias da Silva.
Conflict of interest
The authors declare that the research was conducted in the absence of any commercial or financial relationships that could be construed as a potential conflict of interest.
Publisher’s note
All claims expressed in this article are solely those of the authors and do not necessarily represent those of their affiliated organizations, or those of the publisher, the editors and the reviewers. Any product that may be evaluated in this article, or claim that may be made by its manufacturer, is not guaranteed or endorsed by the publisher.
Footnotes
1https://andor.oxinst.com/products/scmos-camera-series/zyla-5-5-scmos.
References
Albert, K., Lange, T., Kolleck, M., Fiethe, B., Woch, J., Schou, J., et al. (2018). “Autonomous on-board data processing and instrument calibration software for the SO/PHI,” in SPIE-Intl Soc Optical Eng, 26. doi:10.1117/12.2311718
Andor Technology (2014). Zyla sCMOS hardware guide. Available at: https://andor.oxinst.com/downloads/uploads/Zyla_hardware_user_guide.pdf.
Bothmer, V., and Daglis, I. A. (2007). Space weather: Physics and effects. 1st ed. Berlin: Springer-Verlag Berlin Heidelberg.
Carlesso, F., Vieira, L. E. A., Berni, L. A., and Savonov, G. da S. (2021). Design, implementation and characterization of cavity for absolute radiometer. Front. Phys. 9, 52. doi:10.3389/fphy.2021.598490
Carlesso, F., Vieira, L. E. A., Berni, L. A., Savonov, G. S., Remesal Oliva, A., Finsterle, W., et al. (2020). Physical and optical properties of ultra-black nickel–phosphorus for a total solar irradiance measurement. Astrophys. J. Suppl. Ser. 248, 4. doi:10.3847/1538-4365/ab7af8
Carlesso, F., Rodríguez Gómez, J. M., Barbosa, A. R., Antunes Vieira, L. E., and Dal Lago, A. (2022). Solar irradiance variability monitor for the galileo solar space telescope mission: Concept and challenges. Front. Phys. 10. doi:10.3389/fphy.2022.869738
Chi, Y. M., Mallik, U., Clapp, M. A., Choi, E., Cauwenberghs, G., and Etienne-Cummings, R. (2007). CMOS camera with in-pixel temporal change detection and ADC. IEEE J. Solid-State Circuits 42, 2187–2196. doi:10.1109/JSSC.2007.905295
Chicrala, A., Dallaqua, R. S., Vieira, L. E. A., Dal Lago, A., Gómez, J. M. R., Palacios, J., et al. (2016). “Evolution of the Active Region NOAA 12443 based on magnetic field extrapolations: Preliminary results,” in Proceedings of the international astronomical union (Cambridge University Press), 127–129. doi:10.1017/S1743921317003817
Choudhuri, A. R. (2007). An elementary introduction to solar dynamo theory. AIP Conf. Proc. 919, 49–73. doi:10.1063/1.2756783
Dal Lago, A., Braga, C. R., De Mendonca, R. R. S., Rockenbach, M., Echer, E., Schuch, N. J., et al. (2017). Effects of ICMEs on high energetic particles as observed by the global muon detector network (GMDN). Proc. Int. Astron. Union 13, 69–74. doi:10.1017/S1743921318000066
De Pontieu, B., Title, A. M., Lemen, J. R., Kushner, G. D., Akin, D. J., Allard, B., et al. (2014). The interface region imaging spectrograph (IRIS). Sol. Phys. 289, 2733–2779. doi:10.1007/s11207-014-0485-y
de Wijn, A. G., Casini, R., Carlile, A., Lecinski, A. R., Sewell, S., Zmarzly, P., et al. (2022). The visible spectro-polarimeter of the Daniel K. Inouye solar telescope. Sol. Phys. 297, 22. doi:10.1007/s11207-022-01954-1
del Toro Iniesta, J. C. (2003). Introduction to spectropolarimetry. 1st ed. Cambridge: Cambridge University Press. doi:10.1017/CBO9780511536250
Diekmann, R., Till, K., Müller, M., Simonis, M., Schüttpelz, M., and Huser, T. (2017). Characterization of an industry-grade CMOS camera well suited for single molecule localization microscopy - high performance super-resolution at low cost. Sci. Rep. 7, 14425. doi:10.1038/s41598-017-14762-6
Fletcher, L., Dennis, B. R., Hudson, H. S., Krucker, S., Phillips, K., Veronig, A., et al. (2011). An observational overview of solar flares. Space Sci. Rev. 159, 19–106. doi:10.1007/s11214-010-9701-8
Gandorfer, A., Grauf, B., Barthol, P., Riethmüller, T. L., Solanki, S. K., Chares, B., et al. (2010). The filter imager SuFI and the image stabilization and light distribution system ISLiD of the sunrise balloon-borne observatory: Instrument description. Sol. Phys. 268, 35–55. doi:10.1007/s11207-010-9636-y
IC OPTICAL SYSTEMS (2022). CS100 controller and ET series II servo-stabilized interferometer system. Available at: https://www.astro.umd.edu/∼veilleux/mmtf/guide/docs/cs100guide.pdf (Accessed September 5, 2022).34
Iglesias, F. A., and Feller, A. (2019). Instrumentation for solar spectropolarimetry: State of the art and prospects. Opt. Eng. 58, 1. doi:10.1117/1.oe.58.8.082417
Kano, R., Sakao, T., Hara, H., Tsuneta, S., Matsuzaki, K., Kumagai, K., et al. (2008). The hinode X-ray Telescope (XRT): Camera design, performance and operations. Sol. Phys. 249, 263–279. doi:10.1007/s11207-007-9058-7
Keller, C. U. (1996). Recent progress in imaging polarimetry. Sol. Phys. 164, 243–252. doi:10.1007/BF00146637
Labsphere (2008). Technical guide - integrating sphere uniform light source applications. Available at: https://www.labsphere.com/wp-content/uploads/2021/09/Integrating-Sphere-Uniform-Source-Applications.pdf.
Li, L., Li, M., Zhang, Z., and Huang, Z. L. (2016). Assessing low-light cameras with photon transfer curve method. J. Innov. Opt. Health Sci. 9, 1630008. doi:10.1142/S1793545816300081
Lites, B. W., and Ichimoto, K. (2013). The SP_PREP data preparation package for the hinode spectro-polarimeter. Sol. Phys. 283, 601–629. doi:10.1007/s11207-012-0205-4
Meseguer, J. J. P. (2013). Design and optimization of a space camera with application to the PHI solar magnetograph.
Muralikrishna, A., Dos Santos, R. D. C., and Vieira, L. E. A. (2022). Exploring possibilities for solar irradiance prediction from solar photosphere images using recurrent neural networks. J. Space Weather Space Clim. 12, 19–23. doi:10.1051/swsc/2022015
Reibel, Y., Jung, M., Bouhifd, M., Cunin, B., and Draman, C. (2003). CCD or CMOS camera noise characterisation. Eur. Phys. J. Ap. 21, 75–80. doi:10.1051/epjap:2002103
Rodríguez Gómez, J. M., Palacios, J., Vieira, L. E. A., and Lago, A. D. (2019). The plasma β evolution through the solar corona during solar cycles 23 and 24. Astrophys. J. 884, 88. doi:10.3847/1538-4357/ab40af
Schou, J., Scherrer, P. H., Wachter, R., Couvidat, S., Bush, R. I., Rabello-Soares, M. C., et al. (2012). The helioseismic and magnetic imager instrument design and calibration. Sol. Phys. 275, 1–22. doi:10.1007/978-1-4614-3673-7_11
Seitz, P. (1997). “Image sensing with maximum sensitivity using industrial CMOS technology,” in Micro-optical technologies for measurement, sensors, and microsystems II and optical fiber sensor technologies and applications (Munich: SPIE), 22–33.
Solanki, S. K., Del Toro Iniesta, J. C., Woch, J., Gandorfer, A., Hirzberger, J., Alvarez-Herrero, A., et al. (2020). The polarimetric and helioseismic imager on solar orbiter. Astron. Astrophys. 642, A11. doi:10.1051/0004-6361/201935325
Vieira, L. E. A., De Gonzalez, A. L. C., Lago, A. D., Wrasse, C., Echer, E., Guarnieri, F. L., et al. (2015). “Preliminary design of the INPE’s solar vector magnetograph,” in Proceedings of the international astronomical union (Cambridge University Press), 195–199. doi:10.1017/S1743921315004767
Vieira, L. E. A., Kopp, G., Dudok De Wit, T., da Silva, L. A., Carlesso, F., Barbosa, A., et al. (2022). Variability of the Sun’s luminosity places constraints on the thermal equilibrium of the convection zone. Astrophys. J. Suppl. Ser. 260, 38. doi:10.3847/1538-4365/ac626d
Vieira, L. E. A., Lago, A., Rockenbach, M., Guarnieri, F. L., Da Silva, L. A., Carlesso, F., et al. (2019). “Status of the galileo solar space telescope mission(GSST) proposal,” in AGU Fall Meeting Abstracts, SH13C-3447.
Vieira, L. E. (2014). Brazilian experimental solar telescope - galileo solar space telescope. São José dos Campos.
Keywords: camera characterization, image sensor, CMOS, GSST, spectropolarimetry
Citation: Rodrigues Barbosa A, Carlesso F and Vieira LEA (2022) Development of a proof-of-concept spectropolarimeter in the framework of the GSST mission: Characterization and performance analysis of a sCMOS image sensor. Front. Astron. Space Sci. 9:995492. doi: 10.3389/fspas.2022.995492
Received: 15 July 2022; Accepted: 07 October 2022;
Published: 20 October 2022.
Edited by:
Robertus Erdelyi, The University of Sheffield, United KingdomReviewed by:
Mihalis Mathioudakis, Queen’s University Belfast, United KingdomTimothy Butterley, Durham University, United Kingdom
Copyright © 2022 Rodrigues Barbosa, Carlesso and Vieira. This is an open-access article distributed under the terms of the Creative Commons Attribution License (CC BY). The use, distribution or reproduction in other forums is permitted, provided the original author(s) and the copyright owner(s) are credited and that the original publication in this journal is cited, in accordance with accepted academic practice. No use, distribution or reproduction is permitted which does not comply with these terms.
*Correspondence: Adriany Rodrigues Barbosa, YWRyaWFueS5iYXJib3NhQGlucGUuYnI=
 Adriany Rodrigues Barbosa
 Franciele Carlesso
 Luis Eduardo Antunes Vieira