 Xinkai Bian
 Chaowei Jiang
 Xueshang Feng
94% of researchers rate our articles as excellent or good
Learn more about the work of our research integrity team to safeguard the quality of each article we publish.
Find out more
ORIGINAL RESEARCH article
Front. Astron. Space Sci., 03 October 2022
Sec. Stellar and Solar Physics
Volume 9 - 2022 | https://doi.org/10.3389/fspas.2022.982108
This article is part of the Research TopicComprehensive Understanding of Solar Eruptions by Combining State-of-the-Art Observations and ModellingView all 9 articles
It is well-known that major solar eruptions are often produced by active regions with continual photospheric shearing and converging motions. Here, through high-accuracy magnetohydrodynamics simulation, we show how solar eruption is initiated in a single bipolar configuration as driven by first shearing and then converging motions at the bottom surface. Different from many previous simulations, we applied the converging motion without magnetic diffusion; thus, it only increases the magnetic gradient across the polarity inversion line but without magnetic flux cancellation. The converging motion at the footpoints of the sheared arcade creates a current sheet in a quasi-static way, and the eruption is triggered by magnetic reconnection of the current sheet, which supports the same scenario as shown in our previous simulation with only shearing motion. With the converging motion, the current sheet is formed at a lower height and has a higher current density than with shearing motion alone, which makes reconnection more effective and eruption stronger. Moreover, the converging motion renders a fast decay rate of the overlying field with height and is, thus, favorable for an eruption. This demonstrates that the converging flow is more efficient to create the current sheet and more favorable for eruption than by solely the shearing flow.
Coronal mass ejections (CMEs) are the most spectacular eruptions on the Sun. They represent an explosive release of free magnetic energy stored in the coronal magnetic field. Due to the line-tied effect of the photosphere, the coronal magnetic field is continuously, but slowly, dragged at its feet by photospheric surface motions. Usually, these motions are organized on a large scale, such as shearing along the polarity inversion line (PIL), converging toward the PIL, rotation of the sunspot, and dispersion of the magnetic flux (Chintzoglou et al., 2019; Brown et al., 2003; Min and Chae, 2009; Vemareddy et al., 2012; Vemareddy, 2017; van Driel-Gesztelyi et al., 2003; Lamb et al., 2013). With these motions (one type of them or their superposition), the coronal magnetic configuration is driven to evolve continually away from the potential field state until a critical point at which no more stable equilibrium can be maintained and an eruption is triggered. Before the onset of the eruption, the Lorentz force dominates and self-equilibrates in the coronal system, that is, the downward magnetic tension force of the overlying, mostly unsheared flux cancels out the outward magnetic pressure force of the low-lying, strongly stressed flux. With initiation of the eruption, the force balance in the coronal system is catastrophically disrupted, and the free magnetic energy is rapidly converted into heating (i.e., flare) and acceleration (i.e., CME) of the plasma.
It remains an open question how solar eruptions are initiated, and many theories have been proposed (Forbes et al., 2006; Shibata and Magara, 2011; Chen, 2011; Schmieder et al., 2013; Aulanier, 2014; Janvier et al., 2015), which generally are classified into two categories: the first based on ideal magnetohydrodynamics (MHD) instabilities and the other on the resistive process, i.e., magnetic reconnection.
But, for eruptions initiated from in most common bipolar configurations on the Sun, most models resort to ideal MHD instabilities that require the pre-existence of a magnetic flux rope (MFR) in the corona before eruption. For example, the kink instability and torus instability of the MFR would initiate an eruption (Kliem and Török, 2006; Török and Kliem, 2005; Fan and Gibson, 2007; Aulanier et al., 2010; Amari et al., 2018). In the MHD simulations of these models, there needs to be a key phase to transform the shear magnetic arcade to an MFR before the onset of the eruption, such as magnetic cancellation, tether-cutting reconnection, and opposite flux emerging (Amari et al., 2000, 2003a,b; Aulanier et al., 2010; Zuccarello et al., 2015; Kusano et al., 2012).
Recently, through an ultra-high-resolution MHD simulation, Jiang et al., 2021 established a simple and effective mechanism of eruption initiation in the bipolar field without the need for a pre-existing MFR. Only through a continual surface shearing motion along the PIL does a vertical current sheet (CS) form quasi-statically, and once the CS is sufficiently thin, fast magnetic reconnection sets in and instantly initiates and subsequently drives the eruption. This scenario is referred to as the BASIC mechanism (here, BASIC is the abbreviation of the key ingredients involved in the fundamental mechanism: a Bipolar magnetic Arcade as sheared evolves quasi-Statically and forms Internally a Current sheet) (Bian et al., 2022). In the simulations of the BASIC mechanism, only a shearing flow is applied to the bipolar arcade, while the converging flow has not been considered. Actually, the latter has been commonly involved in the flux-cancellation model that builds up an unstable MFR (van Ballegooijen and Martens, 1989; Amari et al., 2003b; Zuccarello et al., 2015).
In this study, we focused on whether the BASIC mechanism can also be effective if there is a converging flow to drive the MHD system other than the shearing flow. To address this issue, we perform a 3D MHD simulation by first driving the system with shearing motion and then switching to converging motion driving. The shearing-driven phase is stopped well before the CS forms. It is found that the converging motion can still drive the system to form CS quasi-statically and results in eruption when reconnection sets in, which is essentially the same as when only shearing motion is applied. Compared with shearing motion only, the CS is formed at a lower height and has a higher current density, which makes the reconnection more effective and the eruption stronger. Moreover, the converging motion renders a fast decay rate of the overlying field with height and is, thus, favorable for an eruption. This simulation confirms that the BASIC mechanism also applies with the converging flow and further demonstrates that the converging flow is more efficient to form the CS and more favorable for eruption than by solely the shearing flow.
This study is organized as follows: in Section. 2, we show the MHD model along with the initial and boundary conditions, especially the two types of driven motions. Then, the simulation results are presented in Section. 3. Finally, our conclusions and discussions are given in Section. 4.
Our model is a system of full MHD equations in 3D Cartesian coordinates with both plasma pressure and solar gravity and is solved by the advanced conservation element and the solution element method (Jiang et al., 2010; Feng et al., 2010; Jiang et al., 2016, 2021). The basic setup of the model is similar to that in our previous study (Jiang et al., 2021; Bian et al., 2022), but here, we use two types of driven motions, shear and convergence. Our model does not use explicit resistivity in the magnetic induction equation throughout the simulation but still allows for magnetic reconnection through numerical diffusion when the thickness of the current layer approaches the grid resolution (Jiang et al., 2021). By this, we achieved a resistivity as small as we can with a given grid resolution.
The calculation volume is a cube box, which is [ − 270, 270] Mm in the x direction, [ − 270, 270] Mm in the y direction, and [0, 540] Mm in the z direction. For convenience, we consider z = 0 to represent the solar surface (photosphere) since our model is designed to simulate the coronal evolution as driven by the slow (quasi-statical) surface line-tied motions at the footpoints of the coronal magnetic field lines, and the field line footpoints are anchored at the photosphere. The volume is large enough such that the simulation runs can be stopped before the disturbance reaches the side and top boundaries. The full volume is resolved by a block-structured grid with adaptive mesh refinement (AMR) in which the base resolution is Δx = Δy = Δz = 2.88 Mm, and the highest resolution is Δ = 90 km, which is used to capture the formation process of the CS and the subsequent reconnection.
The initial magnetic field of the MHD simulation is the potential field obtained by Green’s function method from the magnetogram. The photospheric magnetogram is a bipolar field modeled by a combination of two Gaussian functions (Amari et al., 2003a; Jiang et al., 2021),
where B0 = 21.3 G, σx = σy = 28.8 Mm, and yc = 11.5 Mm. The parameters σx and σy control the extents of the magnetic flux distribution in the x and y direction, respectively. Such a magnetogram is close to two circles (Figure 1A), similar to Aulanier et al., 2010; Zuccarello et al., 2015, but here it is symmetrical.
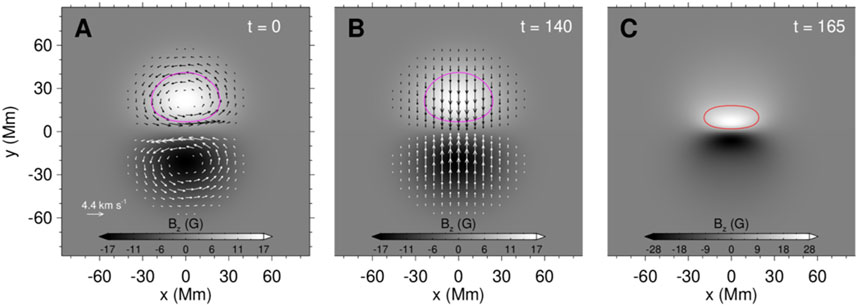
FIGURE 1. Magnetic flux and velocity of the bottom surface during the simulation. (A) Magnetic flux distribution and initial surface rotational (shearing) flow (shown by the arrows) at the bottom surface (i.e., z = 0). (B) Same as (A), but the converging flow starts at t = 140. (C) Magnetic flux distribution at time t = 165. The magenta and red lines represent the contours of one half of the maximum of magnetic normal component (i.e.,
The initial background atmosphere in the model is in hydrostatic equilibrium, that is, the gravity of the plasma is balanced with the pressure gradient force. Plasma is set to typical coronal values, with a sound speed of 110 km s−1, the maximum Alfv
Our MHD simulation is first driven by rotational flows at each magnetic polarity, which is defined as
with ψ given by
where Bz,max is the maximum value of Bz on the photosphere and v0 is a constant for scaling such that the maximum of the surface velocity is 4.4 km s−1, which is close to the magnitude of the typical flow speed on the photosphere (
The simulation of CASE IV in our previous study (Bian et al., 2022) was performed using the aforementioned magnetogram and shearing flow, but the highest grid resolution was 360 km. Through the continual shearing flow along the PIL, the magnetic energy first increases monotonically over a long period of time, during which the kinetic energy remains at a very low level. Then, at a critical point t = 165 (the time unit is τ = 105 s, all of the times mentioned in this study are expressed in the same unit), when the thickness of the CS decreases down to the grid resolution, reconnection begins and triggers an eruption, during which the magnetic energy quickly decreases and the kinetic energy increases rapidly to nearly 3% of the original potential energy. The scenario of this simulation is the BASIC mechanism.
In order to study whether the BASIC mechanism can also be still effective with converging flow to drive the MHD system other than the shearing flow, we perform this MHD simulation by first driving the system with shearing motion and then switching to converging motion driving, similar to Amari et al., 2003a; Zuccarello et al., 2015. The shearing-driven phase is stopped at t = 140, a typical moment chosen when the system has accumulated a large amount of free energy but the CS has not yet formed, and then the converging-driven phase is started. Following Amari et al., 2003a, the converging flow is simply defined as follows:
where v1 is also a constant for scaling such that the largest velocity is 4.4 km s−1. The converging flow is shown in Figure 1B. The effect of converging flow on the vertical component of the magnetic field Bz at t = 165 is shown in Figure 1C. The converging flow makes the magnetic flux converge to the PIL, which increases the gradient of the vertical component of the magnetic field Bz along the PIL.
We do not apply magnetic resistivity in the whole computational volume (including the photosphere surface) during the simulation process so that magnetic cancellation does not occur. The total amount of unsigned flux on the photosphere remains unchanged, while the maximum of the vertical component of the magnetic field Bz becomes larger.
Our simulation shows the whole process of the dynamic evolution of the coronal system, including the quasi-static driving process and the subsequent eruption. The evolution of magnetic field lines, electric current, and velocity during the simulation process can be seen in Figure 2 and the video. During the shearing-driven phase, the evolution of the system is the same as in our previous study (Bian et al., 2022). At the end of the shearing-driven phase (t = 140), a magnetic field configuration with strong shear above the PIL is formed, and the current layer formed is still extremely thick (around 70 grids of highest resolution, see Figure 3), thus far from a CS.
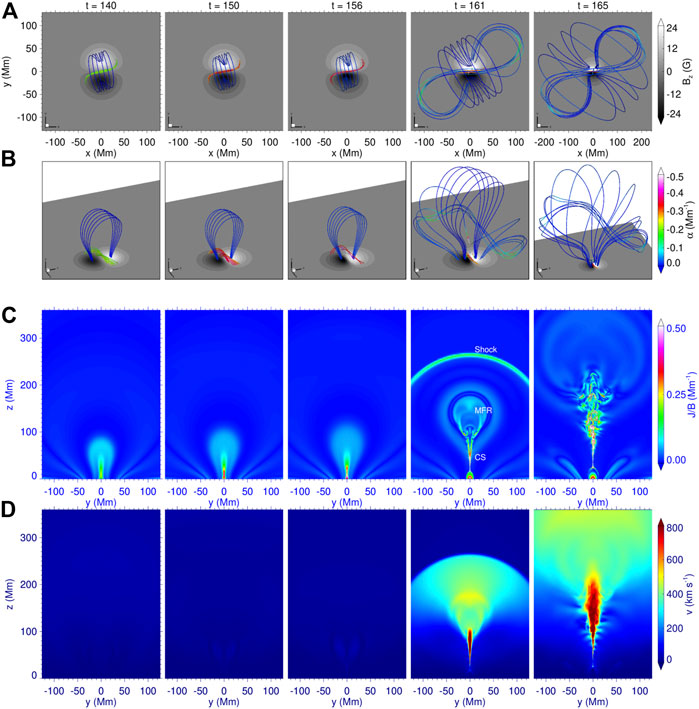
FIGURE 2. Evolution of magnetic field lines, electric current, and velocity during the simulation process. (A) Top view of magnetic field lines. The colored thick lines represent the magnetic field line, and the colors denote the value of the nonlinear force-free factor defined as α = J ⋅B/B2, which indicates how much the field lines are non-potential. The background is plotted for the vertical magnetic component Bz on the bottom surface. (B) 3D perspective view of the same field lines is shown in the panel (A). Panel with t = 165 has a larger range. (C) Distribution of current density, J, normalized by magnetic field strength, B, on the vertical cross section, that is, the x = 0 slice. (D) Vertical cross section of the velocity. The maximum velocity and Alfv
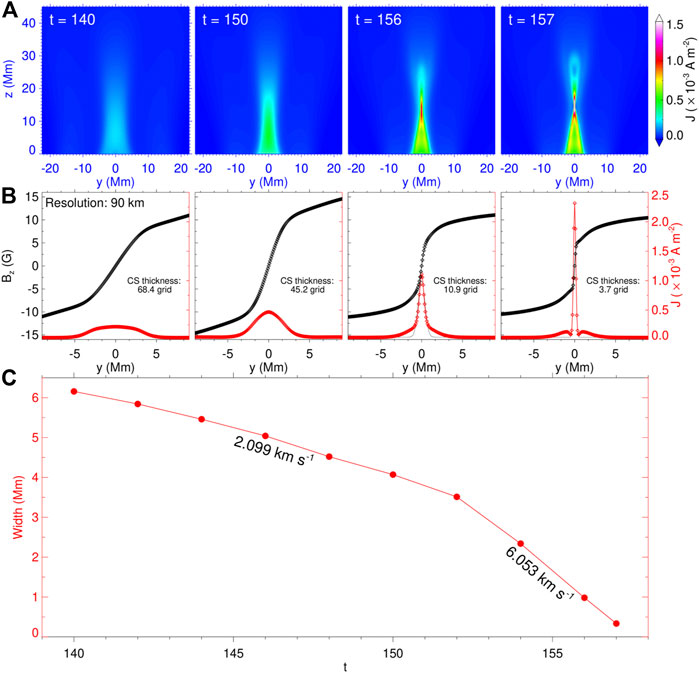
FIGURE 3. Formation of the CS. (A) Distribution of current density on the central vertical slice. (B) One-dimensional profile of the vertical component of magnetic field Bz and current density J along a horizontal line crossing perpendicular to the point with the maximum (J). The diamonds denote values on the grid nodes. The thickness of the CS is denoted, which is defined by the FWHM of a Gauss function fitting (the thin black curve) of the profile of current density. (C) Thickness evolution of the CS during the converging driven process as shown in (B). The velocity at which the thickness of the CS changes is also given. The boundary between these two velocities is t = 152.
At this point, we stop the shearing flow and switch on the converging flow so that the bottom magnetic flux starts to converge to the PIL. Due to the photospheric line-tied effect, the coronal magnetic field is compressed inward, and the current layer was squeezed into a narrow vertical CS above the PIL (around three grids; see Figures 2C, Figure 3B). The velocity is negligible, and the total kinetic energy is around 0.03% of the magnetic energy before t = 156 (Figure 4A), which indicates that the evolution of the system is quasi-static.
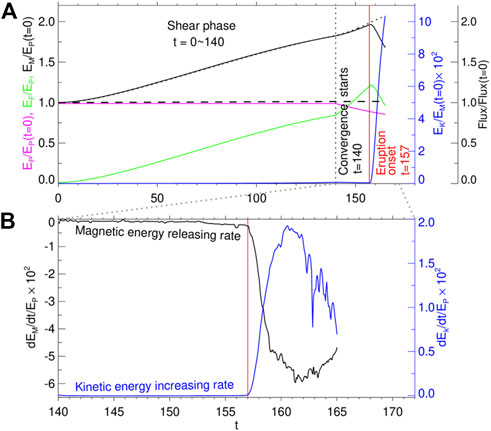
FIGURE 4. Temporal evolution of magnetic energies, kinetic energy, and magnetic flux in the simulation. (A) Evolution of total magnetic energy EM (black), free magnetic energy EF (green), potential magnetic energy EP (magenta), kinetic energy EK (blue line), and magnetic flux (black dashed line). The dotted curve represents the energy injected into the full volume from the bottom boundary through the surface flow. The vertical black dotted line denotes the beginning of the converging flow, and the vertical red line denotes the transition time from pre-eruption to eruption. (B) Magnetic energy releasing rate (black line) and the kinetic energy increasing rate (blue line).
Figure 3A shows the structure of the CS in the core region, and the thickness of the CS (at the maximum of current density) is marked in Figure 3B. It can be seen from Figure 3C that the thickness of the CS decreases with time at a rate of the order of kilometers per second, which is consistent with the converging flow. The thickness of the CS decreases more rapidly after t = 152, about 6.053 km s−1, which is slightly faster than the maximum of converging flow of 4.4 km s−1 applied at the bottom boundary. However, the evolution of the system is still quasi-static, compared to the Alfv
Figure 4 presents the evolution of energies during the simulation run from initial time to t = 165, which includes potential, free, and total magnetic energies, as well as kinetic energy. To compute the potential energy of the system, we use Eq. 7 in Amari et al., 2003a,
We extract the vertical component of the magnetic field Bz on the bottom surface and remap the AMR grid onto a uniform grid of [400 × 400] points and then directly use Eq. 5 to calculate the potential field energy. This method is more time-efficient than the potential field extrapolation method (Bian et al., 2022). The free magnetic energy is obtained by subtracting the potential energy from the total magnetic energy, which is the volume integral of the magnetic field at a certain moment. From the beginning of the simulation to t = 140, during which the system is driven by shearing flow, the potential field energy is constant because the shearing flow does not change the distribution of the bottom surface Bz (Figure 4). At this stage, the total energy increases monotonically, contributed by the free magnetic energy. During the converging phase, i.e., from t = 140 to the end of the simulation, the total energy continues to increase, and the rate of the energy increase is nearly equal to that of the shearing phase, as shown in Figure 4A. As the converging flow modified the distribution of Bz at the bottom boundary, the potential field energy showed a slight decrease, so the increase rate of the free magnetic energy is faster.
During the shearing- and converging-driven phases, the kinetic energy always keeps a very low level, confirming that the evolution of the system is quasi-static. At a critical point (t = 157), when the thickness of the CS reaches grid resolution (Figure 3B), the magnetic reconnection begins and initiates an eruption. The magnetic field energy immediately decreases quickly; meanwhile, the kinetic energy increases rapidly to nearly 10% of the original potential energy. The beginning of the eruption can also be clearly shown from the time profiles of the magnetic energy release rate and the kinetic energy increase rate, which both have impulsive increases at the onset of the eruption, as shown in Figure 4B. This eruption initiated conforms to the BASIC mechanism, that is, the reconnection of the quasi-statically formed CS will immediately trigger the eruption.
At the beginning of magnetic reconnection, a plasmoid (i.e., MFR in 3D) originates from the tip of the CS and rises rapidly, leaving behind a cusp structure separating the reconnected, post-flare loops from the unreconnected field, as shown in Figure 2C and the video. The plasmoid expands rapidly, and, meanwhile, an arc-shaped fast magnetosonic shock is formed in front of the plasmoid. Additionally, the turbulence excited by plasmoid-mediated reconnection is also present in our simulations (Figure 2C, at t ≥ 161), which can actually enhance the reconnection rate. Therefore, this also shows that the simulation in this study has a very high resolution, as plasmoid-mediated reconnection and the resulted turbulence appear only in simulation with sufficiently high resolutions (Jiang et al., 2021; Karpen et al., 2012) with Lundquist number achieving
The intensity of eruption in this simulation was significantly stronger than in CASE IV, both in terms of the magnetic energy releasing rate and the kinetic energy increasing rate, as shown in Figure 5A. Therefore, we compared the two simulations, and the results are shown in Figures 5B–D. Figure 5B shows the current density distributions of the two simulations along the z-axis at the beginning of the eruption. The current density of CASE IV is multiplied by 4 since the highest grid resolution in this simulation is four times that of CASE IV. The CS in this simulation forms at a lower position and has a larger peak current density, which makes the reconnection more efficient and the eruption stronger. Moreover, we also checked the effect of the background field on the intensity of the eruption by calculating the decay index of the background field at the beginning of these two eruptions. The overlying field By actually plays a key role in constraining the erupting flux rope, which is shown in Figure 5C, and the decay index, which is defined as n = −d ln (−By)/d ln(z), is shown in Figure 5D. Compared with CASE IV, the decay index is significantly enhanced at a height of 90–150 Mm so that the decay index reaches the canonical threshold of 1.5 at a lower height, which is also favorable for an eruption.
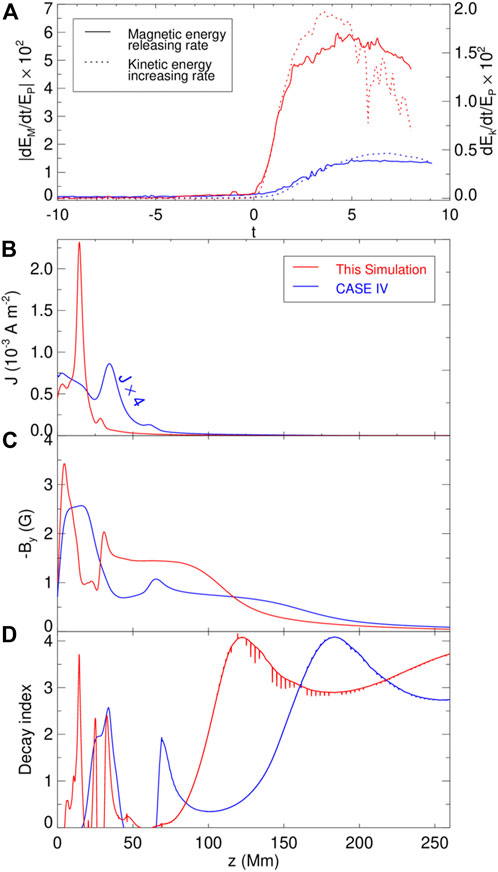
FIGURE 5. Intensity of eruption, current density, magnetic field, and decay index for this simulation and CASE IV. (A) Magnetic energy releasing rate (solid line) and the kinetic energy increasing rate (dotted line). The timescale is shifted so that t = 0 represents the eruption onset. Red and blue curves represent this simulation and CASE IV, respectively. From the top to the bottom are shown for (B) current density, (C) magnetic field component By, and (D) decay index of By, along the z-axis, on the eruption onset (this simulation t = 157 and CASE IV t = 165).
Our simulations demonstrate that the BASIC mechanism is still effective with the photospheric driving motion of jointly shearing and converging flows. At the end of the shearing-driven phase, a magnetic field configuration with strong shear above the PIL is formed, and the current layer is still extremely thick. With the progress of the converging-driven phase, the degree of magnetic shear above the PIL is further strengthened, and the current layer is compressed to be thinner, finally forming a CS and eventually fast magnetic reconnection sets in and instantly initiates the eruption.
During the whole simulation process, the photospheric unsigned flux remains unchanged, that is, magnetic cancellation does not occur. This constraint excludes the possibility of an MFR forming before the onset of the eruption, which is the difference between this simulation and Amari et al., 2003b; Zuccarello et al., 2015.
Compared with CASE IV driven by shearing motion only, the converging motion driven used at t = 140 advances the formation time of the CS, which is t = 157 in this simulation compared to t = 165 in CASE IV, that is, it is more effective for forming the CS. In addition, the CS is formed in this simulation at a lower height and has a higher current density, which makes the magnetic reconnection more effective and the eruption stronger. Moreover, the converging motion renders a fast decay rate of the overlying field with height and is, thus, favorable for an eruption.
In summary, this simulation confirms that the BASIC mechanism also applies with the converging flow and further demonstrates that the converging flow is more effective to create the CS and more favorable for eruption than by solely the shearing flow.
The original contributions presented in the study are included in the article/Supplementary Material; further inquiries can be directed to the corresponding author.
XB carried out the simulation and wrote the draft of the manuscript. CJ leads this work and all contribute to the study.
This work is jointly supported by the National Natural Science Foundation of China (NSFC 42174200), the Fundamental Research Funds for the Central Universities (HIT.OCEF.2021033), the Shenzhen Science and Technology Program (RCJC20210609104422048), and the Shenzhen Technology Project JCYJ20190806142609035. The computational work was carried out on TianHe-1(A), National Supercomputer Center in Tianjin, China and the ISSAT Cluster computing system (HIT, Shenzhen).
The authors declare that the research was conducted in the absence of any commercial or financial relationships that could be construed as a potential conflict of interest.
All claims expressed in this article are solely those of the authors and do not necessarily represent those of their affiliated organizations, or those of the publisher, the editors, and the reviewers. Any product that may be evaluated in this article, or claim that may be made by its manufacturer, is not guaranteed or endorsed by the publisher.
The Supplementary Material for this article can be found online at: https://www.frontiersin.org/articles/10.3389/fspas.2022.982108/full#supplementary-material
Amari, T., Canou, A., Aly, J.-J., Delyon, F., and Alauzet, F. (2018). Magnetic cage and rope as the key for solar eruptions. Nature 554, 211–215. doi:10.1038/nature24671
Amari, T., Luciani, J. F., Aly, J. J., Mikic, Z., and Linker, J. (2003a). Coronal mass ejection: Initiation, magnetic helicity, and flux ropes. I. Boundary motion-driven evolution. ApJ 585, 1073–1086. doi:10.1086/345501
Amari, T., Luciani, J. F., Aly, J. J., Mikic, Z., and Linker, J. (2003b). Coronal mass ejection: Initiation, magnetic helicity, and flux ropes. II. Turbulent diffusion-driven evolution. ApJ 595, 1231–1250. doi:10.1086/377444
Amari, T., Luciani, J. F., Mikic, Z., and Linker, J. (2000). A twisted flux rope model for coronal mass ejections and two-ribbon flares. Astrophysical J. 529, L49–L52. doi:10.1086/312444
Aulanier, G. (2014). The physical mechanisms that initiate and drive solar eruptions. Proc. IAU 8, 184–196. doi:10.1017/S1743921313010958
Aulanier, G., Török, T., Démoulin, P., and DeLuca, E. E. (2010). Formation of torus-unstable flux ropes and electric currents in erupting sigmoids. ApJ 708, 314–333. doi:10.1088/0004-637X/708/1/314
Bian, X., Jiang, C., Feng, X., Zuo, P., Wang, Y., and Wang, X. (2022). Numerical simulation of a fundamental mechanism of solar eruption with a range of magnetic flux distributions. A&A 658, A174. doi:10.1051/0004-6361/202141996
Brown, D., Nightingale, R., Alexander, D., Schrijver, C., Metcalf, T., Shine, R., et al. (2003). Observations of rotating sunspots from trace. Sol. Phys. 216, 79–108. doi:10.1023/A:1026138413791
Chen, P. F. (2011). Coronal mass ejections: Models and their observational basis. Living Rev. Sol. Phys. 8. doi:10.12942/lrsp-2011-1
Chintzoglou, G., Zhang, J., Cheung, M. C. M., and Kazachenko, M. (2019). The origin of major solar activity: Collisional shearing between nonconjugated polarities of multiple bipoles emerging within active regions. ApJ 871, 67. doi:10.3847/1538-4357/aaef30
Fan, Y., and Gibson, S. E. (2007). Onset of coronal mass ejections due to loss of confinement of coronal flux ropes. ApJ 668, 1232–1245. doi:10.1086/521335
Feng, X., Yang, L., Xiang, C., Wu, S. T., Zhou, Y., and Zhong, D. (2010). THREE-DIMENSIONAL solarwindmodeling from the SUN to earth by a SIP-cese MHD model with a six-component grid. ApJ 723, 300–319. doi:10.1088/0004-637X/723/1/300
Forbes, T. G., Linker, J. A., Chen, J., Cid, C., Kóta, J., Lee, M. A., et al. (2006). CME theory and models. Space Sci. Rev. 123, 251–302. doi:10.1007/s11214-006-9019-8
Janvier, M., Aulanier, G., and Démoulin, P. (2015). From coronal observations to mhd simulations, the building blocks for 3d models of solar flares (invited review). Sol. Phys. 290, 3425–3456. doi:10.1007/s11207-015-0710-3
Jiang, C., Feng, X., Liu, R., Yan, X., Hu, Q., Moore, R. L., et al. (2021). A fundamental mechanism of solar eruption initiation. Nat. Astron 5, 1126–1138. doi:10.\1038/s41550-021-01414-z
Jiang, C., Feng, X., Zhang, J., and Zhong, D. (2010). Amr simulations of magnetohydrodynamic problems by the cese method in curvilinear coordinates. Sol. Phys. 267, 463–491. doi:10.1007/s11207-010-9649-6
Jiang, C., Wu, S. T., Feng, X., and Hu, Q. (2016). Data-driven magnetohydrodynamic modelling of a flux-emerging active region leading to solar eruption. Nat. Commun. 7, 11522. doi:10.1038/ncomms11522
Karpen, J. T., Antiochos, S. K., and DeVore, C. R. (2012). The mechanisms for the onset and explosive eruption of coronal mass ejections and eruptive flares. ApJ 760, 81. doi:10.1088/0004-637X/760/1/81
Kliem, B., and Török, T. (2006). Torus instability. Phys. Rev. Lett. 96, 255002. doi:10.1103/PhysRevLett.96.255002
Kusano, K., Bamba, Y., Yamamoto, T. T., Iida, Y., Toriumi, S., and Asai, A. (2012). Magnetic field structures triggering solar flares and coronal mass ejections. ApJ 760, 31. doi:10.1088/0004-637X/760/1/31
Lamb, D. A., Howard, T. A., DeForest, C. E., Parnell, C. E., and Welsch, B. T. (2013). Solar magnetic tracking. iv. the death of magnetic features. ApJ 774, 127. doi:10.1088/0004-637X/774/2/127
Min, S., and Chae, J. (2009). The rotating sunspot in ar 10930. Sol. Phys. 258, 203–217. doi:10.1007/s11207-009-9425-7
Schmieder, B., Démoulin, P., and Aulanier, G. (2013). Solar filament eruptions and their physical role in triggering coronal mass ejections. Adv. Space Res. 51, 1967–1980. doi:10.1016/j.asr.2012.12.026
Shibata, K., and Magara, T. (2011). Solar flares: Magnetohydrodynamic processes. Living Rev. Sol. Phys. 8. doi:10.12942/lrsp-2011-6
Török, T., and Kliem, B. (2005). Confined and ejective eruptions of kink-unstable flux ropes. ApJ 630, L97–L100. doi:10.1086/462412
van Ballegooijen, A. A., and Martens, P. C. H. (1989). Formation and eruption of solar prominences. ApJ 343, 971. doi:10.1086/167766
van Driel-Gesztelyi, L., Demoulin, P., Mandrini, C. H., Harra, L., and Klimchuk, J. A. (2003). The longterm evolution of AR 7978: The scalings of the coronal plasma parameters with the mean photospheric magnetic field. ApJ 586, 579–591. doi:10.1086/367633
Vemareddy, P., Ambastha, A., and Maurya, R. A. (2012). On the role of rotating sunspots in the activity of solar active region noaa 11158. ApJ 761, 60. doi:10.1088/0004-637X/761/1/60
Vemareddy, P. (2017). Successive homologous coronal mass ejections driven by shearing and converging motions in solar active region noaa 12371. ApJ 845, 59. doi:10.3847/1538-4357/aa7ff4
Keywords: magnetic fields, magnetohydrodynamics, methods: numerical, Sun: corona, Sun: coronal mass ejections
Citation: Bian X, Jiang C and Feng X (2022) The role of photospheric converging motion in initiation of solar eruptions. Front. Astron. Space Sci. 9:982108. doi: 10.3389/fspas.2022.982108
Received: 30 June 2022; Accepted: 12 September 2022;
Published: 03 October 2022.
Edited by:
Abhishek Kumar Srivastava, Indian Institute of Technology, IndiaReviewed by:
P. Vemareddy, Indian Institute of Astrophysics, IndiaCopyright © 2022 Bian, Jiang and Feng. This is an open-access article distributed under the terms of the Creative Commons Attribution License (CC BY). The use, distribution or reproduction in other forums is permitted, provided the original author(s) and the copyright owner(s) are credited and that the original publication in this journal is cited, in accordance with accepted academic practice. No use, distribution or reproduction is permitted which does not comply with these terms.
*Correspondence: Chaowei Jiang, Y2hhb3dlaUBoaXQuZWR1LmNu
Disclaimer: All claims expressed in this article are solely those of the authors and do not necessarily represent those of their affiliated organizations, or those of the publisher, the editors and the reviewers. Any product that may be evaluated in this article or claim that may be made by its manufacturer is not guaranteed or endorsed by the publisher.
Research integrity at Frontiers
Learn more about the work of our research integrity team to safeguard the quality of each article we publish.