- 1Air Force Research Laboratory, Kirtland AFB, Rio Rancho, NM, United States
- 2Department of Earth, Planetary, and Space Sciences, University of California, Los Angeles, Los Angeles, CA, United States
- 3Center for Space Physics, Boston University, Boston, MA, United States
- 4Department of Atmospheric and Oceanic Sciences, University of California, Los Angeles, Los Angeles, CA, United States
Radiation belt electrons are strongly affected by resonant interactions with cyclotron-resonant waves. In the case of a particle passing through resonance with a single, coherent wave, a Hamiltonian formulation is advantageous. With certain approximations, the Hamiltonian has the same form as that for a plane pendulum, leading to estimates of the change at resonance of the first adiabatic invariant I, energy, and pitch angle. In the case of large wave amplitude (relative to the spatial variation of the background magnetic field), the resonant change in I and its conjugate phase angle ξ are not diffusive but determined by nonlinear dynamics. A general analytical treatment of slow separatrix crossing has long been available and can be used to give the changes in I associated with “phase bunching,” including the detailed dependence on ξ, in the nonlinear regime. Here we review this treatment, evaluate it numerically, and relate it to previous analytical results for nonlinear wave-particle interactions. “Positive phase bunching” can occur for some particles even in the pendulum Hamiltonian approximation, though the fraction of such particles may be exponentially small.
1 Introduction
Cyclotron-resonant interactions with whistler mode waves are of major importance for the dynamics of radiation belt electrons (Bortnik and Thorne, 2007). Many numerical studies of test particles interacting with coherent, monochromatic waves in an inhomogeneous background magnetic field have demonstrated that cyclotron-resonant interactions lead to changes in particle energy and pitch angle, due to the breaking of an adiabatic invariant (Chang and Inan, 1983; Bortnik et al., 2008). For sufficiently small amplitude waves these changes are diffusive, associated with a random wave-particle phase (Albert, 2010), but larger waves induce systematic, asymmetric changes, whose detailed behavior can be described in terms of phase bunching and phase trapping (Albert, 1993). Estimates of the associated energy and pitch angle ranges of such electrons have been given by, e.g., Albert (2002) and Albert et al. (2021). These processes are in turn deeply connected to nonlinear wave generation or growth (Omura et al., 2008).
For electrons interacting with parallel-propagating whistler mode waves, phase trapping causes a sustained increase in particle energy and pitch angle, while phase bunching (that is, without trapping) causes these quantities to decrease; the lost particle energy can feed wave growth. Theory and simulation indicate that for representative wave and particle parameters, phase bunching has much higher probability than phase trapping in each resonant interaction. Typical particle trajectories showing phase bunching, obtained with a Hamiltonian formulation to be discussed below, are shown in Figures 1, 2. The variables P and q, defined in Section 3, are related, respectively, to the first adiabatic invariant I and its conjugate phase ξ, which are reviewed in Section 2.
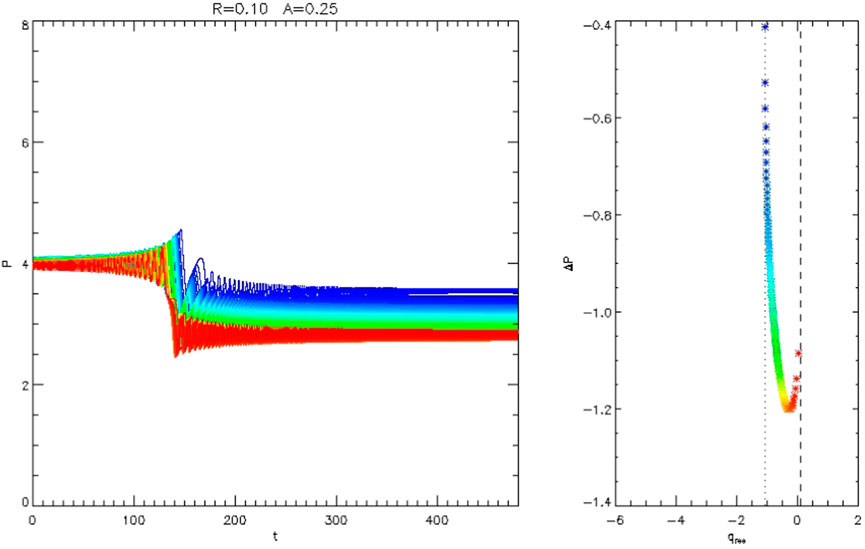
FIGURE 1. Trajectories of 120 particles from numerical integration of the equations of motion specified by the Hamiltonian of Eq. 11, with inhomogeneity parameter R = 0.1 and wave amplitude parameter A = 0.25. Left: P vs. t, showing systematic decrease associated with phase bunching at resonance. In this case, all values of ΔP are negative. Right: Change in P vs. the value of q at resonance. The dotted and dashed vertical lines show the calculated values qturn and qx + 2π, respectively, as discussed in the text.
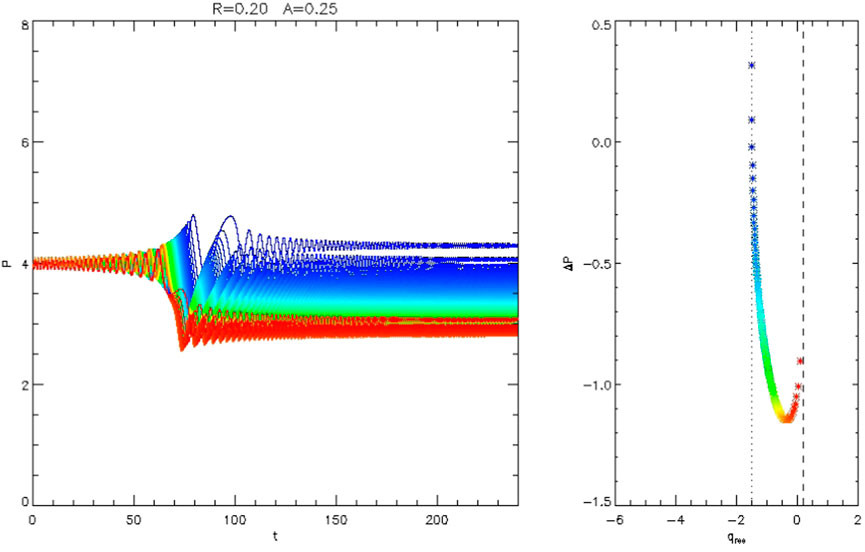
FIGURE 2. Trajectories of 120 particles from numerical integration of the equations of motion specified by the Hamiltonian of Eq. 11, with inhomogeneity parameter R = 0.2 and wave amplitude parameter A = 0.25. Left: P vs. t, showing systematic decrease associated with phase bunching at resonance. In this case, most but not all values of ΔP are negative. Right: Change in P vs. the value of q at resonance. The dotted and dashed vertical lines show the calculated values qturn and qx + 2π, respectively, as discussed in the text.
Albert (1993) obtained an analytical estimate of the change in the first adiabatic invariant (and therefore energy and pitch angle) caused by phase bunching in the highly nonlinear limit, though the dependence on resonant wave-particle phase seen in numerical simulations was not accounted for. A more detailed expression can be written formally as an explicit but infinite and intractable integral, which must still be evaluated numerically; however, averaging over the appropriate phase and interchanging integrals leads to a much more manageable expression (Neishtadt, 1999); this is presented in Section 4. Furthermore, the very general treatment of adiabatic invariant changes of Cary et al. (1986) can be applied to this problem, leading to a detailed and reliable approximation that retains the phase dependence in closed form. This treatment quantitiatively captures the numerical observation that phase bunching-induced changes exhibit a spread of values, including some that are in fact in the positive direction. This is discussed in Section 5. Depending on the parameters used, adiabatic invariant increase may be physically significant yet too infrequent to detect from direct numerical simulation with a small number of particles.
2 Hamiltonian formulation
Albert (1993) and Albert (2000) derived a Hamiltonian
The distance z along the field line plays the role of time, so that
where γ is the relativistic factor 1 + E/mc2.
where ℓ ≠ 0, and Ωeq is the equatorial value of Ω.
At a given location z, the resonant value of I is determined to lowest order by
This yields
which generalize Eqs. 5, 6 of Albert et al. (2021) to arbitrary values of sℓ. The z dependence of Ires is characterized by ∂Ires/∂Ω, which can be written as
For the prototype situation of an electron (s = −1) in primary resonance (ℓ = −1) and heading toward the equator (σz = −1), as considered here, this quantity is always negative; both z and the gyrofrequency Ω decrease and Ires increases. The correspondence between Eq. 1 and the gyro-averaged Lorentz equations of motion was investigated by Albert et al. (2022).
3 Pendulum hamiltonian
A Taylor expansion of
where
It is convenient to define σF and σG as the signs of Fr and Gr, respectively, so that F = σFFr and G = σGGr are positive. Then Eq. 7 can be brought into the same form as Equation 72 of Cary et al. (1986) by changing variables to
The equations of motion in these variables are then given by the Hamiltonian
with Pres = GIres and A = FG. Typical contours at fixed Pres(τ) are shown in Figure 3. For the prototype configuration (with s = ℓ = σz = −1) Gr is negative, so dPres/dτ = σGG(dIres/dz) is positive. Albert et al. (2021) and Artemyev et al. (2021) considered a more general version of Eq. 7 which retains a factor of
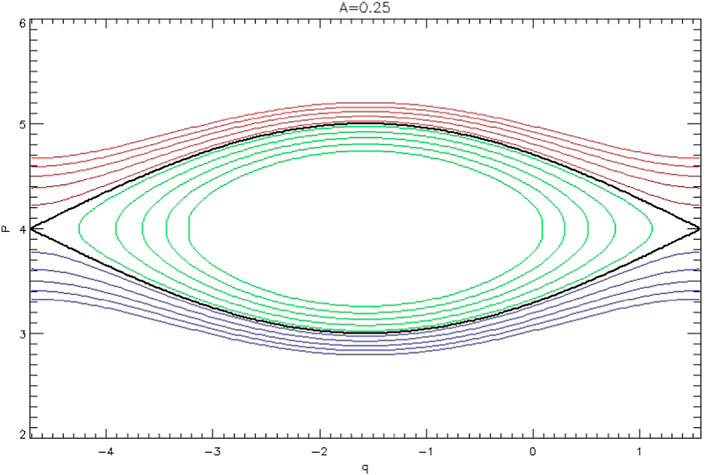
FIGURE 3. Contours of the pendulum Hamiltonian H(P, q) given by Eq. 10, with A = 0.25. If the inhomogeneity parameter R is small but positive, the separatrix (shown in black) slowly rises. At resonance near the X-point, particles cross from red contours to blue (phase bunching) or green (phase trapping) contours.
Transforming from P to p = P − Pres in Eq. 10 gives
where both A and the inhomogeneity parameter R = (dPres/dτ)/A are positive and will be taken as constant. This idealization eliminates the possibility of phase trapping, which involves expansion of the Hamiltonian separatrix to engulf neighboring trajectories.
Trajectories of 120 particles from numerical integration of the equations of motion specified by the Hamiltonian of Eq. 11 are shown in Figure 1, with inhomogeneity parameter R = 0.1 and wave amplitude parameter A = 0.25. In this case, all values of ΔP are negative. In Figure 2 the wave amplitude parameter A is the same but the inhomogeneity parameter has been increased to R = 0.2, resulting in positive ΔP for some values of q at resonance.
4 Integral expression for changes in invariant
Contours of K, from Eq. 11, are shown in the top panel of Figure 4. The linearly unstable X-point obeys
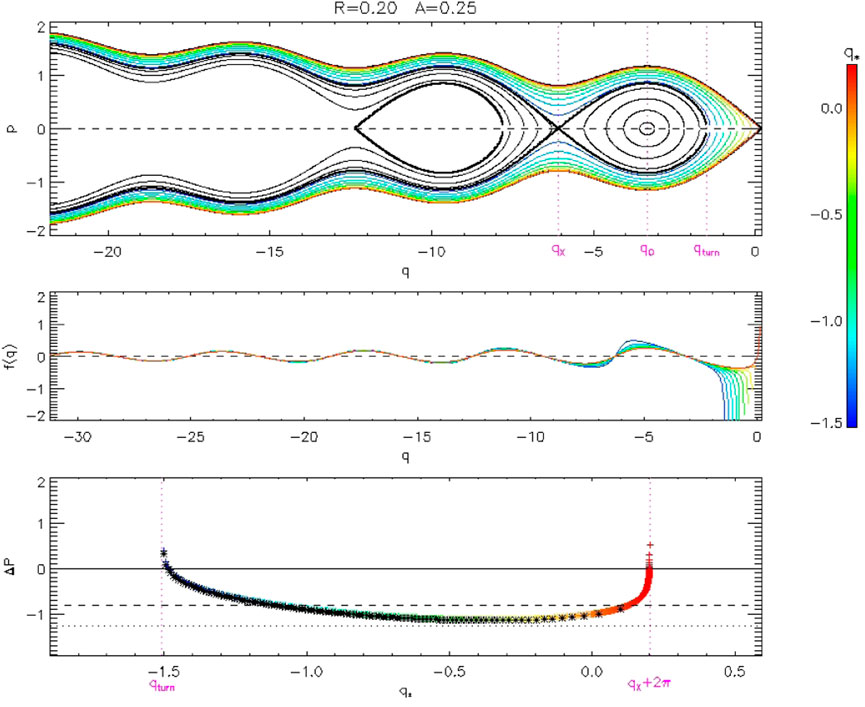
FIGURE 4. Top: Contours of K(p, q) for parameters R = 0.2 and A = 0.25, color-coded by q* (the value of q at p = 0). Middle: The function appearing in the integral of Eq. 13. Bottom: The colored symbols show ΔP vs. q* from numerical evaluation of Eq. 13, which is negative for most but not all values of q*. The horizontal dashed line shows the averaged value, and the horizontal dotted line shows the value
The change in P can be expressed as
The integral over q is taken from − ∞ to the value q* and then back to q = −∞, where q* is the value of q as the curve crosses p = 0. It is sufficient to integrate from − ∞ to q* and double the result. It is convenient to define h = (K + A)/AR and a = 1/R, so that
Note that h(p, q + 2π) = h(p, q) + 2π.
This infinite, oscillatory integral is carried out along contours of h(p, q). The middle panel shows values of the integrand, and indicates that a wide range of q values contribute to the total integral. The bottom panel shows numerical evaluations (in color), which are generally negative but can be positive near q∗ = qturn or q∗ = qx + 2π. Also shown, as black symbols, are the values from the simulations of Figure 2. The excellent agreement is expected since Eq. 13 and the equations of motion from Eq. 11 should be exactly equivalent.
4.1 Average value of ΔP
The integral for ΔP cannot be carried out in closed form, but it can be averaged with respect to q* analytically. Averaging with respect to q* is equivalent to averaging with respect to h (Cary et al., 1986; Itin et al., 2000), with the range qturn to qx + 2π corresponding to the range hx to hx + 2π (since hturn = hx). Following Neishtadt (1999) and Artemyev et al. (2018), the curves are integrated separately over the ranges q < qx (region 1) and q > qx (region 2), with the latter combined with the (p, q) island (region 3). For region 1,
Next, noting that along the q axis h ≡ h0 = a cos q + q,
Thus I1 + I2 + I3 = 0. Finally, I3 can be expressed as
Writing sin q = (a sin q − 1)/a + 1/a leads to I3 = S/a, with
which is the area of the (p, q) island. The average of ΔP over regions 1 and 2 is then
which becomes
5 Two-lobe hamiltonian
Cary et al. (1986) (hereafter CET) gives a comprehensive treatment of adiabatic invariant breaking due to crossing the separatrix of a Hamiltonian
where Π and Q are a pair of action-angle variables and the small quantity ϵ indicates that the crossing is slow. This form is chosen to facilitate analysis of motion near the X-point, but Appendix A of CET shows how an arbitrary Hamiltonian may be put into this form to arbitrary order in ϵ (the several typesetting errors in Eq. 10 notwithstanding). The phase portrait of this Hamiltonian has two lobes; typical contours of Eq. 19 are shown in Figure 5.
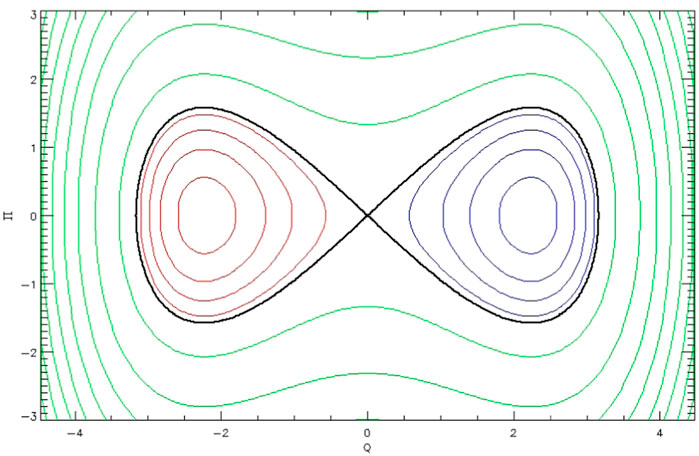
FIGURE 5. Contours of a two-lobe Hamiltonian of the form of Eq. 19. The contour colors correspond to those of Figure 3.
Following a very complex sequence of calculations based on Eq. 19, two special cases are considered, described as symmetric and antisymmetric (which refer to the growth rates of the two lobes shown in 5, not their shapes). The symmetric case was applied to drift orbit bifurcation by Öztürk and Wolf (2007). The antisymmetric case applies to the pendulum Hamiltonian of Eq. 7 and its transformed version Eq. 11, which are of the same form as, respectively, Equation 72 and the subsequent one of CET. With a minor typesetting correction, Equation 84 of CET gives
where Equation 75 of CET has been used, and the notation
has been introduced. Related expressions were presented by Neishtadt (1987). The leading term of Eq. 20 is the same as the estimate of Albert (1993).
To evaluate h0 and μ in terms of K(p, q, τ) of Eq. 11, it is necessary to shift K by a constant:
so that h0(qx + 2π) = 0 for consistency with the derivation. It can be shown that K(q*) is an increasing function of q* between qturn and qx + 2π, so h0 ≤ 0, and that μ correspondingly increases from − 1 to 0. Eq. 9 of Tennyson et al. (1986), which was written in terms of md = |μ|, is equivalent if A = ω = 1.
Evaluation of Eq. 20 is shown in color in Figure 6. Also shown, as a black curve, are the values from Eq. 13. These two formulations are not exactly equivalent, but are in excellent agreement.
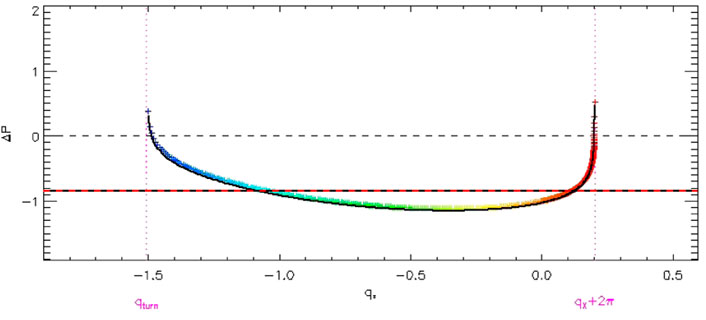
FIGURE 6. The colored symbols show ΔP vs. q∗ from Eq. 20, which is negative for most but not all values of q*. The solid horizontal line shows the averaged value, and the red dashed horizontal line shows the value from Eq. 18. The black symbols show the values from Figure 2. The dotted and dashed vertical lines show the calculated values qturn and qx + 2π, respectively, as discussed in the text.
Equation 20 can be approximated near μ = 0 as
and near μ = −1 as
where γ0 ≈ 0.5772 is the Euler constant. For small values of R, these estimates are positive only for very narrow ranges of μ, approximately
or
respectively. For R = 0.5, these values are approximately 10−3 and 0.3, while for R = 0.2 they are 5 × 10⁻⁷ and 0.02, respectively. Thus ΔP > 0 only for particles with μ near − 1 or extremely near μ = 0.
Equation 20 can be averaged over μ, giving
This value is shown as the thick black line in Figure 6, and agrees very well with Eq. (18), shown as the dashed red line.
Finally, comparing Eqs. 27, 18 gives the estimate
which should be useful in situations where R is slowly changing, and the probability of phase trapping is proportional to the rate of change of S (Artemyev et al., 2018).
6 Summary
Wave-particle interactions are frequently treated with a pendulum Hamiltonian equivalent to Eq. 11. With the wave amplitude parameter A and the inhomogeneity parameter R held constant, phase trapping does not occur, and changes in adiabatic invariant P due to phase bunching are formally expressible by the integral in Eq. 13. This result depends on the wave-particle phase q at resonance; positive values can occur but are uncommon. Averaging over that phase gives the more tractable expression 18, which is always negative.
Equation 20, which is a special case of a detailed analysis of the two-lobe Hamiltonian of Eq. 19, gives the change in P as an explicit function of q at resonance. Its average value, Eq. 27, agrees very well with Eq. 18, and it also accurately reproduces the numerically observed dependence on q, including positive values of ΔP (see Figure 6). Analytical estimates of the fraction of particles with these positive values were obtained, which are exponentially small for small values of R. Finally, combining the two treatments gives a good analytical approximation to the area bounded by the pendulum separatrix, whose rate of increase determines the probability of phase trapping.
Data availability statement
The original contributions presented in the study are included in the article/supplementary material, further inquiries can be directed to the corresponding author.
Author contributions
JMA conceived this work, and wrote and ran the simulations. AA helped analyze approaches to reducing the dimensionality of the system of equations. WL, QM, and LG consulted on the work and made several useful suggestions on the simulations and presentation.
Funding
JMA was supported by NASA grant 80NSSC19K0845 and the Space Vehicles Directorate of the Air Force Research Laboratory. WL, LG, and QM also acknowledge the NASA grants 80NSSC20K1506 and 80NSSC20K0698, NSF grant AGS-1847818, and the Alfred P. Sloan Research Fellowship FG-2018-10936.
Acknowledgments
The views expressed are those of the author and do not reflect the official guidance or position of the United States Government, the Department of Defense or of the United States Air Force. The appearance of external hyperlinks does not constitute endorsement by the United States Department of Defense (DoD) of the linked websites, or the information, products, or services contained therein. The DoD does not exercise any editorial, security, or other control over the information you may find at these locations.
Conflict of interest
The authors declare that the research was conducted in the absence of any commercial or financial relationships that could be construed as a potential conflict of interest.
The handling editor XJZ declared a shared affiliation with the authors AA, QM at the time of review.
Publisher’s note
All claims expressed in this article are solely those of the authors and do not necessarily represent those of their affiliated organizations, or those of the publisher, the editors and the reviewers. Any product that may be evaluated in this article, or claim that may be made by its manufacturer, is not guaranteed or endorsed by the publisher.
References
Albert, J. M., Artemyev, A. V., Li, W., Gan, L., and Ma, Q. (2021). Models of resonant wave-particle interactions. JGR. Space Phys. 126, e2021JA029216. doi:10.1029/2021JA029216
Albert, J. M., Artemyev, A., Li, W., Gan, L., and Ma, Q. (2022). Equations of motion near cyclotron resonance. Front. Astron. Space Sci. 9, 910224. doi:10.3389/fspas.2022.910224
Albert, J. M. (1993). Cyclotron resonance in an inhomogeneous magnetic field. Phys. Fluids B Plasma Phys. 5, 2744–2750. doi:10.1063/1.860715
Albert, J. M. (2000). Gyroresonant interactions of radiation belt particles with a monochromatic electromagnetic wave. J. Geophys. Res. 105, 21191–21209. doi:10.1029/2000JA000008
Albert, J. M. (2002). Nonlinear interaction of outer zone electrons with VLF waves. Geophys. Res. Lett. 29, 116-1–116-3. doi:10.1029/2001GL013941
Albert, J. M. (2010). Diffusion by one wave and by many waves. J. Geophys. Res. 115, A00F05. doi:10.1029/2009JA014732
Artemyev, A. V., Neishtadt, A. I., Vainchtein, D. L., Vasiliev, A. A., Vasko, I., and Zelenyi, L. (2018). Trapping (capture) into resonance and scattering on resonance: Summary of results for space plasma systems. Commun. Nonlinear Sci. Numer. Simul. 65, 111–160. doi:10.1016/j.cnsns.2018.05.004
Artemyev, A. V., Neishtadt, A. I., Albert, J. M., Gan, L., Li, W., and Ma, Q. (2021). Theoretical model of the nonlinear resonant interaction of whistler-mode waves and field-aligned electrons. Phys. Plasmas 28, 052902. doi:10.1063/5.0046635
Bortnik, J., and Thorne, R. M. (2007). The dual role of elf/vlf chorus waves in the acceleration and precipitation of radiation belt electrons. J. Atmos. Sol. Terr. Phys. 69, 378–386. doi:10.1016/j.jastp.2006.05.030
Bortnik, J., Thorne, R. M., and Inan, U. S. (2008). Nonlinear interaction of energetic electrons with large amplitude chorus. Geophys. Res. Lett. 35, L21102. doi:10.1029/2008GL035500
Cary, J. R., Escande, D. F., and Tennyson, J. L. (1986). Adiabatic-invariant change due to separatrix crossing. Phys. Rev. A . Coll. Park. 34, 4256–4275. doi:10.1103/PhysRevA.34.4256
Chang, H. C., and Inan, U. S. (1983). Quasi-relativistic electron precipitation due to interactions with coherent VLF waves in the magnetosphere. J. Geophys. Res. 88, 318. doi:10.1029/ja088ia01p00318
Gan, L., Li, W., Ma, Q., Albert, J. M., Artemyev, A. V., Bortnik, J., et al. (2020). Nonlinear interactions between radiation belt electrons and chorus waves: Dependence on wave amplitude modulation. Geophys. Res. Lett. 47, e2019GL085987. doi:10.1029/2019GL085987
Itin, A. P., Neishtadt, A. I., and Vasiliev, A. A. (2000). Captures into resonance and scattering on resonance in dynamics of a charged relativistic particle in magnetic field and electrostatic wave. Phys. D. Nonlinear Phenom. 141, 281–296. doi:10.1016/S0167-2789(00)00039-7
Kitahara, M., and Katoh, Y. (2019). Anomalous trapping of low pitch angle electrons by coherent whistler mode waves. JGR. Space Phys. 124, 5568–5583. doi:10.1029/2019JA026493
Neishtadt, A. I. (1987). On the change in the adiabatic invariant on crossing a separatrix in systems with two degrees of freedom. J. Appl. Math. Mech. 51, 586–592. doi:10.1016/0021-8928(87)90006-2
Neishtadt, A. (1999). “On adiabatic invariance in two-frequency systems,” in Hamiltonian systems with three or more degrees of freedom. NATO ASI series (series C: Mathematical and physical Sciences). Editor C. Simó (Dordrecht: Springer), 533, 193–213. doi:10.1007/978-94-011-4673-9_17
Omura, Y., Katoh, Y., and Summers, D. (2008). Theory and simulation of the generation of whistler-mode chorus. J. Geophys. Res. 113, A04223. doi:10.1029/2007JA012622
Öztürk, M. K., and Wolf, R. A. (2007). Bifurcation of drift shells near the dayside magnetopause. J. Geophys. Res. 112, A07207. doi:10.1029/2006ja012102
Keywords: wave-particle interactions, radiation belts, nonlinear, hamiltonian, test particle simulation
Citation: Albert JM, Artemyev A, Li W, Gan L and Ma Q (2022) Analytical results for phase bunching in the pendulum model of wave-particle interactions. Front. Astron. Space Sci. 9:971358. doi: 10.3389/fspas.2022.971358
Received: 17 June 2022; Accepted: 15 July 2022;
Published: 11 August 2022.
Edited by:
Xiao-Jia Zhang, University of California, Los Angeles, United StatesReviewed by:
Oliver Allanson, University of Exeter, United KingdomYikai Hsieh, Kyoto University, Japan
Copyright © 2022 Albert , Artemyev , Li , Gan and Ma . This is an open-access article distributed under the terms of the Creative Commons Attribution License (CC BY). The use, distribution or reproduction in other forums is permitted, provided the original author(s) and the copyright owner(s) are credited and that the original publication in this journal is cited, in accordance with accepted academic practice. No use, distribution or reproduction is permitted which does not comply with these terms.
*Correspondence: Jay M. Albert , amF5LmFsYmVydEB1cy5hZi5taWw=
 Jay M. Albert
  Anton Artemyev
  Wen Li
  Longzhi Gan
  Qianli Ma