 Sven Wedemeyer1,2*
 Gregory Fleishman3
 Jaime de la Cruz Rodríguez4
 Stanislav Gunár5
 João M. da Silva Santos6
 Patrick Antolin7
 Juan Camilo Guevara Gómez1,2
 Mikolaj Szydlarski1,2
 Henrik Eklund1,2,4
- 1Rosseland Centre for Solar Physics, University of Oslo, Oslo, Norway
- 2Institute of Theoretical Astrophysics, University of Oslo, Oslo, Norway
- 3Center for Solar-Terrestrial Research, New Jersey Institute of Technology, Newark, NJ, United States
- 4Department of Astronomy, Institute for Solar Physics, Stockholm University, AlbaNova University Centre, Stockholm, Sweden
- 5Astronomical Institute, The Czech Academy of Sciences, Ondřejov, Czechia
- 6National Solar Observatory, Boulder, CO, United States
- 7Department of Mathematics, Physics, and Electrical Engineering, Northumbria University, Newcastle Upon Tyne, United Kingdom
The Atacama Large Millimeter/submillimeter Array (ALMA) offers new diagnostic possibilities that complement other commonly used diagnostics for the study of the Sun. In particular, ALMA’s ability to serve as an essentially linear thermometer of the chromospheric gas at unprecedented spatial resolution at millimeter wavelengths and future polarization measurements has great diagnostic potential. Solar ALMA observations are therefore expected to contribute significantly to answering long-standing questions about the structure, dynamics, and energy balance of the outer layers of the solar atmosphere. In this regard, current and future ALMA data are also important for constraining and further developing numerical models of the solar atmosphere, which in turn are often vital for the interpretation of observations. The latter is particularly important given the Sun’s highly intermittent and dynamic nature that involves a plethora of processes occurring over extended ranges in spatial and temporal scales. Realistic forward modeling of the Sun therefore requires time-dependent three-dimensional radiation magnetohydrodynamics that account for non-equilibrium effects and, typically as a separate step, detailed radiative transfer calculations, resulting in synthetic observables that can be compared to observations. Such artificial observations sometimes also account for instrumental and seeing effects, which, in addition to aiding the interpretation of observations, provide instructive tools for designing and optimizing ALMA’s solar observing modes. In the other direction, ALMA data in combination with other simultaneous observations enable the reconstruction of the solar atmospheric structure via data inversion techniques. This article highlights central aspects of the impact of ALMA for numerical modeling of the Sun and their potential and challenges, together with selected examples.
1 Introduction
When pointed at the Sun, the Atacama Large Millimeter/submillimeter Array (ALMA, Wootten and Thompson, 2009) mostly observes radiation that originates from the solar chromosphere. This atmospheric layer, which is situated between the photosphere below and the transition region and the corona above, is highly dynamic and intermittent and shows variations on a large range of spatial and temporal scales. Plasma with chromospheric conditions can also be found in the corona in the form of prominences and coronal rain. These structures are integral components of the solar corona in the sense that they not only reflect specific physical processes of the corona but also influence its evolution (Vial and Engvold, 2015; Antolin and Froment, 2022). The investigation of the thermodynamic conditions and morphology of these dense and cool structures supported by the magnetic field is therefore also a major field to which ALMA can make a major contribution.
Despite very active research regarding the chromosphere, which involves observations at many different wavelength ranges supported by numerical simulations, many fundamental questions concerning this layer remain open. The main reason is that the chromosphere is notoriously difficult to observe. Only a small number of spectral lines and continua are formed in the chromosphere, usually across extended height ranges. The formation of chromospheric spectral lines involves non-equilibrium effects such as non-local thermodynamic equilibrium (NLTE1, see Unsöld, 1955; Mihalas, 1978; Carlsson and Stein, 1992, and references therein) and time-dependent hydrogen ionization (Carlsson and Stein, 2002). Consequently, the few currently available diagnostics like the spectral lines of singly ionized calcium and magnesium are difficult to interpret, in particular, in combination with instrumental limitations. As a result, the physical properties of the observed atmospheric region can only be derived with rather large uncertainties, hampering the progress in understanding this important part of the solar atmosphere.
Observations of the solar continuum radiation using ALMA, as offered on a regular basis since 2016, provide unprecedented diagnostic possibilities that are complementary to other chromospheric diagnostics (Bastian, 2002; Karlický et al., 2011; Benz et al., 2012; Wedemeyer et al., 2016; Bastian et al., 2018). The radiation continuum at submillimeter/millimeter ((sub-)mm) wavelengths, including the range accessed by ALMA, forms essentially under conditions of local thermodynamic equilibrium (LTE) so that the observed brightness temperature, Tb, is closely related to the actual (electron) temperature of the chromospheric gas in a (corrugated) layer whose average height roughly increases with the selected observing wavelength. Unfortunately, observations at (sub-)mm wavelengths prior to the use of ALMA had too low spatial and temporal resolution for resolving the small spatial and short temporal scales on which the intricate chromospheric dynamics occur. For instance, the Berkeley–Illinois–Maryland Array (BIMA) had a spatial resolution corresponding to a restored beam size of
Because ALMA is relatively new as a diagnostic tool for the solar chromosphere, many aspects are not understood well yet. For instance, the exact formation heights and, thus, the layers sampled by the different receiver bands of ALMA and, likewise, the oscillatory behavior seen in the ALMA observations are still debated (Jafarzadeh et al., 2021; Patsourakos et al., 2020; Narang et al., 2022; Nindos et al., 2021). On the other hand, as solar observing using ALMA is still in its infancy, its capabilities will continue to improve in the near future. However, any new ability to obtain unprecedented observations in any part of the spectrum always brings its own challenges in the interpretation of the resulting data. Fortunately, diagnostics and understanding of ALMA observations and their relationship to the coordinated observations in other spectral domains can benefit from dedicated numerical modeling.
Like in many other fields of astrophysics, numerical simulations have developed into an essential tool in solar physics. Also, in the context of solar observations with ALMA, simulations help to interpret observational data but can also be used to develop and optimize new observing strategies (Wedemeyer-Böhm et al., 2007; Loukitcheva et al., 2015; Fleishman et al., 2021a). In return, comparisons with observations provide crucial tests for the veracity of existing models of the solar atmosphere. In this brief overview article, the potential value of numerical simulations for solar science with ALMA is explored, ranging from forward modeling of thermal and non-thermal mm continuum radiation and the impact of magnetic fields (Section 2) to data inversion techniques and modeling of instrumental and seeing effects (Section 3). Examples of scientific applications are given in Section 4, followed by a summary and outlook in Section 5.
2 Forward modeling and artificial observations
Forward modeling of the solar atmosphere is typically split into the following steps: (i) radiation (magneto) hydrodynamics simulations (Section 2.1), (ii) synthesis of observables via radiative transfer calculations (Section 2.2), and (iii, optional) application of simulated observational effects (e.g., limited angular resolution, see Section 2.3).
2.1 Radiation magnetohydrodynamics simulations
Semi-empirical models of the solar atmosphere like those by created by Vernazza et al. (1981), Fontenla et al. (1993), and Avrett and Loeser (2008) have been an important milestone and are still widely used for reference. Millimeter continuum observations were also used for the construction of these models, which therefore, give a first idea of where and under which conditions radiation continuum at different millimeter wavelengths is formed—on average. While the employed radiative transfer modeling, which even accounts for NLTE, is elaborate, this class of models can by nature not account for the pronounced temporal and spatial variations seen at the much increased resolution of modern observations.
The next step in the development toward realistic models was therefore to account for temporal variations in the chromosphere. The time-dependent one-dimensional simulations by Carlsson and Stein (1995) and variations therefore capture well the dynamics introduced by shock waves that propagate through the solar atmosphere and the resulting implications for the chromospheric plasma properties, i.e., the ionization degree of hydrogen and, thus, the (non-equilibrium) electron density (Carlsson and Stein, 2002). These simulations have been used for the synthesis of the millimeter continuum and thus provided first predictions of the brightness temperature variations that a telescope with sufficient resolution would be able to observe (Loukitcheva et al., 2008).
However, the solar atmosphere and, in particular, the highly dynamic and intermittent chromosphere is a truly time-dependent three-dimensional phenomenon, which poses significant challenges for realistic modeling capable of reproducing observational findings. Also, temporal variations on short timescales are typically connected to spatial variations across short-length scales. Consequently, accounting for the full time-dependence and multi-dimensionality of the solar chromosphere is a substantial step forward from one-dimensional approaches. In view of limited computational resources, early 3D simulations were restricted in the overall number of grid cells, seeking a compromise between the required resolution and the extent of the computational domain, and the physical processes that could be numerically treated (Skartlien et al., 2000; Wedemeyer et al., 2004). The enormous increase in computational power over the last decades now enables simulations with much higher numbers of grid cells and, thus, a better representation of the chromospheric small-scale structure and larger extents of the modeled region. However, self-consistent numerical simulations of whole active regions are still at the modeling frontier (Rempel et al., 2009).
Numerical two-dimensional (2D) and three-dimensional (3D) models produced using the radiation magnetohydrodynamics (rMHD) simulation codes Bifrost (Gudiksen et al., 2011) and CO5BOLD (Freytag et al., 2012) have already been used as the basis for the synthesis of mm continuum radiation (Wedemeyer-Böhm et al., 2007; Loukitcheva et al., 2015) but an increasing number of codes is developing the necessary functionality, e.g., MURaM (Przybylski et al., 2022). Both Bifrost and CO5BOLD solve the equations of magnetohydrodynamics and radiative energy transfer together with a realistic equation of state and realistic opacities and further relevant physics. A typical model includes a small part of the solar atmosphere (from a few Mm to a few 10 Mm, cf. Wedemeyer et al., 2016, and references therein) and extends from the upper convection zone into the chromosphere and/or low corona (Figure 1A). This way, the dynamics in the model are driven self-consistently and all layers mapped using ALMA are included. A simulation typically starts with an evolved model snapshot (or any other initial condition) and is evolved in time step-by-step, where the computational time steps are of the order of 1 ms–100 ms, depending on the magnetic field strength in the model. Simulation snapshots of the physical parameters can be output at a freely selectable cadence. Modeling the layers of the solar atmosphere above the temperature minimum in a realistic way requires the inclusion of additional physical processes and deviations from equilibrium conditions that are usually computationally expensive. As discussed in Section 2.2.1, the detailed treatment of time-dependent non-equilibrium hydrogen ionization, like it is implemented in Bifrost, is of particular importance for the continuum radiation at millimeter wavelengths. Also, adding non-equilibrium ionization of helium and ion-neutral interactions (ambipolar diffusion) significantly increases the computational costs. Consequently, so far, only a small number of models can account for these additional ingredients and are necessarily limited to 2.5D in order to render such modeling computationally feasible (Martínez-Sykora et al., 2020). These models suggest that the effective formation heights of the millimeter continuum in both the ALMA bands 3 and 6 are similar in active regions (ARs) and network regions, which contradicts results from previous simulations (see Wedemeyer et al., 2016, and references therein) and actual ALMA observations ( Hofmann et al., 2022). Clearly, the inclusion of more physical processes relevant under chromospheric conditions as implemented in the 2.5D simulations conducted by Martínez-Sykora et al. (2020) is an essential step in the right direction. However, given the complicated small-scale dynamics of the chromosphere, modeling this layer in full 3D at sufficient resolution is a critical requirement that comes with high computational costs.
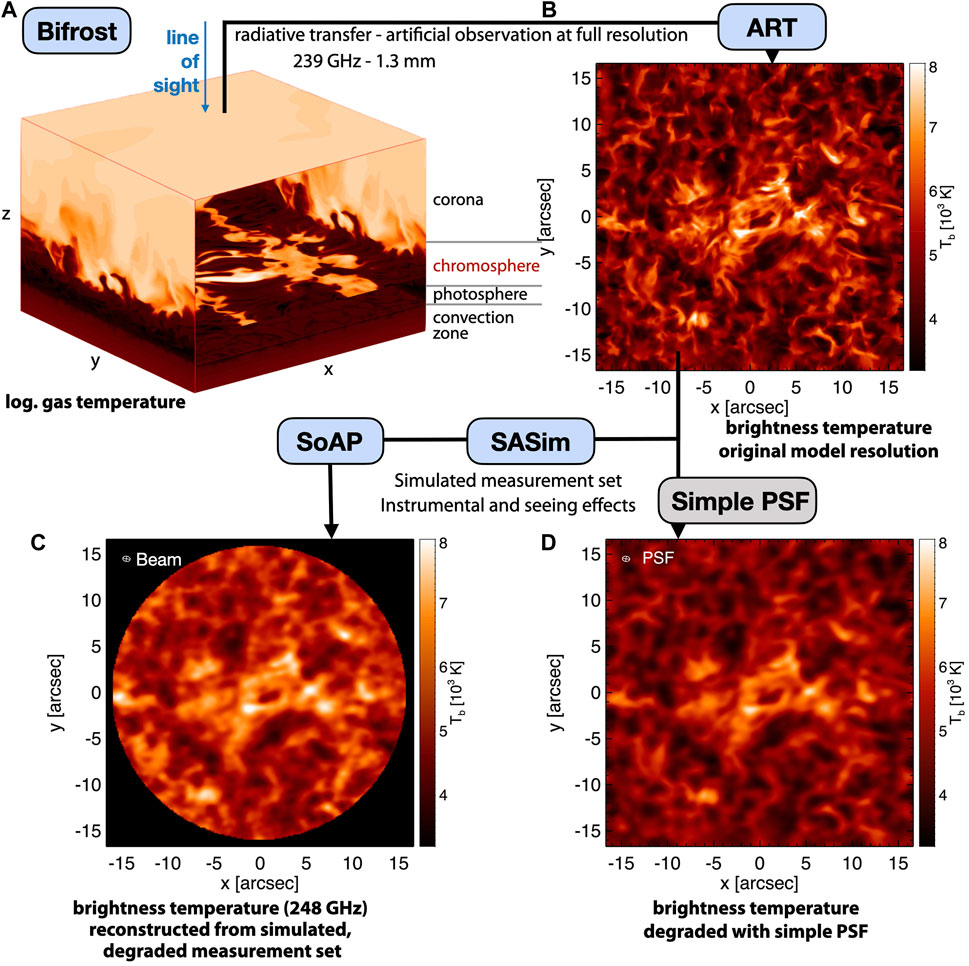
FIGURE 1. Forward modeling of synthetic brightness temperatures at millimeter wavelengths starting with a 3D model snapshot (or a time series of such) from a Bifrost simulation (A). The model features an enhanced network region in the center surrounded by quiet Sun. The radiative transfer calculations with ART produce a brightness temperature map for the selected frequencies [shown here: 239 GHz, (B)] to which then a simple point spread function (PSF) equivalent to an idealized synthesized beam for ALMA can be applied (C). The PSF is shown in the top left corner of the panel. A more realistic simulation of atmospheric seeing and instrumental effects as performed using SASim (and then reconstructed using SoAP) results in stronger degradation (D) of the original image than the simple PSF. It is to be noted that only a moderate example is shown that corresponds to good observing conditions. The synthesized beam is shown in the corner of the reconstructed image in panel (D).
2.2 Spectrum synthesis
In the Sun, continuum radiation is mostly due to thermal emission mechanisms as discussed in Section 2.2.1 but non-thermal emission needs to be taken into account in flares (see Section 2.2.2). As discussed in the following section, this results in particular requirements for the forward modeling of meaningful millimeter radiation.
2.2.1 Thermal radiation
At (sub-)mm wavelengths, the main source of opacity is due to thermal free-free absorption (bremsstrahlung) from electron-ion free–free encounters and H− (see, e.g., Dulk, 1985; White et al., 2006; Wedemeyer et al., 2016). In other words, the free–free emission originates when free thermal electrons collide with ambient ions and atoms, the total amount of which depends on the electron and ion density, chemical composition, and temperature. All these three inputs vary strongly in the solar atmosphere. In particular, the thermal radiation continuum is sensitively dependent on the local electron density (or line-of-sight electron density). In the presence of a strong magnetic field, additional contribution from gyro emission (Anfinogentov et al., 2019) needs to be taken into account (see the following section).
Many radiative transfer codes commonly use electron densities derived from local plasma properties such as the gas temperature to calculate the thermal free–free emission under the assumption of instantaneous LTE conditions. As demonstrated convincingly by Carlsson and Stein (2002), the rapid variations of the plasma properties in the solar chromosphere due to propagating shock waves in combination with finite hydrogen ionization and recombination time scales result in significant deviations of the electron density from equilibrium values. A realistic calculation of synthetic continuum intensity maps at millimeter wavelengths therefore requires detailed non-equilibrium electron densities as input (see, e.g., Leenaarts and Wedemeyer-Böhm, 2006). However, including non-equilibrium hydrogen ionization in numerical 3D rMHD simulations is computationally expensive, resulting in only a small number of adequate simulations so far (Gudiksen et al., 2011; Loukitcheva et al., 2015; Carlsson et al., 2016).
Figures 2, 3 show the formation of the thermal continuum along vertical slices of two snapshots from publicly available3 Bifrost simulations: en_024048_hion—an enhanced network simulation, including non-equilibrium hydrogen ionization, and ch024031—a coronal hole simulation with LTE ionization. The heights at which the optical depth (τ) equals one are marked as a proxy for the formation height for simplicity. We note that, however, the contribution functions of the (sub-)mm continuum can potentially be wider and consist of several peaks due to the often complicated structure of the chromosphere leading to multiple optically thin contributions along the line of sight. Some ALMA observations indeed show occasional contributions from several layers (Wedemeyer et al., 2020a). For a detailed insight into the layers that actually contribute to the emission at any given wavelength, these more detailed contribution functions should be considered (e.g., Loukitcheva et al., 2015). The corrugated surfaces of optical depth unity—as corrugated as the chromosphere itself—underscore that the frequencies observed using ALMA probe different heights of the atmospheres at different spatial locations. Therefore, classical semi-empirical models of averaged spectra should be used with caution when interpreting spatially/temporally resolved data. The histograms in Figure 3 show that the formation heights [z (τ = 1)] are, on average, lower in the coronal hole atmosphere than in the enhanced network. Both the magnetic topology and detailed ionization balance influence the formation of the millimeter continuum through changes in the electron/proton densities and temperature, directly affecting the free–free opacities. Simulations of more active conditions naturally lead to higher formation heights than in quiet conditions (Martínez-Sykora et al., 2020). This is true even if non-equilibrium effects are not taken into account because the higher densities in ARs lead to higher (sub-)mm opacities (e.g., da Silva Santos et al., 2022a).
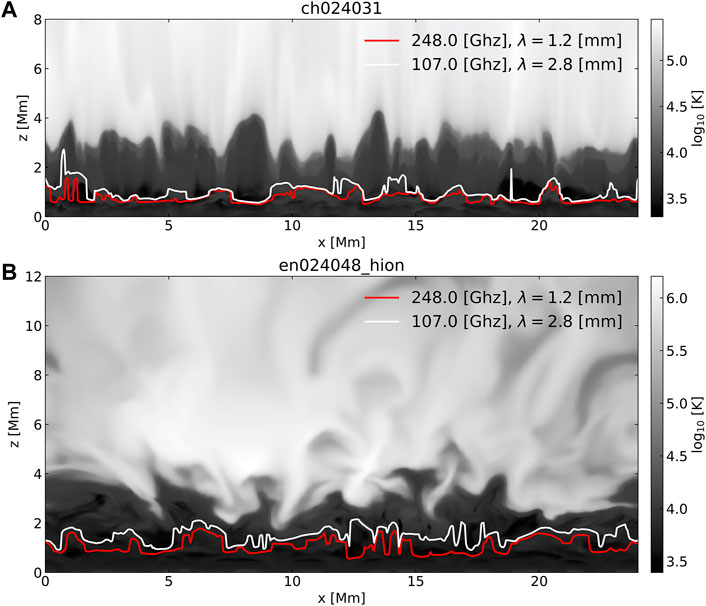
FIGURE 2. Simulated logarithmic gas temperature (gray-scale) in vertical slices of two 3D rMHD Bifrost simulations: (A) coronal hole and (B) enhanced network region. The solid lines represent the heights at which the optical depth is in unity at a wavelength of 1.2 mm (red) and 2.8 mm (white), which correspond to ALMA bands 6 and 3, respectively (see also Figure 3). It is to be noted that these heights are only rough proxies of typical formation heights, whereas the contribution functions can have multiple peaks along the line-of-sight as a result of the complicated thermal structure as can also be seen from the temperature response functions in Figure 4.
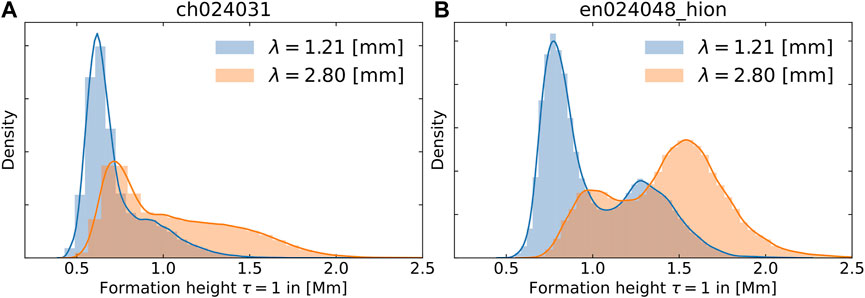
FIGURE 3. Distributions of the heights of optical depth unity [z (τ = 1)] for the two Bifrost models shown in Figure 2 for the continuum at 1.2 mm (blue) and at 2.8 mm (orange): (A) coronal hole and (B) enhanced network region.
Interestingly, even though the Bifrost-enhanced network simulation includes much of the relevant chromospheric physics, the averaged synthetic brightness temperatures in en_024048_hion are lower than what ALMA observations suggest. Loukitcheva et al. (2015) reported that
While there are several codes that can be used for the synthesis of millimeter continuum radiation, the Advanced Radiative Transfer (ART; de la Cruz Rodríguez et al., 2021) code was developed with the aim of providing a very fast tool for the synthesis of millimeter continuum maps. ART uses non-equilibrium electron densities as provided by 3D simulations with Bifrost (Gudiksen et al., 2011) and 1D RADYN simulations (Carlsson and Stein, 1992), but otherwise assumes LTE conditions. The high computational throughput of ART makes it possible to quickly produce time series, even for all individual spectral channels of ALMA instead of just one representative wavelength per (sub-)band. ART has been used by Wedemeyer et al. (2020a) and Eklund et al. (2021a,b). An example is given in Figure 1B. As a comparison, RH 1.5D (Uitenbroek, 2001; Pereira and Uitenbroek, 2015), MULTI (Carlsson, 1986), and ART were used to synthesize ALMA band 3 radiation from a 1D RADYN simulation. The simulation, which was intended as a first experiment toward nano-flares, included a beam of electrons injected during a time interval of 10 s in an initial atmosphere which is then left to evolve. The differences in brightness temperatures between the results from the three codes, which for this experiment did not contain any non-thermal contributions, agreed within ≲ 15% while the beam was injected and on average less than 6% during the rest of the time.
Fleishman et al. (2021a) extended the theory of free–free emission to the case where the plasma can be composed of many chemical elements in various temperature-dependent ionization states. The theory takes into account that the plasma, in any resolution element (voxel), can have a distribution of the temperature described by the differential emission measure (DEM), rather than a single value of the temperature. Fleishman et al. (2021a) found that the chemical elements can enhance the free–free emission intensity by up to 30% depending on the plasma temperature. In the relatively cool chromosphere, where the plasma is only partly ionized, the code takes into account collisions of free electrons with neutral hydrogen and helium. The effect of the magnetic field on free–free polarization is also taken into account according to the exact magneto-ionic theory, which is important for modeling free–free emission from the chromosphere (Loukitcheva M. et al., 2017). Another effect controlled by the magnetic field is gyroresonant emission due to enhanced opacity of the emission at several gyroharmonics—integer multiples of the gyrofrequency (that is proportional to the ambient magnetic field). Fleishman et al. (2021a) extended the theory of gyroresonant emission to the case of multi-temperature plasma, which required introducing an additional differential density metrics (DDM) complementary to DEM. The code is fully open and available (see Kuznetsov et al., 2021). Although the main contribution to the radio emission at frequencies greater than ∼ 100 GHz (ALMA band 3 and above) comes from the chromosphere, coronal contributions are not negligible in ALMA bands 1 and 2, and the described code is needed to properly model and isolate the coronal contributions. In particular, the gyroresonant contribution can be strong at 34 GHz and above (Anfinogentov et al., 2019). In addition, the coronal contribution dominates at microwave frequencies, which bear extremely useful complementary information.
2.2.2 Non-thermal radiation
Non-thermal radiation is emitted by non-thermal electrons accelerated in solar flares or relativistic positrons produced due to nuclear interactions (Fleishman et al., 2013). The dominant emission mechanism is gyrosynchrotron emission due to spiraling of charged particles in the ambient magnetic field, while free–free emission is often important as well (see Fleishman et al. in this special issue). The theory of gyrosynchrotron emission is well-developed, but the expressions for the emissivity and absorption coefficients are cumbersome and computationally expensive. To facilitate the computation of gyrosynchrotron emission, Fleishman and Kuznetsov (2010) developed fast gyrosynchrotron codes that programmatically increase the computation speed by orders of magnitude. The initial versions of the codes permitted only a limited set of analytical distribution functions of the electrons over energy and pitch-angle to be employed in the computations. To facilitate numerical modeling with a broader range of numerically defined distribution functions, Kuznetsov AA. and Fleishman GD. (2021) extended the codes for the case of distribution functions defined by numerical arrays. This new version of the code (Kuznetsov A. and Fleishman G., 2021) also employs the improved treatment of the free–free emission described in Section 2.2.1.
2.3 Simulation of atmospheric seeing and instrumental effects
In order to ensure a fair and meaningful comparison between observations and synthetic observables based on numerical models, in principle, all effects due to the telescope and instrument, data processing, and Earth’s atmosphere must be considered in detail. Typically, for simplicity but often also in lieu of insufficient knowledge of the aforementioned factors, just the (modeled) telescope point spread function (PSF) is applied to synthetic intensity images, resulting in the degradation of the image to the same angular resolution as in the observations. Moreover, such PSFs are often very simplified as contributions such as stray light are usually not known (Wedemeyer-Böhm and Rouppe van der Voort, 2009). For such comparisons, it should therefore be kept in mind that the degradation effects applied to synthetic images tend to underestimate their effect.
Properly taking into account instrumental and seeing effects is even more challenging for interferometric imaging as performed with ALMA. For solar observations, ALMA’s 12-m array with up to 50 12-m antennas and the Atacama Compact Array (ACA) with up to 12 7-m antennas are correlated, including heterogeneous baselines, resulting in time series or mosaics. At the same time, the up to 4 total power (TP) antennas scan the whole disk of the Sun. The obtained visibility data are later calibrated before the brightness temperature maps are reconstructed via an involved deconvolution and imaging process, which is typically based on the CLEAN algorithm (Högbom, 1974; Rau and Cornwell, 2011). The resulting final synthesized beam, which is a byproduct of the CLEAN procedure, typically has an elliptical shape that changes with time as a result of the changing position of the Sun in the sky and, thus, the corresponding varying viewing angles of the array. While the synthesized beam is equivalent to a PSF and can thus be applied to synthetic intensity maps to match the resolution (see Figure 1C), it is still a simplification of the complicated instrumental setup described previously. An even more severe instrumental effect is the sparse sampling of the spatial Fourier space (“(u, v)-plane”), which is a direct result of the limited number of baselines between antennas. This effect is often compensated by following the source as it moves over the sky with time, thus filling different components in the uv-space. For the Sun, which changes on short time scales, this so-called rotation synthesis technique is not an option as the small structure would effectively be blurred out. Instead, brightness temperature maps of the Sun have to be reconstructed solely on the interferometric information retrieved over a very short time (“snapshot imaging”). The cadence of solar observations with ALMA has decreased from 2 s to only 1, which is a great capability for observing the highly dynamic chromosphere but is challenging for imaging based on sparse uv-sampling.
The Solar ALMA Simulator (SASim), which was developed in connection with the ESO-funded ALMA development study, “High-cadence Imaging of the Sun” (Wedemeyer, 2019), addresses this problem by aiming at a more realistic simulation of the degradation effects, including the atmosphere above ALMA, interferometric observations, and the imaging process. As input, the SASim uses currently synthetic millimeter brightness temperature maps that are produced with ART from a Bifrost simulation with snapshot output at 1 s cadence. Based on the simobserve task as part of CASA4, the maps are then converted into measurements set similar to what is produced from real ALMA observations of the Sun. In the process, the antenna configuration and the degradation properties of Earth’s atmosphere are prescribed. The resulting synthetic measurement set, which is an artificial ALMA observation of the Sun, is then used as input for the same deconvolution and imaging tool as real observations. For this purpose, the Solar ALMA Pipeline (SoAP) is used (Wedemeyer et al., 2020a; Henriques et al., 2022). An example is given in Figure 1D. Such artificial simulation-based observations enable the optimization of the imaging process as the resulting reconstructed images can be compared to the original (i.e., the SASim input) images for different imaging parameter combinations until the best match between the input and output is found. While this procedure is still computationally expensive, it will support the development of new and/or improved observing modes in the future and provide more realistic means for comparing observations with adequately degraded synthetic brightness temperature images.
3 Advanced reconstruction of model atmospheres from ALMA observations
3.1 Data inversion
Modern inversion techniques allow inferring the physical parameters of model atmospheres from the reconstruction of observed spectropolarimetric data. The model typically includes the stratification of temperature, line-of-sight velocity, microturbulence, and the three components of the magnetic field as a function of column-mass or continuum optical-depth at a reference wavelength. Inversion techniques have been applied systematically to study photospheric datasets with different levels of complexity (Ruiz Cobo and del Toro Iniesta, 1992; van Noort, 2012; Ruiz Cobo and Asensio Ramos, 2013; Scharmer et al., 2013; Pastor Yabar et al., 2021) under the assumption of LTE.
The extension of such inversion methods to chromospheric applications was possible by the assumption of statistical equilibrium and plane-parallel geometry in order to calculate the atom population densities (Socas-Navarro et al., 2000). The most used diagnostic has been the Ca ii 8542 Å line (e.g., Pietarila et al., 2007; de la Cruz Rodríguez et al., 2013; Henriques et al., 2020). More recently, the inclusion of lines originating from multiple species and the inclusion of partial redistribution effects have been made possible with the STiC code (de la Cruz Rodríguez et al., 2019), which has enabled the application of inversion methods to datasets including the Mg ii h&k lines (e.g., de la Cruz Rodríguez et al., 2016; Gošić et al., 2018; Sainz Dalda et al., 2019) and Ca ii H&K lines (Esteban Pozuelo et al., 2019; Vissers et al., 2019; Morosin et al., 2022).
The depth-resolution that can be achieved by inversions greatly depends on the number of spectral diagnostics (lines and continua) included as constraints in the process, as well as their sensitivities to the different regions represented in the model. The inclusion of more diagnostics improves the depth resolution and reduces potential degeneracies in the reconstructed model. However, because of the non-locality of the radiation field in the chromosphere and the consequent decoupling of the source function from the local temperature stratification, NLTE inversions can fail to accurately constrain temperature stratification in the chromosphere, especially when only one spectral line is included in the inversion.
ALMA millimeter observations provide a powerful diagnostic for chromospheric inversions (da Silva Santos et al., 2018). At those wavelengths, the background continuum samples the chromosphere and the source function can be described by the Planck function. However, while ALMA radiation can be described in LTE, the continuum opacity is set by the electron density and the hydrogen ionization/recombination balance, which are far from LTE in the chromosphere, and time-dependent NLTE hydrogen ionization should be included in the calculations (Leenaarts and Wedemeyer-Böhm, 2006; Leenaarts et al., 2007, see also Section 2.2.1). Inversion methods are not sufficiently developed to include time-dependent hydrogen ionization yet. An alternative approach, which is more accurate than assuming LTE, is to calculate H ionization in statistical equilibrium and account for this NLTE contribution in the electron densities by imposing charge conservation in each NLTE iteration. The STiC inversion code (de la Cruz Rodríguez et al., 2019) allows performing such calculations as part of the spectroscopic inversion process. To illustrate the importance of this effect, we have calculated the temperature response function (RF) along a vertical slice from a 3D rMHD simulation (cf. Section 2.1) in LTE, using the proposed statistical equilibrium approach (see Figure 4). The response function is representative of the sensitivity of each grid cell to temperature perturbations. For both receiver bands, the LTE response function has significant peaks around heights of 0.8 and 1.2 Mm. While the peak at the lower height tends to be more prominent for band 6 than for band 3, there are many locations for both bands where peaks at both heights occur, resulting in bimodal RFs. When NLTE H ionization is included in the calculation, the response function generally becomes less localized, basically extending across a height range from as high as 1.8–2.0 Mm to as low as
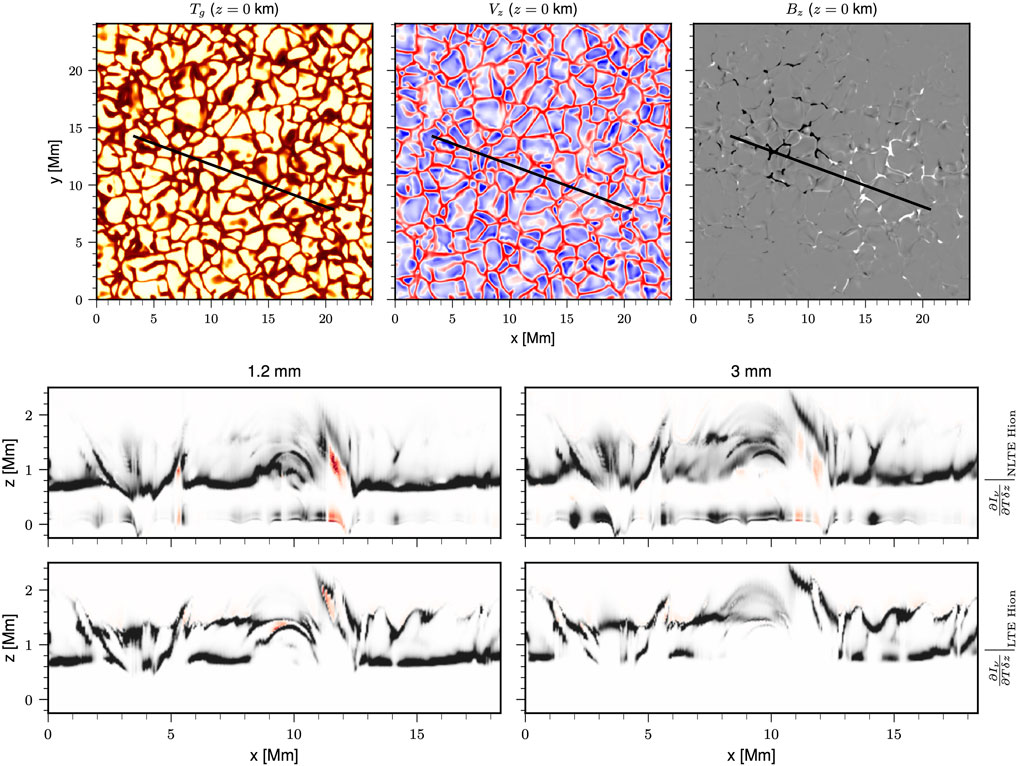
FIGURE 4. Temperature response function computed with the STiC code at 1.2 mm and 3 mm from a vertical slice of a 3D MHD model (Carlsson et al., 2016). In the middle row, the response function has been calculated with an NLTE equation-of-state where the hydrogen population densities are calculated in statistical equilibrium and charge conservation has been imposed in order to calculate the electron density. In the bottom row, an LTE case is shown. For context, we have indicated the location of the slice in the upper row over-imposed on the photospheric temperature, the line-of-sight velocity, and the vertical component of the magnetic field vector.
While it is not possible to constrain all the inversion parameters using ALMA continuum observations alone, the combination of ALMA data with spectroscopic/spectropolarimetric datasets from other facilities such as DKIST, the 1-m Swedish Solar Telescope (SST), BBSO, or NASA’s IRIS satellite is extremely powerful in inferring atmospheric models. For example, da Silva Santos et al. (2020a) utilized datasets from the IRIS and ALMA to constrain the average value of microturbulence in plage down to approximately 5 km s−1 within the range of the optical depths probed by the Mg II h and k lines (log τ500 nm = [ − 6, −4]) using STiC. Furthermore, da Silva Santos et al. (2022b) used co-temporal SST/CRISP and ALMA observations to reconstruct a model atmosphere of an AR undergoing magnetic reconnection (Figure 5). The rightmost panels in Figure 5 show that the addition of the continuum intensities at 3 mm to NLTE inversions of the Fe i 6173 Å and Ca ii 8542 Å lines observed by CRISP has a significant impact on the inverted temperatures in the chromosphere (log τ500 nm
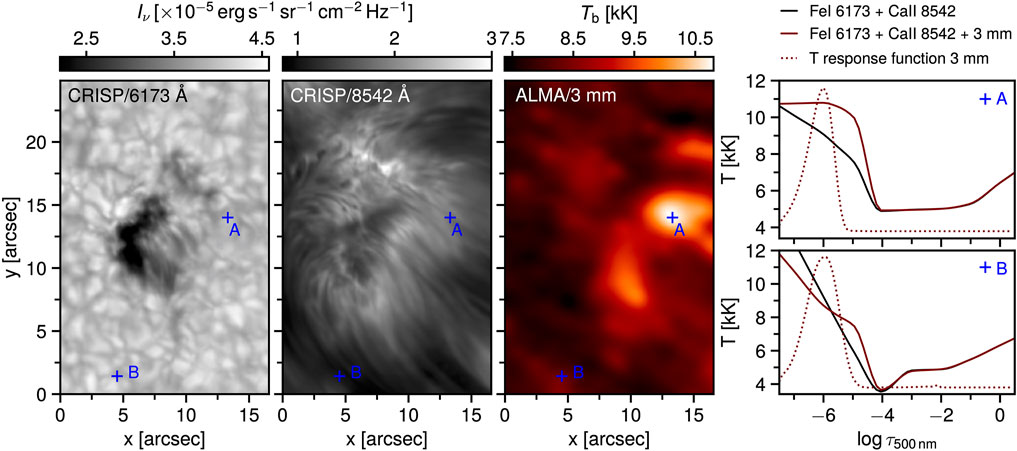
FIGURE 5. NLTE inversions of SST/CRISP and ALMA observations of an active region (da Silva Santos et al., 2022a). From the left to the right: intensities in the continuum at 6173 Å and in the core of the Ca II 8542 Å line, ALMA band 3 brightness temperature map, temperature as a function of the logarithmic optical depth (solid lines) derived from CRISP and CRISP + ALMA inversions at the locations A and B, and temperature response functions at 3 mm in arbitrary units (dotted lines) for the CRISP + ALMA models.
Inverse modeling of ALMA brightness temperature maps along with spectroscopic or spectropolarimetric observations at higher frequencies entails several challenges in data acquisition and analysis, such as the non-simultaneity of the observations at different wavelengths, significant differences in spatial resolution, the uncertainties in the absolute flux calibration, and the simplifying assumptions in inversion codes, namely, hydrostatic equilibrium and 1D radiative transfer. Therefore, improving data inversions is ongoing work with large scientific potential but also requires further coordinated campaigns between ALMA and other observatories in order to produce the needed datasets.
3.2 Magnetic field reconstructions
Probing and modeling the coronal magnetic field is a key challenge in solar physics. Measurements of the coronal magnetic field are difficult and yet very rare (e.g., Lin et al., 2004; Brosius and White, 2006; Wiegelmann et al., 2014; Schad et al., 2016; Casini et al., 2017; Kuridze et al., 2019), giving modeling of the coronal magnetic field an even more important role. The most easily accessible, routine approach to this modeling is the use of nonlinear force-free field (NLFFF) reconstruction (e.g., Wiegelmann and Sakurai, 2012; Wiegelmann et al., 2014). Typically, such reconstructions are initiated with a vector boundary condition derived from a routine Zeeman diagnostics at photospheric heights. A challenge associated with this boundary condition is that the magnetic field is not necessarily in a force-free state in the photosphere, which is in conflict with the assumption that the field is force-free.
Fleishman et al. (2019) developed an advanced NLFFF code that can use additional (to the photospheric ones) magnetic constraints at various locations and various heights in the chromosphere and/or corona while performing the NLFFF reconstruction. The quality of the NLFFF reconstruction increases notably the more complete the set of additional constraints is. In this regard, multifrequency imaging spectropolarimetry in various ALMA spectral bands would enable measurements of the LOS magnetic field component at different chromospheric heights (Loukitcheva M. et al., 2017). Adding these measurements to the NLFFF reconstruction code promises a much improved magnetic model of a given AR. The necessary observing modes and post-processing steps are still under development but might be offered in the coming years, possibly starting with full polarization observations of the Sun in band 3 from as early as cycle 10 (i.e., 2023–24).
4 Examples of scientific applications
4.1 Atmospheric stratification and center-to-limb variation
When observing the solar atmosphere not directly from the top but at an inclined viewing angle (i.e., μ = cos θ < 1), the line-of-sight traverses a longer path through the solar atmosphere for a given height difference, resulting in optical depth unity higher up in the atmosphere. As the change in viewing angle corresponds to the variation from observations at different distances from the disk-center (μ = 1) toward the limb (μ = 0), observations of the center-to-limb variation of the continuum emission contain information about atmospheric stratification (i.e., the height dependence of the underlying plasma properties) and can thus be used to constrain models of the solar atmosphere (see, e.g., Brajša et al., 2018). Alissandrakis et al. (2017, 2020) used ALMA brightness temperatures maps in the range ∼1–3 mm at different positions on the solar disk to infer a relation between kinetic temperature and optical depth, which was shown to be consistent with the widely used FALC QS model (Fontenla et al., 1993) within uncertainties. Using ALMA observations, Sudar et al. (2019) determined lower limits for the limb-brightening effect on the order of 10% in band 3 and 15% in band 6. These results agree with the range of values independently derived by Menezes et al. (2022). Such empirically derived model atmospheres provide crucial tests for numerical models (Section 2.1) for which the center-to-limb variation of the (sub-)mm can be computed by repeating the radiative transfer calculations (Section 2.2) under varying viewing angles.
4.2 Small-scale dynamics in quiet Sun regions
As established by observations using other chromospheric diagnostics such as the Ca ii K line, internetwork QS regions exhibit a highly dynamic mesh-like pattern produced by the interaction of ubiquitous propagating shock waves (e.g., Wöger et al., 2006), unless obscured by overlying fibrilar structures outlining the magnetic field. The expected appearance of these signatures of chromospheric shock waves at (sub-)mm wavelengths had already been simulated based on 1D simulations (Loukitcheva et al., 2004) and 3D simulations (Wedemeyer-Böhm et al., 2005, 2007) before the advent of ALMA. The simulations confirmed that sufficient spatial resolution, which is particularly challenging at (sub-)mm wavelengths, and a high temporal cadence are essential for enabling the detection of shock waves. However, the viewing angle and, thus, the location on the solar disk also impact the detectability of shock waves due to the potential superposition of structures at different heights along inclined lines of sight (cf. Section 4.1). As a consequence, ALMA is expected to observe the ubiquitous chromospheric shocks in the QS regions with higher contrast at the disk center than closer to the limb (Wedemeyer-Böhm et al., 2007).
As shown in Figure 2 for a Bifrost simulation, the formation height of the millimeter continuum varies significantly when the atmosphere is buffeted by shock waves. Consequently, the brightness temperature increases temporarily by up to several thousand kelvin, as long as the shock structure remains optically thick at a given wavelength (Eklund et al., 2021b). Comparable ALMA observations show bright small-scale features in the QS regions with typical lifetimes of ∼ 1–2 min and amplitudes of a few hundred kelvin above the background (Eklund et al., 2020; Nindos et al., 2021). Taking into account the impact of ALMA’s limited spatial resolution on the appearance of small-scale structures and the resulting reduction of the amplitudes of the dynamic bright features, the detected bright features are consistent with upward propagating shocks as predicted by numerical simulations (Eklund et al., 2020). Figure 1 shows the shock-induced chromospheric pattern before and after applying the effects of limited spatial resolution to simulated millimeter continuum images. The amplitude reduction of bright features in the Bifrost simulation at wavelengths corresponding to all ALMA receiver bands 3–10 (0.34 mm–3.22 mm) and the corresponding spatial resolutions with different ALMA antenna configurations were studied by Eklund et al. (2021a), providing conversion factors that could, in principle, be used to correct the amplitudes of bright features in observational data on a statistical basis, although with large uncertainties. Furthermore, propagating shocks create steep temperature gradients in the atmosphere. As numerical simulations show, the slope of the brightness temperature continuum can, in principle, be used to identify signatures of shocks and also the potential existence of multiple shock components propagating at different velocities as shown by Eklund et al. (2021b). The diagnostic potential of splitting ALMA datasets into sub-bands has recently been shown for the study of propagating transverse waves by Guevara Gómez et al. (2022) and for propagating shock waves by Eklund et al. (Forthcoming 2022).
Shocks may play a significant role in the heating of the quiet chromosphere, but addressing this science case with ALMA beyond pure detection requires follow-up observations with higher spatial resolution than the ones available so far. The use of a wider array of configurations in combination with improved imaging routines has the potential to reach a resolution of a few 0.1″ for ALMA’s higher receiver bands. Determining the exact requirements could be achieved through the modeling approach shown in Figure 1. In addition, studying the propagation of shock waves through the (sub-)mm continuum forming layers by means of the methods introduced in Sections 2, 3, which includes, in particular, inversions and detailed (statistical) comparisons of high-quality ALMA observations and artificial observations based on state-of-the art numerical 3D simulations, promises essential insights into the formation heights of the (sub-)mm continuum as a function of the wavelength and the atmospheric stratification for different regions on the Sun. da Silva Santos et al. (2020a) and Eklund et al. (2020, 2021a) conducted recent studies employing these methods.
4.3 Active regions and flares
Well-developed ALMA diagnostics could contribute significantly to progressing our understanding of the thermal and magnetic properties of ARs and flares. Modeling the magnetic topology of a steady-state AR is now routinely possible based on NLFFF reconstructions constrained by routinely available photospheric vector magnetograms (Fleishman et al., 2015; Fleishman et al., 2021b). At the same time, dynamic phenomena are particularly hard to reproduce in numerical simulations for several reasons: the time scales that need to be resolved span the evolution of ARs (from hours to days) to the rapid changes that occur during flares (i.e., to the fractions of seconds). The spatial scales, likewise, span a large range of values from the large extent of ARs (up to several 10 Mm) to the small computational cell size that is needed to adequately model all relevant processes (on the order of km toward sub-grid modeling at even much smaller scales). Finally, the presence of a stronger-than-average magnetic field, the occurrence of magnetic reconnection across different scales, the resulting impact on the chromospheric dynamics and, of particular relevance here, the emission at (sub-)mm wavelengths pose particularly challenging demands to numerical modeling (cf. Section 2). Consequently, forward modeling of the (sub-)mm continuum intensities emerging from semi-empirical models is therefore a natural starting point and, despite the obvious limitations, a complementary way of gaining an insight into the physics of AR phenomena through detailed comparisons between synthetic and observed brightness temperatures. Currently, there are a few examples of the application of this methodology in the literature. For instance, Loukitcheva MA. et al. (2017) compared brightness temperature measurements of a sunspot at two different wavelengths with the expected values computed from several 1D static, semi-empirical models in the literature and concluded that none of the models provided a good fit for the penumbra. This means that ALMA can provide constraints on the temperature gradient in those structures. Semi-empirical models have also been used to investigate the observed correlation between the width of the H α line and the brightness temperatures at 3 mm in the plage—which was explained based on the mutual dependence of both diagnostics on the hydrogen atom-level populations (Molnar et al., 2019). The agreement between empirical models and ALMA observations can also be improved in an automatic or iterative way using NLTE inversion codes (Section 3.1) when co-temporal spectroscopic observations at optical or ultraviolet (UV) wavelengths are likewise available (da Silva Santos et al., 2020a; de Oliveira e Silva et al., 2022; Hofmann et al., 2022; de Oliveira e Silva et al., 2022). Moreover, one-dimensional time-dependent simulations have been used to study the response of the solar atmosphere to flares. For instance, Simões et al, (2017) used RADYN simulations to evaluate the diagnostic potential of flare emission in the thermal infrared and sub-millimeter range.
As an example of the applications of multi-dimensional numerical models in the context of interpreting ALMA observations of the Sun, the comparison between ALMA band 6 observations of the AR plage supported by IRIS UV spectroscopy and synthetic spectra from a 2.5D Bifrost simulation suggests that an observed bright linear feature emanating from the plage region is an on-disk type-II spicule, confirming their multithermal nature (Chintzoglou et al., 2021a), while other small-scale plage brightenings at 1.25 mm could be signatures of magnetoacoustic shocks (Chintzoglou et al., 2021b). ALMA band 3 observations of the same plage region also show out-of-phase oscillations in brightness temperature, feature size, and horizontal velocities, which are evidence of sausage-mode and kink-mode waves (Guevara Gómez et al., 2021). AR transients akin to UV-bursts (Young et al., 2018) with nanoflare-like energies have been observed in a flux emergence region with band 3, and their characteristics agree with synthetic thermal emission from a 3D Bifrost simulation of flux emergence, showing several magnetic reconnection events (da Silva Santos et al., 2020b). For a microflare detected at 3 mm in coordination with the IRIS and Hinode/XRT by Shimizu et al. (2021), the timing of millimeter brightening with respect to the soft X-rays indicated that the upper chromosphere was being heated by non-thermal particles in this event. Such an effect has also been pointed out by Valle Silva et al. (2019) using lower resolution observations at 1.4 mm with the Solar Submillimeter Telescope. It should be noted that the formation of millimeter continuum emission under flaring conditions, similarly to what has been conducted for quiet conditions (Section 2.2.1), and the interpretation of those diagnostics have been addressed previously within the given instrumental capabilities (see, e.g., Stepanov et al., 1992; Kundu et al., 1993; Silva et al., 1996; Krucker et al., 2013).
Finally, full 3D modeling of ARs and flares requires a 3D model of the magnetic structure to start with, which can be obtained from an NLFFF reconstruction or other means. To make the modeling with such 3D data cubes realistic, a magnetic “skeleton” must be supplied by thermal plasma, non-thermal particles (in case of flares), placed at the right location at the Sun, and supplied by various means for emission computation and meaningful data-to-model comparison. Nita et al. (2015, 2018) developed a powerful dedicated tool, the GX Simulator, designed specifically for the aforementioned goals. More than that, the GX Simulator includes an integrated mean to create a 3D model and an automated model production pipeline (AMPP) with minimal input from the user: only the date and time of the event have to be defined along with the anticipated resolution and sizes of the data cube. Once specified, the AMPP will download all the required magnetic maps obtained with SDO/HMI and other context data and perform magnetic reconstruction, as well as several other steps that are needed to create a 3D model. Then, magnetic flux tube(s) can be interactively created and designated to serve as the model flare loop(s). The user can control the properties of the thermal and non-thermal components in these flaring loops, compute mm/radio, EUV, and X-ray emissions from the model, and compare the synthetic images and spectra with the observed ones, in particular, with ALMA data.
As outlined previously, there are many ways in which the ALMA observations of flares and corresponding numerical models could complement each other in order to advance our understanding of this intricate process that is essential for the heating of the solar atmosphere over a large range of scales from nano-flares to X-class flares and, for stars other than the Sun, even toward mega-flares. Owing to the complexity and still insufficient knowledge regarding central aspects, many simulations necessarily focus on particular parts of the flare phenomenon and/or have to make simplifying assumptions. There are, however, efforts to capture flares self-consistently in full 3D time-dependent simulations as those as attempted with the MURaM simulations by Cheung et al. (2019). Such simulations could be used for calculating the corresponding (sub-)mm emission as it could be observed with ALMA, though they do not include non-thermal particles responsible for a good portion of the flare emission in the ALMA bands yet. The comparison of both would then, as for the other examples described in this article, allow identifying potential shortcomings of the models, which is necessary for future improvements toward a more detailed and complete picture. ALMA observations of flare emission, either with the already available continuum mapping capabilities and even more so with future full polarization capabilities, would provide valuable information complementary to existing flare diagnostics. Unfortunately, to the authors’ knowledge at the time of writing, there are no good examples of flare observations with ALMA yet, maybe except for one microflare reported by Shimizu et al. (2021). Refer to Fleishman et al. in this issue for more information about how ALMA observations could advance our understanding of solar flares.
4.4 Solar prominences
In the field of prominence research, numerical simulations of (sub-)mm radiation observed using ALMA can help in two areas. The first is the visibility of large and small-scale structures of prominences and filaments in the ALMA observations and the connection between the structures observed at (sub-)mm wavelengths and in other parts of the spectrum. Methods that generate such simulated ALMA observations can be based on actual data observed at different wavelengths—e.g., the simulations of prominence fine structure visibility based on Hα observations performed by Heinzel et al. (2015)—or on the synthesis of the radiation at (sub-)mm wavelengths emerging from models of prominence plasma (cf. Section 2). The first synthetic ALMA-like imaging of simulated prominences was conducted by Gunár et al. (2016). These simulated ALMA data represent the way in which the 3D whole-prominence fine structure (WFPS) model of Gunár and Mackay (2015) would appear in different ALMA bands. This model combines realistic 3D magnetic field configurations with a detailed description of the prominence plasma located in the magnetic dips. In doing so, the 3D WPFS model emulates entire prominences with their numerous fine structures and offers high spatial resolution reaching the best potential capabilities of ALMA. However, we should note that the current ALMA observations of prominences (Heinzel et al. (2022a); Labrosse et al., 2022) or filaments (da Silva Santos et al. (2022b), in this special issue) do not reach such a resolution. This is because ALMA has not achieved yet its full potential for solar observations and offers only more compact antenna configurations for solar targets. For more details on the actual and simulated observations of prominences and the predictions of the visibility of prominence fine structures, see the review by Heinzel et al. (2022b) in this special issue.
The second area where numerical simulations can help the prominence research is the understanding of the potential of ALMA observations as diagnostics for the kinetic temperature of the solar plasma. It has been known for some time that a measure of the kinetic temperature of the observed plasma can be derived from simultaneous observations in at least two different (sub-)mm wavelengths (see, e.g., Loukitcheva et al., 2004; Heinzel and Avrett, 2012; Heinzel et al., 2015). However, only recent modeling efforts demonstrated that such a derivation is not entirely straightforward and that in order to achieve sufficient precision, the observed plasma needs to be optically thick at one of those wavelengths and optically thin at the other. It must be noted here that such observations would require a new capability that ALMA is currently not offering and likely will not offer in the near future, namely simultaneous solar observing with two sub-arrays, each in a different receiver band. In the absence of such simultaneous multi-band ALMA observations, thermal properties of the observed plasma can be derived from a combination of ALMA observations and observations in other wavelength ranges, e.g., in the Hα line (see Heinzel et al., 2022a; Labrosse et al., 2022).
The first study of ALMA’s diagnostic potential for determining the properties of prominence plasma was conducted by Rodger and Labrosse (2017). These authors used 2D cylindrical prominence models created by Gouttebroze and Labrosse (2009), both in the iso-thermal iso-baric configuration and in the configuration incorporating the prominence-corona transition region (PCTR). The study by Rodger and Labrosse (2017) showed that the realistic assumption of the presence of multi-thermal plasma along a line-of-sight leads to uncertainties in the determination of the kinetic temperature of the observed plasma. The authors then demonstrated that such uncertainties can be minimized by using ALMA observations at longer wavelengths (e.g., at 9 mm). At such wavelengths, the observed prominence plasma can be expected to be mostly optically thick, leading to reliable diagnostics of its thermal properties.
The relationship between the observed brightness temperature in various ALMA bands and the actual kinetic temperature of the observed plasma was further investigated by Gunár et al. (2018). To do so, these authors used the simulated ALMA observations of Gunár et al. (2016) at wavelengths at which the prominence plasma is optically thin (0.45 mm, corresponding to 666 GHz in band 9) and optically thick (9.0 mm, corresponding to 33 GHz in band 1). The resulting brightness temperature maps and the optical thickness maps are shown in Figure 6. The 0.45 mm and 9.0 mm wavelengths were chosen to assure that the studied plasma is completely optically thin (at 0.45 mm) and, at the same time, that a significant portion of the analyzed prominence is optically thick (at 9.0 mm). However, we should note that at the time of writing, solar observations with ALMA are offered only in bands 3, 5, 6, and 7, while bands 9 and 1 are not available yet. We also note that the current status of the development of band 1 indicates that it will reach a slightly shorter wavelength of 8.6 mm (35 GHz) instead of the 9.0 mm (33 GHz) used here. Moreover, ALMA band 10 will provide access to even shorter wavelengths than those covered by band 9 assumed here.
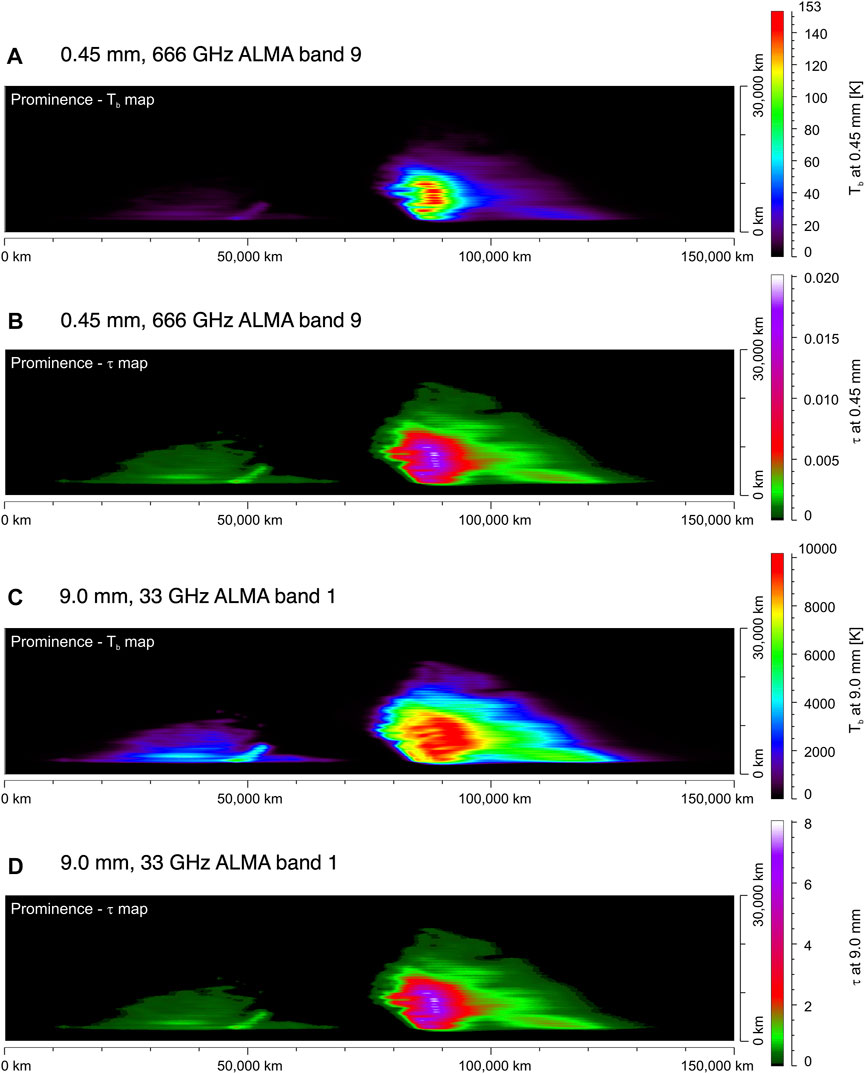
FIGURE 6. Synthetic brightness temperature maps [panels (A, C)] and optical thickness maps [panels (B, D)] showing the 3D whole-prominence fine structure model of Gunár and Mackay (2015) in a prominence view. The top two panels were obtained at a wavelength of 0.45 mm, which corresponds to the 666 GHz ALMA band 9. The bottom two panels were obtained at a wavelength of 9.0 mm (33 GHz ALMA band 1). Displayed color scales are unique for each panel. Adapted from Gunár et al. (2016).
The results of the study by Gunár et al. (2018) confirmed that the brightness temperature simultaneously measured by ALMA in the aforementioned bands can be used to derive the kinetic temperature in every pixel of the observed prominences, e.g., using the method described in Section 3 of Gunár et al. (2018). However, not all of the derived values of kinetic temperature accurately represent the thermal conditions of the plasma distributed along the lines-of-sight passing through individual pixels because the observed prominence cannot be generally assumed to be optically thick (i.e., have optical thickness above unity) in all pixels, even at the 9.0 mm wavelength. This can be clearly seen in the optical thickness map in Figure 6D, where large parts of the modeled prominence have an optical depth of τ9.0 mm < 1. Therefore, without the added information about the actual optical thickness, which is in this case provided by the model, the derived values of the kinetic temperature cannot be automatically assumed to be accurate in all pixels. This is because the basic approximation of the method used to derive the kinetic temperature is not valid if the plasma is not optically thick. Owing to the use of numerical simulations, Gunár et al. (2018) determined that the kinetic temperature values obtained in pixels with an optical thickness larger than 2 typically have an accuracy better than 1,000 K compared to the true kinetic temperature of the studied plasma. Such a study was possible because the authors used realistic numerical simulations, demonstrating the essential value of simulations for testing adequate methods for the interpretation of observations.
The 3D WPFS model of Gunár and Mackay (2015) contains detailed information about the properties of the prominence plasma including its kinetic temperature. Using the (sub-)mm radiation synthesis method described by Gunár et al. (2016), the authors could synthesize the specific intensities at any wavelength along any LOS crossing the simulated prominence. That led to an ideal set of co-spatial simulated observations (Figures 6A, C) coupled with the implicit knowledge of the corresponding optical thickness (Figures 6B, D). A major problem lies in the fact that the optical thickness values are not explicitly known based on ALMA observations alone—but can be derived from other observations, such as those in the Hα line (see Heinzel et al., 2015; Heinzel et al., 2022a; Labrosse et al., 2022). However, Gunár et al, (2018) showed that with the use of numerical simulations, it is possible to determine a criterion for the minimum value of the measured brightness temperature in the optically thin wavelengths (in this case, at 0.45 mm) above which the optical thickness at the optically thick wavelengths is, with great confidence, higher than the required value. The second part of the study conducted by Gunár et al. (2018) showed that the values of the kinetic temperature derived from the ALMA observations correspond to the mean kinetic temperature of the observed plasma weighted by the contribution function of the emission in the optically thick wavelengths. For more details see Sections 5–7 of the study by Gunár et al. (2018).
4.5 Coronal rain
In addition to the large prominence structures discussed in Section 4.4, condensation phenomena occur far more frequently in the solar corona in the form of coronal rain. This phenomenon, which is also thought to be the seeds leading to prominences, corresponds to cool (103–105 K) and dense (1010–1012 cm−3) plasma occurring in a timescale of minutes seemingly condensing out of nowhere at coronal heights, and flowing predominantly downward along loop-like trajectories under the action of gravity and gas pressure mainly (Kawaguchi, 1970; Leroy, 1972; Foukal, 1978; Antolin and Rouppe van der Voort, 2012). The leading explanation for coronal rain is thermal instability (TI) within a structure in thermal non-equilibrium and, therefore, reflects mostly the MHD thermal mode becoming unstable and generating a condensation from the localized loss of pressure (Antiochos et al., 1999; Antolin, 2020). Numerical simulations have shown that the easiest path toward thermal instability within a structure such as a coronal loop is to have strongly stratified and high-frequency heating (Klimchuk and Luna, 2019). This state, known as thermal non-equilibrium (TNE), leads to TNE cycles for heating that remain largely unchanged over time. The details of this process and the various observable signatures can be found in the study by Antolin and Froment (2022).
Various properties of coronal rain remain poorly understood. Similar to prominences, the observed rain morphology is filamentary (also known as multi-stranded) and clumpy, whose widths (a few hundred km size) are interestingly very similar to the smallest widths detected for EUV strands in high-resolution observations with Hi-C (Williams et al., 2020). It has been hypothesized that such sizes are set by granular spatial scales (Martínez-Sykora et al., 2018). This is supported by self-consistent 2.5D rMHD numerical simulations with Bifrost (see Figure 7 and also Section 2.1) but the details of this process remain unclear (Antolin et al., 2022). Observational validation could come from multi-instrument observations with ALMA (using extended array configurations with correspondingly high angular resolution) and IRIS simultaneously observing a bright point and its indirect effects (coronal rain) on the upper atmosphere. While dense, the very small sizes of the clumps make them optically thin most of the time in spectral lines in the optical and UV spectrum such as Hα and Mg ii k&h line (Antolin and Rouppe van der Voort, 2012; Antolin et al., 2021), and cannot be resolved in the present ALMA configuration. However, extended array configurations with higher resolution should allow their detection. This can be confirmed by forward modeling of Bifrost simulations with coronal rain (see Figure 7), demonstrating once more the essential role of numerical simulations for developing adequate observing modes.
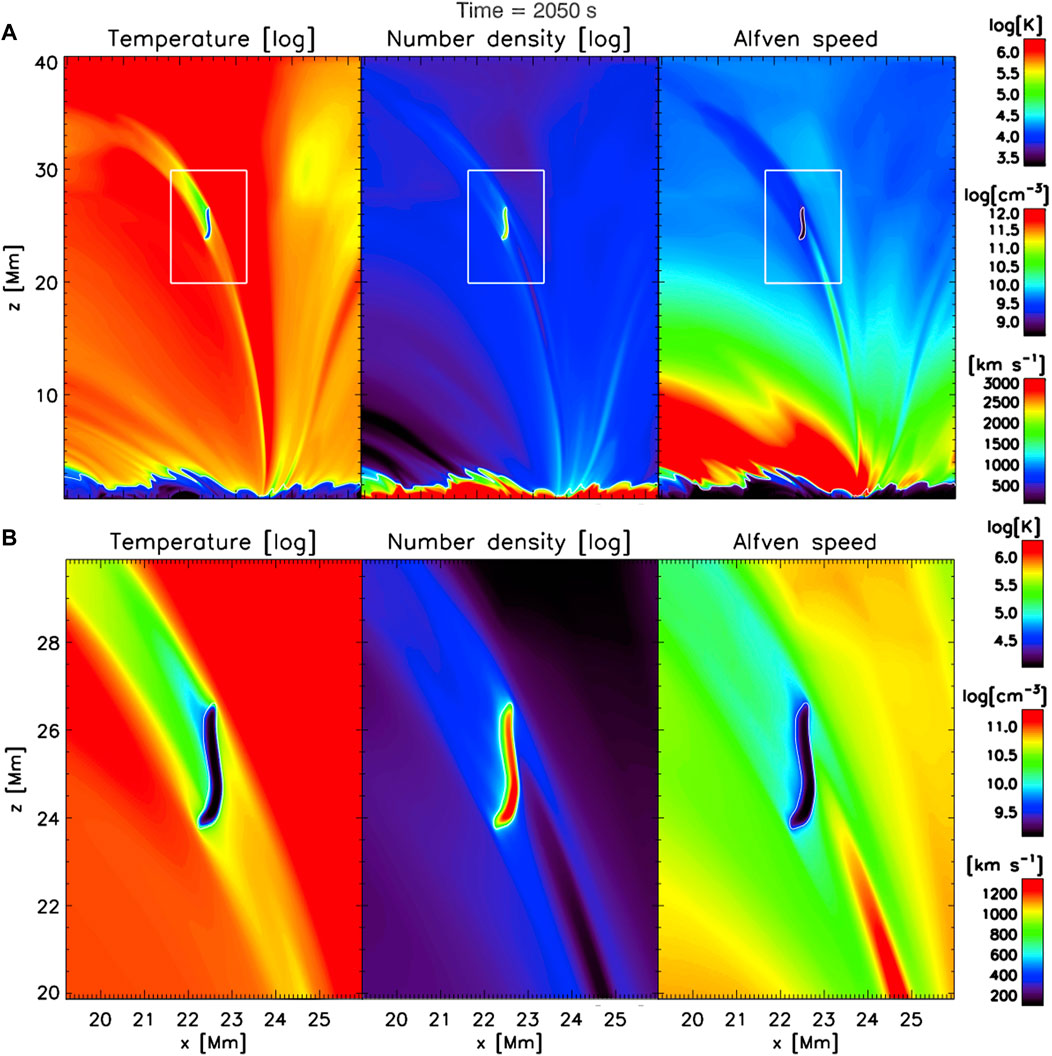
FIGURE 7. Coronal rain event self-consistently produced in a 2.5D rMHD simulation with Bifrost (Section 2.1). (A) (Left to right): snapshot of the temperature (log), mass density (log), and Alfvén speed in a portion of the modeled atmosphere. Thermal instability occurs locally in a coronal loop that is in a state of thermal non-equilibrium, thereby leading to the formation of a condensation (coronal rain clump) falling toward the loop footpoint. (B) (same quantities in same order) shows the white rectangular inset seen in the upper panels (the three color bars on the right of each row correspond uniquely to that particular row). Taken and adapted from Figures 2, 3 of Antolin et al. (2022).
Most coronal rain clumps do not occur in isolation independently from each other. Rain clumps are produced in groups called showers (Antolin and Rouppe van der Voort, 2012) due to a syncing cross-field mechanism known as sympathetic cooling (Fang et al., 2013). These showers have been found to successfully identify coronal loops in the “coronal veil” produced by optically thin radiation (Sahin and Antolin, 2022; Malanushenko et al., 2022). The detection and quantification of rain showers is important for coronal heating since it is a proxy for the coronal volume in TNE (and thus subject to specific spatial and temporal heating conditions). The detection of showers using ALMA remains a target that should be feasible at medium resolution as it is currently offered. The fact that no rain showers have been detected using ALMA so far may be simply due to a lack of off-limb observations (with good seeing conditions) of an AR and the additional complexity of interferometric imaging off-limb. Also, low opacity of rain showers at ALMA wavelengths might prevent their detection. The latter can and should be checked through forward modeling of numerical simulations with, e.g., Bifrost.
Coronal rain has been shown to be largely multi-thermal with probably high ionization levels due to its relatively low lifetime. A very thin corona condensation transition region (CCTR) is expected at the boundaries of rain clumps (similar to the PCTR for prominences), with different plasma conditions ahead and behind the condensation due to a piston-like effect produced by the downward motion (Antolin et al., 2022). Accordingly, the pressure restructuring is expected to be the leading cause for the observed lower than free-fall speeds (Schrijver, 2001). An interesting mass–velocity relation has been numerically obtained but remains to be observationally validated (Oliver et al., 2014). The good correlation between Hα intensity and brightness temperature measured by ALMA in prominences (Heinzel et al., 2022a; Labrosse et al., 2022) suggests that ALMA could also serve as a proxy for prominence and coronal rain mass, and therefore, shed light into the mass–velocity relation. Indeed, the emission measure in Hα is known to be strongly correlated to the absolute intensity in Hα (Gouttebroze et al., 1993), and this has been used to infer the densities of rain clumps in Hα observations with the SST (Froment et al., 2020).
Future ALMA observations may be able to provide detailed measurements of the morphological, thermodynamic, and kinematic properties of coronal rain. Such measurements can serve as unique proxies for coronal heating conditions and improve our understanding of fundamental plasma and MHD processes such as thermal instability. As outlined previously, numerical simulations would be essential for several aspects, ranging from the development of adequate observing modes and capabilities to supporting the detailed interpretation of ALMA observations.
5 Summary and outlook
Synthetic brightness temperature maps for millimeter wavelengths based on 3D numerical simulations of the solar atmosphere play an important role in several aspects of solar science with ALMA. First of all, such synthetic observables, for which the connection to the underlying plasma properties in the model is accurately known, have already proven their value for supporting the interpretation of ALMA observations, very much as for other chromospheric diagnostics previously. Another important application of simulation-based observables is the development of (sub-)mm continua as a diagnostic tool for the solar atmosphere. Surprisingly though, the first ALMA observations raised questions regarding even rather fundamental properties such as the exact formation height ranges and their possible variations in time and space, locally and for different types of region. Also, the chromospheric temperatures in 3D simulations (see a comparison in Wedemeyer et al., 2016) tend to be lower than the brightness temperatures observed with ALMA (e.g., Bastian et al., 2017; White et al., 2017; Nindos et al., 2018; Wedemeyer et al., 2020a) although some cooler regions have been observed too (Loukitcheva et al., 2019). The apparent differences with respect to numerical models highlight potentially missing physical ingredients and the need for the further development of models to higher levels of realism as far as computational costs allow. To what extent simulations can reproduce observations and, thus, aid their interpretation depends ultimately on the accessible computational resources and the implementation of efficient and stable numerical schemes and the resulting affordable sizes of computational boxes, grid resolution, and the considered physical processes. An important example in this regard is the need to account for time-dependent hydrogen ionization as it impacts the electron densities in the chromosphere on which the millimeter continuum as mapped by ALMA sensitively depends. Clearly, detailed comparisons to observations, to which solar ALMA observations add a new suite of complementary diagnostics, either directly or with the powerful help of data inversion techniques, serve as crucial tests of models and, as such, of our current understanding of the solar chromosphere. In this regard, it should be noted that such comparisons are limited by the realism of the instrumental models that are used to produce artificial observations. Degradation of synthetic brightness temperature maps with a simple Gaussian would correspond to an ideal telescope with a filled aperture and ignores ALMA’s sparse uv-sampling as an interferometer and also degradation effects due to Earth’s atmosphere (i.e., phase errors) and the handling of noise during the imaging stage. As pointed out in Section 2.3, such tools are under development but also require notable computational effort.
Another valuable application of simulation-based synthetic observables is the justification of resource investments for the development of additional diagnostics and observing modes, e.g., additional ALMA receiver bands and more extended array configurations for, in principle, higher angular resolution. A much awaited capability of ALMA will be full polarization measurements that would facilitate the determination of the magnetic field in the chromosphere. Detailed knowledge of the 3D magnetic field structure of the solar chromosphere (or chromospheric plasma in the corona such as coronal rain) as a function of time at high resolution would be a fundamental game-changer for understanding the dynamics, energy transport, and (local) heating of this still largely elusive but yet important atmospheric layer inside ARs, QS regions, and prominences alike. A fundamental challenge of polarization measurements is, among other things, the low expected degree of polarization outside of ARs, which thus demands high sensitivity and accuracy and a well-developed observing mode, reliable calibration, and advanced processing/imaging routines (see, e.g., Grebinskij et al., 2000; Fleishman et al., 2015; Loukitcheva M. et al., 2017; Wedemeyer et al., 2020b, and references therein). The development of these components is usually hampered by the insufficiently known “ground truth” against which the data should be compared to. Forward modeling of artificial polarization measurements based on numerical 3D rMHD simulations would also play a very important role here, similar to what is attempted for continuum brightness temperatures.
The scientific potential of ALMA observations of the Sun is promising but requires significant effort and resources to be fully unlocked due to the complexity of the instrument and the observational targets, namely, the dynamic and intermittent chromosphere, both in a quiescent and active state, the atmosphere above ARs including the often dramatically evolving coronal magnetic field (Fleishman et al., 2020), and non-thermal electrons in solar flares (Fleishman et al., 2021b). The resulting challenges for numerical modeling of the chromosphere, prominences, and the flaring corona, their appearances at the wavelengths observed using ALMA, and not least, the impact of ALMA’s complex instrumental properties pose critical tests of our current understanding that will inspire future progress.
Data availability statement
Publicly available datasets were analyzed in this study. These data can be found at: Atacama Large Millimeter/submillimeter Array (ALMA), https://almascience.nrao.edu/aq/, Solar ALMA Science Archive (SALSA), http://sdc.uio.no/salsa/ and Hinode Science Data Centre Europe, http://sdc.uio.no/sdc/.
Author contributions
All authors listed have made a substantial, direct, and intellectual contribution to the work and approved it for publication.
Funding
MS, JG, and SW were supported by the SolarALMA project, which received funding from the European Research Council (ERC) under the European Union’s Horizon 2020 research and innovation program (grant agreement No. 682462), and by the Research Council of Norway through its Centers of Excellence scheme, project number 262622. GF was supported in part by NSF grants AGS-2121632, AST-2206424, and AST-1820613, and NASA grants 80NSSC20K0718, and 80NSSC23K0090 to New Jersey Institute of Technology. SG acknowledges the support from grant No. 19-16890S of the Czech Science Foundation (GA ČR) and from project RVO:67985815 of the Astronomical Institute of the Czech Academy of Sciences. PA acknowledges funding from the STFC Ernest Rutherford Fellowship (No. ST/R004285/2). HE was supported through the CHROMATIC project (2016.0019) funded by the Knut and Alice Wallenberg Foundation. This project received funding from the European Research Council (ERC) under the European Union’s Horizon 2020 research and innovation program (SUNMAG, grant agreement 759548). The Swedish 1-m Solar Telescope is operated on the island of La Palma by the Institute for Solar Physics of Stockholm University in the Spanish Observatorio del Roque de los Muchachos of the Instituto de Astrofísica de Canarias. The Institute for Solar Physics was supported by a grant for research infrastructures of national importance from the Swedish Research Council (registration number 2021-00169).
Acknowledgments
This paper makes use of the following ALMA data: ADS/JAO. ALMA#2011.0.00020.SV and ADS/JAO.ALMA#2018.1.01518.S. ALMA is a partnership of ESO (representing its member states), NSF (United States), and NINS (Japan), together with NRC (Canada) and NSC and ASIAA (Taiwan), and KASI (Republic of Korea), in co-operation with the Republic of Chile. The Joint ALMA Observatory is operated by ESO, AUI/NRAO, and NAOJ. The National Radio Astronomy Observatory is a facility of the National Science Foundation operated under cooperative agreement by Associated Universities, Inc. CGGC is grateful with FAPESP (2013/24155-3), CAPES (88887.310385/2018-00), and CNPq (307722/2019-8). The NSO is operated by the Association of Universities for Research in Astronomy, Inc., under cooperative agreement with the National Science Foundation. Part of this work was carried out in connection with the ESO-funded development study for the Atacama Large Millimeter/submillimeter Array (ALMA) High-cadence imaging of the Sun (agreement no. 80738/18/87966/ASP). Figure 7 was obtained through computational time granted from the Greek Research and Technology Network (GRNET) in the National HPC facility ARIS. Part of the numerical computations was also carried out on the Cray XC50 at the Center for Computational Astrophysics, NAOJ.
Conflict of interest
The authors declare that the research was conducted in the absence of any commercial or financial relationships that could be construed as a potential conflict of interest.
Publisher’s note
All claims expressed in this article are solely those of the authors and do not necessarily represent those of their affiliated organizations, or those of the publisher, the editors, and the reviewers. Any product that may be evaluated in this article, or claim that may be made by its manufacturer, is not guaranteed or endorsed by the publisher.
Footnotes
1In this context, NLTE or non-LTE describes deviations from LTE conditions for the atomic-level populations (which can then be calculated under the assumption of statistical equilibrium), the electron density (mostly due to non-equilibrium hydrogen ionisation), and the radiative source function that is no longer given by the Boltzmann function.
2https://www.eso.org/public/teles-instr/alma/receiver-bands/.
3http://sdc.uio.no/search/simulations.
4Common Astronomy Software Applications (CASA): http://casa.nrao.edu.
References
Alissandrakis, C. E., Nindos, A., Bastian, T. S., and Patsourakos, S. (2020). Modeling the quiet Sun cell and network emission with ALMA. Astron. Astrophys. 640, A57. doi:10.1051/0004-6361/202038461
Alissandrakis, C. E., Patsourakos, S., Nindos, A., and Bastian, T. S. (2017). Center-to-limb observations of the Sun with ALMA. Implications for solar atmospheric models. Astron. Astrophys. 605, A78. doi:10.1051/0004-6361/201730953
Antolin, P., Pagano, P., Testa, P., Petralia, A., and Reale, F. (2021). Reconnection nanojets in the solar corona. Nat. Astron. 5, 54–62. doi:10.1038/s41550-020-1199-8
Anfinogentov, S. A., Stupishin, A. G., Mysh’yakov, I., and Fleishman, G. D. (2019). Record-breaking coronal magnetic field in solar active region 12673. Astrophys. J. 880, 880L29. doi:10.3847/2041-8213/ab3042
Antiochos, S. K., MacNeice, P. J., Spicer, D. S., and Klimchuk, J. A. (1999). The dynamic formation of prominence condensations. Astrophys. J. 512, 985–991. doi:10.1086/306804
Antolin, P., and Froment, C. (2022). Multi-scale variability of coronal loops set by thermal non-equilibrium and instability as a probe for coronal heating. Front. Astron. Space Sci. 9. doi:10.3389/fspas.2022.820116
Antolin, P., Martínez-Sykora, J., and Şahin, S. (2022). Thermal instability-induced fundamental magnetic field strands in the solar corona. Astrophys. J. Lett. 926, L29. doi:10.3847/2041-8213/ac51dd
Antolin, P., and Rouppe van der Voort, L. (2012). Observing the fine structure of loops through high-resolution spectroscopic observations of coronal rain with the CRISP instrument at the Swedish solar telescope. Astrophys. J. 745, 152. doi:10.1088/0004-637X/745/2/152
Antolin, P. (2020). Thermal instability and non-equilibrium in solar coronal loops: From coronal rain to long-period intensity pulsations. Plasma Phys. control. Fusion 62, 014016. doi:10.1088/1361-6587/ab5406
Avrett, E. H., and Loeser, R. (2008). Models of the solar chromosphere and transition region from SUMER and HRTS observations: Formation of the extreme-ultraviolet spectrum of hydrogen, carbon, and oxygen. Astrophys. J. Suppl. Ser. 175, 229–276. doi:10.1086/523671
Bastian, T. S., Bárta, M., Brajša, R., Chen, B., Pontieu, B. D., Gary, D. E., et al. (2018). Exploring the sun with ALMA. Messenger 171, 25–30.
Bastian, T. S., Chintzoglou, G., De Pontieu, B., Shimojo, M., Schmit, D., Leenaarts, J., et al. (2017). A first comparison of millimeter continuum and Mg II ultraviolet line emission from the solar chromosphere. Astrophys. J. 845, L19. doi:10.3847/2041-8213/aa844c
Benz, A. O., Brajsa, R., Shimojo, M., Karlicky, M., and Testi, L. (2012). Observing the sun with ALMA. IAU Spec. Sess. 6, E2.
Brajša, R., Kuhar, M., Benz, A. O., Skokić, I., Sudar, D., Wedemeyer, S., et al. (2018). A comparison of solar ALMA observations and model based predictions of the brightness temperature. Cent. Eur. Astrophys. Bull. 42, 1.
Brosius, J. W., and White, S. M. (2006). Radio measurements of the height of strong coronal magnetic fields above sunspots at the solar limb. Astrophys. J. 641, L69–L72. doi:10.1086/503774
Carlsson, M. (1986). A computer program for solving multi-level non-LTE radiative transferproblems in moving or static atmospheres. Upps. Astron. Obs. Rep. 33.
Carlsson, M., Hansteen, V. H., Gudiksen, B. V., Leenaarts, J., and De Pontieu, B. (2016). A publicly available simulation of an enhanced network region of the Sun. Astron. Astrophys. 585, A4. doi:10.1051/0004-6361/201527226
Carlsson, M., and Stein, R. F. (1995). Does a nonmagnetic solar chromosphere exist? Astrophys. J. 440, L29. doi:10.1086/187753
Carlsson, M., and Stein, R. F. (2002). Dynamic hydrogen ionization. Astrophys. J. 572, 626–635. doi:10.1086/340293
Carlsson, M., and Stein, R. F. (1992). Non-LTE radiating acoustic shocks and CA II K2V bright points. Astrophys. J. 397, L59. doi:10.1086/186544
Casini, R., White, S. M., and Judge, P. G. (2017). Magnetic diagnostics of the solar corona: Synthesizing optical and radio techniques. Space Sci. Rev. 210, 145–181. doi:10.1007/s11214-017-0400-6
Cheung, M. C. M., Rempel, M., Chintzoglou, G., Chen, F., Testa, P., Martínez-Sykora, J., et al. (2019). A comprehensive three-dimensional radiative magnetohydrodynamic simulation of a solar flare. Nat. Astron. 3, 160–166. doi:10.1038/s41550-018-0629-3
Chintzoglou, G., De Pontieu, B., Martínez-Sykora, J., Hansteen, V., de la Cruz Rodríguez, J., Szydlarski, M., et al. (2021a). ALMA and IRIS observations of the solar chromosphere. I. An on-disk type II spicule. Astrophys. J. 906, 82. doi:10.3847/1538-4357/abc9b1
Chintzoglou, G., De Pontieu, B., Martínez-Sykora, J., Hansteen, V., de la Cruz Rodríguez, J., Szydlarski, M., et al. (2021b). ALMA and IRIS observations of the solar chromosphere. II. Structure and dynamics of chromospheric plages. Astrophys. J. 906, 83. doi:10.3847/1538-4357/abc9b0
da Silva Santos, J. M., Danilovic, S., Leenaarts, J., de la Cruz Rodríguez, J., Zhu, X., White, S. M., et al. (2022b). Heating of the solar chromosphere through current dissipation. Astron. Astrophys. 661, A59. doi:10.1051/0004-6361/202243191
da Silva Santos, J. M., de la Cruz Rodríguez, J., Leenaarts, J., Chintzoglou, G., De Pontieu, B., Wedemeyer, S., et al. (2020a). The multi-thermal chromosphere. Inversions of ALMA and IRIS data. Astron. Astrophys. 634, A56. doi:10.1051/0004-6361/201937117
da Silva Santos, J. M., de la Cruz Rodríguez, J., and Leenaarts, J. (2018). Temperature constraints from inversions of synthetic solar optical, UV, and radio spectra. Astron. Astrophys. 620, A124. doi:10.1051/0004-6361/201833664
da Silva Santos, J. M., de la Cruz Rodríguez, J., White, S. M., Leenaarts, J., Vissers, G. J. M., and Hansteen, V. H. (2020b). ALMA observations of transient heating in a solar active region. Astron. Astrophys. 643, A41. doi:10.1051/0004-6361/202038755
da Silva Santos, J. M., White, S. M., Reardon, K., Cauzzi, G., Gunár, S., Heinzel, P., et al. (2022a). Subarcsecond imaging of a solar active region filament with ALMA and IRIS. Front. Astron. Space Sci. 9. doi:10.3389/fspas.2022.898115
de la Cruz Rodríguez, J., Szydlarski, M., and Wedemeyer, S. (2021). Art: Advanced (and fast!) radiative transfer code for solar physics. doi:10.5281/zenodo.4604825
de la Cruz Rodríguez, J., Leenaarts, J., and Asensio Ramos, A. (2016). Non-LTE inversions of the Mg II h & k and UV triplet lines. Astrophys. J. 830, L30. doi:10.3847/2041-8205/830/2/L30
de la Cruz Rodríguez, J., Leenaarts, J., Danilovic, S., and UitenbroekSTiC, H. (2019). STiC: A multiatom non-LTE prd inversion code for full-Stokes solar observations. Astron. Astrophys. 623, A74. doi:10.1051/0004-6361/201834464
de la Cruz Rodríguez, J., Rouppe van der Voort, L., Socas-Navarro, H., and van Noort, M. (2013). Physical properties of a sunspot chromosphere with umbral flashes. Astron. Astrophys. 556, A115. doi:10.1051/0004-6361/201321629
de Oliveira e Silva, A. J., Selhorst, C. L., Costa, J. E. R., Simões, P. J. A., Giménez de Castro, C. G., Wedemeyer, S., et al. (2022). A genetic algorithm to model solar radio active regions from 3D magnetic field extrapolations. Front. Astron. Space Sci. 9, 911118. doi:10.3389/fspas.2022.911118
Dulk, G. A. (1985). Radio emission from the sun and stars. Annu. Rev. Astron. Astrophys. 23, 169–224. doi:10.1146/annurev.aa.23.090185.001125
Eklund, H., Szydlarski, M., and Wedemeyer, S. (Forthcoming 2022). Utilizing the slope of the brightness temperature continuum as a diagnostic tool of solar ALMA observations. Astron. Astrophys.
Eklund, H., Wedemeyer, S., Snow, B., Jess, D. B., Jafarzadeh, S., Grant, S. D. T., et al. (2021b). Characterization of shock wave signatures at millimetre wavelengths from Bifrost simulations. Phil. Trans. R. Soc. A 379, 20200185. doi:10.1098/rsta.2020.0185
Eklund, H., Wedemeyer, S., Szydlarski, M., Jafarzadeh, S., and Guevara Gómez, J. C. (2020). The Sun at millimeter wavelengths. II. Small-scale dynamic events in ALMA Band 3. Astron. Astrophys. 644, A152. doi:10.1051/0004-6361/202038250
Eklund, H., Wedemeyer, S., Szydlarski, M., and Jafarzadeh, S. (2021a). The Sun at millimeter wavelengths. III. Impact of the spatial resolution on solar ALMA observations. Astron. Astrophys. 656, A68. doi:10.1051/0004-6361/202140972
Esteban Pozuelo, S., de la Cruz Rodríguez, J., Drews, A., Rouppe van der Voort, L., Scharmer, G. B., and Carlsson, M. (2019). Observationally based models of penumbral microjets. Astrophys. J. 870, 88. doi:10.3847/1538-4357/aaf28a
Fang, X., Xia, C., and Keppens, R. (2013). Multidimensional modeling of coronal rain dynamics. Astrophys. J. 771, L29. doi:10.1088/2041-8205/771/2/L29
Fleishman, G., Loukitcheva, M., and Nita, G. (2015). “Solar ALMA: Observation-based simulations of the mm and sub-mm emissions from active regions,” in Revolution in Astronomy with ALMA: The third year. Editors D. Iono, K. Tatematsu, A. Wootten, and L. Testi (San Francisco, United States: Astronomical Society of the Pacific Conference Series), 499, 351.
Fleishman, G., Myshyakov, I., Stupishin, A., Loukitcheva, M., and Anfinogentov, S. (2019). Force-free field reconstructions enhanced by chromospheric magnetic field data. Astrophys. J. 870, 101. doi:10.3847/1538-4357/aaf384
Fleishman, G. D., Altyntsev, A. T., and Meshalkina, N. S. (2013). Microwave signature of relativistic positrons in solar flares. Publ. Astron. Soc. Jpn. Nihon. Tenmon. Gakkai. 65, S7. doi:10.1093/pasj/65.sp1.S7
Fleishman, G. D., Anfinogentov, S. A., Stupishin, A. G., Kuznetsov, A. A., and Nita, G. M. (2021b). Coronal heating law constrained by microwave gyroresonant emission. Astrophys. J. 909, 89. doi:10.3847/1538-4357/abdab1
Fleishman, G. D., Gary, D. E., Chen, B., Kuroda, N., Yu, S., and Nita, G. M. (2020). Decay of the coronal magnetic field can release sufficient energy to power a solar flare. Science 367, 278–280. doi:10.1126/science.aax6874
Fleishman, G. D., and Kuznetsov, A. A. (2010). Fast gyrosynchrotron codes. Astrophys. J. 721, 1127–1141. doi:10.1088/0004-637X/721/2/1127
Fleishman, G. D., Kuznetsov, A. A., and Landi, E. (2021a). Gyroresonance and free-free radio emissions from multithermal multicomponent plasma. Astrophys. J. 914, 52. doi:10.3847/1538-4357/abf92c
Fontenla, J. M., Avrett, E. H., and Loeser, R. (1993). Energy balance in the solar transition region. III. Helium emission in hydrostatic, constant-abundance models with diffusion. Astrophys. J. 406, 319. doi:10.1086/172443
Foukal, P. (1978). Magnetic loops, downflows, and convection in the solar corona. Astrophys. J. 223, 1046–1057. doi:10.1086/156338
Freytag, B., Steffen, M., Ludwig, H. G., Wedemeyer-Böhm, S., Schaffenberger, W., and Steiner, O. (2012). Simulations of stellar convection with CO5BOLD. J. Comput. Phys. 231, 919–959. doi:10.1016/j.jcp.2011.09.026
Froment, C., Antolin, P., Henriques, V. M. J., Kohutova, P., and Rouppe van der Voort, L. H. M. (2020). Multi-scale observations of thermal non-equilibrium cycles in coronal loops. Astron. Astrophys. 633, A11. doi:10.1051/0004-6361/201936717
Gošić, M., de la Cruz Rodríguez, J., De Pontieu, B., Bellot Rubio, L. R., Carlsson, M., Esteban Pozuelo, S., et al. (2018). Chromospheric heating due to cancellation of quiet sun internetwork fields. Astrophys. J. 857, 48. doi:10.3847/1538-4357/aab1f0
Gouttebroze, P., Heinzel, P., and Vial, J. C. (1993). The hydrogen spectrum of model prominences. A&AS 99, 513–543.
Gouttebroze, P., and Labrosse, N. (2009). Radiative transfer in cylindrical threads with incident radiation. VI. A hydrogen plus helium system. Astron. Astrophys. 503, 663–671. doi:10.1051/0004-6361/200811483
Grebinskij, A., Bogod, V., Gelfreikh, G., Urpo, S., Pohjolainen, S., and Shibasaki, K. (2000). Microwave tomography of solar magnetic fields. Astron. Astrophys. Suppl. Ser. 144, 169–180. doi:10.1051/aas:2000202
Gudiksen, B. V., Carlsson, M., Hansteen, V. H., Hayek, W., Leenaarts, J., and Martínez-Sykora, J. (2011). The stellar atmosphere simulation code Bifrost. Code description and validation. Astron. Astrophys. 531, A154. doi:10.1051/0004-6361/201116520
Guevara Gómez, J. C., Jafarzadeh, S., Wedemeyer, S., and Szydlarski, M. (2022). Propagation of transverse waves in the solar chromosphere probed at different heights with ALMA sub-bands. Astron. Astrophys. 665, L2. doi:10.1051/0004-6361/202244387
Guevara Gómez, J. C., Jafarzadeh, S., Wedemeyer, S., Szydlarski, M., Stangalini, M., Fleck, B., et al. (2021). High-frequency oscillations in small chromospheric bright features observed with Atacama Large Millimetre/Submillimetre Array. Phil. Trans. R. Soc. A 379, 20200184. doi:10.1098/rsta.2020.0184
Gunár, S., Heinzel, P., Anzer, U., and Mackay, D. H. (2018). Quiescent prominences in the era of ALMA. II. Kinetic temperature diagnostics. Astrophys. J. 853, 21. doi:10.3847/1538-4357/aaa001
Gunár, S., Heinzel, P., Mackay, D. H., and Anzer, U. (2016). Quiescent prominences in the era of ALMA: Simulated observations using the 3D whole-prominence fine structure model. Astrophys. J. 833, 141. doi:10.3847/1538-4357/833/2/141
Gunár, S., and Mackay, D. H. (2015). 3D whole-prominence fine structure modeling. Astrophys. J. 803, 64. doi:10.1088/0004-637X/803/2/64
Heinzel, P., and Avrett, E. H. (2012). Optical-to-Radio continua in solar flares. Sol. Phys. 277, 31–44. doi:10.1007/s11207-011-9823-5
Heinzel, P., Bárta, M., Gunár, S., Labrosse, N., and Vial, J. C. (2022b). Prominence observations with alma. Front. Astron. Space Sci. 9. doi:10.3389/fspas.2022.983707
Heinzel, P., Berlicki, A., Bárta, M., Karlický, M., and Rudawy, P. (2015). On the visibility of prominence fine structures at radio millimeter wavelengths. Sol. Phys. 290, 1981–2000. doi:10.1007/s11207-015-0719-7
Heinzel, P., Berlicki, A., Bárta, M., Rudawy, P., Gunár, S., Labrosse, N., et al. (2022a). ALMA as a prominence thermometer: First observations. Astrophys. J. Lett. 927, L29. doi:10.3847/2041-8213/ac588f
Henriques, V. M. J., Jafarzadeh, S., Guevara Gómez, J. C., Eklund, H., Wedemeyer, S., Szydlarski, M., et al. (2022). The Solar ALMA Science Archive (SALSA). First release, SALAT, and FITS header standard. Astron. Astrophys. 659, A31. doi:10.1051/0004-6361/202142291
Henriques, V. M. J., Nelson, C. J., Rouppe van der Voort, L. H. M., and Mathioudakis, M. (2020). Umbral chromospheric fine structure and umbral flashes modelled as one: The corrugated umbra. Astron. Astrophys. 642, A215. doi:10.1051/0004-6361/202038538
Hofmann, R. A., Reardon, K. P., Milic, I., Molnar, M. E., Chai, Y., and Uitenbroek, H. (2022). Evaluating non-LTE spectral inversions with ALMA and IBIS. APJ 933 (2), 244. doi:10.3847/1538-4357/ac6f00
Högbom, J. A. (1974). Aperture synthesis with a non-regular distribution of interferometer baselines. A&AS 15, 417.
Jafarzadeh, S., Wedemeyer, S., Fleck, B., Stangalini, M., Jess, D. B., Morton, R. J., et al. (2021). An overall view of temperature oscillations in the solar chromosphere with ALMA. Phil. Trans. R. Soc. A 379, 20200174. doi:10.1098/rsta.2020.0174
Karlický, M., Bárta, M., Dabrowski, B. P., and Heinzel, P. (2011). Solar research with ALMA. Sol. Phys. 268, 165–173. doi:10.1007/s11207-010-9671-8
Klimchuk, J. A., and Luna, M. (2019). The role of asymmetries in thermal nonequilibrium. Astrophys. J. 884, 68. doi:10.3847/1538-4357/ab41f4
Krucker, S., Giménez de Castro, C. G., Hudson, H. S., Trottet, G., Bastian, T. S., Hales, A. S., et al. (2013). Solar flares at submillimeter wavelengths. Astron. Astrophys. Rev. 21, 58. doi:10.1007/s00159-013-0058-3
Kundu, M. R., White, S. M., Gopalswamy, N., and Lim, J. (1993). Interferometric observations of solar flares at 3 mm wavelength. Adv. Space Res. 13, 289–293. doi:10.1016/0273-1177(93)90492-T
Kuridze, D., Mathioudakis, M., Morgan, H., Oliver, R., Kleint, L., Zaqarashvili, T. V., et al. (2019). Mapping the magnetic field of flare coronal loops. Astrophys. J. 874, 126. doi:10.3847/1538-4357/ab08e9
Kuznetsov, A., and Fleishman, G. (2021b). Ultimate fast gyrosynchrotron codes: The first release. Genève, Switzerland: Zenodo. doi:10.5281/zenodo.5139156
Kuznetsov, A., Fleishman, G., and Landi, E. (2021). Codes for computing the solar gyroresonance and free-free radio emissions: The first release. Genève, Switzerland: Zenodo. doi:10.5281/zenodo.4625572
Kuznetsov, A. A., and Fleishman, G. D. (2021a). Ultimate fast gyrosynchrotron codes. Astrophys. J. 922, 103. doi:10.3847/1538-4357/ac29c0
Labrosse, N., Rodger, A. S., Radziszewski, K., Rudawy, P., Antolin, P., Fletcher, L., et al. (2022). First high resolution interferometric observation of a solar prominence with ALMA. MNRAS 513, L30–L34. doi:10.1093/mnrasl/slac021
Leenaarts, J., Carlsson, M., Hansteen, V., and Rutten, R. J. (2007). Non-equilibrium hydrogen ionization in 2D simulations of the solar atmosphere. Astron. Astrophys. 473, 625–632. doi:10.1051/0004-6361:20078161
Leenaarts, J., Pereira, T. M. D., Carlsson, M., Uitenbroek, H., and De Pontieu, B. (2013). the formation of IRIS diagnostics. II. The formation of the Mg II h&k lines in the solar atmosphere. Astrophys. J. 772, 90. doi:10.1088/0004-637X/772/2/90
Leenaarts, J., and Wedemeyer-Böhm, S. (2006). Time-dependent hydrogen ionisation in 3D simulations of the solar chromosphere. Methods and first results. Astron. Astrophys. 460, 301–307. doi:10.1051/0004-6361:20066123
Leroy, J. (1972). Emissions ’froides’ dans la couronne solaire. Sol. Phys. 25, 413–417. doi:10.1007/BF00192338
Lin, H., Kuhn, J. R., and Coulter, R. (2004). Coronal magnetic field measurements. Astrophys. J. 613, L177–L180. doi:10.1086/425217
Loukitcheva, M., Solanki, S. K., Carlsson, M., and Stein, R. F. (2004). Millimeter observations and chromospheric dynamics. Astron. Astrophys. 419, 747–756. doi:10.1051/0004-6361:20034159
Loukitcheva, M., Solanki, S. K., Carlsson, M., and White, S. M. (2015). Millimeter radiation from a 3D model of the solar atmosphere. I. Diagnosing chromospheric thermal structure. Astron. Astrophys. 575, A15. doi:10.1051/0004-6361/201425238
Loukitcheva, M., Solanki, S. K., and White, S. M. (2009). The relationship between chromospheric emissions and magnetic field strength. Astron. Astrophys. 497, 273–285. doi:10.1051/0004-6361/200811133
Loukitcheva, M., White, S. M., Solanki, S. K., Fleishman, G. D., and Carlsson, M. (2017a). Millimeter radiation from a 3D model of the solar atmosphere. II. Chromospheric magnetic field. Astron. Astrophys. 601, A43. doi:10.1051/0004-6361/201629099
Loukitcheva, M. A., Iwai, K., Solanki, S. K., White, S. M., and Shimojo, M. (2017b). Solar ALMA observations: Constraining the chromosphere above sunspots. Astrophys. J. 850, 35. doi:10.3847/1538-4357/aa91cc
Loukitcheva, M. A., Solanki, S. K., and White, S. (2008). ALMA as the ideal probe of the solar chromosphere. Astrophys. Space Sci. 313, 197–200. doi:10.1007/s10509-007-9626-1
Loukitcheva, M. A., White, S. M., and Solanki, S. K. (2019). ALMA detection of dark chromospheric holes in the quiet sun. Astrophys. J. 877, L26. doi:10.3847/2041-8213/ab2191
Malanushenko, A., Cheung, M. C. M., DeForest, C. E., Klimchuk, J. A., and Rempel, M. (2022). The coronal veil. Astrophys. J. 927, 1. doi:10.3847/1538-4357/ac3df9
Martínez-Sykora, J., De Pontieu, B., de la Cruz Rodriguez, J., and Chintzoglou, G. (2020). the formation height of millimeter-wavelength emission in the solar chromosphere. Astrophys. J. 891, L8. doi:10.3847/2041-8213/ab75ac
Martínez-Sykora, J., De Pontieu, B., De Moortel, I., Hansteen, V. H., and Carlsson, M. (2018). Impact of type II spicules in the corona: Simulations and synthetic observables. Astrophys. J. 860, 116. doi:10.3847/1538-4357/aac2ca
Menezes, F., Selhorst, C. L., Giménez de Castro, C. G., and Valio, A. (2022). Subterahertz radius and limb brightening of the Sun derived from SST and ALMA. Mon. Not. R. Astron. Soc. 511, 877–885. doi:10.1093/mnras/stab3501
Molnar, M. E., Reardon, K. P., Chai, Y., Gary, D., Uitenbroek, H., Cauzzi, G., et al. (2019). Solar chromospheric temperature diagnostics: A joint ALMA-hα analysis. Astrophys. J. 881, 99. doi:10.3847/1538-4357/ab2ba3
Morosin, R., de la Cruz Rodríguez, J., Díaz Baso, C. J., and Leenaarts, J. (2022). Spatio-temporal analysis of chromospheric heating in a plage region. arXiv e-printsarXiv:2203.01688.
Narang, N., Chandrashekhar, K., Jafarzadeh, S., Fleck, B., Szydlarski, M., and Wedemeyer, S. (2022). Power distribution of oscillations in the atmosphere of a plage region. Joint observations with ALMA, IRIS, and SDO. Astron. Astrophys. 661, A95. doi:10.1051/0004-6361/202142080
Nindos, A., Alissandrakis, C. E., Bastian, T. S., Patsourakos, S., De Pontieu, B., Warren, H., et al. (2018). First high-resolution look at the quiet Sun with ALMA at 3mm. Astron. Astrophys. 619, L6. doi:10.1051/0004-6361/201834113
Nindos, A., Patsourakos, S., Alissandrakis, C. E., and Bastian, T. S. (2021). ALMA observations of the variability of the quiet Sun at millimeter wavelengths. Astron. Astrophys. 652, A92. doi:10.1051/0004-6361/202141241
Nita, G. M., Fleishman, G. D., Kuznetsov, A. A., Kontar, E. P., and Gary, D. E. (2015). Three-dimensional radio and X-ray modeling and data analysis software: Revealing flare complexity. Astrophys. J. 799, 236. doi:10.1088/0004-637X/799/2/236
Nita, G. M., Viall, N. M., Klimchuk, J. A., Loukitcheva, M. A., Gary, D. E., Kuznetsov, A. A., et al. (2018). Dressing the coronal magnetic extrapolations of active regions with a parameterized thermal structure. Astrophys. J. 853, 66. doi:10.3847/1538-4357/aaa4bf
Oliver, R., Soler, R., Terradas, J., Zaqarashvili, T. V., and Khodachenko, M. L. (2014). Dynamics of coronal rain and descending plasma blobs in solar prominences. I. Fully ionized case. Astrophys. J. 784, 21. doi:10.1088/0004-637X/784/1/21
Pastor Yabar, A., Borrero, J. M., Quintero Noda, C., and Ruiz Cobo, B. (2021). Inference of electric currents in the solar photosphere. Astron. Astrophys. 656, L20. doi:10.1051/0004-6361/202142149
Patsourakos, S., Alissandrakis, C. E., Nindos, A., and Bastian, T. S. (2020). Observations of solar chromospheric oscillations at 3 mm with ALMA. Astron. Astrophys. 634, A86. doi:10.1051/0004-6361/201936618
Pereira, T. M. D., and Uitenbroek, H. (2015). RH 1.5D: A massively parallel code for multi-level radiative transfer with partial frequency redistribution and zeeman polarisation. Astron. Astrophys. 574, A3. doi:10.1051/0004-6361/201424785
Pietarila, A., Socas-Navarro, H., and Bogdan, T. (2007). Spectropolarimetric inversions of the Ca II 8498 and 8542 Å lines in the quiet sun. Astrophys. J. 670, 885–902. doi:10.1086/521271
Przybylski, D., Cameron, R., Solanki, S. K., Rempel, M., Leenaarts, J., Anusha, L. S., et al. (2022). Chromospheric extension of the MURaM code. arXiv e-printsarXiv:2204.03126.
Rau, U., and Cornwell, T. J. (2011). A multi-scale multi-frequency deconvolution algorithm for synthesis imaging in radio interferometry. Astron. Astrophys. 532, A71. doi:10.1051/0004-6361/201117104
Rempel, M., Schüssler, M., and Knölker, M. (2009). Radiative magnetohydrodynamic simulation of sunspot structure. Astrophys. J. 691, 640–649. doi:10.1088/0004-637X/691/1/640
Rodger, A., and Labrosse, N. (2017). Solar prominence modelling and plasma diagnostics at ALMA wavelengths. Sol. Phys. 292, 130. doi:10.1007/s11207-017-1161-9
Ruiz Cobo, B., and Asensio Ramos, A. (2013). Returning magnetic flux in sunspot penumbrae. Astron. Astrophys. 549, L4. doi:10.1051/0004-6361/201220373
Ruiz Cobo, B., and del Toro Iniesta, J. C. (1992). Inversion of Stokes profiles. Astrophys. J. 398, 375. doi:10.1086/171862
Sahin, S., and Antolin, P. Prevalence of thermal-non-equilibrium over an active region. ApJ Accepted (2022).doi:10.3847/2041-8213/ac6fe9
Sainz Dalda, A., de la Cruz Rodríguez, J., De Pontieu, B., and Gošić, M. (2019). Recovering thermodynamics from spectral profiles observed by IRIS: A machine and deep learning approach. Astrophys. J. 875, L18. doi:10.3847/2041-8213/ab15d9
Schad, T. A., Penn, M. J., Lin, H., and Judge, P. G. (2016). Vector magnetic field measurements along a cooled stereo-imaged coronal loop. Astrophys. J. 833, 5. doi:10.3847/0004-637X/833/1/5
Scharmer, G. B., de la Cruz Rodriguez, J., Sütterlin, P., and Henriques, V. M. J. (2013). Opposite polarity field with convective downflow and its relation to magnetic spines in a sunspot penumbra. Astron. Astrophys. 553, A63. doi:10.1051/0004-6361/201220899
Schrijver, C. J. (2001). Catastrophic cooling and high-speed downflow in quiescent solar coronal loops observed with TRACE. Sol. Phys. 198, 325–345. doi:10.1023/A:1005211925515
Shimizu, T., Shimojo, M., and Abe, M. (2021). Simultaneous ALMA-hinode-IRIS observations on footpoint signatures of a soft X-ray loop-like microflare. Astrophys. J. 922, 113. doi:10.3847/1538-4357/ac27a4
Silva, A. V. R., White, S. M., Lin, R. P., de Pater, I., Shibasaki, K., Hudson, H. S., et al. (1996). First images of a solar flare at millimeter wavelengths. Astrophys. J. 458, L49–L52. doi:10.1086/309918
Simões, P. J. A., Kerr, G. S., Fletcher, L., Hudson, H. S., Giménez de Castro, C. G., and Penn, M. (2017). Formation of the thermal infrared continuum in solar flares. Astron. Astrophys. 605, A125. doi:10.1051/0004-6361/201730856
Skartlien, R., Stein, R. F., and Nordlund, Å. (2000). Excitation of chromospheric wave transients by collapsing granules. Astrophys. J. 541, 468–488. doi:10.1086/309414
Socas-Navarro, H., Trujillo Bueno, J., and Ruiz Cobo, B. (2000). Non-LTE inversion of Stokes profiles induced by the zeeman effect. Astrophys. J. 530, 977–993. doi:10.1086/308414
Stepanov, A. V., Urpo, S., and Zaitsev, V. V. (1992). Diagnostics of solar flare and evaporated plasma using mm-wave emission. Sol. Phys. 140, 139–148. doi:10.1007/BF00148434
Sudar, D., Brajša, R., Skokić, I., and Benz, A. O. (2019). Centre-to-Limb brightness variations from the Atacama large millimeter-submillimeter array (ALMA) full-disk solar images. Sol. Phys. 294, 163. doi:10.1007/s11207-019-1556-x
Uitenbroek, H. (2001). Multilevel radiative transfer with partial frequency redistribution. Astrophys. J. 557, 389–398. doi:10.1086/321659
Valle Silva, J. F., Giménez de Castro, C. G., Simões, P. J. A., and Raulin, J. P. (2019). Submillimeter radiation as the thermal component of the neupert effect. Sol. Phys. 294, 150. doi:10.1007/s11207-019-1542-3
van Noort, M. (2012). Spatially coupled inversion of spectro-polarimetric image data. I. Method and first results. Astron. Astrophys. 548, A5. doi:10.1051/0004-6361/201220220
Vernazza, J. E., Avrett, E. H., and Loeser, R. (1981). Structure of the solar chromosphere. III. Models of the EUV brightness components of the quiet sun. Astrophys. J. Suppl. Ser. 45, 635–725. doi:10.1086/190731
J. C. Vial, and O. Engvold (Editors) (2015). Solar prominences, astrophysics and space science library (Springer International Publishing Switzerland), 415. doi:10.1007/978-3-319-10416-4
Vissers, G. J. M., de la Cruz Rodríguez, J., Libbrecht, T., Rouppe van der Voort, L. H. M., Scharmer, G. B., and Carlsson, M. (2019). Dissecting bombs and bursts: Non-LTE inversions of low-atmosphere reconnection in SST and IRIS observations. Astron. Astrophys. 627, A101. doi:10.1051/0004-6361/201833560
Wedemeyer, S., Bastian, T., Brajša, R., Hudson, H., Fleishman, G., Loukitcheva, M., et al. (2016). Solar science with the Atacama large millimeter/submillimeter array - a new view of our sun. Space Sci. Rev. 200, 1–73. doi:10.1007/s11214-015-0229-9
Wedemeyer, S., Freytag, B., Steffen, M., Ludwig, H. G., and Holweger, H. (2004). Numerical simulation of the three-dimensional structure and dynamics of the non-magnetic solar chromosphere. Astron. Astrophys. 414, 1121–1137. doi:10.1051/0004-6361:20031682
Wedemeyer, S. (2019). “High-cadence imaging of the sun,” in ALMA Development Workshop, ESO Garching, Germany, June 3 - 5, 2019 (Genève, Switzerland: Zenodo), 47. doi:10.5281/zenodo.3240401
Wedemeyer, S., Szydlarski, M., Jafarzadeh, S., Eklund, H., Guevara Gomez, J. C., Bastian, T., et al. (2020a). The Sun at millimeter wavelengths. I. Introduction to ALMA Band 3 observations. Astron. Astrophys. 635, A71. doi:10.1051/0004-6361/201937122
Wedemeyer, S., Szydlarski, M., Rodriguez, JdlC., and Jafarzadeh, S. (2020b). “Observing the sun with the Atacama large millimeter/submillimeter array - from continuum to magnetic fields,” in Solar and stellar magnetic fields: Origins and manifestations. Editors A. Kosovichev, S. Strassmeier, and M. Jardine, 354, 24–37. doi:10.1017/S1743921319009906
Wedemeyer-Böhm, S., Ludwig, H. G., Steffen, M., Freytag, B., and Holweger, H. (2005). “The shock-patterned solar chromosphere in the light of ALMA,” in 13th cambridge workshop on cool stars, stellar systems and the Sun. Editors F. Favata, G. A. J. Hussain, and B. Battrick (Noordwijk, Netherlands: ESA Special Publication), 560, 1035.
Wedemeyer-Böhm, S., Ludwig, H. G., Steffen, M., Leenaarts, J., and Freytag, B. (2007). Inter-network regions of the Sun at millimetre wavelengths. Astron. Astrophys. 471, 977–991. doi:10.1051/0004-6361:20077588
Wedemeyer-Böhm, S., and Rouppe van der Voort, L. (2009). On the continuum intensity distribution of the solar photosphere. Astron. Astrophys. 503, 225–239. doi:10.1051/0004-6361/200911983
White, S. M., Iwai, K., Phillips, N. M., Hills, R. E., Hirota, A., Yagoubov, P., et al. (2017). Observing the sun with the Atacama large millimeter/submillimeter array (ALMA): Fast-scan single-dish mapping. Sol. Phys. 292, 88. doi:10.1007/s11207-017-1123-2
White, S. M., Loukitcheva, M., and Solanki, S. K. (2006). High-resolution millimeter-interferometer observations of the solar chromosphere. Astron. Astrophys. 456, 697–711. doi:10.1051/0004-6361:20052854
Wiegelmann, T., and Sakurai, T. (2012). Solar force-free magnetic fields. Living Rev. Sol. Phys. 9, 5. doi:10.12942/lrsp-2012-5
Wiegelmann, T., Thalmann, J. K., and Solanki, S. K. (2014). The magnetic field in the solar atmosphere. Astron. Astrophys. Rev. 22, 78. doi:10.1007/s00159-014-0078-7
Williams, T., Walsh, R. W., Winebarger, A. R., Brooks, D. H., Cirtain, J. W., De Pontieu, B., et al. (2020). Is the high-resolution coronal imager resolving coronal strands? Results from AR 12712. Astrophys. J. 892, 134. doi:10.3847/1538-4357/ab6dcf
Wöger, F., Wedemeyer-Böhm, S., Schmidt, W., and von der Lühe, O. (2006). Observation of a short-lived pattern in the solar chromosphere. Astron. Astrophys. 459, L9–L12. doi:10.1051/0004-6361:20066237
Wootten, A., and Thompson, A. R. (2009). The Atacama large millimeter/submillimeter array. Proc. IEEE 97, 1463–1471. doi:10.1109/JPROC.2009.2020572
Keywords: radio radiation, atmosphere, magnetic fields, radiative transfer, magnetohydrodynamics (MHD), millimeter and submillimeter astronomy, solar physics, chromosphere and corona
Citation: Wedemeyer S, Fleishman G, de la Cruz Rodríguez J, Gunár S, da Silva Santos JM, Antolin P, Guevara Gómez JC, Szydlarski M and Eklund H (2022) Prospects and challenges of numerical modeling of the Sun at millimeter wavelengths. Front. Astron. Space Sci. 9:967878. doi: 10.3389/fspas.2022.967878
Received: 13 June 2022; Accepted: 24 October 2022;
Published: 17 November 2022.
Edited by:
Masumi Shimojo, National Astronomical Observatory of Japan (NINS), JapanReviewed by:
Haruhisa Iijima, Nagoya University, JapanKevin Reardon, National Solar Observatory, United States
Copyright © 2022 Wedemeyer, Fleishman, de la Cruz Rodríguez, Gunár, da Silva Santos, Antolin, Guevara Gómez, Szydlarski and Eklund. This is an open-access article distributed under the terms of the Creative Commons Attribution License (CC BY). The use, distribution or reproduction in other forums is permitted, provided the original author(s) and the copyright owner(s) are credited and that the original publication in this journal is cited, in accordance with accepted academic practice. No use, distribution or reproduction is permitted which does not comply with these terms.
*Correspondence: Sven Wedemeyer, c3Zlbi53ZWRlbWV5ZXJAYXN0cm8udWlvLm5v