- 1Department of Physics and Astronomy, University of Nigeria, Nsukka, Nigeria
- 2Center for Atmospheric Research, National Space Research and Development Agency, Anyigba, Nigeria
In this paper, we investigate anomalies in total electron content (TEC) from 7 stations of the Africa Geodetic Reference Frame (AFREF) during the initial and recovery stages of the geomagnetic storm of 19 February 2014. Additionally, we study geomagnetic storms under the solar activity ascending period of March 2012 and low solar activity of May 2017 to emphasize scintillation effects, especially during the nighttime. We employ a 15-days median-average sliding window to study the latitudinal patterns of relative TEC (rTEC) and determine the storm ionospheric irregularities using the rate of TEC index (ROTI). The low-latitude stations show larger rTEC variations during the storm than the midlatitude stations. ROTI strength >1 TECU/min is found at low latitude stations during postsunset and <1 TECU/min at mid latitudes during daytime. The results from this study show that rTEC differences between midlatitude stations may be caused by dynamo of the electric field originating from energy input during geomagnetic disturbances. We observed a low latitude significant intensity of ionospheric irregularities and established that low latitude ionospheric irregularities are more pronounced during the storm initial and recovery stages.
Introduction
Physics of the upper atmosphere under different space weather conditions have especially fascinated the scientific community since the beginning of the Global Navigation Satellite System (GNSS) (Afraimovich et al., 2013; Galav et al., 2014; Okoh et al., 2019; Calabia and Jin, 2020). The Earth’s ionosphere is strongly influenced by space weather conditions, and the resulting variations during both disturbed and quiet conditions are key parameters that model the detrimental effects on human technologies. The ionosphere contains a large number of electrons that are able to interfere in the propagation of radio signals, which are used, for example, in radio communications, GNSS, etc. These disturbances are especially significant during geomagnetic storms, causing severe disturbances in the services given by satellites. For instance, GNSS precision is strongly affected during geomagnetic storms (Wautelet et al., 2009; Perez, 2017; Liu et al., 2018), causing unacceptable errors in positioning, navigation, and timing (Pancheva et al., 2016). Hence, investigating the dynamics of the ionosphere during geomagnetic storms is essential, e.g., airports, to understand periods of safe flights and stable communication.
The electron density gradients have remained a major factor of ionospheric irregularities both in the low and mid latitudes (Rastongi, 1980). Ionospheric irregularities at both latitudes are formed during solar extreme ultraviolet radiation, and X-ray radiation is absorbed by atmospheric constituents. It is well reported that strong geomagnetic storms lead to intense ionospheric irregularities (Tsunoda, 1988), and the key effect is an equatorial ionospheric shift.
Cherniak et al., 2015 used the ROTI to study ionospheric irregularities and observed that variations in TEC characterize ionospheric responses to disturbance. Additionally, Souza and Camango, 2019 used the ROTI to study Brazilian sector low latitude irregularities, and the ROTI suitability is presented in Carmo et al., 2021. In the American sector of low and mid latitudes, Cherniak and Zakharenkova, 2022 observed signatures of ionospheric irregularities of moderate to intense magnitude at 4 UT to 6 UT during the 25-26 August 2018 storm. Their results also documented the nighttime persistence of irregularities until sunrise at ∼28 magnetic latitude. The results by Ngwira et al., 2013 in a study of ionospheric irregularities at African low latitudes during the September 2014 moderate storm concluded that the occurrence of irregularities had a local time factor during the intensification of the ring current.
The low-latitude gravitational Rayleigh-Taylor instability mechanism generates ionospheric irregularities (Dungey, 1956) prompted by E×B drift afterwards as a major driver (Anderson et al., 2004). Huang and Kelley (1996) presented studies on gravity waves and concluded that polarized electric fields can initiate Rayleigh-Taylor instability that speeds up the formation of plasma bubbles. Gravity waves are oscillations of neutral air that initiate ion-neutral collisions and eventually generate an F-region polarized electric field. The physics of medium-scale traveling ionospheric disturbance are presented in Fukushima et al., 2012. The actions of the large- and medium-scale wave-like structure of plasma density originate at low latitudes and contribute to the low-latitude TEC enhancements. This periodic nature-like wave propagates at approximately 15-60 min between daytime and nighttime and shows different mechanisms and characteristics (Ding et al., 2011).
Singh et al., 2015 studied the Indian sector low latitude ionosphere response to severe geomagnetic storms. The results showed storm-day post-sunset strong scintillations. Their results attributed such phenomena to enhanced TEC during prereversal enhancement. Sahai et al., 2007 reported plasma bubbles in the Brazilian low latitude sector during the recovery phase of an intense storm. Usually, the evolution of geomagnetic storms follows initial, main, and recovery phases (Gonzalez et al., 1994; Loewe and Prölss, 1997; Mendillo, 2006). However, the phases are defined by the strength of the storm following the intrusion of coronal mass ejections (CMEs) into the Earth’s magnetic field (Astafyeva et al., 2019). During CMEs, streams of energetic particles are propagated by solar wind into the Earth’s magnetosphere, changing the electromagnetic properties of the ionosphere. Total electron content (TEC) is an integrated value of electron density that exists between the satellite that emits the signal and the ground receiver (Okoh et al., 2019). Several researchers (Fagundes et al., 2016; Venkatesh et al., 2017; Srinivasu et al., 2019) have employed TEC data to study ionospheric variability since it is a suitable parameter to study the different phases of ionospheric disturbances globally and locally (Jakowski et al., 2002; Xiong et al., 2019). Unfortunately, the complex mechanisms and processes in the ionosphere are difficult to model, and the practical applications that use the existing models are still far away to provide the required accuracy (Borries et al., 2015; Nava et al., 2016).
Ghamry et al., 2016 studied the geomagnetic storm of 19 February 2014. The authors investigated multiple signatures using geomagnetic stations from stations in Japan and Egypt and concluded that magnetodynamic waves are generated by drift resonance interactions with current injection ions mostly during the recovery phases of storms. Kutiev et al., 2005 used the relative deviation from a 27-days median-average running window to study GNSS-derived TECs over low latitudes in Japan during low geomagnetic activity. Their results showed TEC enhancements during the recovery phase of geomagnetic storms and attributed that signature to poleward expansion of equatorial crests. Durgonics et al., 2017 studied the geomagnetic storm of 19 February 2014 over the Arctic region. Their results found negative disturbances as a consequence of energy input into the polar cap and concluded that a possible electron upwelling results from ionospheric heating due to CME energy. Lei et al., 2018, Ren et al., 2020, Xiong et al., 2019, and Pedatella and Liu (2018) recently reported deficiencies in TEC anomalies during storm recovery phases. Astafyeva et al., 2020 also reported deficiencies in TEC anomalies during positive disturbances. Unfortunately, works on solar activity in the mid and low latitudes of the African sector are few. One such few works is the investigation of daytime TEC variations resulting from high thermospheric temperatures during high solar levels over Kenya (Moeketsi et al., 2016) and the storm-time modeling of the African regional ionospheric TEC (Okoh et al., 2020).
Enhancements in TEC during the main phase of storms have been widely investigated (Skone et al., 2001; Martinis et al., 2005; Lei et al., 2008; Wang et al., 2010; Jakowski et al., 2012; Jacobsen and Dahnn, 2014; Jimoh et al., 2016). The variations in the zonal electric and plasma drifts in equatorial regions have been assigned to the Prompt Penetration Electric Field (PPEF) and Disturbance Dynamo Electric Field (DDEF) during geomagnetic storms (Baker, 1986). DDEF has been assigned to manifest during the recovery phase of storms and lasts several hours to days (Fejer and Scherliess, 1995).
There is a lack of research that concentrates on TEC anomalies associated with ionospheric irregularities during the initial and recovery phases of geomagnetic storms in the African region.
From the above review, it is clear that the ionosphere responds differently at different latitudes during geomagnetic storms, and the complex processes in the upper atmosphere make it difficult to generate accurate prediction models. Moreover, due to the lack of GNSS stations in Africa, accurate knowledge of TEC variability in these regions during geomagnetic storms is still not well understood. For this reason, one of the major objectives of the African Geodetic Reference Frame (AFREF) is to modernize the geodetic reference frame in Africa with permanent GNSS stations. Here, we employ a 15-days median-average sliding window to study the geomagnetic storm of 19 February 2014 and present the ROTI index to examine storm-strength to ionospheric irregularities with emphasis on the initial and recovery phases.
This particular storm is considered for investigation in the present study because it is the strongest storm recorded in 2014 (Durgonics et al., 2017), which is the year of maximum solar activity for solar cycle 24. The purpose of this study is to interpret and investigate the ionospheric response during the initial and recovery phases of the storm at the African low and mid latitudes.
A review of several studies (Milanowska, et al., 2021; Durgonics et al., 2017 and references herein) indicates that the February 19 storm has previously been studied but failed to provide storm-time TEC configuration and the associated localized scintillation impact of the storm mostly on the African ionosphere. We have also presented comparisons during the February 2014, March 2012, and May 2017 storms. The March 2012 and May 2017 storms occurred during the ascending and low solar activity phases of solar cycle 24, respectively. The results of the current study presented pre- and poststorm effects that pose major challenges in space weather (Joshua et al., 2021).
Data and methods
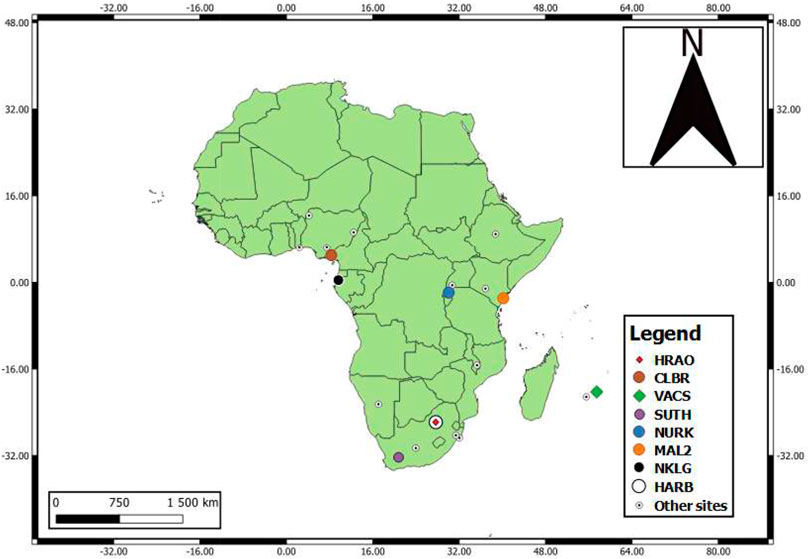
In this study, we employ GNSS data from the AFREF network. AFREF is a network of ground-based GNSS receiver stations located in different parts of Africa. We employ 4 stations at mid and 3 stations at low latitudes. Figure 1 shows the locations of the stations; the mid latitude stations are HARB, HRAO, SUTH, and VACS, and the low latitude stations are MAL2, NKLG, and CLBR. The data are provided in RINEX (Receiver Independent Exchange) format (Gurtner and Mader, 1990) at http://afrefdata.org. We employ the GNSS-TEC Analysis Program (http://seemala.blogspot.com/) developed by Gopi Seemala (Seemala and Valladares, 2011) to obtain TEC estimates in line of sight known as slant total electron content (STEC). The STEC computed by the satellites stored in a 30 s cadence is converted to vertical TEC (VTEC) through the thin shell mapping model (Mannucci et al., 1993; Langley, 2002). The computation to obtain the VTEC includes differential code bias (DCB) files that detect cycle slips in phase (Okoh et al., 2019). Therefore, a 30 s resolution VTEC is used in the present analysis.
To investigate the ionospheric variations along with space weather conditions, we employ the disturbance storm index (Dst), the interplanetary magnetic field (IMF), the planetary Kp index, the auroral AE and AL indices, the solar flux at 10.7 cm (F10.7), the plasma speed, and the interplanetary electric field (IEF) (Gonzalez et al., 1994). These indices (King and Papitashvili, 2005) can be obtained from the OMNI website http://omniweb.gsfc.nasa.gov/. The Dst index is used to identify the disturbed conditions (Dst ≤ -100 nT). The definition of a fully recovered storm is a major problem in phase analysis (Yermolaev et al., 2012). In this study, we employ the threshold of one-third of the minimum Dst value adopted by Yermolaev et al., 2012.
We employ a 15-days median-average window as suggested in previous literature (Arikan et al., 2003; Kutiev et al., 2005; Kutiev et al., 2006; Pancheva et al., 2016; Jimoh et al., 2020). As pointed out in previous studies (Codrescu et al., 1997; Muhtarov and Kutiev, 1998; Kutiev et al., 2006; Pancheva et al., 2016; Jimoh et al., 2020), the relative deviation of TEC (rTEC) can be used to analyze storm-time changes, and it is a suitable parameter for TEC data. The dTEC and rTEC parameters are calculated as follows:
In these equations, TECobs denotes the observed TEC, and TECmed is the 15-days median-averaged TEC.
Additionally, to determine ionospheric irregularities presented by the storm, we employ Pi et al., 1997 5-min average expression ROTI. The ROTI as a proxy to examine the level of irregularities during geomagnetic disturbances has been categorized by ROTI <0.25 TECU/min represent no fluctuations, 0.25 ≤ ROTI <0.5 TECU/min as weak fluctuations, 0.5 ≤ ROTI <1 TECU/min as moderate fluctuations and ROTI ≥1 as strong fluctuations (Astafyeva et al., 2018). Additionally, we employ temperature profile measurements that are almost aligned or close in distance from the geographic area of study from the SABER satellite. The perturbed temperature profile characterizes the possible passage of atmospheric gravity waves (AGWs) that propagate above 50 km into the ionosphere (Azeem and Barlage, 2017) with traceable strength above 150 km. Table 1 shows the precise local time of the stations.
where ∆TEC is the difference between two TEC values measured within a time interval of ∆t = 30 s.
Additionally, to determine TEC correlation with scintillation effect, we employ the global ROTI maps at 10 min intervals from the quicklook of the GNSS-TEC database provided by the Institute for Space-Earth Environmental Research (ISEE), Nagoya University, Japan, of 0.25 × 0.25 degree grid sizes (https://stdb2.isee.nagoya-u.ac.jp/GPS/GPS-TEC/index.html) from 20 UT until 23 UT. We study geomagnetic storms under the solar activity ascending period of March 7 until 12, 2012 and low solar activity of May 26 until 31, 2017 to emphasize scintillation effects during the nighttime.
Results
The geomagnetic storm of 19 February 2014 was the result of 2 powerful Earth-directed CMEs that recorded a minimum Dst of -119 nT (Ghamry et al., 2016). The depression of Dst commenced at 00:00 UT on 19 February (DOY = 50) with a Dst value of -61 nT and an accelerated IEF Ey of 3.26 mV/m. The IMF Bz was directed southward with a value of -7.6 nT and a solar wind plasma speed of 393 km/s. This is the characteristic development of a geomagnetic storm as attributed by Tsurutani et al., 2006. In Figure 2, the space weather indices are presented for the period of the storm. In this figure, it can be seen that the Kp index reaches a value of 43 (> 4), and the F10.7 index reaches 154 sfu. The Aurora activity shows values of 403 nT for AE and -346 nT for AL.
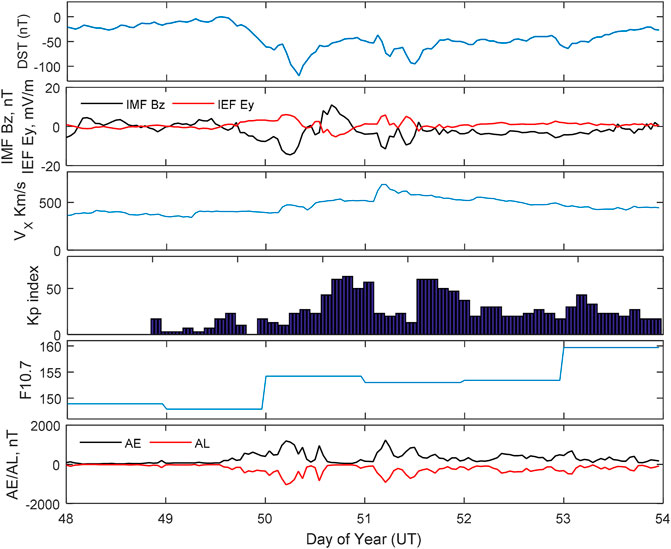
FIGURE 2. Space weather indices during the geomagnetic storm of 19 February 2014. From top to bottom, Dst, IMF Bz, IEF Ey, solar wind speed, Kp index, solar flux F10.7 cm, and Aurora indices (AE/AL).
As the solar wind plasma speed slams into Earth’s magnetic field, the changes in Dst announce the commencement of the geomagnetic storm. The maximum Dst disturbance of -101 nT was recorded at 07:00 UT, and the southward drift of IMF Bz reached -13.5 nT, with a solar wind plasma speed of 466 km/s, which lasted until 08:00 nT (Dst -119 nT). At this stage, the Kp index was 63 (> 4), and the solar wind plasma speed was 454 km/s, with the IMF Bz at -10 nT. This indicates a gradual recovery of the storm, while the Dst index recovered to -98 nT at 09:00 UT. At this time, IMF Bz was -3.7 nT, and the plasma wind was 453 km/s. The full recovery of the storm commenced at 17:00 UT (33.3% of the Dst value) with an IMF Bz of -2.7 nT, and the solar wind speed was 475 km/s. The storm shows a simple sudden commencement with multiple main and recovery phases, as also reported by Ghamry et al., 2016.
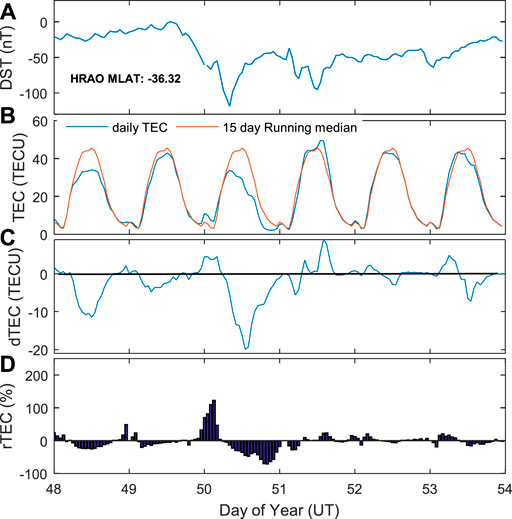
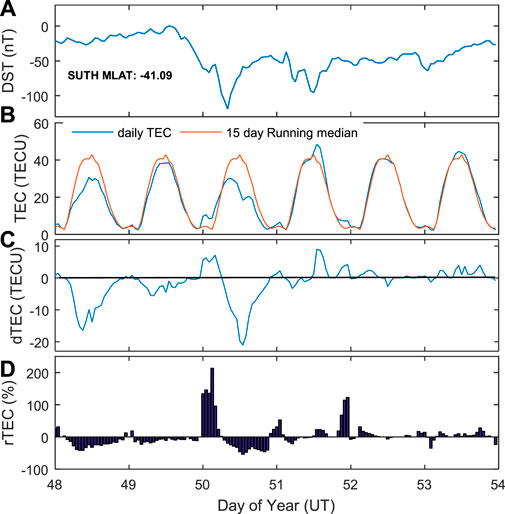
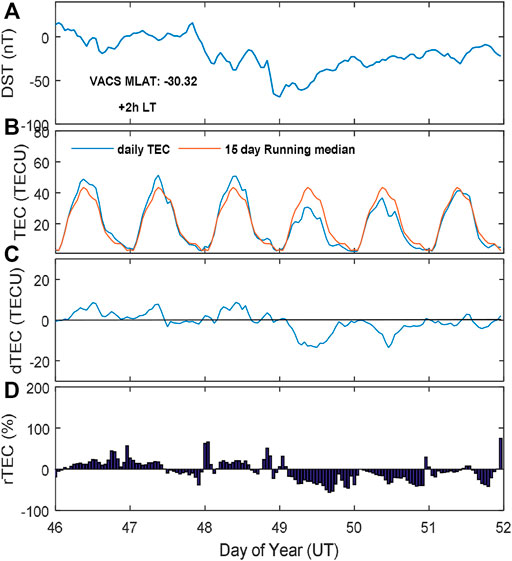
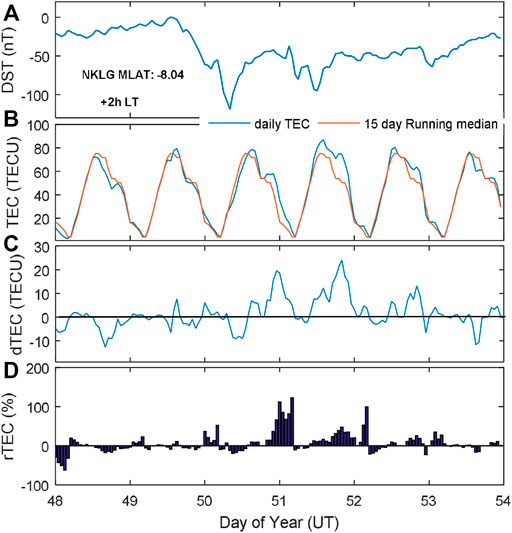
Since plasma follows Earth’s magnetic field, TECs at different magnetic latitudes may respond differently. Figures 3–6 show the TEC variations at the midlatitude stations. The initial period of the storm (DOY = 48, 0:00 UT) recorded Dst -21 nT (Figure 3A). At this stage, the southward IMF Bz drift is -5.6 nT, and the solar wind plasma speed is 362 km/s. In this figure, we can see that TEC enhancements strongly depend on the evolution of the storm. It is observed that rTEC is positive on several occasions. Positive rTEC also occurred at 01:00 UT, and a sudden negative anomaly occurred at 02:00 UT. Early morning hours until nighttime negative rTEC anomalies are observed from 06:00 until 22:00 UT, similarly reported by Harberulema et al., 2013. The negative rTEC values are mainly associated with compositional changes in the thermosphere (Proelss, 1987), which are entirely sufficient to explain negative ionospheric storm effects. However, the electrodynamics at latitudes are characterized by disturbance dynamo effects that drive long-lasting plasma distribution. Mendillo, 2006 emphasized factors such as the appearance of electric fields to explain negative and positive ionospheric disturbances. Daytime PPEF with eastward polarity has received label as a major ionospheric uplift that could result in positive rTEC. Positive rTEC seem to originate from the equatorial fountain effect, resulting in poleward plasma drift being displaced to the mid latitudes (Mannucci et al., 2005).
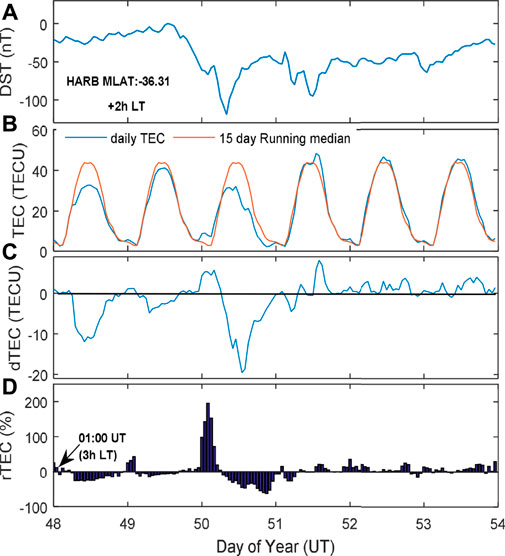
FIGURE 3. Mid latitude (HARB) 5-days TEC anomaly for 19 February 2014 (A) Dst (≤ -119 nT, with 33.3% recovery phase), (B) Daily and 15-days running median (C) absolute TEC anomaly during the initial and recovery phases (black line shows decrease and increase threshold), (D) relative TEC percentage anomaly during the initial and recovery phases.
Moreover, the DDEF sustains negative ionospheric ionizations, resulting in an excessively long period of negative TEC. The results of rTEC anomalies at 23:00 UT follow the DDEF principle outlined by Blanc and Richmond, 1980 and Zhang et al., 2017. Similar results were observed on 18 February (DOY = 49) at 17:00 UT until 19 February (DOY = 50) at 06:00 UT, where the commencement of the storm is clearly seen. These results agree with Valladares et al., 2017 over the complex pattern of the mid-latitude. These variations could be attributed to the storm-enhanced density (SED) phenomenon also attributed in Yue et al., 2016.
During 17 February (DOY = 48), positive variations in rTEC are seen from 00:00 UT to 03:00 UT at all 4 midlatitude stations (Figures 3–6). The next day, a positive TEC is also observed for these stations during nighttime from 19:00 UT to 02:00 UT. Then, sudden negative anomalies are seen from 03:00 UT to 16:00 UT. The rTEC differences between midlatitude stations may be caused by DDEF irregularities originating from energy input during geomagnetic storms (Danilov and Lastovicka, 2001). Then, the 4 midlatitude stations (Figures 3–6) show positive rTEC deviations at night on 18 February (DOY = 49). The main and recovery phases of the VACS station (Figure 6) show rTEC enhancement during both stages but are severe during the recovery stages. There is TEC enhancement during the noon hour (DOY = 48 from 11:00 to 12:00 UT), which is 14:83 h LT until 15:83 h LT, and a sudden decrease in rTEC at night (DOY = 48, 19:00 UT, 22:83 h LT), following rTEC enhancement at 00:00 UT (03:83 h LT, DOY = 49).
The Dst index shows its minimum value (- 119 nT) during the main phase of the storm on 19 February (DOY = 50). At HARB (Figure 3), rTEC enhancements are clearly seen during the daytime, from 00:00 to 06:00 UT, probably at 1:85 h LT until 7:85 h LT (Figure 3B). The deviation is well pictured in rTEC (Figure 3C), followed by an abrupt rTEC anomaly from 07:00 UT (8:85 h LT) until the following day, 20 February, with a Dst value of -64 nT. The TEC profile at the HARB station shows several irregularities during the recovery phase. Irregularities over Africa usually occur during equinox, as pointed out by Paznukhov et al., 2012. It seems that the DDEF is driven by thermospheric heating and has eastward (night) and westward (day) polarity. During the recovery of Dst, rTEC shows no very consistent anomalies. A sudden Dst value of -37 nT is observed during the early hours of 20 February (03:00 UT, DOY = 51), which returned to -50 nT at 04:00 UT. Then, a new rTEC enhancement appears from 08:00 to 09:00 UT, with a sudden anomaly from 10:00 UT to 12:00 UT. rTEC enhancements were observed during early hours in all mid-latitudes during the storm main phase (DOY = 50) and later proceeded by daytime depletion (09:00-23:00 UT), which lasted until nighttime. Intensification of Dst ≤ -61 nT with gradual southward excursion of Bz -7.6 nT was observed. The solar wind started to increase during this time ∼393 km/s at a solar flux of 154.2 sfu when aurora indices of 403 nT and -346 nT were observed. Finally, the recovery phase is observed to start at 21:00 UT (Dst -38 nT, DOY = 52). During the first part of the recovery phase, rTEC decreased, and the Dst was -42 nT. The recovery phase at HRAO and HARB (Figures 3, 4) shows rTEC enhancement in the early hours of 20 February at 01:00 UT (2:85 h LT, DOY = 51), which recorded a decrease in value during the same time. Then, rTEC enhancements are clearly seen from 22:00 to 02:00 UT (23:39 h LT until 3:39 h LT) and a sudden decrease at 03:00 UT (4:39 h LT) during a Dst value of -37 nT. Clear rTEC anomalies are observed during the recovery phase of the storm at SUTH station (Figure 5). On 22 February (DOY = 53), rTEC enhancement shows several variations, which could be attributed to plasma density distributions associated with neutral winds.
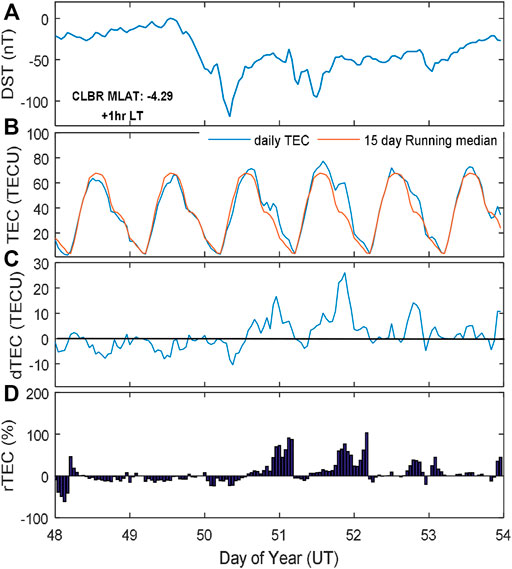
Figures 7–9 show the TEC response at the low latitude stations. It can be clearly seen that rTEC variations start at early hours on 17 February (DOY = 48, with a Dst of -22 nT. In this initial stage, the rTEC deviation is well pictured, e.g., in Figure 7C, these variations may be attributed to the E×B vertical drift of plasma density, which governs the dynamics at low latitudes (Scherliess and Fejer, 1999). The rTEC enhancements reappeared during the nighttime (21:00 UT), following a rTEC decrease. Here, the dynamics of the ionosphere due to plasma drifts may be the main contributions of the observed variability and agree with the results of Yeh et al., 2001. During the recovery phase (DOY = 53), rTEC enhancements occurred at early and nighttime hours. Figure 8 shows different results due to the redistribution of plasma density at low latitudes. Figure 9 shows pre- and poststorm TEC enhancements, which may be associated with the intensification of eastward winds. During the recovery phase, at this station, TEC variations may be associated with storm-enhanced density, showing a small TEC decrease during the initial and recovery phases. During the recovery phase, TEC enhancements are more pronounced at low latitudes. This mechanism could be the result of vertical plasma motion across the magnetic field lines.
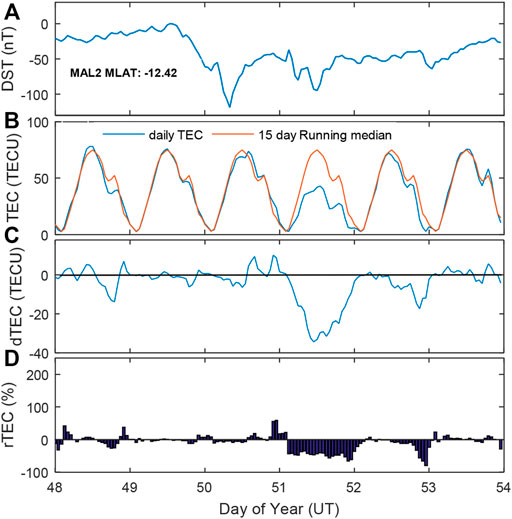
FIGURE 7. Low latitude (MAL2) 5-days TEC anomaly for 19 February 2014: (A) Dst (≤ -119 nT, with 33.3% recovery phase), (B) daily and 15-days running median, and (C) absolute TEC anomaly during the initial and recovery phases. (black line shows the decrease and increase threshold), (D) relative TEC percentage anomaly during the initial and recovery phases.
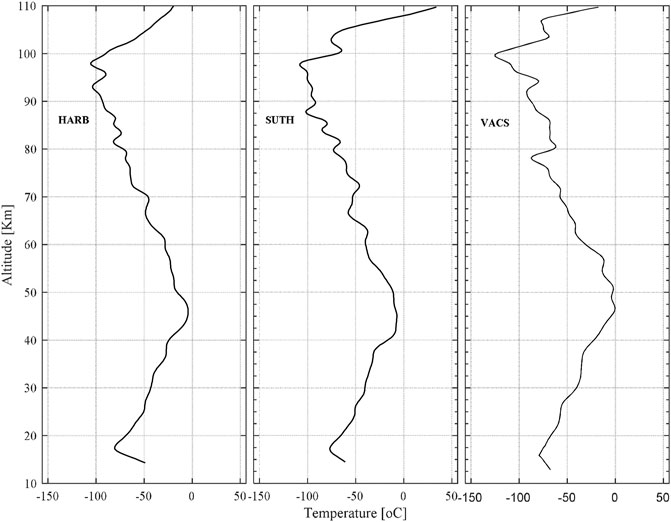
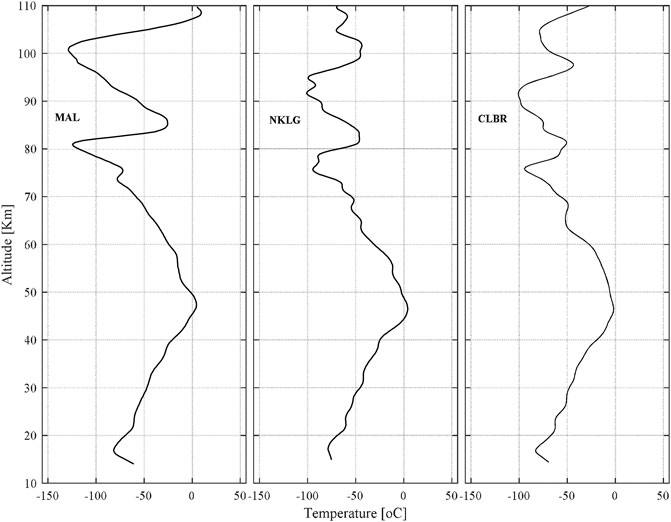
Figures 10, 11 show the time rate of change in TEC calculated in 5-min latency. The Dst index was used to examine storm intensity on scintillation enhancements or inhibition. A careful observation of the mid latitude ROTI index, we observed ROTI <0.25 TECU/min, which indicates no fluctuations in early morning hours, and 0.25 ≤ ROTI <0.5 TECU/min, which indicates weak ionospheric irregularities mostly in the daytime sector. The density of the occurrence rate gradually fades out as electrons are being propagated at magnetic field lines and follow latitudinal gradients. This implies that the disturbance travels northward during the prestorm morning sector at ∼ 04:00 UT, which is not the same situation as the results of Bolaji et al., 2020 but agrees with Jonah et al., 2016 and Hernández-Pajares et al., 2012, where atmospheric gravity waves have been identified as major drivers of daytime medium-scale traveling ionospheric disturbances. The low latitudes followed postsunset occurrence, where the triggering effect did not follow intensification of the z-component of IMF, as observed by Biktash, 2004. Figures 12, 13 show mid- and low-latitude perturbed temperature profiles that exhibited a vertical signature of AGW propagating with an increase in amplitude with height (Jonah et al., 2016). It could be seen that mid and low latitudes have different conditions for such action and AGW as one seeding effect for irregularities.
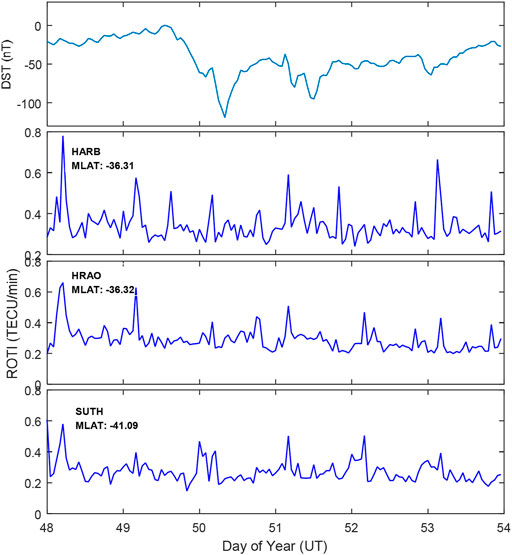
FIGURE 10. Mid latitude rate of change in TEC index (ROTI) TECU/min for 19 February 2014 initial and recovery phases of the geomagnetic storm.
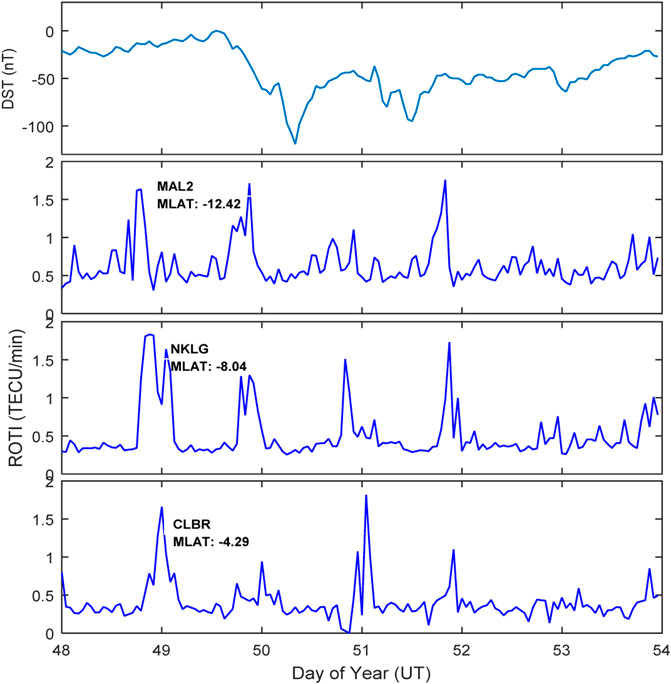
FIGURE 11. Low latitude rate of change in TEC index (ROTI) TECU/min for 19 February 2014 initial and recovery phases of the geomagnetic storm.
Figure 14 shows the mid- and low-latitude TEC configuration during the storms of March 2012 and May 2017. The geomagnetic storm of March 7 until 12 (DOY 67-72) shows a minimum Dst depression of -145 nT (DOY 69) at 8 UT when a solar plasma speed of 712 km/s is recorded. Bz at this time is -12.1 nT, associated with an IEF Ey value of 7.55 mV/m when Kp is 80 (>7) and AE and AL values of 1,109 nT and -997 nT, respectively. The proxy for solar flux is 143.5 sfu, which indicates the solar activity strength. The initial phase of the storm started with a gradual increase in the solar plasma speed until the sudden commencement of storm 11 UT (DOY 68). The solar activity started to decrease during recovery phase 5 UT (DOY 71), with 129.5 sfu maxima at Bz -2.4 nT and a solar plasma speed of 428 km/s when Dst was -47 nT. Additionally, the May storm (DOY 146-151) recorded a Dst minimum of -125 nT at 7 UT (DOY 148) when a Bz value of -11.2 nT and AE and AL values of 1,083 nT and -997 nT were attained. The solar plasma speed at this time is 368 km/s, and the solar proxy is 81 sfu. The storm occurred during low solar activity with an initial phase of low-speed solar plasma value of 328 km/s at 3 UT when Kp < 1. At this time, the aurora indices are 83 nT and -23 nT, respectively. The recovery phase of the storm started at 7 UT immediately at minimum Dst with gradual recovery of AE and AL values of 738 nT and -641 nT, respectively. The storm recovery phase lasted a few hours with geomagnetic conditions of Bz 12.7 nT and an IEF Ey value of -3.7 mV/m, and Kp < 1 was attained.
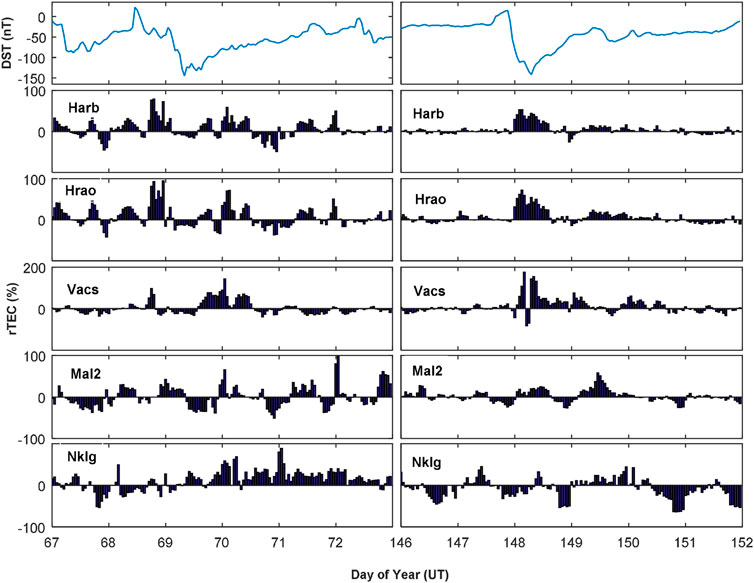
FIGURE 14. Mid- and low-latitude 5-days TEC anomalies for March 9, DOY 69 (left panel) and May 28 (DOY 148), 2012 storms.
The HARB station shows significant early-hour TEC enhancements during the March storm main phase (DOY 67) from 21 UT until 23 UT, and TEC depletion is observed. This is similar to the HRAO station, with slight differences at the VACS station. We observed TEC enhancements a few hours after the sudden commencement of the storm (HARB and HRAO). Daytime TEC depletion dominated during the main storm phase, followed by an enhancement from 14 UT. This is observed at all midlatitude stations. The recovery phase of the storm records a few hours of TEC depletion and is later dominated by enhancement.
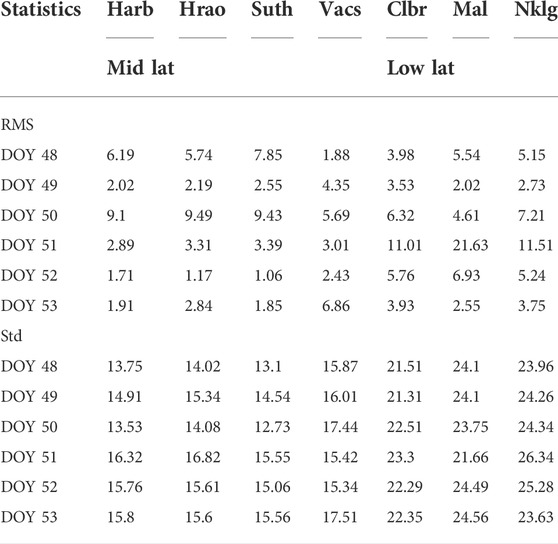
The low latitude ionosphere records TEC depletions during the storm initial phase until the sudden commencement. We observe TEC enhancements during the main storm phase for MAL2 but depletion for the NKLG station, followed by enhancements in NKLG and depletion in MAL2 during recovery. We observe insignificant TEC anomalies for the May storm during the initial phase at the mid latitude stations (DOY 146) until sudden commencement. The main storm phase recorded TEC enhancements of 0 UT (DOY 146) HARB and HRAO until the recovery phase (DOY 149) at 21 UT for the midlatitude stations. The low-latitude TEC shows a complex pattern with excursions of enhancements and depletions during the initial storm phase until the main phase. We observe that TEC depletion dominates during the storm recovery phase. Table 2 shows the daily statistics of the root mean square (RMS) and standard deviation (std) distribution derived from the observed and background TECs. RMS shows the accuracy metric from station to station, and std compares the measure of variances that indicates the uniform behavior of the ionosphere at any particular station. Additionally, it also signifies the bias in the sliding-median calculation. The midlatitude stations mostly show the highest RMS values except for the VACS station. This is slightly different when compared with the low latitude stations. Additionally, the high std for the low-latitude stations shows noticeable anomalous TEC values. The increases in RMS and std are more significant during geomagnetic storm days (DOY 50) and more visible at the low-latitude stations. The configuration in the TEC is associated with geomagnetic conditions and local storm time.
The largest std is seen at the NKLG station and supports the TEC configuration with latitude during geomagnetic storms, while the smallest std is at the SUTH station, with a value of 12.73. This could correlate with the measurable scintillation effect. Studies such as Alfonsi et al., 2011 ascertain that only measures in TEC could not be sufficient to measure scintillation conditions. The results of Doherty et al., 2004 suggest that TEC correlates with scintillations. The results of our study support that the TEC configuration correlates with irregularities mostly in the low-latitude ionosphere and has a nighttime effect. This is also observed in the results of Cherniak and Zakharenkova, 2022, who observed that nighttime until sunrise irregularities persist at low latitudes.
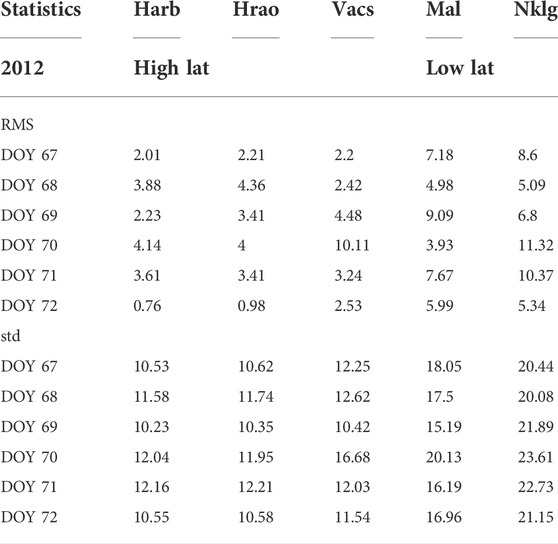
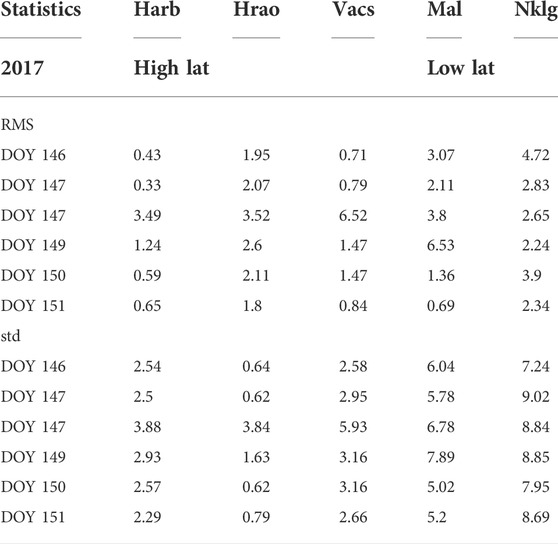
Table 3 and Table 4 also show the statistics of March and May storms. The storm main phase also records a significant RMS (DOY 69) and is also observed on DOY 68 and DOY 70, while the std values for DOY 69 show the lowest values. The May storm RMS values (DOY 148) also show high values of std when compared with other DOYs. It is important to note the statistical values for the May storm that could clearly show low behavior of the ionosphere during the period.
Discussion
In the present study, we have examined storm-time TEC anomalies and the rate of occurrence of ionospheric irregularities using the ROTI index in the low- and midlatitude ionosphere of the African sector with more emphases during storm initial and recovery phases. The accurate understanding of TEC anomalies and their contributions to the formation of low-latitude ionospheric irregularities during storms remains a challenge, and the physics remain questionable. The median-average sliding window, as suggested in previous literature (Arikan et al., 2003; Kutiev et al., 2005; Kutiev et al., 2006; Pancheva et al., 2016; Jimoh et al., 2020), may be appropriate for the identification of TEC anomalies during geomagnetic storms. The low latitudes show larger TEC variations than the mid latitudes. Positive ionospheric storms are associated with time delay and scintillation problems in satellite communications, while negative storms can cause radio blackouts in ground-based radio communication. Figures 3–6 show midlatitude TEC anomalies where positive storms were observed during the morning sector and seem to originate from the fountain effect (Mannucci et al., 2005).
The low-latitude TEC anomaly showed that plasma reappeared during postsunset (21:00 UT). We emphasize that the upward propagation of gravity waves can be affected by a wind filtering mechanism (Medeiros et al., 2003) that could result from pressure gradient force. The passage of gravity waves involves vertical displacement of air parcels from the lower atmosphere into the ionosphere with an upward propagation of energy. At postsunset, both meridional and zonal winds may change the F-layer low latitude features, thereby influencing the generation of postsunset irregularities.
The results from this study prove that trans-equatorial traveling wind associated with gravity waves pumps plasma into high latitudes and possibly reduces field line conductivity and retards irregularities in the mid latitudes. Yizengaw et al., 2013 identified that postsunset plasma irregularities extend to higher latitudes in the American and African sectors, and the results presented in this study support this hypothesis. We added in this study that different scales of ionospheric irregularities driven by geomagnetic storms depend on magnetic field line conductivity and are more pronounced during pre- and poststorm phases. At certain heights, probably ∼30 and 100 km, considerable dynamic variations were observed in the temperature profile and clearly indicated AGW propagation up to 110 km altitude (Figure 12 and Figure 13). The propagation of AGWs may be responsible for TEC anomalies. The geographic coordinates of SABER at mid latitudes (lat: 21.04 oS–31.90 oS, long: 39.88 oE–55.46 oE) from 1,420 to 1558 UT and low latitudes (lat: 2.34 oS–4.52 oS, long: 23.54 oE–48.56 oE) from 1,414 to 2440 UT are used to examine irregularities in the African sector. The comparison with other storms during both ascending and low solar activity (Figure 14) clearly indicates that TEC has a traceable correlation with scintillation effects and may not have a strong effect on storm strength. The global ROTI map also shows that the scintillation effect is more severe during the pre- and poststorm periods.
The physics of the magnetic field lines identified in the southward gravity waves become weaker from the lower to the high latitudes of EIA. The EIA is known to be produced by the F-region dynamo action (Kumar et al., 2013), and enhancements of TEC and scintillations over the low latitudes may only be explained by ionospheric electrodynamics.
Conclusion
In this paper, we investigated TEC anomalies from permanent GNSS stations in Africa during the initial and recovery phases of the 19 February 2014 geomagnetic storm. Our results show significant TEC enhancements during the initial and recovery phases of the storm, with a strong dependence on geomagnetic longitude and latitude. The TEC profiles at the midlatitude stations show many irregularities during the recovery phase. These irregularities may be attributed to plasma drift effects on TEC distribution. The anomalies are more pronounced at low latitudes during the recovery phase. During nighttime hours, during the recovery phase, negative enhancements are very consistent at all the low-latitude stations. The comparison of rTEC during the initial and recovery phases presents a very strong latitudinal dependence. During the recovery phase, TEC enhancements in the low latitudes of African stations are due to the poststorm effect.
During the initial phase, the TEC variations at early hours may serve as a tool to determine SED, where electric field effects seem to be a major driver of ionospheric variations at low latitudes (Pancheva et al., 2016). It is well known that a postsunset zonal electric field prompts plasma drift, lifting the F-layer to higher altitudes that results in a condition of ionospheric irregularities.
Our results show a level of consistency with previous studies that have deployed various methods to study TEC. However, some new findings related to the African region are presented below:
1) This study revealed that low latitude daytime magnetic lines plasma diffusion observed during pre- and poststorm effects are from lower atmosphere waves (Jonah et al., 2016) that modulate ionospheric electron density and may be responsible for the lasting TEC enhancements.
2) ROTI strength > 1 TECU/min is found at low latitude stations during postsunset and < 1 TECU/min at mid latitudes during daytime, where rTEC differences between midlatitude stations may be caused by dynamo of the electric field originating from energy input during geomagnetic disturbances.
3) The presented localized storm-time TEC dayside enhancements and depletion over the latitudes during the February storm could be helpful in the ionosphere model, and its GNSS fluctuation impact on the low latitude African ionosphere is well known.
Data availability statement
The original contributions presented in the study are included in the article/supplementary material, further inquiries can be directed to the corresponding author.
Author contributions
CA provided the main ideas, developed the methodology model, conceived and performed the comparison experiments, and analyzed the results; FO, KO, BR, and DO provided supervision and mentorship.
Acknowledgments
The TEC data used were provided by the Africa Geodetic Reference Frame (AFREF, http://afrefdata.org). The space weather indices are available at the NASA OMNI website (http://omniweb.gsfc.nasa.gov/). The first author is grateful to the Centre for Atmospheric Research for opportunity offered under the University Support Program (USP) of the Centre to visit and conduct this research at the Centre’s Space Environment Research Facility in Abuja. Special thanks are given to Mirko Piersanti and to the anonymous reviewers for helping to improve the manuscript.
Conflict of interest
The authors declare that the research was conducted in the absence of any commercial or financial relationships that could be construed as a potential conflict of interest.
Publisher’s note
All claims expressed in this article are solely those of the authors and do not necessarily represent those of their affiliated organizations, or those of the publisher, the editors and the reviewers. Any product that may be evaluated in this article, or claim that may be made by its manufacturer, is not guaranteed or endorsed by the publisher.
References
Afraimovich, E. L., Astafyeva, E. I., Demyanov, V. V., Edemskiy, I. K., Gavrilyuk, N. S., Ishin, A. B., et al. (2013). A review of GPS/GLONASS studies of the ionospheric response to natural and anthropogenic processes and phenomena. J. Space Weather Space Clim. 3, A27. doi:10.1051/swsc/2013049
Alfonsi, L., Spogli, L., De Franceschi, G., Romano, V., Aquino, M., Dodson, A., et al. (2011). Bipolar climatology of GPS ionospheric scintillation at solar minimum. Radio Sci. 46, RS0D05. doi:10.1029/2010RS004571
Anderson, D., Anghel, A., Chau, J., and Veliz, O. (2004). Daytime verticalE×Bdrift velocities inferred from ground-based magnetometer observations at low latitudes. Space weather. 2, S11001. doi:10.1029/2004SW000095
Arikan, F., Erol, C. B., and Arikan, O. (2003). Regularized estimation of vertical total electron content from Global Positioning System data. J. Geophys. Res. 108 (A12), 1469. doi:10.1029/2002JA009605
Astafyeva, E., Zakharenkova, I., Hozumi, K., Alken, P., Coïsson, P., Hairston, M. R., et al. (2018). Study of the equatorial and low-latitude electrodynamic and ionospheric disturbances during the 22–23 June 2015 geomagnetic storm using ground-based and spaceborne techniques. JGR. Space Phys. 123 (3), 2424–2440. doi:10.1002/2017JA024981
Astafyeva, E., Bagiya, M. S., Förster, M., and Nishitani, N. (2019). Unprecedented hemispheric asymmetries during a surprise ionospheric storm: A game of drivers. J. Geophys. Res. Space Phys. 125, e2019JA027261. doi:10.1029/2019JA027261
Astafyeva, E., Bagiya, M. S., Förster, M., and Nishitani, N. (2020). Unprecedented hemispheric asymmetries during a surprise ionospheric storm: A game of drivers. J. Geophys. Res. Space Phys. 125, e2019JA027261. doi:10.1029/2019JA027261
Azeem, I., and Barlage, M. (2017). Atmosphere-ionosphere coupling from convectively generated gravity waves. Adv. Space Res. 61, 1931–1941. doi:10.1016/j.asr.2017.09.029
Baker, D. N. (1986). Solar wind-magnetosphere drivers of space weather. J. Atmos. Terr. Phys. 58, 1509–1526. doi:10.1016/0021-9169(96)00006-2
Biktash, L. (2004)., 22. Copernicus GmbH, 3195–3202. doi:10.5194/angeo-22-3195-2004 Role of the magnetospheric and ionospheric currents in the generation of the equatorial scintillations during geomagnetic stormsAnn. Geophys.
Blanc, M., and Richmond, A. D. (1980). The ionospheric disturbance dynamo. J. Geophys. Res. 85 (A4), 1669–1699. doi:10.1029/JA085iA04p01669
Bolaji, O. S., Adebiyi, S. J., Fashae, J. B., Ikubanni, S. O., Adenle, H. A., and Owolabi, C. (2020). Pattern oflatitudinal distribution of ionosphericirregularities in the African region andthe effect of March 2015 St. Patrick'sDay storm. J. Geophys. Res. Space Phys. 125, e2019JA027641. doi:10.1029/2019JA027641
Borries, C., Berdermann, J., Jakowski, N., and Wilken, V. (2015). Ionospheric stormsA challenge for empirical forecast of the total electron content. J. Geophys. Res. Space Phys. 120, 3175–3186. doi:10.1002/2015JA020988
Calabia, A., and Jin, S. G. (2020). New modes and mechanisms of long-term ionospheric TEC variations from Global Ionosphere Maps. J. Geophys. Res. Space Phys. 125 (6). doi:10.1029/2019JA027703
Carmo, C. S., Denardini, C. M., Figueiredo, C. A. O. B., Resende, L. C. A., Picanço, G. A. S., Barbosa Neto, P. F., et al. (2021). Evaluation of different methods for calculating the ROTI index over the Brazilian sector. Radio Sci. 56, e2020RS007140. doi:10.1029/2020RS007140
Cherniak, I., and Zakharenkova, I. (2022). Development of the storm-induced ionospheric irregularities at equatorial and middle latitudes during the 25–26 August 2018 geomagnetic storm. Space weather. 20, e2021SW002891. doi:10.1029/2021SW002891
Cherniak, I., Zakharenkova, I., and Redmon, R. J. (2015). Dynamics of the high-latitude ionospheric irregularities during the 17 March 2015 St. Patrick's Day storm: Ground-based GPS measurements. Space weather. 13 (9), 585–597. doi:10.1002/2015SW001237
Codrescu, M., Fuller-Rowell, T. J., and Kutiev, I. (1997). Modeling the F layer during specific geomagnetic stormsfic Geomagnetic Storms. J. Geophys. Res. 102, 14315–14329. doi:10.1029/97JA00638
Danilov, A., and Lastovicka, J. (2001). Effects of geomagnetic storms on the ionosphere and atmosphere. Int. J. Geomagn. Aeron. 2, 209–224. doi:10.1016/0021-9169(95)00106-9
Ding, F., Wan, W., Xu, G., Yu, T., Yang, G., and Wang, J. (2011). Climatology of medium-scale traveling ionospheric disturbances observed bya GPS network in central China. J. Geophys. Res. 116, A09327. doi:10.1029/2011JA016545
Doherty, P., Coster, A., and Murtagh, M. (2004). Space weather effects of october–november 2003. GPS Solutions 8 (4), 267–271. doi:10.1007/s10291-004-0109-3
Dungey, J. W. (1956). Convective diffusion in the equatorial F region. J. Atmos. Terr. Phys. 9 (5–6), 304–310. doi:10.1016/0021-9169(56)90148-9
Durgonics, T., Komjathy, A., Verkhoglyadova, O., Shume, E. B., Benzon, H.-H., Mannucci, A. J., et al. (2017). Multiinstrument observations of a geomagnetic storm and its effects on the arctic ionosphere: A case study of the 19 february 2014 storm. Radio Sci. 52, 146–165. doi:10.1002/2016RS006106
Fagundes, P. R., Cardoso, F. A., Fejer, B. G., Venkatesh, K., Ribeiro, B. A. G., and Pillat, V. G. (2016). Positive and negative GPSTEC ionospheric storm effects during the extreme space weather event of March 2015 over the Brazilian sector. J. Geophys. Res. Space Phys. 121, 5613–5625. doi:10.1002/2015JA022214
Fejer, B. G., and Scherliess, L. (1995). Time dependent response of equatorial ionospheric electric fields to magnetospheric disturbances. Geophys. Res. Lett. 22, 851–854. doi:10.1029/95GL00390
Fukushima, D., Shiokawa, K., Otsuka, Y., and Ogawa, T. (2012). Observation of equatorial nighttime medium- scale traveling ionosphericdisturbances in 630-nm airglow images over 7 years. J. Geophys. Res. 117, A10324. doi:10.1029/2012JA017758
Galav, P., Rao, S., Sharma, S., Gordiyenko, G., and Pandey, R. (2014). Ionospheric response to the geomagnetic storm of 15 May 2005 over midlatitudes in the day and night sectors simultaneously. J. Geophys. Res. Space Phys. 119, 5020–5031. doi:10.1002/2013JA019679
Ghamry, E., Lethy, A., Arafa-Hamed, T., and Elaal, E. A. (2016). A comprehensive analysis of the geomagnetic storms occurred during 18 February and 2 March 2014. NRIAG J. Astronomy Geophys. 5, 263–268. doi:10.1016/j.nrjag.2016.03.001
Gonzalez, W. D., Joselyn, J. A., Kamide, Y., Kroehl, H. W., Rostoker, G., Tsurutani, B. T., et al. (1994). What is a geomagnetic storm? J. Geophys. Res. 99, 5771–5792. doi:10.1029/93JA02867
Gurtner, W., and Mader, G. (1990). “The RINEX format: Current status, future developments proc,” in 2nd Int. Symp. of Precise Positioning with GPS, Ottawa, Canada, 977–992.
Habarulema, J. B., Lee-Anne, M., Deia, B., Youngliang, Z., Gopi, S., Chigomezyo, N., et al. (2013). A comparative study of TEC response for the African equatorial and mid- latitudes during storm conditions. J. Atmos. Sol. Terr. Phys. 102, 105–114. doi:10.1016/j.jastp.2013.05.008
Hernández-Pajares, M., Juan, J. M., Sanz, J., and Aragón-Àngel, A. (2012). Propagation of medium scale traveling ionospheric disturbances at different latitudes and solar cycle conditions. Radio Sci. 47, RS0K05. doi:10.1029/2011RS004951
Huang, C. S., and Kelley, M. C. (1996). Nonlinear evolution of equatorial spread F: 2. Gravity wave seeding of Rayleigh-taylor instability. J. Geophys. Res. 101, 293–302. doi:10.1029/95ja02210
Jacobsen, K. S., and Dähnn, M. (2014). Statistics of ionospheric disturbances and their correlation with GNSS positioning errors at high latitudes. J. Space Weather Space Clim. 4, A27. doi:10.1051/swsc/2014024
Jakowski, N., Béniguel, Y., de Franceschi, G., Pajares, M. H., Jacobsen, K. S., Stanislawska, I., et al. (2012). Monitoring, tracking and forecasting ionospheric perturbations using GNSS techniques. J. Space Weather Space Clim. 2, A22. doi:10.1051/swsc/2012022
Jakowski, N., Wehrenpfennig, A., Heise, S., and Kutiev, I. (2002). Space weather effects on transionospheric radio wave propagation on 6 April 2000. Acta Geod. Geophys. Hung. 37 (2-3), 213–220. doi:10.1556/AGeod.37.2002.2-3.10
Jimoh, O. E., Yesufu, T. K., and Ariyibi, E. A. (2016). Investigation of ionospheric response to geomagnetic storms over a low latitude station, ile-ife, Nigeria. Acta Geophys. 64 (3), 772–795. doi:10.1515/acgeo-2016-0013
Jimoh, O., Lei, J., and Huang, F. (2020). Investigation of daytime total electron content enhancements over the asian-Australian sector observed from the beidou geostationary satellite during 2016–2018. Remote Sens. 12, 3406. doi:10.3390/rs12203406
Jonah, O. F., Kherani, E. A., and De Paula, E. R. (2016). Observation of TEC perturbation associated with mediumscale traveling ionosphericdisturbance and possible seeding mechanism of atmospheric gravity wave at a Brazilian sector. J. Geophys. Res. Space Phys. 121, 2531–2546. doi:10.1002/2015JA022273
Joshua, B. W., Adeniyi, J. O., Amory-Mazaudier, C., and Adebiyi, S. J. (2021). On the pre magnetic storm signatures in NmF2 in some equatorial, low- and mid-latitude stations. JGR. Space Phys. 126, e2021JA029459. doi:10.1029/2021ja029459
King, J. H., and Papitashvili, N. E. (2005). Solar wind spatial scales in and comparisons of hourly Wind and ACE plasma and magnetic field data. J. Geophys. Res. 110, A02104. doi:10.1029/2004JA010649
Kumar, S., Singh, A. K., and Lee, J. (2013). Equatorial Ionospheric Anomaly (EIA) and comparison with IRI model during descending phase of solar activity (2005–2009). Adv. Space Res. 53, 724–733. doi:10.1016/j.asr.2013.12.019
Kutiev, I., Otsuka, Y., Saito, A., and Watanabe, S. (2006). GPS observations of poststorm TEC enhancements at low latitudes. Earth Planets Space 58, 1479–1486. doi:10.1186/BF03352647
Kutiev, I., Watanabe, S., Otsuka, Y., and Saito, A. (2005). Total electron content behavior over Japan during geomagnetic storms. J. Geophys. Res. 110, A01308. doi:10.1029/2004JA010586
Lei, J., Huang, F., Chen, X., Zhong, J., Ren, D., Wang, W., et al. (2018). Was magnetic storm the only driver of the long-duration enhancements of daytime total electron content in the asian-Australian sector between 7 and 12 september 2017? JGR. Space Phys. 123, 3217–3232. doi:10.1029/2017JA025166
Lei, J., Wang, W., Burns, A. G., Solomon, S. C., Richmond, A. D., Wiltberger, M., et al. (2008). Observations and simulations of the ionospheric and thermospheric response to the December 2006 geomagnetic storm: Initial phase. J. Geophys. Res. 113, A01314. doi:10.1029/2007JA012807
Liu, Z., Li, Y., Li, F., and Guo, J. (2018). Near real-time PPP based monitoring of the ionosphere using dual frequency GPS/BDS/Galileo data. Adv. Space Res. 61 (6), 1435–1443. doi:10.1016/j.asr.2017.12.038
Loewe, C., and Prölss, G. (1997). Classification and mean behavior of magnetic storms. J. Geophys. Res. 102, 14209–14213. doi:10.1029/96JA04020
Mannucci, A. J., Tsurutani, B. T., Iijima, B. A., Komjathy, A., Saito, A., Gonzalez, W. D., et al. (2005). Dayside global ionospheric response to the major interplanetary events of October 29-30, 2003“Halloween Storms”. Geophys. Res. Lett. 32 (12), 1–4. doi:10.1029/2004GL021467
Mannucci, A. J., Wilson, B. D., and Edwards, C. D. (1993). “A new method for monitoring the Earth's ionospheric total electron content using the GPS global network,” in Proceedings of the 6th International Technical Meeting of the Satellite Division of the Institute of Navigation (ION GPS 1993), Salt Lake City, UT, 13231332.
Martinis, C., Mendillo, M., and Aarons, J. (2005). Toward a synthesis of equatorial spread F onset and suppression during geomagnetic storms. J. Geophys. Res. 110, A07306. doi:10.1029/2003JA010362
Medeiros, A. F., Taylor, M. J., Takahashi, H., Batista, P. P., and Gobbi, D. (2003). An investigation of gravity wave activity in the low-latitudeupper mesosphere: Propagation direction and wind filtering. J. Geophys. Res. 108 (D14), 4411. doi:10.1029/2002JD002593
Mendillo, M. (2006). Storms in the ionosphere: Patterns and processes for total electron content. Rev. Geophys. 44, RG4001. doi:10.1029/2005rg000193
Milanowska, B., Weilgosz, D., Kyrpiak-Gregorczyk, A., and Jarmolowski, W. (2021). Accuracy of global ionosphere maps in relation to their time interval. Remote Sens. (Basel). 13, 3552. doi:10.3390/rs13183552
Moeketsi, D. M., McKinnell, L. A., and Combrinck, W. L. (2016). Solar activity effects on the ionosphere total electron content derived from global navigation satellite System over South Africa. Available at: www.library.up.ac.za/digi/docs/moeketsi_abstract.pdf.
Muhtarov, P., and Kutiev, I. (1998). Empirical modelling of ionospheric storms at midlatitudes. Adv. Space Res. 22 (6), 829–832. doi:10.1016/S0273-1177(98)00106-9
Nava, B., RodríguezZuluaga, J., AlazoCuartas, K., Kashcheyev, A., MigoyaOrué, Y., Radicella, S. M., et al. (2016). Middle- and low-latitude ionosphere response to 2015 St. Patrick's Day geomagnetic storm. J. Geophys. Res. Space Phys. 121, 3421–3438. doi:10.1002/2015JA022299
Ngwira, C. M., Seemala, G. K., and Habarulema, J. B. (2013). Simultaneous observations of ionospheric irregularities in the African low-latitude region. J. Atmos. Sol. Terr. Phys. 97, 50–57. doi:10.1016/j.jastp.2013.02.014
Okoh, D., Habarulema, J. B., Rabiu, B., Seemala, G., Wisdom, J. B., Olwendo, J., et al. (2020). Storm time modeling of the African regional ionospheric total electron content using artificial neural networks. Space weather. 18, e2020SW002525. doi:10.1029/2020SW002525
Okoh, D., Seemala, G., Rabiu, B., Habarulema, J. B., Jin, S., Shiokawa, K., et al. (2019). A neural network based ionospheric model over Africa from constellation observing System for meteorology, ionosphere, and climate and ground global positioning System observations. J. Geophys. Res. Space Phys. 124, 10512–10532. doi:10.1029/2019ja027065
Pancheva, D., Mukhtarov, P., and Andonov, B. (2016). Global structure of ionospheric TEC anomalies driven by geomagnetic storms. J. Atmos. Solar-Terrestrial Phys. 145, 170–182. doi:10.1016/j.jastp.2016.04.015
Paznukhov, V. V., Carrano, C. S., Doherty, P. H., Groves, K. M., Caton, R. G., Valladares, C. E., et al. (2012). Equatorial plasma bubbles and Lband scintillations in Africa during solar minimum. Ann. Geophys. 30 (4), 675–682. doi:10.5194/angeo-30-675-2012
Pedatella, N. M., and Liu, H.-L. (2018). The influence of internal atmospheric variability on the ionosphere response to a geomagnetic stormfluence of internal atmospheric variability on the ionosphere response to a geomagnetic storm. Geophys. Res. Lett. 45, 4578–4585. doi:10.1029/2018GL077867
Perez, R. O. (2017). Ionospheric error contribution to GNSS single- frequency navigation at the 2014 solar maximum. J. Geod. 91 (4), 397–407. doi:10.1007/s00190-016-0971-0
Pi, X., Mannucci, A. J., Lindqwister, U. J., and Ho, C. M. (1997). Monitoring of global ionospheric irregularities using the worldwide GPS network. Geophys. Res. Lett. 24 (18), 2283–2286. doi:10.1029/97GL02273
Proelss, G. W. (1987). Storm-induced changes in the thermospheric composition at middle latitudes, Planet. Space Sci. 35, 807–811. doi:10.1016/0032-0633(87)90041-9
Rastongi, R. G. (1980). Seasonal variation of equatorial spread F in the American and Indian zones. J. Geophys. Res. 85 (A2), 722–726. doi:10.1029/ja085ia02p00722
Ren, D., Lei, J., Zhou, S., Li, W., Huang, F., Luan, X., et al. (2020). High-speed solar wind imprints on the ionosphere during the recovery phase of the August 2018 geomagnetic storm. Space weather. 18, e2020SW002480. doi:10.1029/2020SW002480
Sahai, Y., Becker-Guedes, F., Fagundes, P. R., Lima, W. L. C., Otsuka, Y., Huang, C. S., et al. (2007). Response of nighttime equatorial and low latitude F-region to the geomagnetic storm of August 18, 2003, in the Brazilian sector. Adv. Space Res. 39 (8), 1325–1334. doi:10.1016/j.asr.2007.02.064
Scherliess, L., and Fejer, B. G. (1999). Radar and satellite global equatorial F region vertical drift model. J. Geophys. Res. 104 (A4), 6829–6842. doi:10.1029/1999JA900025
Seemala, G. K., and Valladares, C. E. (2011). Statistics of total electron content depletions observed over the South American continent for the year 2008. Radio Sci. 46, RS5019. doi:10.1029/2011RS004722
Singh, R., Sripathi, S., Sreekumar, S., Banola, S., Emperumal, K., Tiwari, P., et al. (2015). Low- latitude ionosphere response to super geomagnetic storm of 17/18 March 2015: Results from a chain of ground-based observations over Indian sector. J. Geophys. Res. Space Phys. 120 (12), 10864–10882. doi:10.1002/2015JA021509
Skone, S., Knudsen, K., and De Jong, M. (2001). Limitations in GPS receiver tracking performance under ionospheric scintillation conditions. Phys. Chem. Earth, Part A Solid Earth Geodesy 26 (6-8), 613–621. doi:10.1016/S1464-1895(01)00110-7
Souza, A. L. C. D., and Camargo, P. D. O. (2019). Comparison of GNSS indices, ionosondes and all-sky imagers in monitoring the ionosphere in Brazil during quiet and disturbed days. Bol. Cienc. Geod. 25. doi:10.1590/s1982-21702019000s00005
Srinivasu, V. K. D., Prasad, D. S. V. V. D., Niranjan, K., Seemala, G. K., and Venkatesh, K. (2019). L-band scintillation and TEC variations on St. Patrick’s Day storm of 17 March 2015 over Indian longitudes using GPS and GLONASS observations. J. Earth Syst. Sci. 128 (2), 69. doi:10.1007/s12040-019-1097-6
Tsunoda, R. T. (1988). High-latitude F region irregularities: A review and synthesis. Rev. Geophys. 26 (4), 719–760. doi:10.1029/RG026i004p00719
Tsurutani, B. T., Gonzalez, W. D., Gonzalez, A. L. C., Guarnieri, F. L., Gopalswamy, N., Grande, M., et al. (2006). Corotating solar wind streams and recurrent geomagnetic activity: A review. J. Geophys. Res. 111, A07S01. doi:10.1029/2005JA011273
Valladares, C. E., Eccles, J. V., Basu, Su., Schunk, R. W., Sheehan, R., Pradipta, R., et al. (2017). The magnetic storms of 3–4 August 2010 and 5–6 August 2011: 1. Ground- and space-based observationsGround-and space-based observations. J. Geophys. Res. Space Phys. 122 (3), 3487–3499. doi:10.1002/2016JA023359
Venkatesh, K., Tulasi Ram, S., Fagundes, P. R., Seemala, G. K., and Batista, I. S. (2017). Electrodynamic disturbances in the Brazilian equatorial and low-latitude ionosphere on St. Patrick's Day storm of 17 March 2015. J. Geophys. Res. Space Phys. 122, 4553–4570. doi:10.1002/2017JA024009
Wang, W., Lei, J., Burns, A. G., Solomon, S. C., Wiltberger, M., Xu, J., et al. (2010). Ionospheric response to the initial phase of geomagnetic storms: Common features. J. Geophys. Res. 115, A07321. doi:10.1029/2009JA014461
Wautelet, G., Lejeune, S., and Warnant, R. (2009). “Effects of ionospheric small- scale structures on GNSS,” in IET 11th International Conference on Ionospheric Radio Systems and Techniques (IRST 2009) (London: IET), 196–200. doi:10.1049/cp.2009.0062
Xiong, C., Lühr, H., and Yamazaki, Y. (2019). An opposite response of the low-latitude ionosphere at asian and American sectors during storm recovery phases: Drivers from below or above. JGR. Space Phys. 124, 6266–6280. doi:10.1029/2019JA026917
Yeh, K. C., Franke, S. J., Andreeva, E. S., and Kunitsyn, V. E. (2001). An investigation of motions of the equatorial anomaly crest. Geophys. Res. Lett. 28 (24), 4517–4520. doi:10.1029/2001GL013897
Yermolaev, Y. I., Lodkina, I. G., Nikolaeva, N. S., and Yermolaev, M. Y. (2012). Recovery phase of magnetic storms induced by different interplanetary drivers. J. Geophys. Res. 117, A08207. doi:10.1029/2012JA017716
Yizengaw, E., Retterer, J., Pacheco, E. E., Roddy, P., Groves, K., Caton, R., et al. (2013). Post-midnight bubbles and scintillations in the quiet-time June solstice. Geophys. Res. Lett. 40, 5592–5597. doi:10.1002/2013GL058307
Yue, X., Wan, W., Liu, L., Liu, J., Zhang, S., Schreiner, W. S., et al. (2016). Mapping the conjugate and corotating storm-enhanced density during 17 March 2013 storm through data assimilation. J. Geophys. Res. Space Phys. 121 (12), 12,202–12,210. doi:10.1002/2016JA023038
Keywords: TEC anomalies, low latitude irregularities, geomagnetic storm, Africa geodetic reference frame, ROTI
Citation: Anoruo CM, Rabiu B, Okoh D, Okeke FN and Okpala KC (2022) Irregularities in the African ionosphere associated with total electron content anomalies observed during high solar activity levels. Front. Astron. Space Sci. 9:947473. doi: 10.3389/fspas.2022.947473
Received: 18 May 2022; Accepted: 09 August 2022;
Published: 01 September 2022.
Edited by:
David Ruffolo, Mahidol University, ThailandReviewed by:
Vladimir A Sreckovic, Institute of Physics, University of Belgrade, SerbiaChao Xiong, Wuhan University, China
Copyright © 2022 Anoruo, Rabiu, Okoh, Okeke and Okpala. This is an open-access article distributed under the terms of the Creative Commons Attribution License (CC BY). The use, distribution or reproduction in other forums is permitted, provided the original author(s) and the copyright owner(s) are credited and that the original publication in this journal is cited, in accordance with accepted academic practice. No use, distribution or reproduction is permitted which does not comply with these terms.
*Correspondence: Chukwuma Moses Anoruo, YW5vcnVvY2h1a3d1bWFAZ21haWwuY29t
 Chukwuma Moses Anoruo
 Babatunde Rabiu2
 Daniel Okoh
 Kingsley Chukwudi Okpala