 Mariel Lares-Martiz
- Stellar Variability Group, Institute of Astrophysics of Andalusia, Department of Stellar Physics, IAA-CSIC, Granada, Spain
Many pulsating star light curves must be interpreted strictly within the framework of a non-linear theory. The detection of non-linear interactions between pulsation modes has increased due to the ultra-precise photometric data provided by space missions. For this reason, it is now possible and essential to continue the effort of building data-driven non-linear pulsation models. The analysis of non-linear stellar light curves has become a fundamental challenge in asteroseismology in the era of space missions. In this article, a diagnostic method is presented. It is based on an observational characterization of the non-linear behavior of high-amplitude delta Scuti (HADS) stars. It diagnoses the nature of non-linear pulsations in δ Sct stars of lower amplitudes. It potentially provides an extra hint for identifying a radial mode and determine its radial order n. Additionally, it could show signatures of moderate to rapid rotation in these stars. Overall, this article shows the capabilities for making asteroseismic inferences from studying combination frequencies in δ Sct stars.
1 Introduction
The linear pulsation theory cannot explain the special features of some pulsating star light curves. This is the case of the so-called bump in Cepheid light curves (Christy, 1964), the sharp ascents and slow descents of luminosity in RR Lyrae (Christy, 1966), δ Sct (Stellingwerf, 1980; Buchler et al., 1997), and white dwarf light curves (Brickhill, 1992; Brassard et al., 1995; Goupil et al., 1998; Wu, 2001; Montgomery, 2005), as well as the upward and downward symmetry in SPB and γ Dor light curves (Kurtz et al., 2015), among other examples. These distortions of the sinusoidal shape of the light curve are effects, in the time domain, of non-linear mechanisms happening within the star. In the frequency domain (e.g., in a power spectrum), the effects or signature of the non-linearities within the star appear as excess power at combination frequencies of the independent pulsation modes. These independent modes are often called parent frequencies, and their interaction generates combination frequencies, often called children frequencies.
Recently, the subject of non-linear pulsations has attracted new reconsideration and has become a fundamental challenge for asteroseismology. Proper mode identification is critical to model variable stars. It is troublesome even considering only linear modes (Mirouh, this volume). The presence of non-linearities is an additional obstacle to take into account. It is not straightforward to identify combination frequencies from independent modes either. An independent mode of pulsation could be located at the frequency value of a combination by chance. For example, the regularities of the frequency spectrum could be wrongly interpreted as signatures of stellar rotation (Breger and Kolenberg, 2006; Bowman, 2017, see Figure 1 for a schematic example). This is particularly relevant in δ Sct stars, which often show puzzling power spectra that make it complex to perform mode identification. Fortunately, the ultra-precise photometric data available from space missions allow the detection of more combination frequencies, enabling additional in-depth study of the non-linear behavior exhibited by pulsating stars through observations (Balona, 2012; Kurtz et al., 2015; Bowman et al., 2016; Zong et al., 2018; Van Beeck et al., 2021).
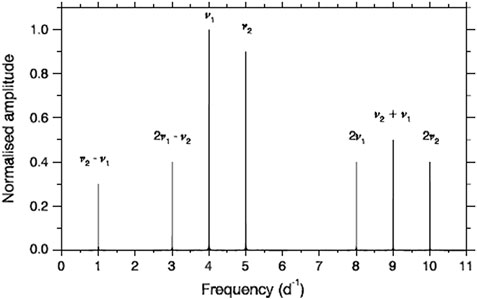
FIGURE 1. Example of fine structure of combination frequencies resembling a rotational splitting. Figure taken from Bowman (2017). Figure inspired by Breger and Kolenberg (2006, Figure 1).
A recurrent issue when studying the non-linear behavior of a pulsating star is the need to unambiguously identify the nature of the combination frequencies. Two distinct physical origins of non-linearities have been widely discussed (Breger and Lenz, 2008; Degroote et al., 2009; Breger and Montgomery, 2014; Balona, 2016; Zong et al., 2016; Bowman, 2017). On the one hand, resonant mode coupling, in which a stable mode becomes unstable (ω3) if any resonance condition involving an interaction between the parent frequencies (ω1, ω2) is met (e.g., ω3 ≈ ω1 + ω2, ω3 ≈ 2ω1, 2ω0 ≈ ω+ +ω−). This is for rotationally induced resonance, where ω0 is the central frequency of a dipole splitting m = 0, and ω+ and ω− corresponds to the m = +1 and m = −1, respectively. For non-radial parent modes, resonance can be helpful for mode identification (Buchler et al., 1997; Goupil et al., 1998).
On the other hand, the stellar medium can behave non-linearly when interacting with pulsation modes, causing short-term retention of the stellar flux and then its release over a longer time. Physically, the non-linear processes/mechanisms involved in observing such asymmetric (or non-sinusoidal) light curves could involve the interaction between the oscillation and the variation of the depth of the convective zone in the outer layer of a pulsating star (Brickhill, 1992; Wu, 2001), the non-linear flux response of the stellar medium induced by surface geometrical and temperature distortions (Brassard et al., 1995), or stellar atmospheric shock waves (Gillet and Fokin, 2014). Most of these theories were developed for white dwarfs and extrapolated to other pulsating stars, where a convective envelope is believed to be present. Combination frequencies resulting from the non-linear response of the stellar medium to pulsation do not have any asteroseismic use for δ Sct stars (Balona, 2012). They are considered spurious frequencies because they are not a solution to the perturbed stellar structure equations, and until now, their main interest has been to identify and remove them from the power spectra.
Distinguishing whether non-linearity is due to mode coupling or to non-linear response surpasses the goal of mode identification. The study of these is also relevant for shedding light on the mode selection processes in these stars, which is still a significant lack in the current theory of δ Sct stars. The excitation and damping mechanisms operating in these stars need to be revised (Balona and Dziembowski, 2011; Balona et al., 2015; Balona, 2018), or other mechanisms that cause amplitude enhancements or decreases in the power spectra that current models are unable to reproduce need to be introduced. In consequence, developing an understanding of non-linearities using high-quality photometry will put a good part of asteroseismic inferences into question.
A special subgroup among the δ Sct variables is the HADS stars. McNamara (2000) characterized this subgroup by defining their peak-to-peak light variation to be Δm ≥ 0.3 mag. This range corresponds to the highest observed amplitudes in δ Sct stars, which vary from thousandths up to tenths of a magnitude (Aerts et al., 2010). This difference suggests that an amplitude-limiting mechanism must operate in δ Sct stars but not in HADS stars (Breger and Montgomery, 2000). Dziembowski and Krolikowska (1985) showed that parametric resonance is the most likely amplitude-limiting mechanism at work in δ Sct stars. Bowman et al. (2016) also argued that the lack of amplitude modulation in HADS stars, which is sometimes a signature of resonant mode coupling, supports the hypothesis that resonance does not function in HADS stars. Furthermore, HADS stars are typically slow rotators and normally pulsate in radial modes (McNamara, 2000; Rodríguez et al., 2000). While some studies have claimed to find non-radial modes present in HADS (Garrido and Rodriguez, 1996; Pigulski et al., 2006), the resonance of non-radial modes is facilitated by a high rotational velocity (Baade, 1984; Saio et al., 2018), with velocities that are not expected for HADS stars. Consequently, HADS stars might be appropriate objects for studying the stellar envelope’s non-linear response. This suggests that they might be resonance-free pulsators, such that the combination frequencies in these stars would be caused only by the non-linear response processes in the stellar envelope. However, it is not a proven fact that HADS are resonance-free pulsators (resonance can also yield constant amplitudes, e.g., bump Cepheids or double-mode Cepheids).
Here a new diagnostic method is presented to make asteroseismic inferences from the study of non-linearities. From an empirical characterization of the non-linear behavior of HADS stars, the method can identify the physical origin of non-linearities in δ Sct stars of lower amplitudes. This method can potentially identify whether the parent frequencies are radial, thus providing an extra hint for mode identification. It might also show signatures of moderate to fast rotation in HADS stars. The article is organized as follows: Section 2 describes the method to identify non-linearities in the power spectra and the mathematical framework to study them. In addition, a characterization is presented of non-linear behavior in a set of HADS stars, along with the explanation of the diagnostic method. The results of the application of the method to a sample of δ Sct stars are given in Section 3, along with the asteroseismic inferences that can be made. Finally, Section 4 summarizes the conclusions drawn from this study, open issues, and future work.
2 Data and analysis methods
In signal processing theory, the Volterra expansion describes the output signal of a non-linear system. Garrido and Rodriguez (1996) were the first to propose it as a general framework suitable to describe non-linear light curves. In this framework, the non-linear light curve is described as a sum of sinusoids whose frequencies are independent modes of pulsations and combination frequencies (harmonic, sum and subtraction combinations). Each sinusoid composing an output signal also depends on a set of unknown complex functions called the generalized transfer functions (ΓO). For example, when the input to a non-linear system is composed of two real-valued sine waves at frequencies ω0 and ω1, the output Y(t) can be expressed (see p. 30 in Priestley, 1988) by
The system is entirely determined when the ΓO functions are fully known. They characterize the non-linear system, and so it is important to properly represent them. Their representation is implemented by relating the ΓO functions to the Fourier parameters (frequencies, amplitudes, and phases). The following section explains these relations and a method of determining the Fourier parameters.
2.1 The best parent method and the ΓO functions
In the Volterra expansion framework, explained in detail in Lares-Martiz et al. (2020), it is possible to derive a general expression for the Fourier parameters of the terms composing the light curve of a non-linear system (in our case, a pulsating star). For the frequencies, amplitudes and phases, the general form would be
where ωi,j, Ai,j, and φi,j are the frequencies, amplitudes, and phases of the parent modes. Likewise, n and m are integer numbers. Ωc is a combination frequency, with Ac and φc as its corresponding amplitude and phase. arg{ΓO} and |ΓO| are the argument and modulus of the complex generalized transfer functions (ΓO) characterizing the non-linear system.
2.1.1 The best parent method
The best parent method (BPM) identifies the family of combination frequencies in the power spectrum that follows Eq. 2. It guarantees that this family yields the residual light curve with minimum variance. The parents that generate this family are found by building a grid of possible parent modes around a first guess. The initial guesses are selected from peaks where there is excess power matching any of the known period-ratio relations (Suárez and Garrido, 2006, for the fundamental mode P0 and first overtone P1: P0/P1, and Stellingwerf, 1979, for the fundamental mode and second overtone P2: P0/P2 and for the fundamental mode and third overtone P3: P0/P3). The two most dominant frequencies are chosen if no frequency obeys these period ratios. The advantage of the BPM over other algorithms (e.g., COMBINE; Reegen, 2011) is that the parent search is conducted exhaustively and automatically, achieving great precision in terms of frequency. The details of this method, its performance, and other more advantages are described in Lares-Martiz et al. (2020) and Lares-Martiz (2021).
Eq. 2 is restricted to a two-term expression when computing the BPM. This will avoid fits by chance, as almost any number can be written as a linear combination of the form of Eq. 2 if this expression has many terms. The integer numbers n and m are chosen so ωc is never above the Nyquist frequency. The output of the BPM algorithm is a list of statistically significant combination frequencies along with their amplitudes and phases (Ac and Φc, respectively). In this study, the statistical significance of each frequency is confirmed with a Student’s t-test at a confidence level of 99.9%.
2.1.2 The ΓO functions
The Volterra expansion depends on the set of complex functions called generalized transfer functions, or ΓO functions (Eq. (1)). Index O denotes the order of non-linear interactions defined as O = |n| + |m|, i.e., Γ1 represents the system response for each independent frequency, Γ2 represents the system response for second-order interactions, and so on. The complex generalized transfer functions contain the non-linear physics involved in the star. Therefore, it is of great interest to somehow characterize them. The ΓO functions must be fully known to obtain a physical model that explains non-linear effects.
From the Volterra expansion (Eqs. 2, 3, 4), the modulus and the argument of the ΓO functions are
where Ar and Δϕ are the amplitude ratio and relative phase, respectively, using Simon and Lee (1981) nomenclature.
2.2 The ΓO functions of HADS stars: The non-linear response Template
The ΓO functions of 17 HADS stars are studied in this section. Figure 2 shows the modulus and the argument of the ΓO functions of all statistically significant harmonic, sum, and subtraction combination frequencies detected by BPM in the spectra of the 17 HADS stars. The subtraction combinations (symbols with red circles) seemed to be more scattered in their relative phases or amplitude ratio patterns. A few plausible explanations are provided in Section 4.1.1.3. Regardless of the subtraction problem, we continued to analyze the harmonics and sum combinations, considering the interesting patterns obtained. In Figure 3 we show only the relative phases and amplitude ratios involving harmonic and sum combination frequencies. The y-axis in this figure represents the difference between the observed phase for a combination frequency and the phase that a combination of two signals predicts (Eq. 6). This axis is cyclic (from 0 to 2π rad), and we represent one cycle of the relative phases for simplicity. This means that only combinations up to the order O = 9 are represented. The x-axis represents the amplitude ratios (Eq. 5). Figure 3 therefore shows that the ΓO functions seem to follow a similar pattern in every HADS star, characterizing their non-linear behavior.
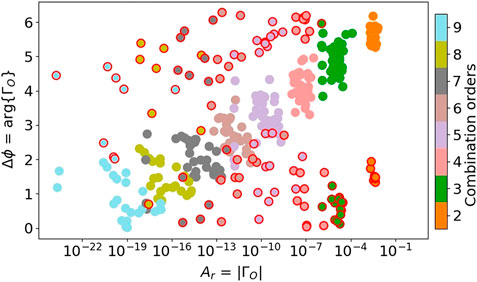
FIGURE 2. Raw template of combination frequencies (harmonics, sums, and subtractions) from the non-linear response. Concretely, up to O = 9 of the relative phases and amplitudes ratios for the 17 HADS stars listed in Table 1. Symbols with red circles are the subtraction combinations.
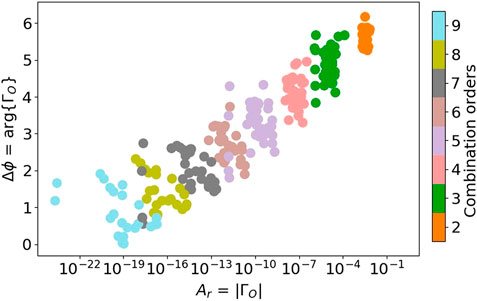
FIGURE 3. Same as Figure 2 but without the subtraction combinations.
The general pattern seems distorted for 6 of the 17 analyzed HADS stars: the combination frequency orders overlap. From the 6 HADS showing distorted patterns, four of them are mono-periodic, and two are double-mode HADS stars. Although HADS stars are typically slow rotators (v sin i ≲ 30 km s−1; Rodríguez et al., 2000; McNamara, 2000; Balona, 2016), one of the four mono-periodic stars have moderate rotational velocities range (TIC 126659093: v sin i = 35 km s−1. Value source: Antoci et al., 2019, Table A1). This might distort the relative phases plot (see Figure 4, left plot), allowing us to infer moderate to high rotational velocities in other stars with similar deviations in their relative phases plot (e.g., TIC 261089835 and TIC 431589510, for which no rotation values are available) (see Figure 4, right plot).
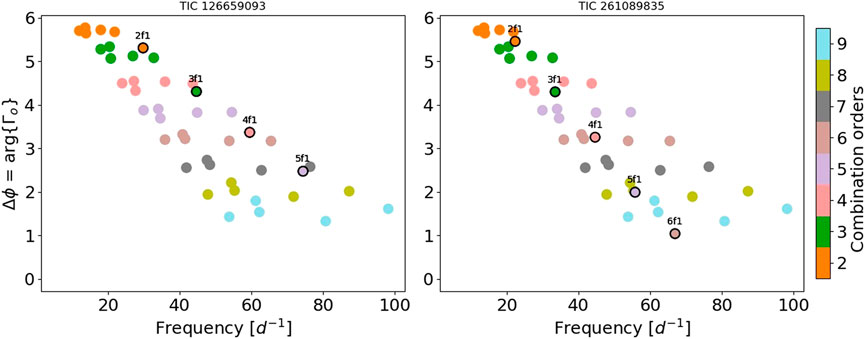
FIGURE 4. Two examples of a distorted relative phases pattern where combination frequency orders seem to overlap. TIC 126659093 has a known moderate rotational velocity (v sin i = 35 km s−1, Antoci et al., 2019). For TIC 261089835, no rotation velocity is available, but it is an example of inferred moderate or high rotational speed because of similar deviations in their relative phases. Symbols with black circles: relative phases of the HADS star identified in the title of each panel. Symbols without black circles: relative phases of the HADS stars of the Template. For clarity, in the Template of this figure only the mono-periodic HADS stars (without a distorted pattern) are represented.
The two double-mode HADS stars that are showing a distorted pattern (TIC 260654654 and KIC 9408694) have period ratios for their fundamental and first overtone, different from the aforementioned (see Section 2.1.1) period-relation typical for δ Sct stars. It is widely known that near-degeneracy of the frequencies becomes very important for rotational velocities larger than about 15–20 km s−1 (Suárez et al., 2007). Therefore, it is possible to infer rotational velocities in this range or above for these stars. In fact, KIC 9408694 is a well-known fast rotator (v sin i ≈ 100 km s−1 Balona et al., 2012). A sample of the 17 HADS stars is listed in Table 1. The HADS stars showing a distorted pattern are marked with a “d” in column 1.
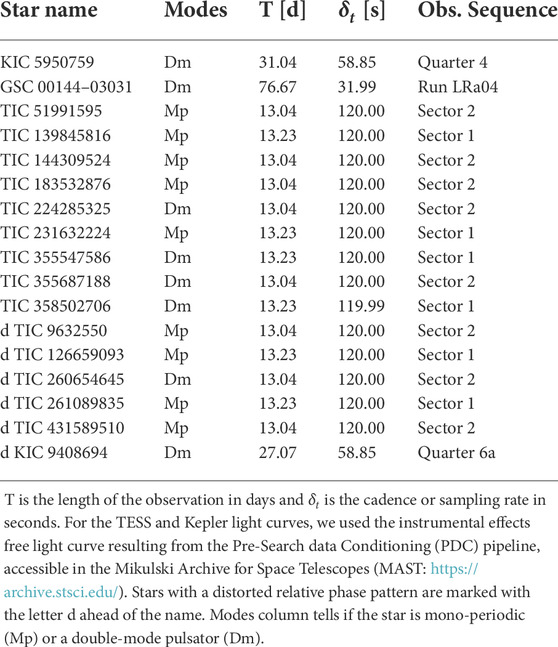
TABLE 1. Time series information of the HADS stars used in this work.
Being able to infer rotational velocities through the study of non-linearities happening in the stellar envelope is a promising conjecture that is worth exploring in future research. However, the case of TIC 9632550, which shows a slightly distorted pattern, is still open for discussion. In Antoci et al. (2019, Table A1), there is a reference to a projected rotational value of v sin i = 23 km s−1; however, it is also stated that it is a SB2 binary. Therefore, the distortion in the relative phases and amplitude ratio plots may also have an origin in binary interaction, which would be interesting to examine in future research.
Figure 5 shows the relative phases and amplitude ratios of all statistically significant harmonics and sum combination frequencies of the 11 HADS stars that do not show a distorted pattern. As noted in Section 2.1.2, the ΓO functions characterize and represent the non-linear physics that may be involved in the non-linear system, in our case, a pulsating star. Therefore, the akin representation of the ΓO functions for each HADS star indicates that they all share the same non-linear physical origin. As noted in 1, resonance might not be operating in HADS stars Bowman et al. (2016), so, under this reasonable assumptions, it is possible to associate the pattern shown in Figure 5 to non-linearities from the response of the stellar medium to pulsation, meaning that the common physical origin can be associated to non-linear processes happening in the stellar envelope. The form of the ΓO functions in a pure resonance situation is investigated to prove this. ΓO functions are expected to show different behavior for a different non-linear nature, such as resonance, which it does. This is shown in Section 3.1.2.
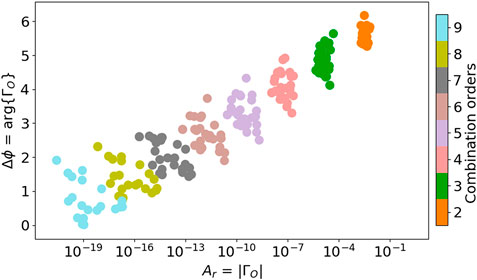
FIGURE 5. Non-linear response Template. Same as Figure 3, without the HADS stars showing a distorted pattern which are identified with a ‘d’ ahead of the identifier in column 1 of Table 1 (5 mono-periodic and 6 double-mode).
Additionally, as HADS stars tend to pulsate in radial modes, it is possible to empirically associate the general pattern with the non-linearities of radial pulsations. Indeed, the Volterra expansion does not add any restriction to the type of pulsation mode (in terms of radial or non-radial pulsations). Nonetheless, in this set of 11 HADS stars, the fundamental mode and first overtone period ratio correspond to the expected period ratio for δ Sct stars. Consequently, the affirmation that the regularities in the pattern allude to combination frequencies of radial modes is realistic. Note, however, that this does not mean it cannot indicate to combination frequencies of non-radial modes. In this way, the ΓO functions in Figure 5 might imply non-linearities of finite-amplitude radial pulsations. Hereafter, Figure 5 is referred to as the non-linear response template (the Template).
2.3 The diagnostic plots
The Template can be used to tackle the problem of identifying the physical origin of a combination frequency. As discussed in Section 1, in δ Sct stars, this identification is very complex and sometimes cannot be done at all. The possibility of diagnosing a combination frequency nature by plotting the argument and modulus of the ΓO function over the Template is explored in this study. Such plots are called Diagnostic plots, as they test that the argument and modulus of the ΓO function match the ones from a non-linear response. This empirical methodology was tested in a sample of 117 A-F stars observed by the TESS space satellite.
The BPM was computed for each star of the 117 A-F set using the first two highest amplitude frequencies or, when possible, a pair of frequencies that follow any of the period relations mentioned in Section 2.1.1. This ensures that the combination frequencies have independent eigenmodes as parents and not in combinations. In the set of 117 A-F stars, 74 were identified in Antoci et al. (2019) as δ Sct stars or hybrids. By only considering two frequencies as parents, the study will exclude combinations from other parents.
3 Results
3.1 Diagnostic plots for δ Sct stars
Supplementary Table S1 (located in the Supplementary Material section of this article) shows the results of computing the BPM for 74 δ Sct stars (or hybrids). The best possible parents, the combination frequencies detected, and the status of each combination regarding its match or lack of match with respect to the Template are also listed.
Before discussing the diagnostic plots, it is essential to note that combination frequencies can reach amplitudes higher than their parent modes Kurtz et al. (2015). When dealing with radial modes, as in HADS stars, the amplitude ratio pattern characterizes the amplitudes of combination frequencies from the non-linear response mechanism. However, when analyzing δ Sct stars of lower amplitudes, the highest-amplitude peaks (taken as parent frequencies) can be non-radial. Cancellation effects affecting non-radial modes could distort the observed amplitude ratios, causing incorrect discarding of combination frequencies that do not follow the amplitude ratio trend of the Template. For this reason, amplitude ratio patterns are useful to support identification but not to establish the nature of non-linearities.
3.1.1 Matching cases
At least 10 δ Sct stars from the sample of 74 δ Sct stars (or hybrids) matched the Template (Figure 6). From the arguments given in Section 2.2, we interpret those combination frequencies to be caused by the non-linear response of the stellar medium to pulsation Figure 7.
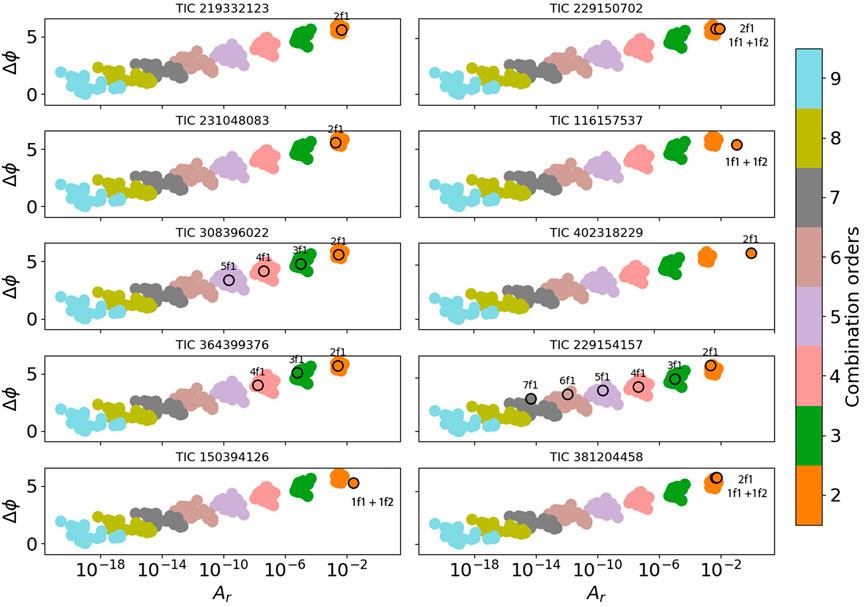
FIGURE 6. Diagnostic plots of combination frequencies matching the non-linear response Template. Matching criterion: the agreement should be in the relative phase (see Section 3.1). Symbols with black circles: relative phases and amplitude ratios of the HADS star identified in the title of each panel. Symbols without black circles: relative phases and amplitude ratios of the HADS stars of the Template.
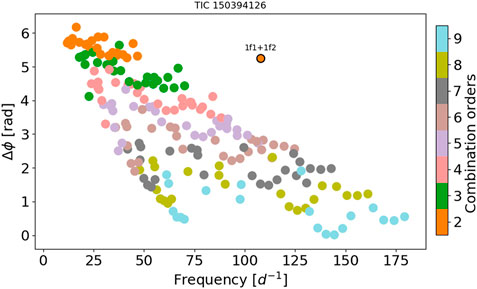
FIGURE 7. Relative phase diagnostic plot for the statistically significant combination frequency f1 + f2 found in TIC 150394126 (symbol with black circles). Symbols without black circles: relative phases and amplitude ratios of the HADS stars of the Template.
3.1.1.1 Application of the matching cases: Mode identification
Agreement with the Template allows us to identify a combination frequency from the non-linear response. Additionally, it is possible to argue that the parents of such combination frequencies are radial modes. This is supported by the fact that the Template represents the non-linear interaction of independent modes in HADS stars, mainly radial modes (Section 2.2). In this way, analyzing combination frequencies might give an extra hint for mode identification. An example of this is TIC 150394126. The identification of f1 + f2 as being due to the non-linear response nature (because it matches the relative phases for a second order combination frequency of the Template), (see Figure 7) could imply that f1 and f2 are radial modes. Taking into account the period relations of Suárez and Garrido (2006) and Stellingwerf (1979) and that for δ Sct stars, modes of consecutive radial order (at least for radial orders in the range of n = [2–8]) are equally separated by the large separation (Δν, similar to the solar-like stars large separation) (García Hernández et al., 2009; Suárez et al., 2014), is possible to estimate the radial orders of f1 and f2.
Assuming that f1 = νn = 49.08808 d−1 and f2 = νn+1 = 58.58333 d−1 and the combination frequency f1 + f2 = 107.67141 d−1, then
and from Suárez and Garrido (2006)and Stellingwerf (1979) period relations, it is possible to calculate
Although it is at the limit of the
Note that non-linearities are not exclusively linked to radial modes. Because the pattern is built from radial parent modes, it can be said that it works for radial parent modes. Now, does it have the same behavior for non-radial parents? Can partial cancellation mess up with the amplitude ratios? Is the flux retained and then released by the same amount in the surface convective layers of the star when this outer stellar medium interacts with non-radial modes? The answer is: possibly—a test to prove it is provided in Section 3.2. Here, we offer an example of obtaining an extra hint for mode identification through non-linearities studies if such a pattern is only related to non-linearities of radial parent modes.
3.1.2 No-matching cases
What about the combination frequencies that do not match the non-linear response Template? Such cases are shown in Figure 8. Sustained by the arguments given in Section 2.3, the interpretations of relative phases disagreeing with the Template could indicate one of these situations:
1. An effect of the non-linear response of the stellar medium to non-radial pulsations (the template for this is still unknown; while it might be the same as the Template, as HADS stars can also pulsate in non-radial modes. This is not proven.).
2. A resonantly excited or coupled mode.
3. An independent mode.

FIGURE 8. Diagnostic plots of combination frequencies not matching the non-linear response Template. Matching criterion: the agreement should be in the relative phase (see Section 3.1). Symbols with black circles: relative phases and amplitude ratios of the HADS star identified in the title of each panel. Symbols without black circles: relative phases and amplitude ratios of the HADS stars of the Template.
Therefore, not matching the Template would imply that those combination frequencies do not form part of a non-linear response of the stellar medium to radial pulsation modes. Random diagnostic plots refer to the 3rd point. The first and second points are the ones to be differentiated and tested here.
3.1.2.1 Application of the no-matching cases: mode coupling vs non-linear response
As noted in Section 1, differentiating whether a combination frequency is due to resonantly excited modes or to a non-linear response could shed some light on the mechanisms of mode selection operating in δ Sct stars. Several studies have discussed the nature of combination frequencies in δ Sct stars to support the mode-coupling theory (Handler et al., 2000; Nowakowski, 2005; Breger and Lenz, 2008; Balona et al., 2012; Breger et al., 2012; Bowman and Kurtz, 2014; Breger and Montgomery, 2014; Barceló Forteza et al., 2015; Bowman et al., 2016). In this section, we focus on the Breger and Montgomery (2014) method, which identifies which frequencies are parents and combinations in addition to discriminating whether a combination frequency is a resonantly excited mode or only an effect from the non-linear response. Their method is based on the assumption that amplitudes of the members of a resonantly coupled family are similar; therefore, larger values of what is called the coupling factor (
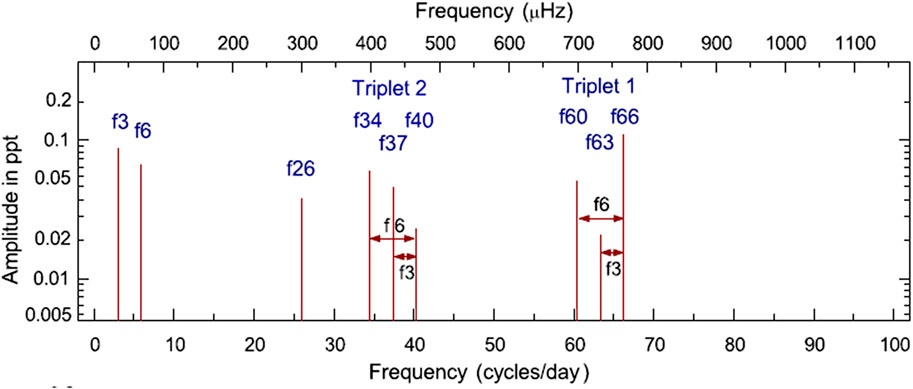
FIGURE 9. Nine most dominant frequencies of the T family. Figure taken from Breger and Montgomery (2014).
In Figure 10 we represent the diagnostic plot for the f40 frequency, the higher frequency component of Triplet 2. Its diagnostic plot was expected not to match the Template as Breger and Montgomery (2014) thorough study concludes (in Figure 10, the resonance at f40 = f66 − f26 is marked using the Breger and Montgomery (2014) nomenclature). The relative phase of f40 does not match the relative phase for combinations of order 2 when the non-linearity is due to the response nature, supporting Breger and Montgomery’s (2014) conclusion.
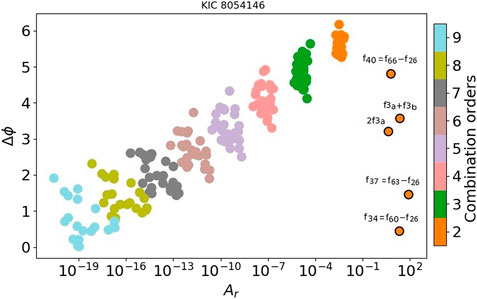
FIGURE 10. Diagnostic plot for combination frequencies in KIC 8054146 between Triplet two and f26 (in Breger and Montgomery, 2014, nomenclature) (see Section 3.1.2 and Figure 9). f40, f34 and f37 composing the Triplet one do not follow the Template, supporting Breger and Montgomery (2014)’s conclusion of them being resonantly excited. Same for f3a + f3b and 2f3a. Symbols with black circles: relative phases and amplitude ratios of KIC 8054146. Symbols without black circles: relative phases and amplitude ratios of the HADS stars of the Template.
In Figure 9, f3 represents in reality two very close frequencies (f3a = 2.9301 d−1 and f3b = 2.9340 d−1). Breger and Montgomery (2014) discussed the possibility of f6 component being a linear combination of the form 2f3a or f3a + f3b. In Figure 10, we diagnose these components. The relative phase for f6 is not agreeing with the combination order two zone of the Template, even if this frequency is considered to be 2f3a or f3a + f3b. In this way, f6 is not due to the non-linear nature. This is in line with Breger and Montgomery’s (2014) conclusion regarding how these low frequencies are resonantly excited.
Relative phases in Figure 10 are very similar to those in Figure 8 (e.g., TIC 381857833, TIC 38587180, TIC 32197339, and TIC 183595451, and TIC 350563225). Not matching the Template might be a signature of non-linearities resulting from resonant mode coupling. Nevertheless, a second possibility can cause a combination frequency not to match the Template. It is still possible that the relative phases and amplitude ratios found in Figure 8 do match a pattern of non-linear response nature but from non-radial parent modes. This is considered in the next section, where the ΓO functions of combination frequencies from non-radial parents are studied. The non-radial p-modes identification in δ Sct stars is not clear. To ensure or increase the chances of choosing non-radial modes as parent frequencies (or at least combination frequencies of non-radial parents), we study stars pulsating in the g-mode regime, such as γ Dor stars. As with δ Sct stars, many γ Dor stars show hybrid phenomena, but in the next section, we focus on the g-mode frequency regime to augment the possibilities of choosing non-radial parents.
3.2 The ΓO functions of γ Dor stars
This section presents the arguments and moduli of the ΓO functions for three previously studied γ Dor stars. The three γ Dor stars analyzed are KIC 8113425 (Kurtz et al., 2015), KIC 5608334 (Saio et al., 2018), and TIC 30531417 (Antoci et al., 2019). The first and the last ones are chosen since they have strong non-linear light curves; therefore, many non-linearities are expected to be detected. The second one is chosen because previous studies have argued that it meets resonance conditions, so it would be interesting to check their ΓO functions patterns. Combination frequencies have been detected in their power spectra through BPM analysis.
3.2.1 KIC 8113425
This γ Dor has a strong non-linear light curve whose power spectrum shows the typical frequency groups for these variables (Kurtz et al., 2015). The first four highest peaks of its power spectrum and the two-termed combination frequencies together account for 58.04% of all variability in light. Matching a structure of many combination frequencies by chance or resonant mode coupling is highly improbable. Therefore, this star is a promising target for analyzing the relative phases and amplitude ratios.
The relative phases of the statistically significant combination frequencies for KIC 8113425 are shown in the upper panel of Figure 11. Although they take very different values, the arguments of the ΓO functions follow an increasing trend with the order of the combinations and with the frequency. This is because relative phases increase with the frequency in g-mode pulsators, contrary to the p-mode case, which shows a decrease in frequency. Interestingly, this agrees with the asteroseismic fact that frequency increases with the radial order n in p-modes, whereas the frequency decreases in g-modes. The reader should recall that the y-axis is cyclic, the statistically significant frequencies of order five do not show a discontinuity.
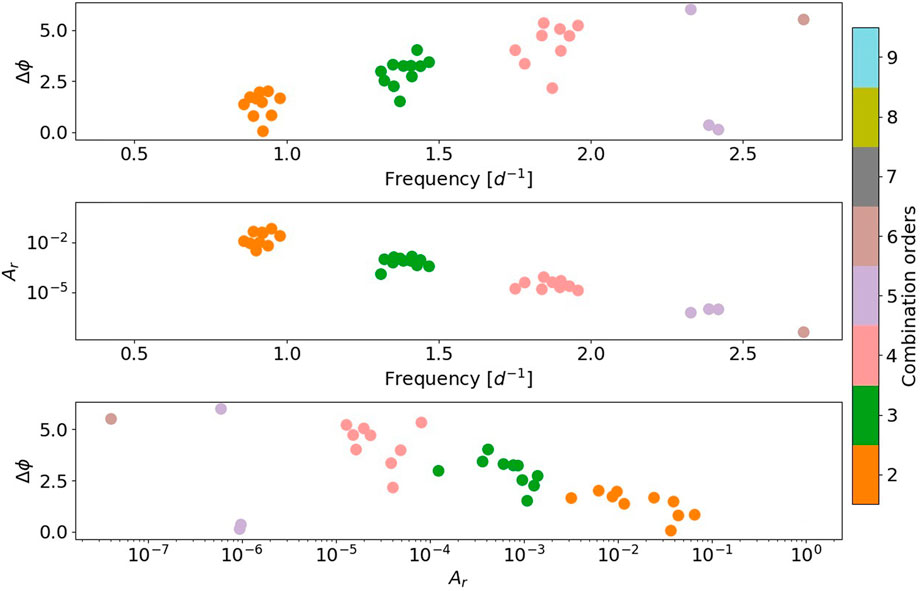
FIGURE 11. Relative phase (upper panel) and amplitude ratio (mid panel) of combination frequencies for KIC 8113425. Relative phase as a function of the amplitude ratio (bottom panel).
In γ Dor stars, the non-linearities may come from non-radial parent modes, so cancellation effects could affect the observed amplitudes, enabling the possibility of combination frequencies having higher amplitudes than their parents (Kurtz et al., 2015). However, this does not seem to be happening in this star, as seen in the amplitude ratios (mid panel of Figure 11). As in the p-mode case, one can plot relative phases as a function of amplitude ratios (Bottom panel of Figure 11). This γ Dor star, we might see proof that it does not matter whether the mode is radial or non-radial, as there is also clustering in terms of the order of the combination. However, the clustering occurs in the opposite direction (increasing order on the y-axis), possibly because the parent is a g-mode. Building these plots to develop a more significant sample would help discern whether the increasing or decreasing order on the y-axis is due to the radial or non-radial nature of the mode or the g-mode or p-mode nature.
3.2.2 KIC 5608334
The relative phases and amplitude ratios for the harmonics, sum and subtraction combination frequencies detected in KIC 5608334 are plotted in Figure 12. If the relative phase value does not match the Template, this might suggest that the modes are resonantly excited, as observed in δ Sct stars (see Section 3.1.2).
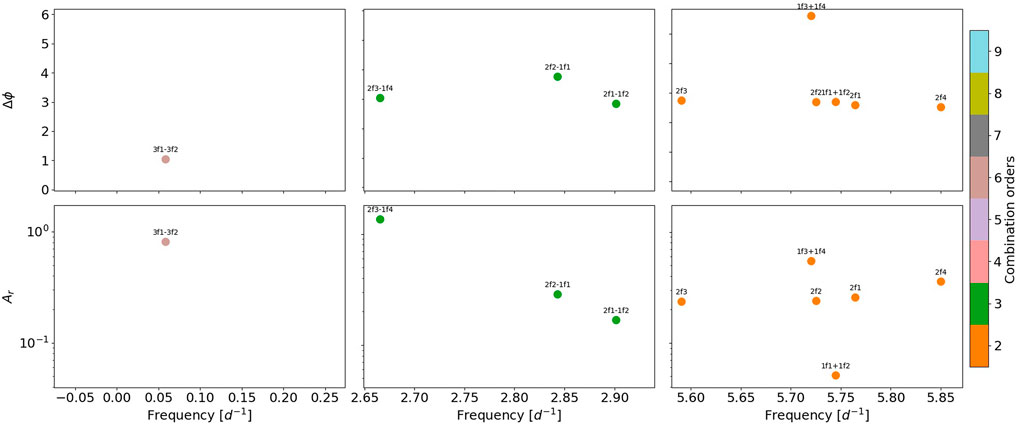
FIGURE 12. Relative phase (upper panels) and amplitude ratio (bottom panels) of harmonics, sums, and subtraction combination frequencies of KIC 5608334.
The resonance of non-radial modes is facilitated by a high rotational velocity (Baade, 1984). Saio et al. (2018) studied this star and showed how the detected combination frequencies in this star are the consequences of rotationally induced resonance due to its rapid rotation (v sin i ≈ 74–163 km s−1). Therefore, KIC 5608334 is another example of a reported case of pure resonance showing relative phases not matching the Template. This example strengthens the assumption of how relative phases and amplitude ratios behave when the combination frequencies are caused by the resonance mechanism.
3.2.3 TIC 30531417
TIC 30531417 shows a very regular light curve. The principal component of the power spectrum belongs to the g-mode frequency range (0.3 < ν < 3 d−1) but presents an unusually high amplitude for its pulsation variability (0.33 peak-to-peak mag) for a γ Dor star (typically of 0.1 mag Paunzen et al., 2020). For this reason, it was baptized by Antoci et al. (2019) as a high-amplitude γ Dor (HAGD) star. The BPM was computed first for the highest-amplitude peak, extracting almost all the harmonics. A second mode was detected at ν2 = 4.96067 d−1 after inspection of the residual light curve.
The relative phases were expected to follow an increasing pattern, similar to the first γ Dor analyzed in this section (KIC 8113425). Unfortunately, this hypothesis is not supported (see Figure 13). The relative phase of the principal component, whose frequency is in the g-mode regime, seems to be increasing with frequency and with the combination order. However, it does not grow at the same rate as KIC 8113425, and from 6f1, it starts to decrease. These different growing rates could indicate that it is not the same type of pulsator. Looking at the log(g) value (3.44423), it appeared to be a quite evolved star, and in the SIMBAD Astronomical Database, it is catalogued as an RR-Lyrae. Regarding ν2, the second-order harmonic seems to follow the non-linear response Template, so ν2 is possibly a radial p-mode.
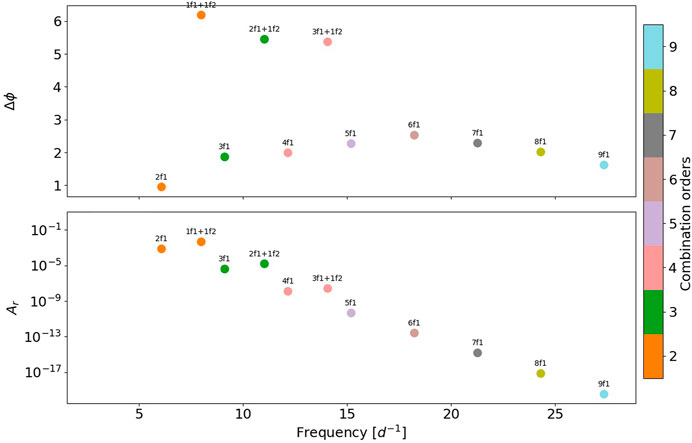
FIGURE 13. Relative phase (upper panel) and amplitude ratio (bottom panel) for sums and harmonics combination frequencies of TIC 30531417.
4 Discussion
Using the Volterra expansion as a general framework to model the non-linear behavior of pulsating stars has proven efficient. It has served to develop a self-consistent method that determines, with great precision, the combination frequencies composing a light curve (Lares-Martiz et al., 2020). Additionally, studying the Volterra-based phase differences and amplitude ratios allowed us to characterize the non-linear behavior of finite-amplitude pulsations in HADS stars for the first time. The ΓO functions represent the non-linear physical process involved in the non-linear behavior. They follow a similar pattern for all the HADS stars, implying that their non-linearities have the same physical origin. Furthermore, the patterns for reported resonance cases are very different from the behavior seen in HADS stars. All these findings support the statement of Bowman et al. (2016), that resonances are not present in HADS stars. Therefore, non-linearities in HADS stars can be associated with the non-linear response of the stellar envelope to pulsation.
Under the reasonable assumption that non-linearities in HADS stars are due to the non-linear response processes, in this article, I present a method that diagnoses the nature of a combination frequency in lower-amplitude δ Sct stars. Whether they match or do not match the heuristic Template for non-linearities in HADS stars, we can distinguish combination frequencies from the non-linear response from other non-linear processes (such as resonance) or independent modes of pulsation. Results of the application of this innovative method hold promising implications for non-linear asteroseismology. For example, there are more combination frequencies in the small sample of 17 HADS stars than in the 74 δ Sct stars sample. This fact supports the generally accepted explanation for the high amplitudes observed in HADS stars, which is the lack of an amplitude-limiting mechanism (Breger and Montgomery, 2000). Also, it supports the Dziembowski and Krolikowska (1985) claim of parametric resonance as the most likely amplitude-limiting mechanism operating in δ Sct stars of lower amplitudes.
Diagnostic charts provide intriguing conjectures, suggesting that the non-linearities are more useful for asteroseismic inferences than previously thought. However, we acknowledge that many questions arise as to the interpretations of the diagnostic plots. For example, is the Template for combination frequencies of radial parent modes only? Indeed, the Template was found in HADS stars, mainly radial pulsators. Because of this argument, it is possible to conjecture that combination frequency matching the Template gives an extra hint for mode identification, supposing that its parents are radial. Nonetheless, HADS stars also pulsate in non-radial modes, and the Volterra expansion does not limit the possibility of the Template showing the same regularities in the case of combination frequencies with non-radial parents. Despite previous efforts (see Section 3.2), whether the pattern remains the same for non-radial modes remains an open question.
The non-matching cases also raised interpretations that could be convenient when making asteroseismic inferences. An example of not-matching the general Template occurs when the pattern is distorted, meaning that the combination overlaps across different orders of the Template. It is possible to associate this signature with moderate to high rotational velocities (see Section 2.2 and Figure 4). Still, this needs to be proven to a larger sample to remove the label of speculation. Suppose the pattern does not match the Template at all. In that case, this indicates other possibilities of reproducing non-linear signatures: resonantly excited modes, independent modes whose frequency lies close to a combination value by chance, or the possibility of non-linearities of non-radial parents. Comparing the results of the disagreeing diagnostic plots for the sample of 74 δ Sct stars with reported cases of resonant mode coupling, it was found that the patterns are broadly comparable. The Breger and Montgomery (2014) method to distinguish the nature of a combination frequency requires significant amplitude modulation in three modes with similar amplitudes. Finding such cases is not easy because the time variability of each combination member and the variations between all the signal components must be tracked. In this sense, the diagnostic plots provide a way to establish the non-linear response nature of the combination frequency, and if it does not match the Template, then recur to a more in-depth study such as Breger and Montgomery’s.
More questions arise regarding the subtraction combinations and the Fourier parameters time modulation. Therefore, the following subsections will discuss apparent limitations or open issues for establishing diagnostic plots as a completely reliable method.
4.1 Open issues and future work
4.1.1 Open issues
4.1.1.1 Amplitude and phase time modulation
So far, the amplitude and phases of each combination frequency are calculated for the entire light curve as if they were constant. The time variability of the Fourier parameters could affect the relevance of the diagnostic method. Mainly, we discuss the possibility of the relative phases being jeopardized by the time variability of any of the parameters. We leave out the amplitude ratios from the discussion as we already acknowledge that this plot may be compromised by other mechanisms (e.g., partial cancellation of the parent modes).
A phase variation as a function of time is introduced in a one-component signal Y(t) in the following way:
and the phase function of time can be represented by a Taylor series
where
If the phase variation is small, it translates into a slight frequency shift. Moreover, the observed phase (ϕ0) is the same as if there were no phase variation. Consequently, the patterns of the relative phase plots are not compromised by the phase modulation.
4.1.1.2 Non-radial modes
The Template is true for radial parent modes, and because of this was possible to conjecture that it might give an extra hint for mode identification. Nonetheless, the Volterra expansion does not limit the possibility of the Template showing the same regularities in the case of combination frequencies with non-radial parents. Therefore, we attempted to show how the relative phases and amplitude ratios plot looks for combination frequencies of non-radial parents in γ Dor stars, where the chance of choosing non-radial parent modes is higher (or at least combinations of non-radial parents).
The characterization of non-linearities observed in g-mode pulsators, particularly for γ Dor stars, is far from complete. Under the theoretical formulations presented in this work and the three stars analyzed, finding a pattern that would unite them all was impossible. However, examination of it yielded relevant results. In KIC 5608334, a γ Dor star previously known to show a rotationally induced resonant mode coupling (see Section 3.2.2), the relative phases have values around 0, π, and 2π. The patterns differed from the resonant mode coupling case in the other two γ Dor stars. The pattern seemed clustered and clear, increasing in relative phases with the order of combination (although at different rates depending on the star). G-modes interacting with the stellar envelope might show different non-linear responses. This might be possible due to an unknown dependence on the frequency of the ΓO functions. If this is true, one can distinguish g-modes from p-modes. An example can be seen in Figure 13, where f1 is probably a g-mode, where its relative phases increase with the frequency up to a point where the response change and start to decrease. Moreover, it is possible to argue that f2 is a radial p-mode because the combinations involving f2 show a similar response as for HADS stars radial p-modes, but not the same because the g-mode f1 is also involved.
The generalized transfer functions of A/F-type hybrid pulsators are not yet well-characterized. Carrying out the relative phases and amplitude ratios study to a larger sample of γ Dor stars and δ Sct stars with non-radial modes will investigate to what extent the generalized ΓO functions can be helpful to characterize the non-linear behavior in these stars.
4.1.1.3 Subtraction combinations
Difference combinations in HADS stars showed scattered relative phases and amplitudes ratio plots (see symbols with red circles in Figure 2). When fitting the Fourier parameters, errors of the parameters corresponding to subtraction combinations were higher. The low-amplitude δ Sct stars showed very scattered values of relative phases and amplitude ratios for the subtractions, even for the stars showing agreement with the Template. This might have an explanation in the fact that their amplitudes may be smaller than the detection threshold, so the fitted frequencies are other independent modes in the low-frequency regime (e.g., rotation signatures or g-modes in the case of a hybrid star). It could also be due to an unknown dependence of the ΓO functions on the frequency. Another possible explanation is that subtraction does not hold the commutative property (see Eq. 6). As a result, the phase would be different regarding the order of the factors in the subtraction, implying that somehow the ΓO functions may not be symmetric, meaning that
is different from
4.1.2 Future work
Ultimately, the broad implication of the present research is that to confirm the conclusions obtained in this work, it would be necessary to carry out a systematic and as complete as possible comparative study of the phenomenon of non-linearities in a sample of different pulsating stars. The sample should cover various masses, evolutionary stages, metallicities, and rotational velocities. It is worthwhile to continue the work of Garrido and Rodriguez (1996) and Lares-Martiz et al. (2020), who provided a promising method to model non-linear behavior in δ Sct stars. Studying the ΓO functions is a convenient and feasible way to build data-driven non-linear asteroseismic models. Thanks to the legacy data from CoRoT, Kepler, and TESS, we have hundreds to thousands of high-accuracy light curves of pulsating stars at our disposal to perform a complete statistical study. Such a study will significantly impact the understanding of the phenomenon of non-linearities and how pulsation spectra of any star are determined. This might mean a complete revision of the asteroseismological results carried out to date and thus of the data analysis pipelines of current and future missions such as PLATO.
Data availability statement
Publicly available datasets were analyzed in this study. These data can be found at: https://tasoc.dk/search_data/, https://archive.stsci.edu/.
Author contributions
The author MM contributed to the conception and design of the study, organized the data, performed the analysis, and wrote the sections of the manuscript.
Funding
The author MM acknowledges funding support from Spanish public funds for research under project ESP 2017-87676-C5-5-R. Author acknowledge financial support from the State Agency for Research of the Spanish MCIU through the “Center of Excellence Severo Ochoa” award to the Instituto de Astrof\'isica de Andaluc\'ia (SEV-2017-0709).
Acknowledgments
MM acknowledges financial support from the State Agency for Research of the Spanish MCIU through the “Center of Excellence Severo Ochoa” award to the Instituto de Astrofísica de Andalucía (SEV-2017-0709). The author wants to thank the IP and colleagues of the GVE team in IAA for all the comments and feedback while conducting this research. The author also wants to thank GM Mirouh, for his tips and comments during the writing of this article.
Conflict of interest
The author declares that the research was conducted in the absence of any commercial or financial relationships that could be construed as a potential conflict of interest.
Publisher’s note
All claims expressed in this article are solely those of the authors and do not necessarily represent those of their affiliated organizations, or those of the publisher, the editors, and the reviewers. Any product that may be evaluated in this article, or claim that may be made by its manufacturer, is not guaranteed or endorsed by the publisher.
Supplementary material
The Supplementary Material for this article can be found online at: https://www.frontiersin.org/articles/10.3389/fspas.2022.932499/full#supplementary-material
References
Aerts, C., Christensen-Dalsgaard, J., and Kurtz, D. W. (2010). Asteroseismology. Dordrecht: Springer.
Antoci, V., Cunha, M. S., Bowman, D. M., Murphy, S. J., Kurtz, D. W., Bedding, T. R., et al. (2019). The first view of δ Scuti and γ Doradus stars with the TESS mission. Mon. Not. R. Astron. Soc. 490, 4040–4059. doi:10.1093/mnras/stz2787
Baade, D. (1984). Discovery and preliminary identification of two retrograde nonradial pulsation modes in the Be star MU Centauri. Astronomy Astrophysics 135, 101
Balona, L. A. (2016). Combination frequencies in high-amplitude δ Scuti stars. Mon. Not. R. Astron. Soc. 459, 1097–1103. doi:10.1093/mnras/stw671
Balona, L. A. (2012). Combination frequencies in δ Scuti stars. Mon. Not. R. Astron. Soc. 422, 1092–1097. doi:10.1111/j.1365-2966.2012.20682.x
Balona, L. A., Daszyńska-Daszkiewicz, J., and Pamyatnykh, A. A. (2015). Pulsation frequency distribution in δ Scuti stars. Mon. Not. R. Astron. Soc. 452, 3073–3084. doi:10.1093/mnras/stv1513
Balona, L. A., and Dziembowski, W. A. (2011). Kepler observations of δ Scuti stars. Mon. Not. R. Astron. Soc. 417, 591–601. doi:10.1111/j.1365-2966.2011.19301.x
Balona, L. A. (2018). Gaia luminosities of pulsating A-F stars in the Kepler field. Mon. Not. R. Astron. Soc. 479, 183–191. doi:10.1093/mnras/sty1511
Balona, L. A., Lenz, P., Antoci, V., Bernabei, S., Catanzaro, G., Daszyńska-Daszkiewicz, J., et al. (2012). Kepler observations of the high-amplitude δ Scuti star V2367 Cyg. Mon. Not. R. Astron. Soc. 419, 3028–3038. doi:10.1111/j.1365-2966.2011.19939.x
Barceló Forteza, S., Michel, E., Roca Cortés, T., and García, R. A. (2015). Evidence of amplitude modulation due to resonant mode coupling in the δ Scuti star KIC 5892969. A particular or a general case? Astron. Astrophys. 579, A133. doi:10.1051/0004-6361/201425507
Bowman, D. M. (2017). Amplitude modulation of pulsation modes in delta Scuti stars. Leuven: Springer Cham. doi:10.1007/978-3-319-66649-5
Bowman, D. M., Kurtz, D. W., Breger, M., Murphy, S. J., and Holdsworth, D. L. (2016). Amplitude modulation in δ Sct stars: Statistics from an ensemble study of Kepler targets. Mon. Not. R. Astron. Soc. 460, 1970–1989. doi:10.1093/mnras/stw1153
Bowman, D. M., and Kurtz, D. W. (2014). Pulsational frequency and amplitude modulation in the δ Sct star KIC 7106205. Mon. Not. R. Astron. Soc. 444, 1909–1918. doi:10.1093/mnras/stu1583
Brassard, P., Fontaine, G., and Wesemael, F. (1995). The modeling of energy distributions and light curves of ZZ Ceti stars. 1: Basic theory and semianalytic expressions for the emergent flux. Astrophys. J. Suppl. Ser. 96, 545–580. doi:10.1086/192128
Breger, M., Fossati, L., Balona, L., Kurtz, D. W., Robertson, P., Bohlender, D., et al. (2012). Relationship between low and high frequencies in δ Scuti stars: Photometric kepler and spectroscopic analyses of the rapid rotator KIC 8054146. Astrophys. J. 759, 62. doi:10.1088/0004-637X/759/1/62
Breger, M., and Kolenberg, K. (2006). Equidistant frequency triplets in pulsating stars: The combination mode hypothesis. Astron. Astrophys. 460, 167–172. doi:10.1051/0004-6361:20065808
Breger, M., and Lenz, P. (2008). Amplitude variability and multiple frequencies in 44 tauri: 2000-2006. Astron. Astrophys. 488, 643–651. doi:10.1051/0004-6361:200810187
Breger, M., and Montgomery, M. (2000). Delta Scuti and related stars.” in Astronomical Society of the Pacific Conference Series. 210
Breger, M., and Montgomery, M. H. (2014). Evidence of resonant mode coupling and the relationship between low and high frequencies in a rapidly rotating a star. Astrophys. J. 783, 89. doi:10.1088/0004-637X/783/2/89
Brickhill, A. J. (1992). The pulsations of ZZ Ceti stars - V. The light curves. Mon. Notices R. Astronomical Soc. 259, 519–528. doi:10.1093/mnras/259.3.519
Buchler, J. R., Goupil, M. J., and Hansen, C. J. (1997). On the role of resonances in nonradial pulsators. Astronomy Astrophysics 321, 159
Christy, R. F. (1966). A study of pulsation in RR Lyrae models. Astrophys. J. 144, 108. doi:10.1086/148593
Christy, R. F. (1964). The calculation of stellar pulsation. Rev. Mod. Phys. 36, 555–571. doi:10.1103/RevModPhys.36.555
Degroote, P., Aerts, C., Ollivier, M., Miglio, A., Debosscher, J., Cuypers, J., et al. (2009). CoRoT’s view of newly discovered B-star pulsators: Results for 358 candidate B pulsators from the initial run’s exoplanet field data. Astron. Astrophys. 506, 471–489. doi:10.1051/0004-6361/200911884
Dziembowski, W., and Krolikowska, M. (1985). Nonlinear mode coupling in oscillating stars. II - limiting amplitude effect of the parametric resonance in main sequence stars. Acta Astron. 35, 5
García Hernández, A., Moya, A., Michel, E., Garrido, R., Suárez, J. C., Rodríguez, E., et al. (2009). Asteroseismic analysis of the CoRoT δ Scuti star HD 174936. Astron. Astrophys. 506, 79–83. doi:10.1051/0004-6361/200911932
Garrido, R., and Rodriguez, E. (1996). Microvariability in high-amplitude delta Scuti radially pulsating stars. Mon. Notices R. Astronomical Soc. 281, 696–702. doi:10.1093/mnras/281.2.696
Gillet, D., and Fokin, A. B. (2014). Emission lines and shock waves in RR Lyrae stars. Astron. Astrophys. 565, A73. doi:10.1051/0004-6361/201322938
Goupil, M. J., Dziembowski, W. A., and Fontaine, G. (1998). On some observational consequences of nonlinearities in stellar pulsations. Balt. Astron. 7, 21–41. doi:10.1515/astro-1998-0108
Handler, G., Arentoft, T., Shobbrook, R. R., Wood, M. A., Crause, L. A., Crake, P., et al. (2000). Delta Scuti network observations of XX pyx: Detection of 22 pulsation modes and of short-term amplitude and frequency variations. Mon. Notices R. Astronomical Soc. 318, 511–525. doi:10.1046/j.1365-8711.2000.03817.x
Kurtz, D. W., Shibahashi, H., Murphy, S. J., Bedding, T. R., and Bowman, D. M. (2015). A unifying explanation of complex frequency spectra of γ dor, SPB and Be stars: Combination frequencies and highly non-sinusoidal light curves. Mon. Not. R. Astron. Soc. 450, 3015–3029. doi:10.1093/mnras/stv868
Lares-Martiz, M., Garrido, R., and Pascual-Granado, J. (2020). Self-consistent method to extract non-linearities from pulsating star light curves - I. Combination frequencies. Mon. Not. R. Astron. Soc. 498, 1194–1204. doi:10.1093/mnras/staa2256
Lares-Martiz, M. (2021). Non-linear terms in Delta Scuti stars power spectra (PhD thesis. Granada: Universidad de Granada.
McNamara, D. H. (2000). The identification of pulsation modes of high-amplitude δ Scuti stars in ω centauri and the carina galaxy. Publ. Astronomical Soc. Pac. 112, 1096–1102. doi:10.1086/316605
Montgomery, M. H. (2005). A new technique for probing convection in pulsating white dwarf stars. Astrophys. J. 633, 1142–1149. doi:10.1086/466511
Nowakowski, R. M. (2005). Multimode resonant coupling in pulsating stars. Acta Astron. 55, 1. doi:10.48550/arXiv.astro-ph/0501510
Paunzen, E., Bernhard, K., Hümmerich, S., Hambsch, F.-J., Lloyd, C., and Otero, S. (2020). High-amplitude γ Doradus variables. Mon. Not. R. Astron. Soc. 499, 3976–3991. doi:10.1093/mnras/staa2905
Pigulski, A., Kołaczkowski, Z., Ramza, T., and Narwid, A. (2006). High-amplitude delta Scuti stars in the galactic bulge from the OGLE-II and MACHO data. Mem. Soc. Astron. Ital. 77, 223. doi:10.48550/arXiv.astro-ph/0509523
Rodríguez, E., López-González, M. J., and López de Coca, P. (2000). A revised catalogue of delta Sct stars. Astron. Astrophys. Suppl. Ser. 144, 469–474. doi:10.1051/aas:2000221
Saio, H., Bedding, T. R., Kurtz, D. W., Murphy, S. J., Antoci, V., Shibahashi, H., et al. (2018). An astrophysical interpretation of the remarkable g-mode frequency groups of the rapidly rotating γ Dor star, KIC 5608334. Mon. Not. R. Astron. Soc. 477, 2183–2195. doi:10.1093/mnras/sty784
Simon, N. R., and Lee, A. S. (1981). The structural properties of Cepheid light curves. Astrophys. J. 248, 291–297. doi:10.1086/159153
Stellingwerf, R. F. (1980). Nonlinear delta Scuti models - the main sequence catastrophe. New Brunswick: Springer Berlin Heidelberg, 125, 50. doi:10.1007/3-540-09994-8_5
Stellingwerf, R. F. (1979). Pulsation in the lower Cepheid strip. I. Linear survey. Astrophys. J. 227, 935–942. doi:10.1086/156802
Suárez, J. C., Garrido, R., and Moya, A. (2007). The role of rotation on Petersen diagrams. II. The influence of near-degeneracy. Astron. Astrophys. 474, 961–967. doi:10.1051/0004-6361:20077647
Suárez, J. C., and Garrido, R. (2006). The effect of rotation on Petersen Diagrams. Mem. Soc. Astron. Ital. 77, 502.
Suárez, J. C., Hernández, A. G., Moya, A., Rodrigo, C., Solano, E., Garrido, R., et al. (2014). “Theoretical properties of regularities in the oscillation spectra of A-F main-sequence stars,” in Precision asteroseismology. Editors J. A. Guzik, W. J. Chaplin, and G. Handler, 301, 89–92. doi:10.1017/S1743921313014142
Van Beeck, J., Bowman, D. M., Pedersen, M. G., Van Reeth, T., Van Hoolst, T., and Aerts, C. (2021). Detection of non-linear resonances among gravity modes of slowly pulsating B stars: Results from five iterative pre-whitening strategies. Astron. Astrophys. 655, A59. doi:10.1051/0004-6361/202141572
Wu, Y. (2001). Combination frequencies in the Fourier spectra of white dwarfs. Mon. Notices R. Astronomical Soc. 323, 248–256. doi:10.1046/j.1365-8711.2001.04224.x
Zong, W., Charpinet, S., Fu, J.-N., Vauclair, G., Niu, J.-S., and Su, J. (2018). Oscillation mode variability in evolved compact pulsators from kepler photometry. I. The hot B subdwarf star KIC 3527751. Astrophys. J. 853, 98. doi:10.3847/1538-4357/aaa548
Keywords: variable stars, asteroseismology, non-linear pulsations, non-linearities, combination frequencies, HADS stars, Delta Scuti stars, Gamma Doradus stars
Citation: Lares-Martiz M (2022) Asteroseismic inferences from the study of non-linearities in δ Sct stars. Front. Astron. Space Sci. 9:932499. doi: 10.3389/fspas.2022.932499
Received: 29 April 2022; Accepted: 27 September 2022;
Published: 07 November 2022.
Edited by:
Antonio García Hernández, University of Granada, SpainReviewed by:
Ernst Paunzen, Masaryk University, CzechiaPatricia Jeanne Lampens, Royal Observatory of Belgium, Belgium
Copyright © 2022 Lares-Martiz. This is an open-access article distributed under the terms of the Creative Commons Attribution License (CC BY). The use, distribution or reproduction in other forums is permitted, provided the original author(s) and the copyright owner(s) are credited and that the original publication in this journal is cited, in accordance with accepted academic practice. No use, distribution or reproduction is permitted which does not comply with these terms.
*Correspondence: Mariel Lares-Martiz, bWFydGl6X21hcmllbEBob3RtYWlsLmNvbQ==