
94% of researchers rate our articles as excellent or good
Learn more about the work of our research integrity team to safeguard the quality of each article we publish.
Find out more
ORIGINAL RESEARCH article
Front. Astron. Space Sci., 27 May 2022
Sec. Astrobiology
Volume 9 - 2022 | https://doi.org/10.3389/fspas.2022.909193
 Loraine Schwander1*†
 Niels F.W. Ligterink1
 Kristina A. Kipfer1
 Rustam A. Lukmanov1Valentine Grimaudo1
 Marek Tulej1Coenraad P. de Koning1
 Peter Keresztes Schmidt1
 Salome Gruchola1Nikita J. Boeren1,2Pascale Ehrenfreund3,4
 Peter Wurz1,2
 Andreas Riedo1,2*
The detection of biomolecules on Solar System bodies can help us to understand how life emerged on Earth and how life may be distributed in our Solar System. However, the detection of chemical signatures of life on planets or their moons is challenging. A variety of parameters must be considered, such as a suited landing site location, geological and environmental processes favourable to life, life detection strategies, and the application of appropriate and sensitive instrumentation. In this contribution, recent results obtained using our novel laser desorption mass spectrometer ORganics INformation Gathering Instrument (ORIGIN), an instrument designed for in situ space exploration, are presented. We focus in this paper on the detection and identification of amino acid extracts from a natural permafrost sample, as well as in an analogue mixture of soils and amino acids. The resulting dataset was analysed using a correlation network analysis method. Based on mass spectrometric correlation, amino acid signatures were separated from soil signatures, identifying chemically different molecular components in complex samples. The presented analysis method represents an alternative to the typically applied spectra-by-spectra analysis for the evaluation of mass spectrometric data and, therefore, is of high interest for future application in space exploration missions.
The detection of life in places other than Earth would have many philosophical and scientific implications (Sagan, 1980; Lingam and Loeb, 2021). The search for and detection of extraterrestrial life is therefore likely one of the most exciting challenges humanity has ever faced. One of the most important parameters involved in finding extinct or extant life is the identification of locations that are currently habitable or have been habitable at any time in the past. Such locations have been identified on different Solar System bodies, including Mars, Jupiter’s moon Europa, and Saturn’s moon Enceladus (Cavalazzi and Westall, 2019). These locations can be investigated for the presence of biosignatures, a collective term for chemical and morphological indicators of life with appropriate instruments (Hand et al., 2017; Hays and Beaty, 2017) (Hendrix et al., 2019). Since space exploration is an expensive, time-consuming, and risky undertaking, extensive testing of any instrument potentially used in space is essential to its success. One way to achieve the capability for such investigations is by using analogue material, i.e., material that is thought to be similar to that found or expected on the targeted Solar System body. Analogues are a key part of the process to select what types of biosignatures one should look for and which space instruments are well suited to detect them (Cavalazzi and Westall, 2019), (Foucher et al., 2021). Among biosignatures, biomolecules—a loose term for any molecule produced by an organism—are especially interesting to answer the question whether life currently exists someplace other than Earth. Molecules like amino acids, nucleobases, and lipids, when found in concentrations that cannot be explained by abiotic processes, are strong indicators for the presence of life. Amino acids are one of the primary biosignatures targeted in the search for extraterrestrial life by past missions (Pietrogrande, 2013) like Viking (Pietrogrande, 2012), Cassini-Huygens (Raulin et al., 1998) and Rosetta (Goesmann et al., 2007; Altwegg et al., 2016) and upcoming missions such as the Rosalind Franklin ExoMars rover (Goesmann et al., 2017), and potentially the Europa Lander (Hand et al., 2017).
To search for amino acids, dedicated and sensitive instruments are needed. Laser Ablation Ionization Mass Spectrometric (LIMS) systems, either operated in desorption or ablation mode, are a relatively new and promising addition to the suite of available space instruments (Ligterink et al., 2020b). LIMS instruments have high analytical performance with high spatial resolution (spot sizes down to the µm level, about the size of a microbe) and sensitivity (sub-fmol mm−2 or sub-ppm limit of detection). Chemical processing of molecules during the laser desorption processes is minimal. Various LIMS instruments are being developed for space exploration missions (Getty et al., 2012; Riedo et al., 2012; Riedo et al., 2013a; Briois et al., 2016; Riedo et al., 2017; Arevalo et al., 2018). They have been included in the payloads of the Phobos Grunt (LAZMA, Roscosmos) (Managadze et al., 2010), (Zelenyi and Zakharov, 2012), the Luna-Glob LASMA (Chumikov et al., 2021) and the upcoming ExoMars Rosalind Franklin rover (MOMA, ESA/Roscosmos) (Goesmann et al., 2017) and the Dragonfly rotorcraft (DraMS, NASA) (Lorenz et al., 2018; Grubisic et al., 2021).
At the University of Bern, Switzerland, the ORganics Information Gathering INstrument (ORIGIN), a LIMS instrument operated in desorption mode, is currently validated in full detail for biomolecule detection (Ligterink et al., 2020a). It is intended to analyze non-volatile surface material by gentle desorption and soft ionization of molecules. ORIGIN is a particularly compact and sensitive instrument with proven capabilities to detect amino acids (Ligterink et al., 2020a), polycyclic aromatic hydrocarbons (PAHs) (Kipfer et al., 2022) and lipids (Boeren et al. (in prep)). However, the majority of studies conducted with ORIGIN so far focused on fundamental studies conducted on reference samples, i.e., measurements of analytical grade preparations of single biomolecules or simple known mixtures thereof. While these are good initial indicators of analytical performance, they do not represent a realistic in situ use-case, since sample material obtained in situ will be a complex mixture of many different materials and compounds, and extensive wet chemistry sample preparation is highly challenging on a rover or lander module. As samples become more complex, their analysis also becomes more difficult. Advanced analysis techniques are required to analyze data recorded with ORIGIN. In this study, a novel analysis routine is employed on ORIGIN data generated from amino acids and soil mixtures and amino acids extracts from a permafrost sample, in the form of correlation network analysis. Network analysis is a useful method to visualize relationships in large datasets and has been used in many different fields, such as geology (Lukmanov et al., 2021a; Lukmanov et al., 2021b), biology (Koutrouli et al., 2020) and social sciences (Marin and Wellman, 2009). Here, it is used to visualize correlations between mass spectrometric signatures that result from the same source (e.g., an amino acid) and to distinguish them from other sources, such as the host material.
This work focuses on a soil-amino acid mixture and on amino acids that were extracted from a natural permafrost sample as analogues for space exploration to show that ORIGIN is capable of measuring complex samples that could also be found in situ. Correlation network analysis was employed to derive correlations between detected masses in a mass spectrum, which in turn is used to visualize different chemical components in complex samples and to separate biological components from soil components.
For this study an amino acid extract from a natural permafrost sample containing residues of the host material, a tyrosine amino acid standard solution, a soil-tyrosine mixture, and a soil sample were measured. The permafrost sample (ID: P6H (Habimana, 2016)) was collected from Yedoma permafrost in North-East Siberia, Russia, in the framework for the EU FP7 project for the Mars Analogues for Space Exploration project (MASE) (Cockell et al., 2018). The sample specifically serves as an analogue for the Martian polar caps, although it could potentially also serve as an analogue for other Solar System bodies that have frozen soils (Margesin, 2009). The amino acid extract from the permafrost sample was prepared for LC-MS analysis using the procedure described in (Aerts et al., 2020). The 100 µM tyrosine amino acid standard was made by dissolving the pure amino acid (99% purity, Sigma-Aldrich) in MilliQ grade water (> 18 MΩ*cm). Tyrosine was selected for this study because it was known to have a limited fragmentation pattern with mass features of roughly equal intensity. This was beneficial for finding correlations between the fragments of this molecule and between other molecules that were added to a mixture. Many other amino acids studied with ORIGIN showed fragmentation patterns consisting of one or two peaks, for which it was more challenging to find correlations in their fragmentation patterns (Ligterink et al., 2020a). The soil selected for the analogue amino acid-soil solution was a reference soil material from NIST (Cody Shale, SCo-1), also considered a Mars analogue. Approximately 600 µg of soil was weighted and mixed in 100 µL pure MilliQ grade water and in 100 µL tyrosine solution, resulting in soil saturated solutions.
A stainless-steel sample holder with five equally spaced cavities (0.2 × Ø 3 mm), into which sample material was deposited, was used for sample introduction into the ORIGIN setup. Before use, the sample holder was sonicated for 15 min in isopropanol (70%). Afterwards it was thoroughly rinsed with MilliQ water and then dried on a hot plate at 100°C for at least 30 min. Finally, the sample holder was flame sterilized to remove any trace molecules. All sample material was pipetted into cavities on the steel sample holder. For each measurement campaign, 1 μL of solution was drop cast into four of the cavities and the fifth was left empty as a negative control. After drop casting of the sample, they were left to dry inside a laminar flow bench (ISO 5), to remove the water and to form a layer of organic and/or soil material.
The instrument used to study the material for this study is a LIMS system operated in desorption mode, named ORIGIN and described in detail in a recent publication (Ligterink et al., 2020a). ORIGIN uses a nanosecond Q-switched Nd:YAG laser, which produces laser pulses at a pulse width τ ∼ 3 ns, wavelength of λ = 266 nm, and a laser pulse repetition rate of 20 Hz. The pulse energy can be adjusted in a wide range, and for this study 3 µJ measured at the sample surface was used for the measurements. The laser pulse is guided through an optics system and a lens focuses the pulse through a miniature reflectron-type time-of-flight mass spectrometer (RToF-MS, 160 mm × Ø 60 mm, m/Δm ≥ 1,000) to a ∼30 µm diameter spot on the sample holder (Rohner, et al., 2003; Riedo et al., 2013b). The RToF-MS entrance is located approximately 1 mm above the sample holder surface, ensuring efficient collection of ions. The mass analyzer, sample handling system, and sample are all located inside a vacuum chamber with base pressure below 10–7 mbar. Sample holders are introduced into the vacuum chamber via an entrance port.
To account for possible inhomogeneous distribution of sample material inside a cavity, a single measurement consisted of sampling a cavity at 40 linearly spaced positions with a pitch of ∼50 μm. At each position, 100 laser-shots were applied, resulting in 100 mass spectra per position and thus 4,000 mass spectra per measurement. The measurement was controlled by an in-house written Python software.
An in-house developed MATLAB software was used for the first step in the data analysis (Meyer et al., 2017). For the processing of the data for this publication, the data analysis pipeline can be summarized as follows: First, the 100 single-shot spectra recorded per analysis position are histogrammed to create a single mass spectrum per position. A threshold SNR value of 6 was used for the identification of spectra with too little signal. These spectra were omitted in the histogrammed spectrum. Optionally, the 40 resulting spectra are stacked to obtain a spectrum of the entire measurement. However, for subsequent correlation network analysis, the 40 individual spectra retrieved from a single measurement run are used. Next, the histogrammed and stacked spectra were mass calibrated. For this procedure, mass peaks with a known mass are selected in the time domain and used to convert the TOF spectrum to a mass spectrum. Simpson integration was performed for each integer mass between m/z = 1–300 to obtain the signal intensity for each peak. In this routine, also parameters such as SNR and mass resolution (m/Δm) are stored for each single mass.
One of the goals of this study was to identify chemical entities present in complex mixtures of analyte material and separate chemically distinct components from each other. This was done by looking for correlations between mass peaks in measured materials and visualizing correlated masses as a network. Correlation network analysis works with nodes and edges; thus, in this study the single unit masses represented the nodes and correlation values (Pearson ρ) between masses represent edges. The correlation between masses was based on how the mass peaks correlate in their intensities over the 40 positions measured in a sample. A Pearson ρ = 1 meant that the ratio for the intensities of two measured mass peaks stayed the same over the 40 positions. Therefore, the closer ρ was to 1, the stronger the likelihood that the mass peaks in question have the same origin, for example a molecule or class of molecules. The lower ρ between two mass peaks, the less related the two mass peaks were. Networks were used to visualize these correlations to highlight that different clusters were formed that represent chemically different groups, in this case clusters of amino acid and soil mass peaks were formed.
This analysis method resulted in a list of correlations (maximum 45′000 ρ-values) between various masses in a measurement. Data points that have a low or no peak intensity were disregarded because in such a case the statistical relevance of the ratios could not be safely obtained. To achieve reliability, a filter was set: If less than 15 out of the 40 data points had been acquired for a mass peak, the correlation was deemed not reliable enough and was set to zero. The pre-processed edge list was further spatialized and visualized using an open-source graph-drawing platform Gephi (Bastian et al., 2009). Within Gephi the force atlas function was used for the visualization of the network (Jacomy et al., 2014). The edge weight filter was used to further filter the correlations to highlight the strongest correlations in the networks. To identify groups of highly correlated entities, the Louvain modularity was applied to the resulting network, which was represented by the different colors of the nodes and edges in the correlation networks (Blondel et al., 2008). This means that groups that were closely related to each other based on their Pearson correlation got grouped together and had the same color in Gephi because Louvain modularity measured the density of edges within communities in comparison to other communities (Lambiotte et al., 2014).
The mass spectrum of the amino acids extract from the natural permafrost sample is shown in Figure 1. Note, as discussed earlier, the extract contains residues of the permafrost host material. Therefore, a rich mass spectrum is measured. Below m/z = 50 the most prominent peaks of the mass spectrum are found at m/z = 23 and 39, most likely caused by sodium and potassium. These volatile atoms have low ionization potentials and readily show up in laser desorption mass spectra, including negative controls, meaning that the main contributions of these elements come from the steel sample holder. At higher m/z values, several prominent peaks show up between m/z = 50–100 and at m/z = 178.
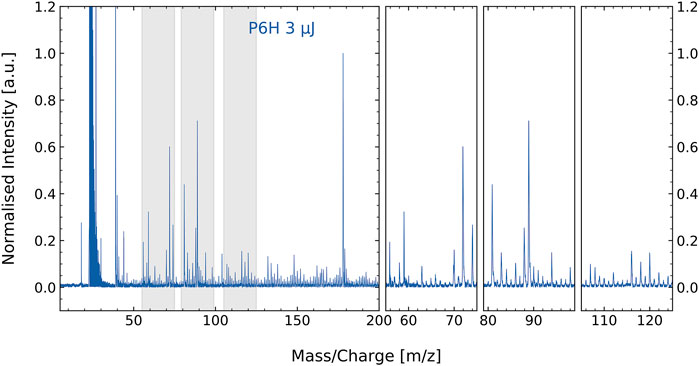
FIGURE 1. Mass spectrum of the P6H permafrost amino acid extract with residuals of the host material (e.g., minerals). Close-ups of some of the most prominent masses are shown in the three panels at the right, which at the same time display a multitude of smaller masses. The prominent peak seen at m/z = 39 is potassium. Many of the smaller mass features are difficult to assign to specific molecular contribution. This is where correlation network analysis can aid.
Several spectral features in Figure 1 can be attributed to specific amino acids based on measurements performed on standard amino acids (Ligterink et al., 2020a). More specifically, unique fragmentation patterns observed for tyrosine, aspartic acid, histidine, phenylalanine, and methionine by (Ligterink et al., 2020a) can be identified in the spectrum of P6H. However, matching spectral features manually for such a complex sample is time consuming and might introduce a user-dependent uncertainty to the analysis. Therefore, we employed a machine-learning algorithm for efficient and unbiased identification of amino acids in complex samples.
As input for the correlation network analysis, mass spectra were recorded of tyrosine, SCo-1 soil, and tyrosine-soil mixture samples (Figure 2). Mass peaks associated with tyrosine are as follows: m/z = 107, 108, 135, 136, 151, 152, 168, 182 (see bottom spectrum of Figure 2). The ion observed at m/z = 182 corresponds to the protonated intact molecule, m/z = 151 and 152 correspond to tyrosine stripped of its carboxyl (−COOH) group plus protonation, m/z = 135 and 136 are tyrosine of its carboxyl and amine (−NH2) group plus protonation and m/z = 107 and 108 are the functional group (HO-C6H4-CH2) plus protonation. Further information about the tyrosine fragmentation pattern can be found in the recent publication (Ligterink et al., 2020a).
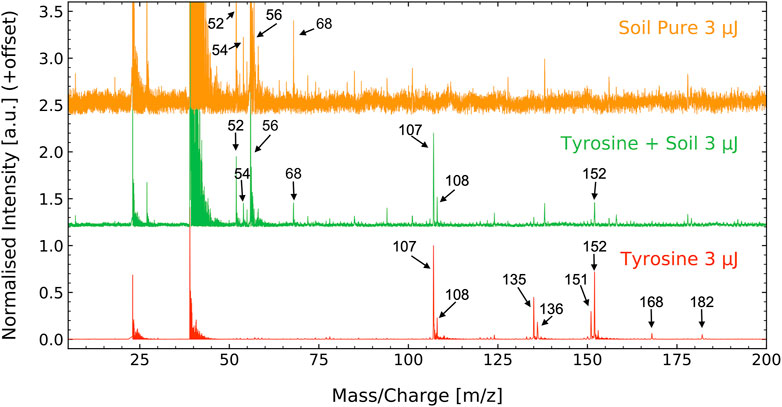
FIGURE 2. Mass spectra of the SCo-1 soil standard from NIST (6 g L−1, top), the tyrosine-soil mixture (100 µM + 6 g L−1, middle) and the tyrosine standard (100 μM, bottom). In all samples, prominent signals are seen at m/z = 23 and 39, which are arising from sample holder and soil contributions of sodium and potassium. The soil spectrum displays a series of prominent masses in the range m/z = 50–70 and several smaller signals up to m/z = 200 with the most prominent peaks being m/z = 52, 54, 58 and 68. Tyrosine has three prominent sets of mass fragments at m/z = 107, 108, m/z = 135, 136, and at m/z = 151, 152 and two smaller mass fragments at m/z = 168 and 182. The tyrosine—soil mixture displays features of both components, notably the most intense peaks of both. Note that different scales were used for each individual mass spectrum for optimized visibility.
The SCo-1 soil standard peaks were identified during this study, with the main peaks found at m/z = 52, 54, 56 and 68 (see top spectrum of Figure 2). The signal recorded for the soil are suspected to result from various atomic and metal oxide ions from the SCo-1 soil. The tyrosine-soil mixture clearly displays features from both its individual components.
Correlation network analysis was performed on the analogue samples as a proof of concept. These measurements were used to show that measured masses of the same origin, e.g, the same amino acid, form correlated clusters and could be identified by their modularity.
The correlations were determined using the integrated mass signals over the 40 positions measured in a sample, as outlined in Section 2.4.1. Figure 3 shows the intensities of selected tyrosine mass peaks in the tyrosine standard measurement for the 40 measurement locations on a sample cavity. The intensities followed a similar pattern and result in high correlations between these masses. Figure 4 shows the intensities of four selected masses in the tyrosine-soil mixture. It shows that the mass peaks from the soil (m/z = 52 and 56) follow a different distribution than those from the tyrosine (m/z = 107 and 152), which leads to lower correlation between the masses of these components.
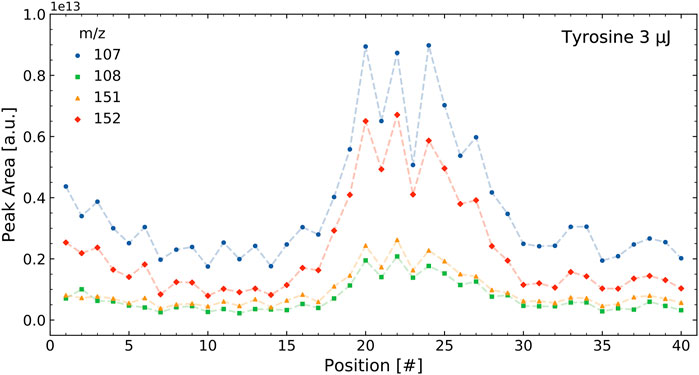
FIGURE 3. Intensities of select masses of the tyrosine standard over a single measurement run containing 40 positions. The tyrosine measurement shows four of the main mass fragments of this molecule. The intensities of the different m/z all correlate with each other.
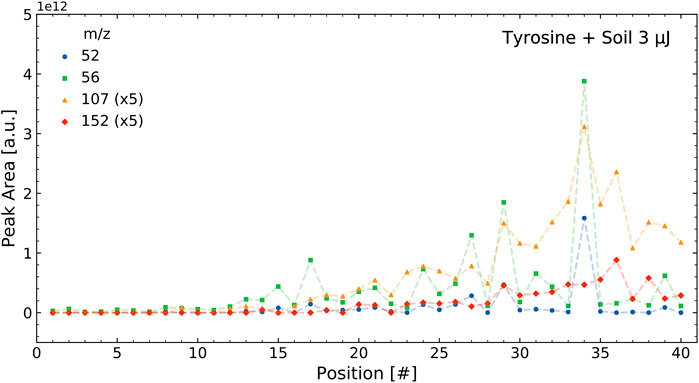
FIGURE 4. Intensities of select masses of the tyrosine soil mixture over a single measurement run containing 40 positions. As can be seen, the two tyrosine masses (m/z = 107 and 152) correlate with each other and the two soil masses (m/z = 52 and 56) correlate with each other, but the soil and tyrosine intensities do not correlate with each other.
The differences in correlations in these two samples are visualized in Figures 5, 6, which show the correlations between the mass peaks of the tyrosine and the tyrosine-soil mixture. For the pure tyrosine measurements, correlations between m/z = 107, 108, 135, 136, 151 and 152, masses that belong to the tyrosine pattern, are depicted. For the mixture, correlations between the m/z = 23 and 39 of the sample holder and soil contributions sodium and potassium, m/z = 52 and 56 of soil components, and m/z = 107 and 152 of tyrosine are shown.
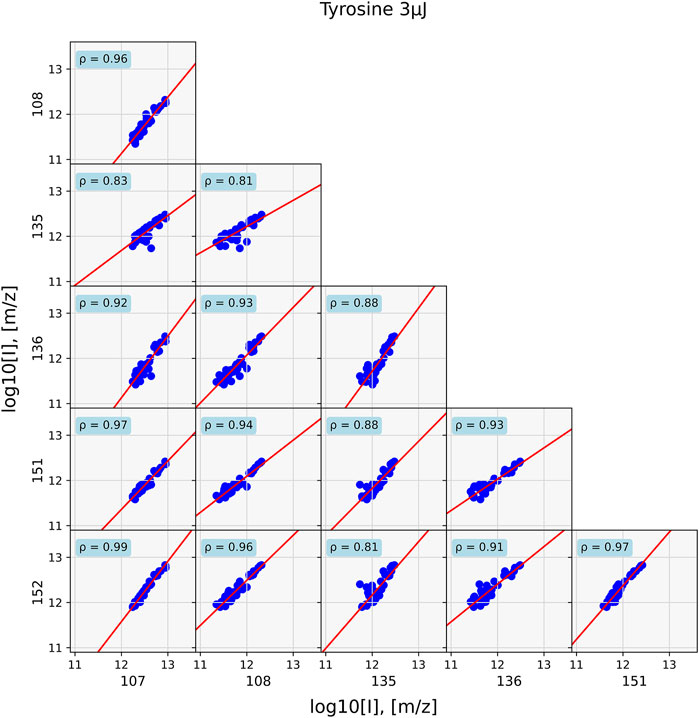
FIGURE 5. Data of a standard tyrosine sample evaluated at 40 positions. Correlations for prominent tyrosine mass fragments are shown. Since all masses come from the same chemical entity, correlations between them are strong. They are the weakest for correlations with m/z = 135 and 136.
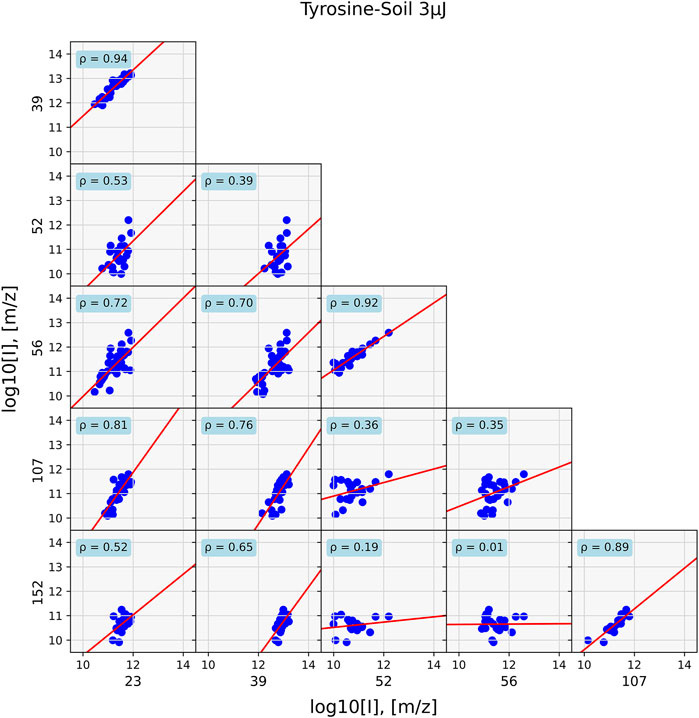
FIGURE 6. Data of a mixed tyrosine—soil sample at 40 positions. Correlations for prominent tyrosine mass fragments are shown (m/z = 107 and 152), sample holder and soil contributions (m/z = 23, 39), and soil masses (m/z = 52, 56). Correlations between masses are mostly found between fragments that originate from the same chemical entity.
In the former case, strong correlation between the masses with ρ > 0.8 and general around 0.9 are found. However, in the case of the mixture, such high correlation values are only found for compounds that are associated with each other, such as sodium (m/z = 23) correlates with potassium (m/z = 39) at ρ = 0.94 and the tyrosine fragments m/z = 107 and 152, with ρ = 0.89. Correlation between components is substantially lower, as is for example seen between m/z = 23 and 152, which has ρ = 0.52.
These examples highlight the use of correlations in the analysis of the mass spectra. While Figures 5, 6 focus on a small number of correlations between selected pairs of peaks, a measurement of a natural sample can easily consist of several hundreds of mass peaks, as highlighted by the measurement of the amino acid extract of the permafrost material. To visualize these larger samples, network analysis is employed.
Applying correlation network analysis to the analogue samples showed that they indeed formed a cluster of their prominent mass peaks. In the tyrosine standard measurement, a cluster consisting of most of the previously identified peaks was found for an edge weight cut-off of ρ > 0.9 (Figure 7). Peaks at m/z = 107 and 152 were the two most strongly connected nodes. They were also the two most intense peaks in the tyrosine mass spectra (bottom spectra in Figure 2). Peaks at m/z = 135 and 136 were missing and both these masses are consistently missing from networks with tyrosine throughout this study.
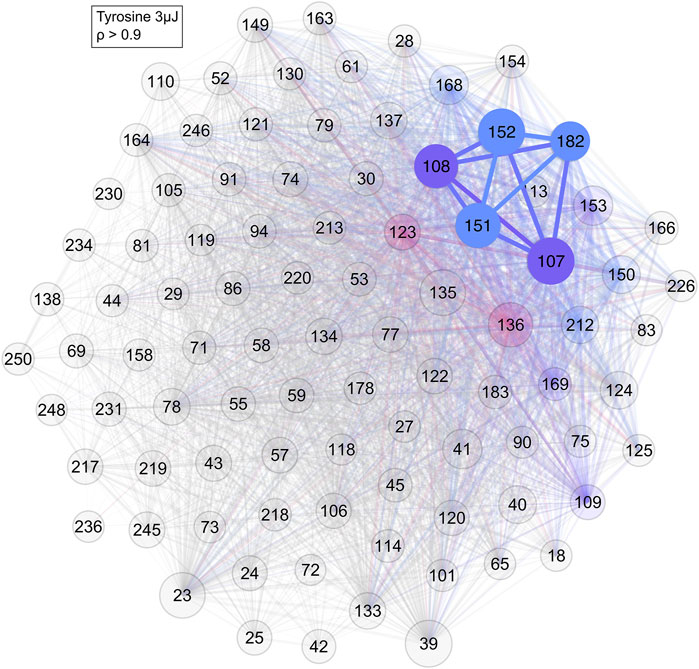
FIGURE 7. Network of the tyrosine standard with a cut-off of ρ > 0.9. As can be seen, most of the previously identified tyrosine masses are connected to each other. Colour and its saturation signify association with a cluster, size of the circles signifies the intensity of the mass peak in the mass spectra.
In the SCo-1 soil standard sample only small clusters of m/z = 52 and 56 and of m/z = 23, 39 and 41 were identified (Figure 8). The former cluster came from the SCo-1 soil standard, while the latter were ions from sodium and potassium, which come from the steel sample holder and the soil. This showed that chemically different components were indeed separated into different clusters. The Pearson correlation for the edge weights of this measurement were set at ρ > 0.7.
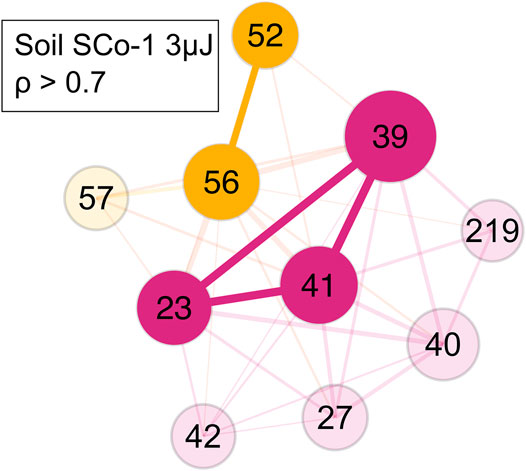
FIGURE 8. Network of the SCo-1 soil NIST standard with a ρ > 0.7. Yellow represents the soil mass cluster, magenta represents the steel holder and soil contributions mass cluster. Colour and its saturation signify association with a cluster, size of the circles signifies the intensity of the mass peak in the mass spectra.
After it was shown that correlation network analysis formed correlated clusters of measurement data of single species, an analogue tyrosine-soil mixture was measured, and the correlation network analysis was applied (Figure 9). In the tyrosine-soil mixture, an edge weight cut-off of ρ > 0.85 was used. Subsequently, three clusters were identified: A tyrosine cluster with m/z = 107, 108 and 152; a soil cluster with m/z = 52, 54, 56, and 68; and a sample holder contribution and soil cluster with m/z = 23, 39, and 41. The formation of these distinct clusters demonstrates that masses in a complex mass spectrum can be assigned to a specific chemical entity.
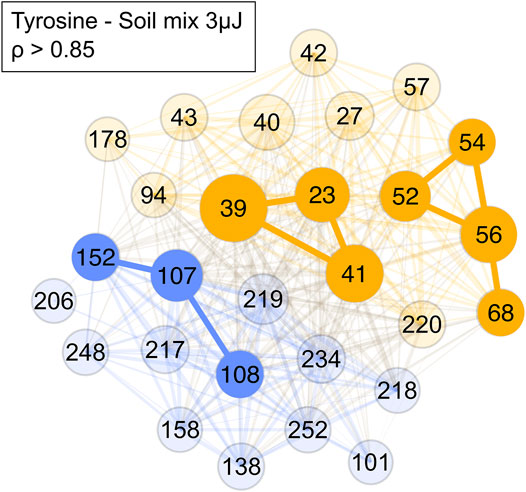
FIGURE 9. Network of a tyrosine-soil mixture with a cut-off of ρ > 0.85. Blue represents the amino acid mass cluster, yellow the soil mass cluster and the sample holder and soil contributions cluster. Colour and its saturation signify association with a cluster, size of the circles signifies the intensity of the mass peak in the mass spectra.
Finally, the correlation network analysis is performed on permafrost amino acid extract (Figure 10). With a correlation ρ > 0.7 cut-off two main networks and several smaller ones were visualized. The prominent yellow cluster contains mass peaks at m/z = 23, 39, 72, 81, 88 and 89, which corresponded with some of the most intense peaks found in the permafrost sample mass spectrum (Figure 1) but with a notable outlier at m/z 178, which is found in the prominent blue cluster, which contained masses presumably associated with amino acids. Furthermore, most of the masses in the yellow cluster matched with those of refractory salt and soil components, such as sodium (m/z = 23) and potassium (m/z = 39, 41). Therefore, the yellow cluster likely corresponds to soil signatures in the permafrost sample. The composition of the blue cluster consists of many high mass ions, such as m/z = 91, 107, 119, 120, and 156, which align with the tyrosine (m/z = 107), phenylalanine (m/z = 91, 119 and 120) and histidine (m/z = 156) fragmentation patterns (Ligterink et al., 2020a). These amino acids had also been detected in these samples in previous LC-MS measurements (Habimana, 2016). Therefore, this cluster corresponds to an organic component in the permafrost extract.
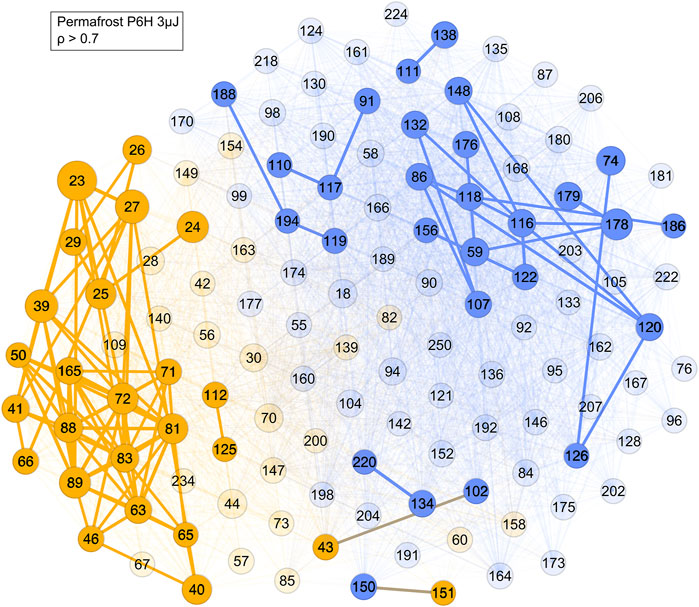
FIGURE 10. Network of the permafrost amino acid extract sample with a cut-off ρ > 0.7. Blue represents the mass peaks associated with organic molecules, yellow the mass peaks from soil and sample holder contributions, with the most strongly correlated ones still having edge connections at this cut-off level.
Correlation network analysis shows promise as a technique to identify different components in complex samples. Measurements taken with the ORIGIN space-prototype instrument of an analogue SCo-1 soil standard mixed with a tyrosine standard showed separation of a soil, a steel sample holder and soil contribution and a tyrosine mass cluster. Each of these groups consisted of the same mass peaks as previously identified in the correlation network analysis of the standard measurements of tyrosine and soil, respectively. A similar behavior was seen for the permafrost amino acid extract, which separated into two mass clusters, which are presumed to be an organic and a soil component.
The separation into different mass clusters is related to the different chemical characteristic of each component. Samples are prepared by drop casting solutions onto the sample holder and by letting the solvent evaporate. In this process, the distribution of material on the surface is affected by a variety of factors (Maskara and Smith, 1997) and the chemical characteristics of the molecules themselves play a prominent role. The difference in distribution can be seen in Figures 3, 4. This means that over the 40 positions measured, the intensities can be quite different from position to position, but the relative abundance of the mass peaks that originate from the same components (amino acids or soil) have higher correlations over these 40 positions. Correlation network analysis is therefore used in separating the major chemically components in a complex sample, such as amino acids and soil in the data analysis step rather than in performing chemical separation during sample preparation. Distinguishing contributions within a chemically similar group, for example, amino acids, is likely more challenging, as these molecules will probably distribute over a surface in a similar way. Follow up experiments are required to determine to what extent individual molecules can be identified in complex mixtures with correlation network analysis.
For the individual samples, several observations are made. In the SCo-1 soil standard and presumably the permafrost extract, several masses are identified that belong to atomic and diatomic species, such as oxides. The prominent mass peak at m/z = 52 could be Cr, m/z = 56 possibly Fe, CaO, and/or MgO2, and m/z = 68 might be CrO. The exact identification of each of these masses goes beyond the scope of this work but is of interest to fully assess the performance of ORIGIN on collected planetary surface material. The applied 3 µJ laser pulse energy at the sample surface, as used during these measurements, desorbs the amino acid components, as shown in a previous study (Ligterink et al., 2020a). The presence of these atomic species seems to indicate that ablation or quasi-ablation is also occurring during the laser-material interaction (Tulej et al., 2011; Riedo et al., 2013a).
To find clear correlations, sufficiently intense mass signals need to be recorded on each sampled spot. This can be problematic for samples with a low surface concentration and in general, the technique benefits from higher surface concentrations. It should be noted here that 40 positions are not the limit for measurements and more positions can be measured per sample to increase the intensity of signals in the accumulated mass spectrum. This can increase the number of positions with high signal intensity and in turn increase the performance of the correlation. Furthermore, the voltage of the detector could be increased, which can further strengthen the intensities of the ratios from which the correlations are derived (Riedo et al., 2017).
In this proof-of-concept study, a natural permafrost amino acid extract was measured with the ORIGIN space-prototype instrument and correlation network analysis was used to identify and separate chemically different components in this complex sample. In the analogue soil-tyrosine mixture distinct mass clusters belonging to the soil and the amino acid tyrosine could be identified. The permafrost measurement also separated two correlated mass clusters, which belong to an organic component, possibly amino acids, and a refractory soil component. The correlation network analysis technique thus helps interpret a large volume of mass spectrometric data generated with the unique capabilities of the ORIGIN space-prototype instrument and aid in the identification of compounds in chemically complex samples. Correlation network analysis is a promising tool for the analysis of astrobiologically relevant samples using ORIGIN and strengthens its case for future application on space exploration missions.
The raw data supporting the conclusion of this article will be made available by the authors, without undue reservation.
LS and NL performed the experiments, the analysis, and wrote the majority of the manuscript. AR, MT, NB, VG, CdK and PW provided support for the instrumentation. RL and SG aided with the correlation network analysis. KK prepared several figures for the manuscript. PE provided the permafrost sample material for analysis. All authors contributed to the text in the final manuscript.
NL is supported by the Swiss National Science Foundation (SNSF) Ambizione grant 193453. PW acknowledged the financial support by the Swiss National Science Foundation (grant 200020_184657). AR and NB acknowledge financial support by the NCCR PlanetS grant 51NF40-182901. Open access funding was provided by the University of Bern.
The authors declare that the research was conducted in the absence of any commercial or financial relationships that could be construed as a potential conflict of interest.
All claims expressed in this article are solely those of the authors and do not necessarily represent those of their affiliated organizations, or those of the publisher, the editors and the reviewers. Any product that may be evaluated in this article, or claim that may be made by its manufacturer, is not guaranteed or endorsed by the publisher.
We thank the EU FP7 project for the Mars Analogues for Space Exploration project (MASE) for supplying the Yedoma Permafrost sample. Special thanks goes out to Dieudonné Habimana for LC–MS analysis of the permafrost sample.
The Supplementary Material for this article can be found online at: https://www.frontiersin.org/articles/10.3389/fspas.2022.909193/full#supplementary-material
Aerts, J. W., Riedo, A., Melton, D. J., Martini, S., Flahaut, J., Meierhenrich, U. J., et al. (2020). Biosignature Analysis of Mars Soil Analogs from the Atacama Desert: Challenges and Implications for Future Missions to Mars. Astrobiology 20 (6), 766–784. doi:10.1089/ast.2019.2063
Altwegg, K., Balsiger, H., Bar-Nun, A., Berthelier, J.-J., Bieler, A., Bochsler, P., et al. (2016). Prebiotic Chemicals-Amino Acid and Phosphorus-In the Coma of Comet 67P/Churyumov-Gerasimenko. Sci. Adv. 2 (5), e1600285. doi:10.1126/sciadv.1600285
Arevalo, R., Selliez, L., Briois, C., Carrasco, N., Thirkell, L., Cherville, B., et al. (2018). An Orbitrap-Based Laser Desorption/ablation Mass Spectrometer Designed for Spaceflight. Rapid Commun. Mass Spectrom. 32 (21), 1875–1886. doi:10.1002/rcm.8244
Bastian, M., Heymann, S., and Jacomy, M. (2009). Gephi: An Open Source Software for Exploring and Manipulating Networks in Proceedings of the International AAAI Conference on Web and Social Media, 3 (1), 361–362. https://ojs.aaai.org/index.php/ICWSM/article/view/13937.
Blondel, V. D., Guillaume, J.-L., Lambiotte, R., and Lefebvre, E. (20082008). Fast Unfolding of Communities in Large Networks. J. Stat. Mech. 2008, P10008. doi:10.1088/1742-5468/2008/10/P10008
Briois, C., Thissen, R., Thirkell, L., Aradj, K., Bouabdellah, A., Boukrara, A., et al. (2016). Orbitrap Mass Analyser for In Situ Characterisation of Planetary Environments: Performance Evaluation of a Laboratory Prototype. Planet. Space Sci. 131, 33–45. doi:10.1016/j.pss.2016.06.012
Cavalazzi, B., and Westall, F. (2019). Biosignatures for Astrobiology. Springer Nature Switzerland AG: Springer International Publishing.
Chumikov, A. E., Cheptsov, V. S., Wurz, P., Lasi, D., Jost, J., Managadze, N. G., et al. (2021). Design, Characteristics and Scientific Tasks of the LASMA-LR Laser Ionization Mass Spectrometer Onboard Luna-25 and Luna-27 Space Missions. Int. J. Mass Spectrom. 469, 116676. doi:10.1016/j.ijms.2021.116676
Cockell, C. S., Schwendner, P., Perras, A., Rettberg, P., Beblo-Vranesevic, K., Bohmeier, M., et al. (2018). Anaerobic Microorganisms in Astrobiological Analogue Environments: From Field Site to Culture Collection. Int. J. Astrobiol. 17 (4), 314–328. doi:10.1017/S1473550417000246
Foucher, F., Hickman-Lewis, K., Hutzler, A., Joy, K. h., Folco, L., Bridges, J. c., et al. (2021). Definition and Use of Functional Analogues in Planetary Exploration. Planet. Space Sci. 197, 105162. doi:10.1016/j.pss.2021.105162
Getty, S. A., Brinckerhoff, W. B., Cornish, T., Ecelberger, S., and Floyd, M. (2012). Compact Two-step Laser Time-Of-Flight Mass Spectrometer for In Situ Analyses of Aromatic Organics on Planetary Missions. Rapid Commun. Mass Spectrom. 26 (23), 2786–2790. doi:10.1002/rcm.6393
Goesmann, F., Brinckerhoff, W. B., Raulin, F., Goetz, W., Danell, R. M., Getty, S. A., et al. (2017). The Mars Organic Molecule Analyzer (MOMA) Instrument: Characterization of Organic Material in Martian Sediments. Astrobiology 17 (6–7), 655–685. doi:10.1089/ast.2016.1551
Goesmann, F., Rosenbauer, H., Roll, R., Szopa, C., Raulin, F., Sternberg, R., et al. (2007). COSAC, the Cometary Sampling and Composition Experiment on Philae. Space Sci. Rev. 128 (1–4), 257–280. doi:10.1007/s11214-006-9000-6
Grubisic, A., Trainer, M. G., Li, X., Brinckerhoff, W. B., van Amerom, F. H., Danell, R. M., et al. (2021). Laser Desorption Mass Spectrometry at Saturn's Moon Titan. Int. J. Mass Spectrom. 470, 116707. doi:10.1016/j.ijms.2021.116707
Habimana, D. (2016). Amino Acid Analysis of Permafrost Samples in Support of Life Detection on Mars. Leiden: Leiden University.
Hand, K. P., Murray, A. E., Garvin, J. B., Brincherhoff, W. B., Christner, B. C., Edgett, K. S., et al. (2017). Report of the Europa Lander Science Definition Team. National Aeronautics and Space Administration, 17.
Hays, L., and Beaty, D. (2017). Conference Report: Biosignature Preservation and Detection in Mars Analog Environments. Astrobiology 17 (1), 1–2. doi:10.1089/ast.2016.1608
Hendrix, A. R., Hurford, T. A., Barge, L. M., Bland, M. T., Bowman, J. S., Brinckerhoff, W., et al. (2019). The NASA Roadmap to Ocean Worlds. Astrobiology 19 (1), 1–27. doi:10.1089/ast.2018.1955
Jacomy, M., Venturini, T., Heymann, S., and Bastian, M. (2014). ForceAtlas2, a Continuous Graph Layout Algorithm for Handy Network Visualization Designed for the Gephi Software. PLoS ONE 9 (6), e98679. doi:10.1371/journal.pone.0098679
Kipfer, K. A., Ligterink, N. F. W., Bouwman, J., Schwander, L., Grimaudo, V., de Koning, C. P., et al. (2022). Toward Detecting Polycyclic Aromatic Hydrocarbons on Planetary Objects with ORIGIN. Planet. Sci. J. 3 (2), 43. doi:10.3847/psj/ac4e15
Koutrouli, M., Karatzas, E., Paez-Espino, D., and Pavlopoulos, G. A. (2020). A Guide to Conquer the Biological Network Era Using Graph Theory. Front. Bioeng. Biotechnol. 8, 34. doi:10.3389/fbioe.2020.00034
Lambiotte, R., Delvenne, J.-C., and Barahona, M. (2014). Random Walks, Markov Processes and the Multiscale Modular Organization of Complex Networks IEEE Transactions on Network Science and Engineering, New Delhi, India, July 14, 2014, 1, 76–90. doi:10.1109/TNSE.2015.2391998
Ligterink, N. F. W., Grimaudo, V., Moreno-García, P., Lukmanov, R., Tulej, M., Leya, I., et al. (2020a). ORIGIN: a Novel and Compact Laser Desorption - Mass Spectrometry System for Sensitive In Situ Detection of Amino Acids on Extraterrestrial Surfaces. Sci. Rep. 10 (1), 9641. doi:10.1038/s41598-020-66240-1
Ligterink, N. F. W., Riedo, A., Tulej, M., Lukmanov, R., Grimaudo, V., de Koning, C., et al. (2020b). Detecting the Elemental and Molecular Signatures of Life: Laser-Based Mass Spectrometry Technologies. Planetary Science and Astrobiology Decadal Survey, 2023–2032. Available at: https://arxiv.org/abs/2009.02521
Lingam, M., and Loeb, A. (2021). Life in the Cosmos: From Biosignatures to Technosignatures. (Cambridge, Massachusetts: Harvard University Press).
Lorenz, R. D., Turtle, E. P., Barnes, J. W., Trainer, M. G., Adams, D. S., Hibbard, K. E., et al. (2018). Dragonfly: A Rotorcraft Lander Concept for Scientific Exploration at Titan. Johns Hopkins Apl. Tech. Dig. 34 (3), 374. www.jhuapl.edu/techdigest.
Lukmanov, R. A., Riedo, A., Wacey, D., Ligterink, N. F. W., Grimaudo, V., Tulej, M., et al. (2021a). On Topological Analysis of Fs-LIMS Data. Implications for In Situ Planetary Mass Spectrometry. Front. Artif. Intell. 4, 668163. doi:10.3389/frai.2021.668163
Lukmanov, R. A., Tulej, M., Ligterink, N. F. W., de Koning, C., Riedo, A., Grimaudo, V., et al. (2021b). Chemical Identification of Microfossils from the 1.88-Ga Gunflint Chert: Towards Empirical Biosignatures Using Laser Ablation Ionization Mass Spectrometer. J. Chemom. 35, e3370. doi:10.1002/cem.3370
Managadze, G. G., Wurz, P., Sagdeev, R. Z., Chumikov, M., Tuley, M., Yakovleva, M., et al. (2010). Study of the Main Geochemical Characteristics of Phobos’ Regolith Using Laser Time-of-Flight Mass Spectrometry. Sol. Sys. Res. 44 (5), 376–384.
Marin, A., and Wellman, B. (2009). Social Network Analysis: An Introduction in The SAGE handbook of social network analysis, Editor J. Scott, and P. J. Carrington (Thousand Oaks: SAGE Publications Ltd.,), 11–25. Available at: https://dx.doi.org/10.4135/9781446294413.n2
Maskara, A., and Smith, D. M. (1997). Agglomeration during the Drying of Fine Silica Powders, Part II: The Role of Particle Solubility. J. Am. Ceram. Soc. 80 (7), 1715–1722. doi:10.1111/j.1151-2916.1997.tb03044.x
Meyer, S., Riedo, A., Neuland, M. B., Tulej, M., and Wurz, P. (2017). Fully Automatic and Precise Data Analysis Developed for Time-Of-Flight Mass Spectrometry. J. Mass Spectrom. 52 (9), 580–590. doi:10.1002/jms.3964
Pietrogrande, M. C. (2013). Enantioselective Separation of Amino Acids as Biomarkers Indicating Life in Extraterrestrial Environments. Anal. Bioanal. Chem. 405 (25), 7931–7940. doi:10.1007/s00216-013-6915-0
Pietrogrande, M. C. (2012). “Gas Chromatography in Space Exploration,” in Handbooks in Separation Science, Gas Chromatography. 2nd Edn, Editor C. F. Poole (Elsevier), Chap. 2, 865–874. doi:10.1016/b978-0-12-820675-1.00035-6
Raulin, F., Cow, P., Coscia, D., Gazeau, M. C., Stemberg, R., Bruston, P., et al. (1998). An Exobiological View of Titan and the Cassini-Huygens Mission. A&. Sptlce Res. 22 (3), 353–362. doi:10.1016/s0273-1177(98)00193-8
Riedo, A., Bieler, A., Neuland, M., Tulej, M., and Wurz, P. (2012). Performance Evaluation of a Miniature Laser Ablation Time-Of-Flight Mass Spectrometer Designed Forin Situinvestigations in Planetary Space Research. J. Mass Spectrom. 48 (1), 1–15. doi:10.1002/jms.3104
Riedo, A., Meyer, S., Heredia, B., Neuland, M. B., Bieler, A., Tulej, M., et al. (2013a). Highly Accurate Isotope Composition Measurements by a Miniature Laser Ablation Mass Spectrometer Designed for In Situ Investigations on Planetary Surfaces. Planet. Space Sci. 87, 1–13. doi:10.1016/j.pss.2013.09.007
Riedo, A., Neuland, M., Meyer, S., Tulej, M., and Wurz, P. (2013b). Coupling of LMS with a Fs-Laser Ablation Ion Source: Elemental and Isotope Composition Measurements. J. Anal. At. Spectrom. 28 (8), 1256. doi:10.1039/c3ja50117e
Riedo, A., Tulej, M., Rohner, U., and Wurz, P. (2017). High-speed Microstrip Multi-Anode Multichannel Plate Detector System. Rev. Sci. Instrum. 88 (4), 045114. doi:10.1063/1.4981813
Rohner, U., Whitby, J. A., and Wurz, P. (2003). A Miniature Laser Ablation Time-Of-Flight Mass Spectrometer Forin Situplanetary Exploration. Meas. Sci. Technol. 14 (12), 2159–2164. doi:10.1088/0957-0233/14/12/017
Sagan, C. (1980). Cosmos. New York: Random House. Technically I used the 2013 edition, in case that is important.
Tulej, M., Iakovleva, M., Leya, I., and Wurz, P. (2011). A Miniature Mass Analyser for Iin-Ssitu Elemental Analysis of Planetary Material-Performance Studies. Anal. Bioanal. Chem. 399 (6), 2185–2200. doi:10.1007/s00216-010-4411-3
Keywords: astrobiology, network analysis, biosignatures, mass spectrometry, laser desorption, space instrumentation, amino acids, planetary exploration
Citation: Schwander L, Ligterink NFW, Kipfer KA, Lukmanov RA, Grimaudo V, Tulej M, de Koning CP, Keresztes Schmidt P, Gruchola S, Boeren NJ, Ehrenfreund P, Wurz P and Riedo A (2022) Correlation Network Analysis for Amino Acid Identification in Soil Samples With the ORIGIN Space-Prototype Instrument. Front. Astron. Space Sci. 9:909193. doi: 10.3389/fspas.2022.909193
Received: 31 March 2022; Accepted: 22 April 2022;
Published: 27 May 2022.
Edited by:
Hugh Kim, Korea University, South KoreaReviewed by:
Julian Chela-Flores, The Abdus Salam International Centre for Theoretical Physics (ICTP), ItalyCopyright © 2022 Schwander, Ligterink, Kipfer, Lukmanov, Grimaudo, Tulej, de Koning, Keresztes Schmidt, Gruchola, Boeren, Ehrenfreund, Wurz and Riedo. This is an open-access article distributed under the terms of the Creative Commons Attribution License (CC BY). The use, distribution or reproduction in other forums is permitted, provided the original author(s) and the copyright owner(s) are credited and that the original publication in this journal is cited, in accordance with accepted academic practice. No use, distribution or reproduction is permitted which does not comply with these terms.
*Correspondence: Loraine Schwander, LGxvcmFpbmUuc2Nod2FuZGVyQGhodS5kZQ==">loraine.schwander@unibe.chLGxvcmFpbmUuc2Nod2FuZGVyQGhodS5kZQ==; Andreas Riedo, YW5kcmVhcy5yaWVkb0B1bmliZS5jaA==
†Loraine Schwander, Molecular Evolution, Heinrich-Heine-University Düsseldorf, Düsseldorf, Germany
Disclaimer: All claims expressed in this article are solely those of the authors and do not necessarily represent those of their affiliated organizations, or those of the publisher, the editors and the reviewers. Any product that may be evaluated in this article or claim that may be made by its manufacturer is not guaranteed or endorsed by the publisher.
Research integrity at Frontiers
Learn more about the work of our research integrity team to safeguard the quality of each article we publish.