
94% of researchers rate our articles as excellent or good
Learn more about the work of our research integrity team to safeguard the quality of each article we publish.
Find out more
ORIGINAL RESEARCH article
Front. Astron. Space Sci., 10 May 2022
Sec. Space Physics
Volume 9 - 2022 | https://doi.org/10.3389/fspas.2022.886037
 Devin Huyghebaert1*
 Matthias Clahsen2
 Jorge L. Chau2
 Toralf Renkwitz2
 Ralph Latteck2
 Magnar G. Johnsen3
 Juha Vierinen1
Multiple propagation modes between different bistatic radar links were measured during the operations of a very high frequency (VHF) 32.55 MHz radar system in northern Norway. The Spread Spectrum Interferometric Multistatic meteor radar Observing Network (SIMONe) Norway system detected meteor trails, direct transmitter to receiver signal propagation, over-the-horizon signal propagation from the SIMONe Germany system, ground and/or sea scatter, and ionospheric scatter on 27 August 2021 between 16:30–20:00 UT. These simultaneous detections were during an active ionospheric period with multiple occurrences of energetic charged particle precipitation. The SIMONe systems used continuous-wave (CW) pseudo-random phase modulated transmit signals and interferometry to make it possible to isolate each of these propagation modes and examine their characteristics. Different multistatic links at three receiver locations were analyzed, providing multistatic measurements of the regions with spatial and temporal resolutions on the order of 1.5 km and 2 s. The analysis techniques are described, with characteristics of the radar signal presented for each propagation mode and multistatic link. This study serves to highlight the capabilities of the SIMONe Norway system to research multiple aspects of ionospheric phenomena, specifically in the lower thermosphere-mesosphere boundary region.
The propagation of radio waves through an ionized medium has long been described through the Appleton-Hartree equation (e.g., Sen and Wyller, 1960). One of the unique properties of an ionized medium, such as the terrestrial ionosphere, is that it has an index of refraction less than 1. This causes radio waves to refract towards the Earth as they traverse the ionosphere. With sufficient plasma density, the radio waves can be refracted back towards the surface of the Earth. The radio waves can scatter from the ground, potentially continuing to forward scatter or scatter backward towards the signal source (e.g., Nishitani et al., 2019). Assuming no fast changes occur in the ionospheric plasma layer, the radio waves can re-tracetheir path back to their origin. For radar systems, this is commonly referred to as ground backscatter, or groundscatter (e.g., Basu et al., 1973; Greenwald et al., 1995; Nishitani et al., 2019).
Multiple radio signal propagation and scattering modes through the ionosphere have been hypothesized and proven through extensive radar measurements (e.g., Nishitani et al., 2019). Using the different propagation and scattering modes of radar signals makes it possible to probe different characteristics of the ionospheric medium, such as the plasma density and plasma turbulence (references follow). Some of the unique methods of probing the terrestrial ionosphere using radars include: measuring ionized meteor trails (e.g., Roper and Elford, 1963; Sugar, 1964; Chau et al., 2021), measuring plasma density irregularities (e.g., Greenwald et al., 1995; Hysell et al., 2012; Huyghebaert et al., 2019), measuring reflections of radar signals from enhanced plasma density ionospheric layers (e.g., Bibl and Reinisch, 1978), and measuring over-the-horizon radio propagation, which includes both ground or sea backscatter (e.g., Basu et al., 1973; Chisham et al., 2007; Kozlovsky and Lester, 2015; Kozlovsky et al., 2019) and over-the-horizon radio links (e.g., Hysell et al., 2016).
The SIMONe (Spread Spectrum Interferometric Multistatic meteor radar Observing Network) (Chau et al., 2019) Norway system was recently installed and has measured many of these radar signal propagation modes during an active ionospheric period on 27 August 2021. The next section provides an overview of some different radar signal propagation modes that have been measured by HF and VHF radar systems, as well as an overview of the SIMONe Norway system.
The propagation of radio signals through the ionosphere has been an essential area of study for HF radio and radar signals. One network of HF radars, the Super Dual Auroral Radar Network (SuperDARN) Greenwald et al. (1995); Chisham et al. (2007), requires significant refraction to obtain details of plasma convection in the terrestrial ionosphere over a very large field-of-view. The signal is required to be approximately perpendicular to the geomagnetic field to scatter from ionospheric plasma irregularities, or perturbations, aligned with the geomagnetic field. This provides details about the ionospheric plasma characteristics and motion. There are also many studies from SuperDARN investigating ground scattering of the radar signal from over the horizon propagation (e.g., Chisham et al., 2007; Nishitani et al., 2019, and references therein).
Highlighting the need to better understand the propagation of radar signals through the ionosphere is a recent publication by Shepherd et al. (2020). The study investigated bistatic operations of the SuperDARN radars and the different propagation modes present. This included the difficulties in properly isolating and imaging the different signal propagation modes, such as F-region coherent scatter and ground scatter, over a large field-of-view with the multiple possible bistatic propagation paths. Future implementation of an imaging interferometry analysis for SuperDARN radars will be greatly beneficial for further analysis of these bistatic multiple propagation paths and better mapping of the scatter.
One benefit of using VHF frequency radars in comparison to HF radars is the requirement of very large plasma densities to produce sufficient refraction of the signal for ground scatter to occur. This allows more easily attainable propagation mode determination, and therefore a better understanding of the ionospheric characteristics required for the signal characteristics observed, including the angle of arrival and spectra details.
While the occurrence of VHF ground and/or sea scatter is rare, it has been shown to occur in the auroral zone during active geomagnetic events (e.g., Kozlovsky and Lester, 2015; Kozlovsky et al., 2019). These occurrences were noticed due to unexpected meteor radar measurement behaviour, specifically the variation in the radar signal over time. From the results it was determined that the meteor radar signal at 36.9 MHz was refracting off the E-region ionosphere, scattering from the ground/sea, and propagating back along a similar path to be received at the radar. Periodic variations in the radar signal were attributed to changing E-region plasma characteristics, potentially from pulsating aurora generating variations in the E-region plasma density profile.
Multiple occurrences of these groundscatter echoes were shown to occur every year, specifically during periods of increased geomagnetic activity around midnight. This corresponds to a potentially enhanced E-region ionization layer that allows the VHF signal to propagate over the horizon due to refraction. In the Kozlovsky and Lester (2015) and Kozlovsky et al. (2019) studies, the interferometry of the meteor radars were not used to determine the height of these expected groundscatter echoes. This could provide further details on the ionospheric plasma medium. The use of interferometry to determine altitudes for VHF ground scatter occurrences is investigated in the present study.
A longstanding issue in the study of E-region coherent scatter is the determination of the altitude of the scatter with respect to the corresponding radar spectra (e.g., Sahr et al., 1991; Sahr and Fejer, 1996). From previous measurements and ionospheric plasma instability theory it is generally accepted that auroral E-region coherent scatter occurs between 95 and 125 km and is strongest at perpendicular angles to the geomagnetic field (Sahr and Fejer, 1996). Measurements of E-region coherent scatter by VHF radars do not always agree with these altitude and aspect angle expectations, resulting in different explanations for the disagreement, mostly to do with refraction of the VHF signal. Some examples of this are provided in Moorcroft (1989), Hall et al. (1990), Hall and Moorcroft (1992), and Uspensky et al. (1994), where tilted plasma density layers are proposed to provide sufficient refraction of the radar signal to obtain expected altitude and aspect angle characteristics of the coherent scatter. Whether it is tilted layers or larger than expected ionospheric plasma densities, from the measurements it is clear that significant refraction of VHF signals occurs in the auroral zone during active ionospheric events.
A study by St.-Maurice and Chau (2016) provided a theoretical framework to describe the reasons for the different E-region coherent scatter spectra based on the altitude of the measurements. The evidence for the explanations were provided in a companion paper by Chau and St.-Maurice (2016), where measurements from VHF multistatic pulsed meteor radars in Germany were able to detect E-region coherent scatter during a very active geomagnetic period. In relation to this, understanding the refraction occurring at VHF radar frequencies during active geomagnetic conditions will aid in better understanding the altitude dependence of the E-region coherent scatter and potentially further validate the theoretical framework proposed by St.-Maurice and Chau (2016). Other reviews on the origin of the different characteristics of E-region coherent scatter can be found in Fejer and Kelley (1980), Sahr and Fejer (1996), Moorcroft (2002), Makarevich (2009), and Hysell (2015).
Some recent E-region coherent scatter studies have been able to locate E-region coherent scatter much more accurately than previously (e.g., Hysell et al., 2012; Chau and St.-Maurice, 2016; Huyghebaert et al., 2019). Even with the enhanced imaging and location determination capabilities, there are still questions as to how much refraction occurs for the radar signal, especially at frequencies of ∼ 30 MHz in the lower VHF band. The study presented here is a basis to better understand the refraction of VHF signals in the presence of strong geomagnetic activity, providing insights on signal propagation modes during these active periods. This will also help provide additional context to ionospheric measurements made by VHF radars in the past, present, and future.
Beginning with the first published implementation of a CW coded meteor radar system by Vierinen et al. (2016), the concept of CW coded signals for meteor radars has been implemented at multiple new radar sites around the World, specifically by the radar remote sensing group at the Leibniz Institute of Atmospheric Physics based in Kühlungsborn, Germany. Their meteor radar network sites are known as MMARIA (Multistatic, Multifrequency Agile Radar for Investigations of the Atmosphere) (Stober and Chau, 2015), with the sites using the CW coded signals being known as SIMONe (Chau et al., 2019) implementations of MMARIA. Besides CW coded signals (i.e., spread spectrum), SIMONe uses multi-input multi-output (MIMO) and compressed sensing concepts, allowing for more reliable and increased resolution when analyzing the received signal using interferometric analysis (Chau et al., 2019; Urco et al., 2019). The MIMO setup consists of both multiple transmit and receive antennas at the sites, as well as multiple sites included in the network. The multistatic meteor radar networks derive neutral winds from ionized meteor trails that drift with the background neutral atmosphere. A detailed description of operational SIMONe systems can be found in Chau et al. (2021).
Using the SIMONe Norway system and its enhanced interferometric capabilities, multiple propagation paths of the VHF radar signal can be isolated by processing the coded CW signal and using MIMO interferometry. Only a single receiver antenna was present at the SIMONe Norway receiver sites for this study, resulting in multi-input single-output (MISO) analysis. A description of the modified processing algorithm to distinguish the different radar propagation modes during active geomagnetic periods is detailed in Section 3. An overview of the results in provided in Section 4. The description and determination of the different propagation modes is provided in Section 5. The radar signal propagation modes detected include meteor scatter, direct ground-wave from the transmitter, multi-site over-the-horizon transmitter links, ground/sea clutter from ionospheric refraction, E-region scatter, and potentially F-region scatter. The summary and conclusions from this event are provided in Section 6.
The SIMONe Norway system operates with a center frequency of 32.55 MHz and consists of 4 single antenna receive sites and one multi-transmitter multi-coded transmit site. The transmitter site consists of 6 antennas arranged in a pentagon configuration with an antenna in the center. The location of each site is provided in Figure 1, with the receive sites at Saura (69.14°N, 16.01°E), Ramfjordmoen/Tromsø (69.58°N, 19.21°E), and Straumen (67.38°N, 15.64°E) being used in the current experiment. Andenes (69.27°N, 16.04°E) is used as the transmitter site. The site labelled as “Sto” was not used due to the limited internet connection for obtaining the raw voltage data. All sites were installed in August 2021, with operations commencing shortly after installation.
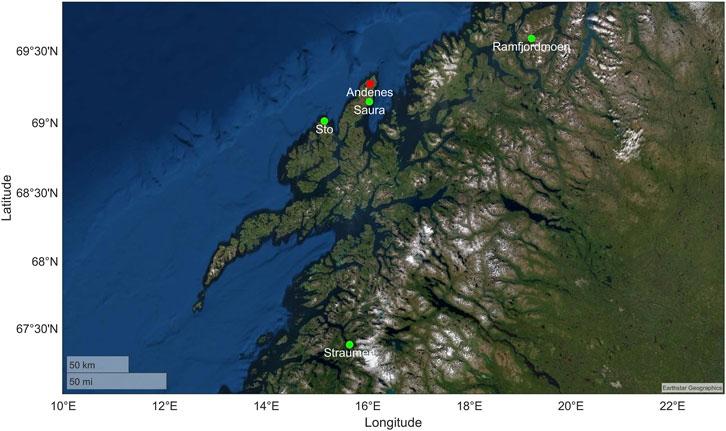
FIGURE 1. A map of the different SIMONe Norway sites used in the analysis presented in the current study. Andenes is shown in red as the transmitter site, while the green sites are the receiver sites. Saura, Straumen, and Ramfjordmoen (Tromsø) were used in the study to investigate the VHF signal propagation and scattering characteristics. The site labelled “Sto” was not included in the analysis due to a insufficient internet connection speed to obtain the raw voltage data.
The layout of the sites are prioritized for specular meteor measurements so as to observe the illuminated volume from different viewing angles and to increase the number of specular meteor detections. With the current multi-static radar layout, the straight line propagation aspect angle conditions for coherent ionospheric scatter are very poor, with ideal aspect conditions located a significant distance to the north.
The radar network operates at 32.55 MHz with a 100 kHz bandwidth, providing 3 km total propagation distance resolution. Each transmitter antenna transmits a different CW pseudo-random coded signal, with a baud length of 10 μs and a code repetition time of 10 ms. The radar signal therefore aliases every 3,000 km in total propagation distance and every ±50 kHz in Doppler frequency (±230 km/s Doppler velocity for a monostatic setup). With these aliasing limits on the radar system, no aliased measurements are expected in range or Doppler shift.
E-region coherent scatter velocities of
Through re-analysis of the raw voltage data using multiple repeated code sequences it is possible to increase the integration time of the system. This is important for obtaining satisfactory Doppler resolution measurements for the analysis of E-region coherent scatter. By integrating the signal over a longer period, well defined spectra can be determined for the radar signal at all ranges simultaneously. The system setup and signal processing allows finer analysis of the signal than is typically possible with uncoded CW radars. The integration performed on the data is similar to that of the ICEBEAR (Ionospheric Continuous-wave E region Bistatic Experimental Auroral Radar) system (Huyghebaert et al., 2019). For the SIMONe Norway system analysis presented here, the signal of the different codes transmitted simultaneously on each locally separated transmit antenna are received on a single bistatic receiving antenna at each of the sites. In the ICEBEAR system a single code is transmitted and received on multiple locally separated receiving antennas. A block diagram of the SIMONe processing algorithm for this study is presented in Figure 2.
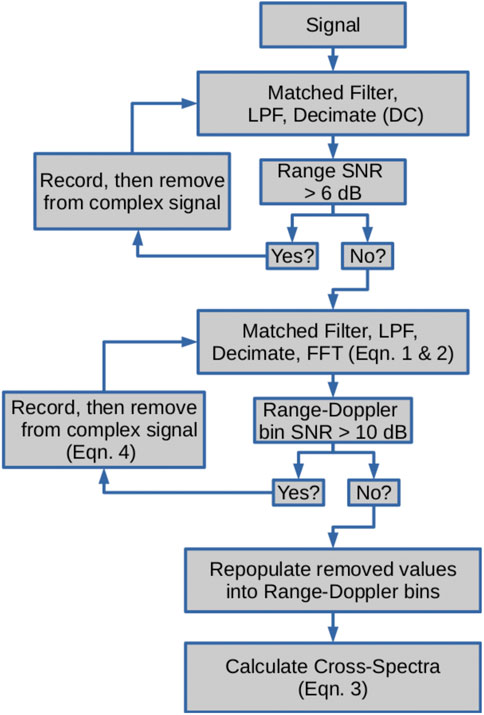
FIGURE 2. A block diagram depicting the signal processing steps for the analysis in the current study. This is also described in Table 1, and in the text.
The matched filter, low pass filter, and decimation stage can be described by the equation,
where Vant is the complex voltage measured at an antenna, C* is the complex conjugate of the code transmitted, drate is the decimation rate, tn is the decimated sample number in time, r is the range gate, d is the sample in the decimation summation, spanning from 0 to drate—1 in a 0-indexing system.
Once the received signal is decoded and filtered, a Fourier transform is taken for each range, thereby determining the spectra for each range separately. This is shown by the equation,
where f is the frequency of the signal and FFTt refers to taking a Fast Fourier Transform in the time domain for each range. The result is a range-Doppler shift array of the radar signal, given by S. An example of this data is provided in the next section.
Once the spectra are calculated for each antenna, the cross-spectra can also be determined. Each range-Doppler bin from the spectra of one antenna is multiplied by the complex conjugate of the range-Doppler bin from another antenna. The equation describing this is given by,
where the subscript number refers to the antenna number. This cross-spectra information can be used to perform interferometry on the scattered radar signal.
The SIMONe 10 ms CW code was repeated 20 times to obtain 200 ms of integration time with a matched filter. This was done for each of the codes, as each transmit antenna for the SIMONe system has a different code. The self-clutter in range-Doppler space generated from the 10 ms CW code was ∼ 18 dB from the peak signal. For strong signals the multiple different codes generated a significant amount of self-clutter, which had to be removed for usable data to be obtained. A 0 Hz clutter removal algorithm was first used on the data, similar to that described in Urco et al. (2019). From there another clutter removal algorithm was implemented to remove frequency shifted clutter. It should be noted that since we repeated the 10 ms code, self-clutter was magnified along the ranges for a given Doppler and repeated every 100 Hz in the Doppler space. The self-clutter removal algorithm is described next.
To further remove clutter from Doppler shifted signals, the previous SIMONe implementation of the self-clutter removal algorithm was expanded upon. Though there was a significant processing time increase, this frequency shifted self-clutter removal was essential for analysis of the radar signal. The points in the range-Doppler spectra were selected by finding all points in the range-Doppler domain above 10 dB SNR. The value of these bins were recorded to be re-populated into the spectra after the self-clutter removal algorithm. The transmitted code was then shifted by the range, frequency shifted by the Doppler, and multiplied by the range-Doppler bin value to provide an amplitude and phase shift before being subtracted from the raw voltage data. The equation describing this process is given by,
where p refers to the range-Doppler points above the SNR threshold for which the self clutter is removed. The SNR term on the right side of the equation scales the signal level so that the noise is not included in the subtraction. The division by the decimation rate is necessary to normalize the values, as the low pass filter and decimation is performed on the voltages before processing. This method is very similar to the CLEAN algorithm used in radio astronomy (Högbom, 1974).
The process was performed for all the range-Doppler bins above a SNR threshold and for all transmit codes. The process was repeated until there were no bins above 10 dB SNR in the data. An error catch was utilized in case a self-clutter reduction could not be attained, in which case the iteration ended early. After the iterative process, the points that were removed were repopulated into the range-Doppler spectra. A text description of the algorithm to produce the 10 × 200 ms integrated spectra and cross-spectra (2 s resolution) is provided in Table 1, following the block diagram provided in Figure 2.
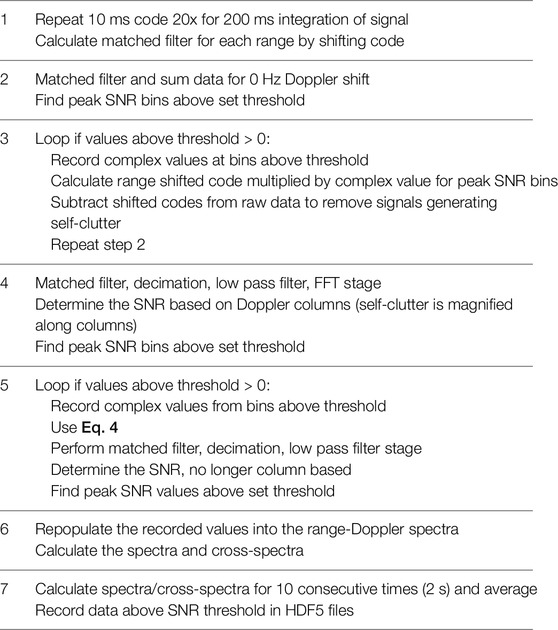
TABLE 1. Algorithm for calculating the spectra and cross-spectra in this study for the SIMONe Norway systems.
The range-Doppler values corresponding to a SNR above a set threshold were recorded in HDF5 format for further future processing. In the case of the current processing, a 2.0 SNR (∼ 3 dB) threshold was set for recording the data. This reduced the data footprint compared to recording the values from each full range-Doppler spectra.
An example of a range-Doppler SNR plot is shown in Figure 3. Here the left panel does not perform any clutter removal algorithm, while the right panel includes this step. The improvement in the data is obvious, with less clutter included in the results. It should be noted that this algorithm works well for scattering targets with unique ranges and Doppler shifts. If there are two strong scattering targets within the same Doppler shift and range bin, the self-clutter reduction algorithm has difficulty removing the expected signal. This will be seen in Section 4, where self-clutter is still evident during periods of multiple targets with the same range and Doppler shift. It should also be noted that the narrower the spectra for a single target, the better this self-clutter removal algorithm will work. For wide spectra the amplitude of the decoded voltage will decorrelate in time, thereby changing the amplitude of the signal over the integration period. This results in some leftover signal at that frequency after the self-clutter subtraction. In the future, the self-clutter reduction algorithm can be further improved through the simultaneous use of interferometry during the clutter removal stage to separate multiple targets and properly remove their contributions to the radar signal.
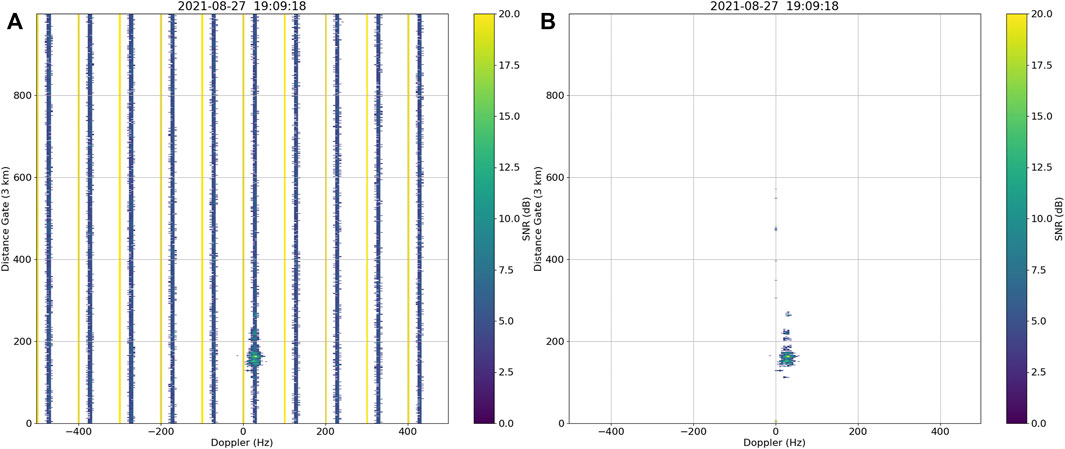
FIGURE 3. Example of the spectra obtained for the E-region processing of SIMONe Norway data. The (A) panel does not include clutter reduction, while the (B) panel uses the processing algorithm described in Table 1.
For this study the same angle of departure (AOD) software as the standard SIMONe analysis was used Chau et al. (2021). This provides the center of the scattering volume for the spread target ionospheric echoes, which is sufficient for the current propagation mode analysis. Future analysis of ionospheric scatter data from the SIMONe Norway system can incorporate imaging techniques to determine the size of the scattering region, as this is important for multi-instrument comparisons and properly calculating the extent of the plasma turbulence region (e.g., Meyer and Sahr, 2004; Huyghebaert et al., 2021).
From the coherence of the signal derived from the measured spectra and cross-spectra, the AOD is determined. The scatter can then be mapped in 3-D space.
The initial results from the AOD determination showed that the side lobes of the array point-spread function were commonly chosen as solutions, likely caused by a combination of the spread target nature of ionospheric scatter and multiple low SNR scattering points (noise effects). To reduce these erroneous AOD occurrences, the spectra for the full FOV were fit for each range, and the spectra and cross-spectra were averaged within the fit bounds based on the central Doppler shift and spectral width determined. This makes the assumption that all points within the fit Doppler spectra for a given range are originating from the same point. It is expected that the points in the spectra are typically originating from a similar region, but the AOD could vary slightly with changing Doppler frequency. Due to the significant and similar amount of refraction that will be experienced at the different Doppler shifts for the same range, we decided that the reduction in fine scale AOD determination was worthwhile to reduce the occurrence of erroneous AOD determination. Future implementation of MIMO capabilities with multiple receive antennas will greatly reduce the occurrence of sidelobe selection in the interferometry analysis.
To further filter the self-clutter occurrences after the initial filtering of the signal described in Section 3.2, Section 3.3 conditions were implemented. These three conditions and the order of implementation were:
1. SNR
2. Removal of signals with Doppler frequencies divisible by 100 Hz when scatter present at -500 Hz (clutter repeats due to repeated code in decoding analysis)
3. Removal of times with scatter at ranges
The spectra were then fit with a Gaussian distribution to obtain a peak-SNR, Doppler shift, and spectral width value for each range with data. The cross-spectra and spectra were averaged within the bounds based on this fit, and the AOD were determined from these averaged values. The data available for each range for a 2 s scan were then: peak-SNR, Doppler shift, spectral width, total propagation distance, azimuth, and elevation.
There was an extended period of active magnetospheric and ionospheric activity on 27 August 2021. The Kp index (Matzka et al., 2021b) for this day is presented in Figure 4. From the Kp index data it can be seen that there was a relatively enhanced geomagnetic activity level from ∼ 9:00 UT to 24:00 UT. The data analyzed with the SIMONe Norway System spans the time of 16:30-20:00 UT.
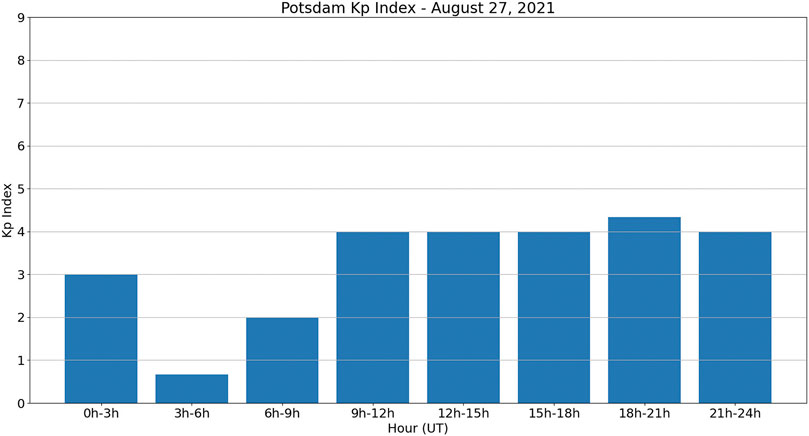
FIGURE 4. The Potsdam Kp index is shown for the day of 27 August 2021. This shows that there were elevated geomagnetic activity levels for an extended period during the SIMONe Norway measurements during the time period of 16:30-20:00 UT.
Some local ionospheric measurements and characterization parameters from different instruments are presented in Figure 5, providing an overview of the ionospheric activity in the region. The ionosonde and partial reflection radars (PRR) (Singer et al., 2008) measurements show that there were highly ionized E-region plasma layers occurring in the auroral zone at a magnetic latitude of ∼ 66°.
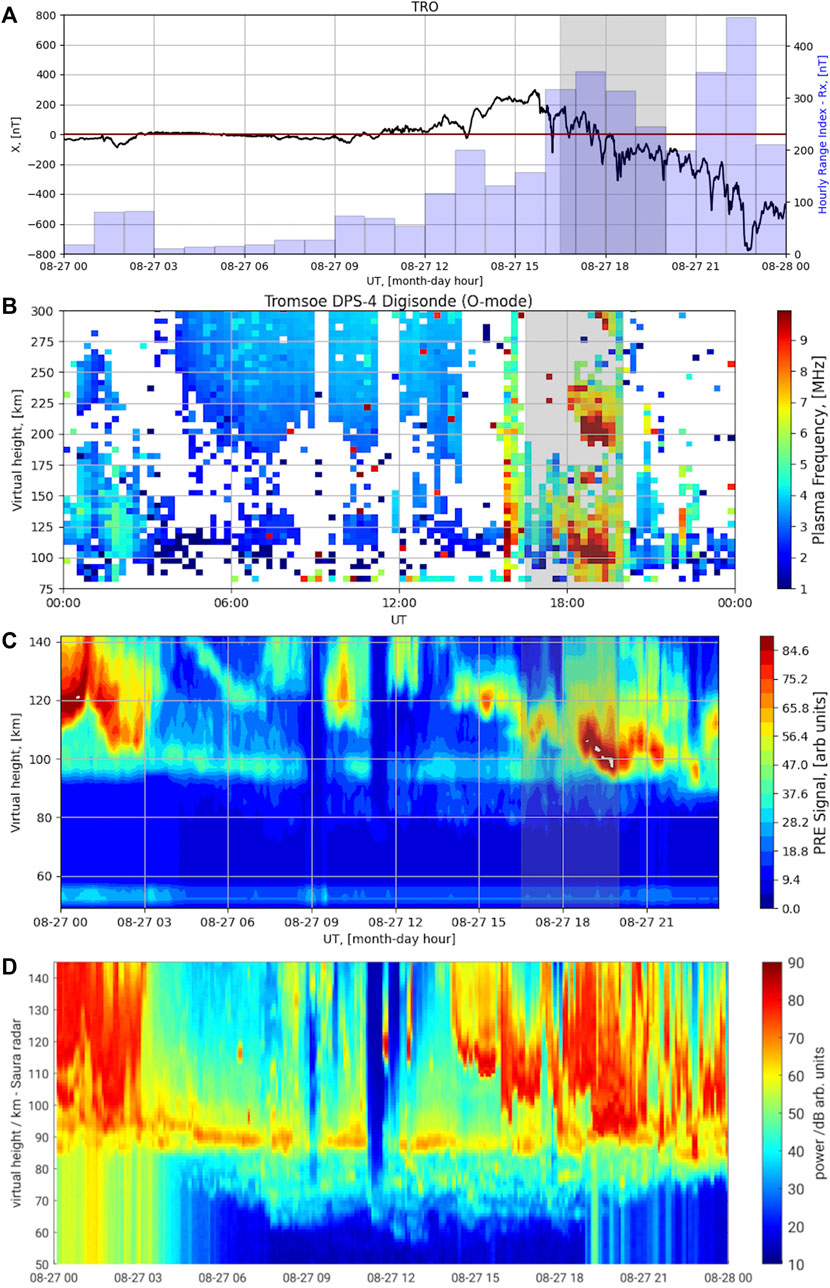
FIGURE 5. The (A) panel shows the X (Geographic North) magnetic field component from the Tromsø magnetic observatory as well as the corresponding hourly range index (Rx), where strong magnetic field fluctuations corresponding to an active geomagnetic period are presented. The times highlighted in grey correspond to the period of data analyzed with the SIMONe Norway system (16:30-20:00 UT). The (B) panel provides measurements from the ionosonde located at Tromsø every 15 min, showing further evidence of a very ionized E-region ionosphere. The (C,D) panel show measurements from the Tromsø (2.78 MHz) and Saura (3.17 MHz) partial reflection radars, also showing evidence of highly ionized E-region plasma layers during the evening hours.
Consistently, the Tromsø magnetometer started to detect unsettled conditions from around 12:00 UT and stormy conditions from about 16:00 UT, peaking at 22:30 UT with an excursion of nearly 800 nT in the X component. In Renkwitz and Latteck (2017) it was found that most of the particle precipitation events for the location of Saura radar are observed for the Kp indices of 2–4 to be within the precipitation zone. The Saura PRR on Andøya observed several energetic particle precipitation events during the time period of 16:30-20:00 UT. Noteworthy, the observed precipitation reaches altitudes of 65 km (bottom panel of Figure 5), revealing very high particle energies. This does not exclude additional energy deposition at higher altitudes at these times since the precipitation is not monoenergetic, but a spectrum of different energies. Due to the associated measurements from these instruments, it is expected that the ionized layers are caused by consistent, energetic, charged particle precipitation creating a persistent ionized region at ∼ 100 km. An alternative, or potentially coincident, explanation for these enhanced layers is that enhanced ionospheric electric fields are generating highly ionized sporadic E-layers (e.g., Nygrén et al., 1984).
While the measurements shown in Figure 5 are not necessarily coincident with SIMONe measurements, it is clear that significant ionization of the E-region ionosphere occurred during this period. Furthermore, the similarity between measurements performed at Saura and Ramfjordmoen, 130 km apart, suggests a large scale event with broad spatial coverage. With the large amounts of ionization in the E-region ionosphere it is expected that the 32.55 MHz meteor radar signal will undergo at least some refraction in this environment.
A summary of the SIMONe E-region results from the signal processing of the multi-static links is provided in Figure 6. It will be shown that it is possible to isolate the multiple RF propagation modes through the spectral and interferometric analysis. Figure 6 provides a summary of the data without the filters mentioned in Section 3.3 implemented. There is a reduction in data compared to when the filters are applied (not shown here), but it is important to have a reasonably clean data set to analyze.
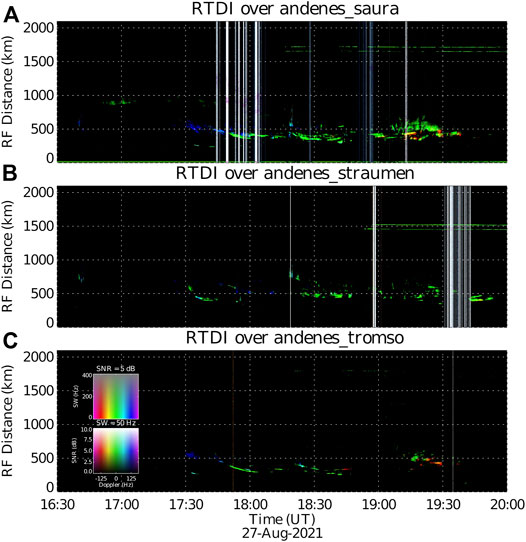
FIGURE 6. Summary plots of the processed SIMONe Norway data displaying the Doppler shift, spectral width, and SNR of the measurements in a range-time-Doppler-intensity (RTDI) format. These plots do not include the filters mentioned in Section 3.3. The (A) panel provides the Andenes to Saura bistatic link, the (B) panel provides the Andenes to Straumen link, and the (C) panel provides the Andenes to Tromsø link. The locations of the sites were provided in Figure 1, where it can be seen that the Andenes to Saura link is close to monostatic. For this reason the direct feedthrough can be seen in the (A) panel summary plot at near ranges. Without the filters there are periods of significant self-clutter that can be seen in the plots. There is clear evidence of ionospheric scatter at ranges of 200–1000 km and over-the-horizon (OTH) propagation at ranges
In Figure 6 note that the Doppler frequency is used and not the Doppler velocity. Depending on the location of the scatter for the bistatic links the conversion from Doppler frequency to Doppler velocity can vary. This is described by the equation vph = λrfdop/(2 cos (θ/2)), where vph is the phase velocity of the plasma irregularities, λr is the radar wavelength, fdop is the Doppler shift in frequency and θ is the angle between the two vectors connecting the receiver and transmitter to the scattering volume (e.g., Haldoupis and Schlegel, 1993). It should also be noted that the plasma density irregularity characteristic wavelength will vary by this same factor, where for a monostatic system at 32.55 MHz the plasma density irregularity wavelength that is being scattered from is ∼ 4.6 m.
The data analyzed spans an interval of 3.5 h from 16:30-20:00 UT on 27-08-2021. All three links observe meteor echoes and ionospheric scatter in the data. The three links also observe scatter coming from a consistent range
To further investigate the data, the Doppler shift and corresponding altitude of the scattered signal for each of the links were determined and are provided in Figure 7. The data with Doppler shifts greater than 10 Hz and less than −10 Hz at altitudes
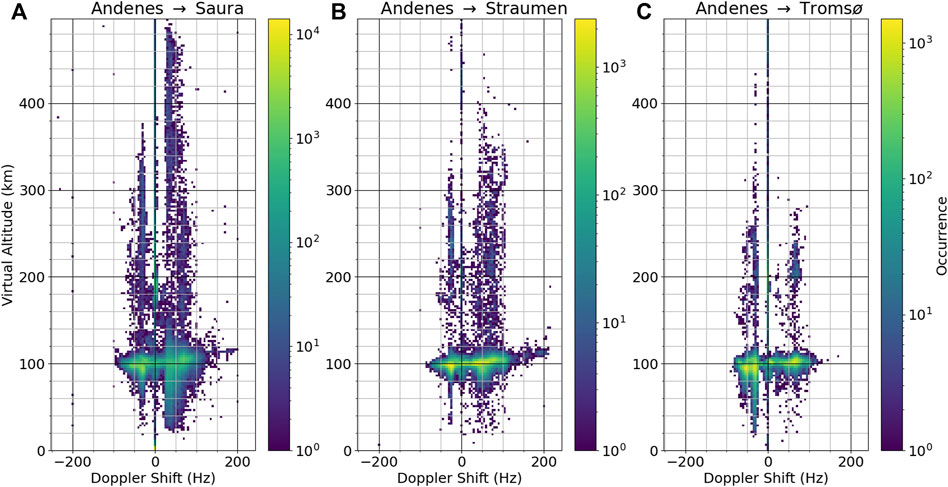
FIGURE 7. Figures of the mapped altitude of the SIMONe Norway measurements with respect to the Doppler shift for each of the three bistatic radar links. A large portion of the scatter originates from ∼ 100 km, as would be expected for E-region coherent scatter and meteor trail measurements.
What is evident in the altitude data is that a significant portion is mapped to E-region altitudes with Doppler shifts corresponding to ionospheric scatter. There is also an increase in the scatter at 0 Hz at an altitude of ∼ 200 km. This corresponds to approximately double the altitude of the E-region, and would be expected of ground and/or sea scatter where the radar signal is refracted back to the Earth from a highly ionized E-region plasma layer. The consistently narrow spectral width of this population is typical for sea/ground radar scatter. Meteors are also evident in the summary plot data (∼ 100 km), though are combined with the E-region ionospheric scatter distribution with Doppler shifts of ∼ 0 Hz in Figure 7.
From the altitude and associated spectra characteristics of the scatter different propagation modes can be isolated. The different propagation modes that can be identified in the data include:
1. Meteors
2. I. Direct TX-RX link
3. II. OTH TX-RX link
4. III. OTH ground/sea scatter
5. IV. Ionospheric scatter
Note that some of the links do not contain all the propagation modes, specifically the direct TX-RX link is not observed with in the Andenes-Straumen and Andenes-Tromsø data.
The capabilities of the SIMONe systems to measure meteors have been well demonstrated in previous publications (e.g., Vierinen et al., 2019; Chau et al., 2021), and therefore will not be further investigated here. The other four propagation modes listed are further described below in the associated subsections.
The direct path signal is at ∼ the sixth range gate (18 km). This signal is consistently removed with the self-clutter reduction algorithm without issue. The distance matches with what is expected for direct path from the transmitter to receiver for the Andenes-Saura link. This is seen during all periods of operation for the system.
The direct path propagation mode is searched for in the self-clutter reduction algorithm for the Andenes-Tromsø and Andenes-Straumen links but is not present. This is not unexpected due to the much larger distance between the sites compared to the Andenes-Saura link.
Due to the lack of interaction with the ionosphere for this direct TX-RX link, the other propagation modes for the VHF signal are focused on.
Another detected signal that appeared as direct feed through in the data occurred at total propagation distances
Interferometric analyses of the signals were performed to investigate how and where the OTH propagation was occurring. It was found that the signal was likely refracting from the E-region ionosphere, showing that there was significant ionospheric plasma density at geomagnetic latitudes of ∼ 58.5° (geographic latitudes of ∼ 62°). Figure 8 provides the geographic coordinates of the signal and a histogram of the altitude for each OTH link. It is clear that the majority of the data is mapped to an altitude between 90 and 200 km and occurs between the sites, as expected.
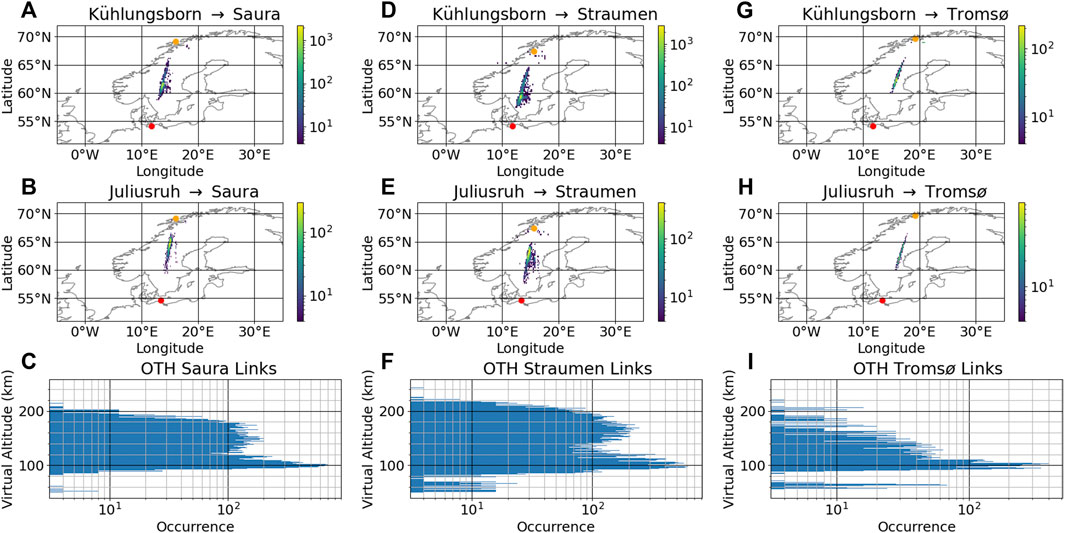
FIGURE 8. Geographic location and altitude data are presented for the 19:00-20:00 UT time period, identified by the expected total radar signal propagation distance for each of the bistatic links. The time interval of 19:00-20:00 UT included the most persistent OTH link between the sites located in Germany and the sites located in Norway. The transmitter is shown in red and the receiver is shown in orange. The small number of echoes mapped to 60 km altitude could be due to sidelobe selection in the AOD determination.
The amount of E-region plasma density required for OTH propagation at 32.55 MHz is on the order of ∼ 1× 10¹²/m3. While this is a large plasma density for the evening E-region ionosphere, plasma densities of this amount are not necessarily uncommon during active geomagnetic periods. An example of another VHF meteor radar detecting significant refraction of the signal is provided by Kozlovsky and Lester (2015). This radar operated at ∼ 37 MHz and was located in Sodankylä, Finland, a similar latitude as the SIMONe Norway system. Also, from the ionosonde and Saura PRR data presented in Figure 5, we know that there were occurrences of particle precipitation penetrating to at least E-region altitudes.
Future work will include the analysis of the modulation of this OTH signal to detect variations in the E-region plasma - similar to what was performed with the Sodankylä radar. The benefit of performing this analysis with the SIMONe Norway system is that a source of ambiguity is removed from the analysis, specifically ground variations affecting the measured signal. Unsurprisingly, the SIMONe Norway system was also able to detect groundscatter measurements during this period of active ionospheric activity, which are explored next.
The occurrence of groundscatter is common in HF signals (e.g., Basu et al., 1973; Greenwald et al., 1995), and has been shown to be present in VHF radar signals (e.g., Kozlovsky and Lester, 2015; Kozlovsky et al., 2019). The capabilities of the SIMONe system are highlighted by its ability to detect groundscatter and perform interferometry on the signal simultaneously while measuring many different propagation modes and determining the details of the spectra for each link. We clearly saw OTH propagation of the signals from SIMONe Germany to SIMONe Norway, so there was obviously sufficient electron density at E-region altitudes for refraction of the VHF signal back to the surface of the Earth.
The altitude of SIMONe Norway measurements with a Doppler shift within ±10 Hz were investigated to determine if groundscatter measurements were detected in the data. The histogram distributions are provided in Figure 9. A peak in altitude at ∼ 200 km is evident, the altitude at which ground/sea-scatter would be mapped to if the signal was refracting from the E-region (∼ 100 km) back to the Earth. This was seen in all three links, though less so in the Andenes to Straumen data. Of course, with large distances between the receiver and transmitter, the geometry for ground and sea scatter is more complicated. With bistatic measurements, refraction of the radar signal from the E-region back to the Earth will occur in two different locations for groundscatter to be measured. VHF signals require large plasma densities for refraction to occur and therefore it is expected that there will be less instances of ground and sea scatter measured for the bistatic radar links with large distances between the transmitter and receiver. The surface also has to be conducive to scattering or reflecting the signal towards the receiver, which will be more likely with certain geometries.
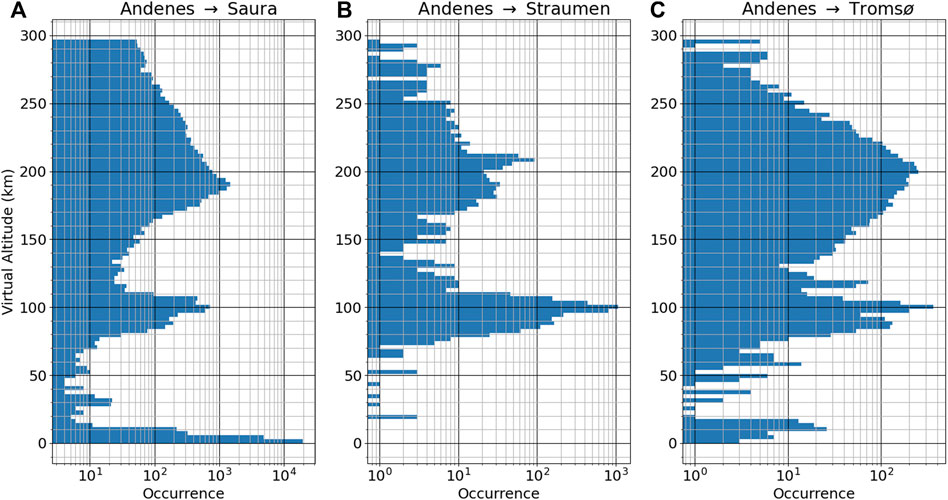
FIGURE 9. Altitude histograms of the different bistatic SIMONe Norway links for data with Doppler shifts within ±10 Hz. The measurements between 0 and 20 km altitude are expected to be due to direct transmitter to receiver propagation and tropospheric scattering of the radar signal. The measurements at ∼ 100 km are expected to be from meteors and ionospheric scatter.
The ground/sea scatter does create difficulties in using the self-clutter removal algorithm described in Section 3.2. There are many instances where signals will be coming from different enough directions at the same range and Doppler shift to cause issues in determining the correct phase of the signal during the self-clutter removal. In Figure 6 there are clear occurrences where the clutter removal for the data fails, commonly due to this issue with removing self-clutter from the ground/sea scatter. The ground/sea scatter typically occurs between 700 and 1500 km, depending on the bistatic link, and is relatively faint in Figure 6.
Due to the geometry of the SIMONe Norway system multistatic links with respect to the geomagnetic field, instances of E-region coherent scatter were unexpected in the data. From Figure 6, Figure 7, there are undeniably occurrences of E-region coherent scatter. With the evidence of significant amounts of refraction of the 32.55 MHz signal, it is therefore expected that the radar signal refracts enough to be perpendicular to the geomagnetic field. In regions where the signal is perpendicular to the geomagnetic field and sufficient plasma turbulence is occurring, we are therefore able to detect E-region coherent scatter with the SIMONe Norway system.
Figure 10 presents a zoomed in version of Figure 6, highlighting the ionospheric scatter measured by the SIMONe Norway system. This figure includes all the filters mentioned in Section 3.3. The times when the self-clutter removal algorithm failed and the data had to removed are shown by the vertical stripes of missing data. While the different links measure similar directions of the scatter at similar times, there is clearly many differences in the measurements between the different bistatic links. Only a preliminary analysis of the ionospheric scatter is provided in this section to highlight the capability of the system, with further analysis of the spectral characteristics and structure of the scatter to be investigated in the future.
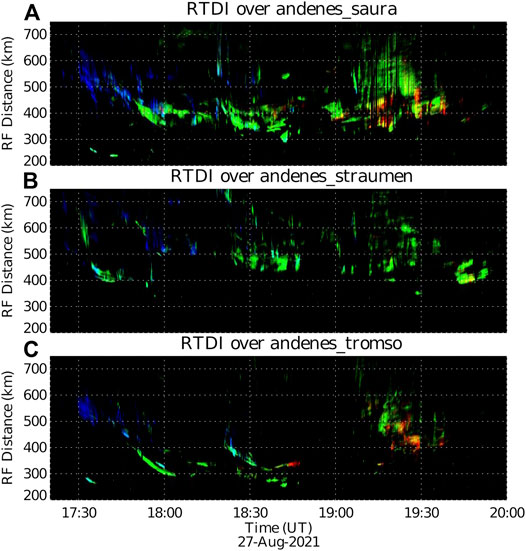
FIGURE 10. A zoomed in version of Figure 6, which highlights the ionospheric scatter measured. The filters mentioned in Section 3.3 were used for this figure. The color scale of the figure follows the scale provided with Figure 6.
Most of the scatter is expected to be from the E-region ionosphere, though the interferometry analysis (Figure 7) shows there are also potential instances of F-region coherent scatter (altitudes of 150–500 km). While F-region coherent scatter is potentially possible with the amount of refraction occurring, due to the current ambiguities in the AOD determination the E-region coherent scatter is focused on.
Figure 11 provides details of the location of the scattered signals and the aspect angle conditions with respect to the geomagnetic field assuming straight line propagation. The ideal aspect conditions occur to the north of the radar links, where the signal is
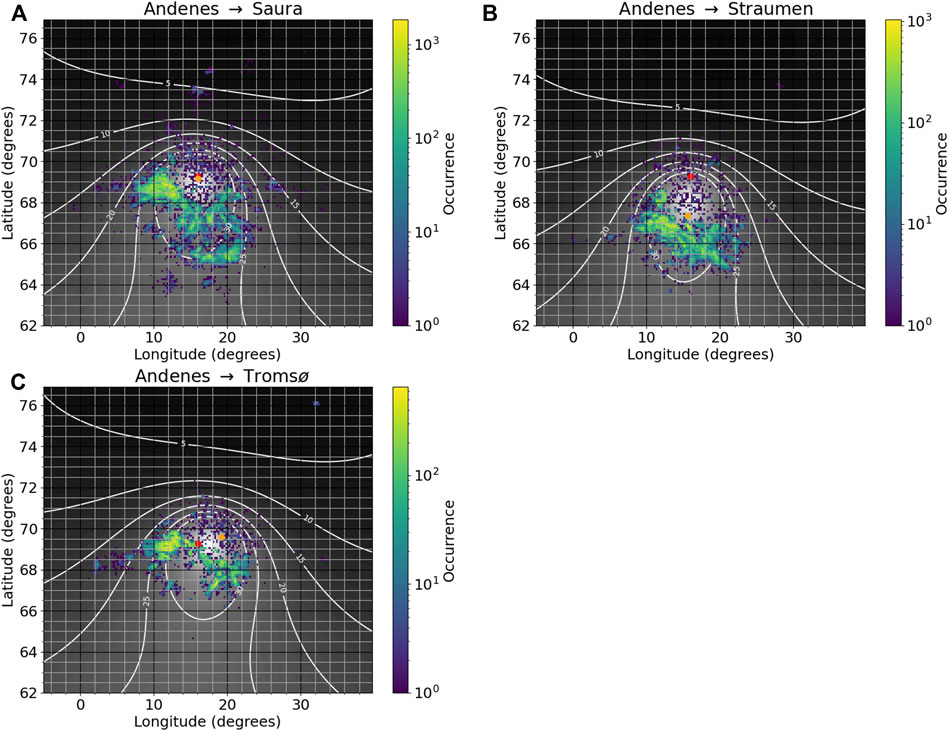
FIGURE 11. Geographic location of the measurements between altitudes of 50–150 km for each of the SIMONe Norway system links. The background greyscale contours show the magnetic aspect angle in degrees at 110 km altitude, with 0° being where the radar signal is perpendicular to the geomagnetic field assuming straight line propagation. The transmitter is shown in red and the receiver is shown in orange.
Most of the scatter is observed south of the radars, which could be a result of the propagation of the signals with respect to the geometry of the geomagnetic field associated with a significant amount of refraction. Interestingly, the locations of the scatter for the three links are slightly different. This could correspond to refraction of the radar signals for each link. Significant refraction for a 32.55 MHz signal requires large plasma densities on the order of ∼ 1× 10¹²/m3, so there is likely energetic charged particle precipitation occurring in the region creating an enhanced plasma density layer. It is expected that plasma densities of this magnitude are relatively localized in spatial extent and do not persist without an ionization source due to the relatively high recombination rate of the E-region ionosphere. This ionization source can be realized through energetic charged particle precipitation or also through large electric fields creating enhanced plasma density layers at E-region altitudes (e.g., Nygrén et al., 1984).
The location of the majority of the radar measurements corresponds to relatively large aspect angles (
Histograms of the Doppler shift and the spectral width of the measurements have also been provided in Figure 12. The Doppler shift of the data has been converted to velocity based on the location of the signal scattering region. Something that should be noted is that a significant portion of the coherent scatter has a Doppler shift that is lower than the expected ion-acoustic speed of the ionospheric E-region plasma. For plasma turbulence at these phase speeds with small spectral widths there have been a few different hypotheses used to explain their occurrence, such as plasma gradients (St.-Maurice et al., 1994) and “Modulated Electron Ohmic Heating by Waves” (MEOHW) (St.-Maurice and Chau, 2016).
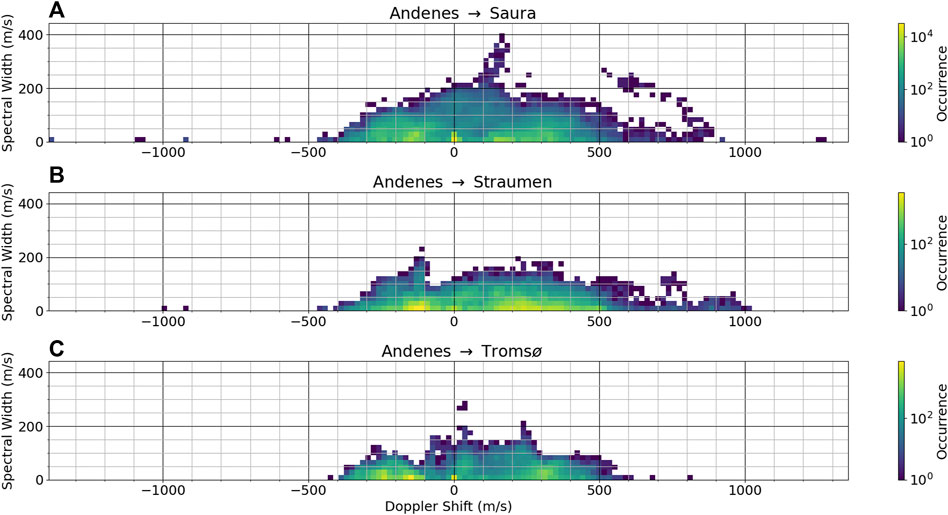
FIGURE 12. Histogram plots comparing the Doppler shift of the signal with the spectral width for each of the multi-static links. The Doppler velocity is determined for the location of the scatter based on the radar bisector angle.
The scatter with larger spectral widths and Doppler shifts less than the expected ion-acoustic speed have been described as being due to the radar observing plasma turbulence at angles off parallel with the electron velocity (e.g., Hysell et al., 2012). Empirical formulas were used by Hysell et al. (2012) to derive plasma convection from the mean Doppler shift and spectral width. These results compared favorably with the plasma flows derived from the Poker Flat Incoherent Scatter Radar (PFISR). The empirical electric field determination using E-region coherent scatter will not be investigated in this manuscript, but could be a future direction of study with the SIMONe Norway system measurements.
Due to the amount of refraction occurring for the VHF signal, it is difficult to use the altitude of the scatter to investigate the different hypotheses for the narrow and relatively slow spectra, where the MEOHW mechanism requires altitudes of
Though the radar signal experienced refraction, it should be noted that Figure 7 in Section 4 does show some interesting trends with respect to the altitude and Doppler shift of the scatter. Specifically, there is an increase in altitude with increasing Doppler shift in the E-region, though the number of measurements is small for large Doppler shifts. The E-region coherent scatter with relatively large Doppler velocities and narrow spectral widths is known as “Type IV” E-region coherent scatter (e.g., Providakes et al., 1988). The higher altitude corresponding to these measurements agrees with the notion that the E-region spectra with large Doppler shifts are in the reference frame of the ions, presented by St.-Maurice and Chau (2016). As the altitude increases the component of the ion motion in the E×B direction also increases, resulting in an increase in the required electron velocity for plasma turbulence to occur from the Farley-Buneman, or modified two-stream, plasma instability mechanism (Buneman, 1963; Farley, 1963).
The other interesting trend in Figure 7 is that scatter in the range of ±25–75 Hz is sometimes mapped to very low altitudes. It is highly unlikely that any measurements of coherent scatter would be made at 25 km altitude with the SIMONe radar system, but this trend of low altitude determination is not persistent across all Doppler shift values. The fact that this occurs only for these Doppler shifts will be further investigated in the future. It is possible that this scatter does occur in the lower E-region and potentially even D-region ionosphere, albeit not at some of the altitudes that the figures show.
Clear evidence of over-the horizon propagation for 32.55 MHz signals is shown during active geomagnetic conditions. The refraction of these VHF signals allows the SIMONe Norway system to make measurements of E-region coherent scatter at what would appear to be large aspect angles. These measurements are, in reality, likely close to perpendicular to the geomagnetic field. F-region coherent scatter measurements are also potentially present, as well as ground/sea scatter from E-region ionospheric plasma layers. The five VHF radar propagation modes detected are: meteor trail echoes, a direct TX-RX link, OTH TX-RX links, OTH groundscatter, and ionospheric scatter. Implementation of the described processing algorithms and the associated data products for automatic detection of these active ionospheric periods is currently underway.
Recent improvements to the system include using different codes for the Germany and Norway SIMONe systems to reduce cross-talk from OTH propoagation modes, and using longer code sequences to reduce the self-clutter, or self-interference, when analyzing the received signal. These are now operational for the SIMONe sites and are expected to result in significant improvements to the measurements during active ionospheric conditions.
The SIMONe Norway system is a great tool for investigations into terrestrial auroral dynamics using the interferometry and spectral details available from the measurements. Both neutral winds and plasma convection can be determined, including the potential capability to track highly ionized patches through ray tracing and associated ground scatter measurements. With the abundance of complimentary atmospheric instrumentation available in the vicinity of the SIMONe Norway field of view, including the future EISCAT 3D system McCrea et al. (2015), many interesting science questions involving the thermosphere-mesosphere region can be investigated in the coming years using the SIMONe Norway system measurements.
The SIMONe system datasets generated and analyzed for this study can be found in RADAR (Research Data Repository): (https://www.radar-service.eu/radar/en/dataset/kSIHsbVdmNVVAdCv?token=vXtqLNPDOsJeYFkdeQPI). The ionosonde data presented are available through GIRO (Global Ionosphere Radio Observatory) (https://giro.uml.edu/index.html), and the magnetometer data are available through the Tromsø Geophysical Observatory (https://flux.phys.uit.no/geomag.html) and through IMAGE (International Monitor for Auroral Geomagnetic Effects) (https://space.fmi.fi/image/www/). The Kp index data are available from Matzka et al. (2021a), listed in the References (https://doi.org/10.5880/Kp.0001).
DH performed the spectra and cross-spectra signal processing, outlined the manuscript, and wrote the first draft. MC performed the angle of departure analysis on the spectra and cross-spectra and mapped the coherent scatter. JC suggested investigating the auroral signatures in the SIMONe Norway data and contributed to the data analysis. TR provided discussions on different signal propagation modes measured and analyzed complementary data sets. RL setup the SIMONe Norway system and contributed to obtaining the raw complex voltage data. MJ provided data for and analyzed different complementary data sets in the vicinity of the SIMONe measurements. JV contributed to the signal processing software. All authors contributed to writing and editing the manuscript and creating the figures.
The development of SIMONe Norway was partially supported by the Deutsche Forschungsgemeinschaft (German Research Foundation) under SPP 1788 (CoSIP) project CH1482/3-1 (CS-PMSE-MIMO). Devin Huyghebaert was funded during this study through a UiT The Arctic University of Norway contribution to the EISCAT_3D project funded by Research Council of Norway through research infrastructure grant 245683.
The authors declare that the research was conducted in the absence of any commercial or financial relationships that could be construed as a potential conflict of interest.
All claims expressed in this article are solely those of the authors and do not necessarily represent those of their affiliated organizations, or those of the publisher, the editors and the reviewers. Any product that may be evaluated in this article, or claim that may be made by its manufacturer, is not guaranteed or endorsed by the publisher.
DH thanks the Leibniz Institute of Atmospheric Physics at the University of Rostock for hosting him as a visiting scientist during the development of this work.
Basu, S., Vesprini, R. L., and Aarons, J. (1973). Field-aligned ionospheric E-Region Irregularities and sporadicE. Radio Sci. 8, 235–246. doi:10.1029/RS008i003p00235
Bibl, K., and Reinisch, B. W. (1978). The Universal Digital Ionosonde. Radio Sci. 13, 519–530. doi:10.1029/RS013i003p00519
Buneman, O. (1963). Excitation of Field Aligned Sound Waves by Electron Streams. Phys. Rev. Lett. 10, 285–287. doi:10.1103/PhysRevLett.10.285
Chau, J. L., and St.‐Maurice, J. P. (2016). Unusual 5 M E Region Field‐aligned Irregularities Observed from Northern Germany during the Magnetic Storm of 17 March 2015. J. Geophys. Res. Space Phys. 121, 10,316–10,340. doi:10.1002/2016JA023104
Chau, J. L., Urco, J. M., Vierinen, J., Harding, B. J., Clahsen, M., Pfeffer, N., et al. (2021). Multistatic Specular Meteor Radar Network in Peru: System Description and Initial Results. Earth Space Sci. 8, e2020EA001293. doi:10.1029/2020EA001293
Chau, J. L., Urco, J. M., Vierinen, J. P., Volz, R. A., Clahsen, M., Pfeffer, N., et al. (2019). Novel Specular Meteor Radar Systems Using Coherent MIMO Techniques to Study the Mesosphere and Lower Thermosphere. Atmos. Meas. Tech. 12, 2113–2127. doi:10.5194/amt-12-2113-2019
Chisham, G., Lester, M., Milan, S. E., Freeman, M. P., Bristow, W. A., Grocott, A., et al. (2007). A Decade of the Super Dual Auroral Radar Network (SuperDARN): Scientific Achievements, New Techniques and Future Directions. Surv. Geophys. 28, 33–109. doi:10.1007/s10712-007-9017-8
Farley, D. T. (1963). A Plasma Instability Resulting in Field-Aligned Irregularities in the Ionosphere. J. Geophys. Res. 68, 6083–6097. doi:10.1029/jz068i022p06083
Fejer, B. G., and Kelley, M. C. (1980). Ionospheric Irregularities. Rev. Geophys. 18, 401–454. doi:10.1029/RG018i002p00401
Greenwald, R. A., Baker, K. B., Dudeney, J. R., Pinnock, M., Jones, T. B., Thomas, E. C., et al. (1995). DARN/SuperDARN. Space Sci. Rev. 71, 761–796. doi:10.1007/BF00751350
Haldoupis, C., Koehler, J. A., Sofko, G. J., Danskin, D. W., McKibben, M. J., and André, D. (1993). Preferential Phase Velocities for Type 4 Irregularities in the auroralEregion Plasma. J. Geophys. Res. 98, 6173–6179. doi:10.1029/92JA02652
Haldoupis, C., and Schlegel, K. (1993). A 50-MHz Radio Doppler experiment for midlatitudeEregion Coherent Backscatter Studies: System Description and First Results. Radio Sci. 28, 959–978. doi:10.1029/93RS01373
Hall, G., Moorcroft, D. R., Cogger, L. L., and Andre, D. (1990). Spatial Relationship between Large Aspect Angle VHF Radio aurora and 557.7-nm Emissions: Evidence for Refraction. J. Geophys. Res. 95, 15281–15288. doi:10.1029/JA095iA09p15281
Hall, G., and Moorcroft, D. R. (1992). Magnetic Aspect Angle Effects in Radar aurora at 48.5 MHz, Corrected for Refraction. J. Geophys. Res. 97, 19471–19488. doi:10.1029/92JA01547
Högbom, J. (1974). Aperture Synthesis with a Non-regular Distribution of Interferometer Baselines. Astron. Astrophysics Suppl. Ser. 15, 417.
Huyghebaert, D., Hussey, G., Vierinen, J., McWilliams, K., and St‐Maurice, J. P. (2019). ICEBEAR: An All‐Digital Bistatic Coded Continuous‐Wave Radar for Studies of the E Region of the Ionosphere. Radio Sci. 54, 349–364. doi:10.1029/2018RS006747
Huyghebaert, D., McWilliams, K., Hussey, G., Galeschuk, D., Chau, J. L., and Vierinen, J. (2021). Determination of the Azimuthal Extent of Coherent E-Region Scatter Using the ICEBEAR Linear Receiver Array. Radio Sci. 56, e2020RS007191. E2020RS007191 2020RS007191. doi:10.1029/2020RS007191
Hysell, D. L., Milla, M. A., and Vierinen, J. (2016). A Multistatic HF beacon Network for Ionospheric Specification in the Peruvian Sector. Radio Sci. 51, 392–401. doi:10.1002/2016RS005951
Hysell, D. L. (2015). The Radar Aurora. Hoboken, NJ: John Wiley & Sons, Inc., 191–209. chap. 14. doi:10.1002/9781118978719.ch14
Hysell, D., Miceli, R., Munk, J., Hampton, D., Heinselman, C., Nicolls, M., et al. (2012). Comparing VHF Coherent Scatter from the Radar aurora with Incoherent Scatter and All-Sky Auroral Imagery. J. Geophys. Res. 117, a–n. doi:10.1029/2012JA018010
Kozlovsky, A., and Lester, M. (2015). On the VHF Radar Echoes in the Region of Midnight aurora: Signs of Ground Echoes Modulated by the Ionosphere. J. Geophys. Res. Space Phys. 120, 2099–2109. doi:10.1002/2014JA020715
Kozlovsky, A., Shalimov, S., Oyama, S., Hosokawa, K., Lester, M., Ogawa, Y., et al. (2019). Ground Echoes Observed by the Meteor Radar and High‐Speed Auroral Observations in the Substorm Growth Phase. J. Geophys. Res. Space Phys. 124, 9278–9292. doi:10.1029/2019JA026829
Makarevich, R. A. (2009). Coherent Radar Measurements of the Doppler Velocity in the Auroral E Region. URSI Radio Sci. Bull. 2009, 33–46. doi:10.23919/URSIRSB.2009.7909539
[Dataset] Matzka, J., Bronkalla, O., Tornow, K., Elger, K., and Stolle, C. (2021a). Geomagnetic Kp index. V. 1.0. GFZ Data Services. doi:10.5880/Kp.0001
Matzka, J., Stolle, C., Yamazaki, Y., Bronkalla, O., and Morschhauser, A. (2021b). The Geomagnetic Kp index and Derived Indices of Geomagnetic Activity. Space Weather 19, e2020SW002641. E2020SW002641 2020SW002641. doi:10.1029/2020SW002641
McCrea, I., Aikio, A., Alfonsi, L., Belova, E., Buchert, S., Clilverd, M., et al. (2015). The Science Case for the EISCAT_3D Radar. Prog. Earth Planet. Sci. 2, 1–63. doi:10.1186/s40645-015-0051-8
Meyer, M. G., and Sahr, J. D. (2004). Passive Coherent Scatter Radar Interferometer Implementation, Observations, and Analysis. Radio Sci. 39, a–n. doi:10.1029/2003RS002985
Moorcroft, D. R. (2002). Outstanding Issues in the Theory of Radar aurora: Evidence from the Frequency Dependence of Spectral Characteristics. J. Geophys. Res. 107, SIA 13–19–SIA 13–21. doi:10.1029/2001JA009218
Moorcroft, D. R. (1989). Reflection and Refraction by Tilted Layers: An Explanation for VHF Auroral Backscatter at Large Aspect Angles. Geophys. Res. Lett. 16, 235–238. doi:10.1029/GL016i003p00235
Nishitani, N., Ruohoniemi, J. M., Lester, M., Baker, J. B. H., Koustov, A. V., Shepherd, S. G., et al. (2019). Review of the Accomplishments of Mid-latitude Super Dual Auroral Radar Network (SuperDARN) HF Radars. Prog. Earth Planet. Sci. 6, 1–57. doi:10.1186/s40645-019-0270-5
Nygrén, T., Jalonen, L., Oksman, J., and Turunen, T. (1984). The Role of Electric Field and Neutral Wind Direction in the Formation of Sporadic E-Layers. J. Atmos. Terrestrial Phys. 46, 373–381. doi:10.1016/0021-9169(84)90122-3
Providakes, J., Farley, D. T., Fejer, B. G., Sahr, J., Swartz, W. E., Häggström, I., et al. (1988). Observations of Auroral E-Region Plasma Waves and Electron Heating with EISCAT and a VHF Radar Interferometer. J. Atmos. Terrestrial Phys. 50, 339–356. EISCAT Science. doi:10.1016/0021-9169(88)90019-0
Renkwitz, T., and Latteck, R. (2017). Variability of Virtual Layered Phenomena in the Mesosphere Observed with Medium Frequency Radars at 69°N. J. Atmos. Solar-Terrestrial Phys. 163, 38–45. Long-term changes and trends in the upper atmosphere. doi:10.1016/j.jastp.2017.05.009
Roper, R. G., and Elford, W. G. (1963). Seasonal Variation of Turbulence in the Upper Atmosphere. Nature 197, 963–964. doi:10.1038/197963a0
Sahr, J. D., Farley, D. T., Swartz, W. E., and Providakes, J. F. (1991). The Altitude of Type 3 Auroral Irregularities: Radar Interferometer Observations and Implications. J. Geophys. Res. 96, 17805–17811. doi:10.1029/91JA01544
Sahr, J. D., and Fejer, B. G. (1996). Auroral Electrojet Plasma Irregularity Theory and experiment: A Critical Review of Present Understanding and Future Directions. J. Geophys. Res. 101, 26893–26909. doi:10.1029/96JA02404
Sen, H. K., and Wyller, A. A. (1960). On the Generalization of the Appleton-Hartree Magnetoionic Formulas. J. Geophys. Res. 65 (1896-1977), 3931–3950. doi:10.1029/JZ065i012p03931
Shepherd, S. G., Sterne, K. T., Thomas, E. G., Ruohoniemi, J. M., Baker, J. B. H., Parris, R. T., et al. (2020). Bistatic Observations with Superdarn HF Radars: First Results. Radio Sci. 55, e2020RS007121. E2020RS007121 10.1029/2020RS007121. doi:10.1029/2020RS007121
Singer, W., Latteck, R., and Holdsworth, D. A. (2008). A New Narrow Beam Doppler Radar at 3MHz for Studies of the High-Latitude Middle Atmosphere. Adv. Space Res. 41, 1488–1494. doi:10.1016/j.asr.2007.10.006
St.-Maurice, J.-P., Prikryl, P., Danskin, D. W., Hamza, A. M., Sofko, G. J., Koehler, J. A., et al. (1994). On the Origin of Narrow Non-ion-acoustic Coherent Radar Spectra in the High-latitudeEregion. J. Geophys. Res. 99, 6447–6474. doi:10.1029/93JA02353
Stober, G., and Chau, J. L. (2015). A Multistatic and Multifrequency Novel Approach for Specular Meteor Radars to Improve Wind Measurements in the MLT Region. Radio Sci. 50, 431–442. doi:10.1002/2014RS005591
St.‐Maurice, J. P., and Chau, J. L. (2016). A Theoretical Framework for the Changing Spectral Properties of Meter‐scale Farley‐Buneman Waves between 90 and 125 Km Altitudes. J. Geophys. Res. Space Phys. 121, 10,341–10,366. doi:10.1002/2016JA023105
Sugar, G. R. (1964). Radio Propagation by Reflection from Meteor Trails. Proc. IEEE 52, 116–136. doi:10.1109/PROC.1964.2801
Urco, J. M., Chau, J. L., Weber, T., Vierinen, J. P., and Volz, R. (2019). Sparse Signal Recovery in MIMO Specular Meteor Radars with Waveform Diversity. IEEE Trans. Geosci. Remote Sensing 57, 10088–10098. doi:10.1109/TGRS.2019.2931375
Uspensky, M. V., Williams, P. J. S., Romanov, V. I., Pivovarov, V. G., Sofko, G. J., and Koehler, J. A. (1994). Auroral Radar Backscatter at Off-Perpendicular Aspect Angles Due to Enhanced Ionospheric Refraction. J. Geophys. Res. 99, 17503–17509. doi:10.1029/94JA00925
Vierinen, J., Chau, J. L., Charuvil, H., Urco, J. M., Clahsen, M., Avsarkisov, V., et al. (2019). Observing Mesospheric Turbulence with Specular Meteor Radars: A Novel Method for Estimating Second‐Order Statistics of Wind Velocity. Earth Space Sci. 6, 1171–1195. doi:10.1029/2019EA000570
Keywords: E-region coherent scatter, VHF radio propagation, ionospheric plasma turbulence, auroral particle precipitation, ionospheric radar, over the horizon radar
Citation: Huyghebaert D, Clahsen M, Chau JL, Renkwitz T, Latteck R, Johnsen MG and Vierinen J (2022) Multiple E-Region Radar Propagation Modes Measured by the VHF SIMONe Norway System During Active Ionospheric Conditions. Front. Astron. Space Sci. 9:886037. doi: 10.3389/fspas.2022.886037
Received: 28 February 2022; Accepted: 01 April 2022;
Published: 10 May 2022.
Edited by:
Daniel Okoh, National Space Research and Development Agency, NigeriaReviewed by:
Sampad Kumar Panda, KL University, IndiaCopyright © 2022 Huyghebaert, Clahsen, Chau, Renkwitz, Latteck, Johnsen and Vierinen. This is an open-access article distributed under the terms of the Creative Commons Attribution License (CC BY). The use, distribution or reproduction in other forums is permitted, provided the original author(s) and the copyright owner(s) are credited and that the original publication in this journal is cited, in accordance with accepted academic practice. No use, distribution or reproduction is permitted which does not comply with these terms.
*Correspondence: Devin Huyghebaert, ZGV2aW4uci5odXlnaGViYWVydEB1aXQubm8=
Disclaimer: All claims expressed in this article are solely those of the authors and do not necessarily represent those of their affiliated organizations, or those of the publisher, the editors and the reviewers. Any product that may be evaluated in this article or claim that may be made by its manufacturer is not guaranteed or endorsed by the publisher.
Research integrity at Frontiers

Learn more about the work of our research integrity team to safeguard the quality of each article we publish.