 Artem Smirnov1,2*
 Yuri Shprits1,2,3
 Hayley Allison1Nikita Aseev1
 Alexander Drozdov3Peter Kollmann4
 Dedong Wang1Anthony A. Saikin3
- 1Helmholtz Centre Potsdam - GFZ German Research Centre for Geosciences, Potsdam, Germany
- 2Institute of Physics and Astronomy, University of Potsdam, Potsdam, Germany
- 3Department of Earth, Planetary and Space Sciences, University of California, Los Angeles, Los Angeles, CA, United States
- 4Applied Physics Laboratory, Johns Hopkins University, Laurel, MD, United States
In this study we analyze the storm-time evolution of equatorial electron pitch angle distributions (PADs) in the outer radiation belt region using observations from the Magnetic Electron Ion Spectrometer (MagEIS) instrument aboard the Van Allen Probes in 2012–2019. The PADs are approximated using a sum of the first, third and fifth sine harmonics. Different combinations of the respective coefficients refer to the main PAD shapes within the outer radiation belt, namely the pancake, flat-top, butterfly and cap PADs. We conduct a superposed epoch analysis of 129 geomagnetic storms and analyze the PAD evolution for day and night MLT sectors. PAD shapes exhibit a strong energy-dependent response. At energies of tens of keV, the PADs exhibit little variation throughout geomagnetic storms. Cap PADs are mainly observed at energies
1 Introduction
The radiation belts of the Earth contain charged energetic particles, mainly electrons and protons, trapped by the geomagnetic field. The energetic electrons are primarily observed in two regions, namely the inner (L
There are several common types of pitch angle distributions in the radiation belt region. The so-called pancake, or normal, PADs have a maximum flux at 90° pitch angle (PA) with a smooth decrease in flux towards the loss cone (e.g., West et al., 1973). The pancake PADs can be formed as a result of the particle PA diffusion, inward radial diffusion, as well as wave-particle interactions (e.g., with hiss and chorus waves in the outer belt (Su et al., 2009; Meredith et al., 2000)), and consititute the most dominant PAD type in the inner magnetosphere on the dayside (Gannon et al., 2007). The PADs where electron flux at 90° is smaller than at intermediate pitch angles (∼ 30°–75°) are called the butterfly distributions (West et al., 1973). The butterfly PADs in the outer radiation belt are mainly present at nightside magnetic local times (MLTs) and form due to drift shell splitting (Roederer, 1967; Sibeck et al., 1987), magnetopause shadowing (West et al., 1973) and wave activity (Artemyev et al., 2015; Ni et al., 2020). The flat-top PADs exhibit a relatively constant flux at a wide range of pitch angles around 90°. The flat-top PADs can be a transition phase between the butterfly and pancake PADs, and they also occur due to strong wave-particle interactions with whistler mode waves in regions of low electron densities (Horne et al., 2003). The head-and-shoulders, or cap, distributions resemble pancake PADs for non-equatorially mirroring electrons but have an additional bump in flux around 90° PA; they generally result from resonant interactions with the plasmaspheric hiss waves (Lyons et al., 1972). Wave-particle interactions with ultra low frequency (ULF) waves, particularly in the Pc4-Pc5 range, are known to also affect the electron pitch angle distributions (Zong et al., 2017). For instance, during the drift resonance events electron flux oscillations around 90° are observed faster than at lower PAs, which leads to the formation of the so-called boomerang stripes in the pitch angle distributions (e.g., Hao et al., 2017; Zhao et al., 2020).
Pitch angle distributions can be approximated using different trigonometric functions. The standard formulation used in several previous studies includes fitting PADs to the sinnα, where α is the particle pitch angle and n is the steepness of the distribution (see e.g., Vampola, 1998; Gannon et al., 2007, etc.). This parametrisation, however, has several limitations. For instance, it fails to capture butterfly distributions which constitute the dominant PAD shape on the nightside at L
Several studies have investigated the morphology of electron pitch angle distributions in the inner magnetosphere, both during quiet and geomagnetically active times. Roederer (1967) analyzed effects of the drift shell splitting on energetic electrons in the model magnetosphere and demonstrated that the drift shell splitting effects could only be observed above L = 5. The spatial structure of 80 keV–2.8 MeV electron PADs was described by West et al. (1973) using Ogo-5 satellite data. The dayside PADs were found to exhibit mainly pancake shape, while the nightside distributions at L > ∼ 6 showed butterfly shapes, which were attributed to a combination of the drift shell splitting in presence of a negative flux gradient in L, and magnetopause shadowing. Selesnick and Blake (2002) computed anisotropies of relativistic electron PADs by tracing drift paths of particles for different pitch angles and levels of Kp and found a good agreement with average flux anisotropies calculated from Polar electron data under quiet geomagnetic conditions. Lyons et al. (1972) was one of the first papers that computed the PA-diffusion of electrons at energies 20 keV–2 MeV driven by the resonant interactions with whisler mode waves and showed the existence of the cap pitch angle distributions could be attributed to the resonant interactions with the plasmaspheric hiss waves. Furthermore, it was demonstrated that with increasing energy, the bump in flux at 90° PA, characteristic of the cap PADs, decreased in magnitude as the cyclotron resonance branch extended to higher pitch angles at higher energies. Lyons and Williams (1975a) analyzed the quiet-time structure of electron PADs at energies below 560 keV and observed a generally good agreement in PAD shapes with the theoretical predictions by Lyons et al. (1972). Furthermore, Lyons and Williams (1975b) reported that the storm-time electron PADs were very different from those during quiet times. In particular, the quiet-time cap distributions on the nightside were found to transform into the pancake PADs and then reform to their pre-storm structure several days after the storm. A comprehensive study by Gannon et al. (2007) analyzed electron PADs at energies of hundreds of keV based on data from Medium Electrons A instrument aboard the Combined release and Radiation Effects Satellite (CRRES). They reported that butterfly pitch angle distributions were the most prevalent type on the nightside at high L-shells, whereas on the dayside the pancake PADs constituted the dominant PAD shape.
In recent years, several statistical studies analyzed the storm-time evolution of electron PADs using data from the Van Allen Probes constellation. Ni et al. (2015) used 15 months of the Relativistic Electron Proton Telescope (REPT) data to investigate the variability of PADs of electrons with energies
The previous studies that used Van Allen Probes data for analyzing the pitch angle distributions have mainly concentrated on relativistic and ultra relativistic energies sampled by the REPT instrument. Observations by the Magnetic Electron Ion Spectrometer (MagEIS) have been used in several recent studies (e.g., Shi et al., 2016; Allison et al., 2018; Zhao et al., 2018) which aimed at creating statistical PAD models but did not investigate PAD evolution for different phases of geomagnetic storms. In this study, we perform, for the first time, a comprehensive statistical analysis of electron PADs sampled by the MagEIS detector at energies 30 keV–1.6 MeV. Furthermore, our study is the first one to use the Van Allen Probe dataset during the mission’s entire lifespan in 2012–2019 for PAD analysis. We identify 129 storms in 2012–2019, and examine the morphology of the normalized PAD shapes for day and night MLTs at different energies.
Storm-time evolution of omnidirectional electron fluxes has been analyzed in detail in Turner et al. (2019) for both MagEIS and REPT energies. In this study, we concentrate on the PAD shapes normalized from 0 to 1. It should be noted that in the inner belt, pitch angle distributions appear relatively independent of activity (e.g., Ni et al., 2016) and exhibit very steep shapes due to larger loss cones which require higher harmonics for modeling (Zhao et al., 2018), therefore, in the present study we analyze PADs for L-values from 3 to 6. The paper consists of 5 parts. Section 2 describes the data set and the methodology employed in this study. In Section 3, we analyze the storm-time PAD evolution by means of the superposed epoch analysis of 129 storms during the Van Allen Probes era. The results are discussed in Section 4, and the conclusions are drawn in the final section.
2 Dataset and Methodology
2.1 Data
The Van Allen Probes mission, originally known as the Radiation Belt Storm Probes (RBSP), operated in 2012–2019 and consisted of two spacecraft, denoted as RBSP-A and RBSP-B, flying in a near-equatorial orbit with an inclination of 10.2° (Mauk et al., 2012). The apogee of the probes was at ∼5.8 RE and perigee at an altitude of ∼620 km. The orbital period was equal to 9 h. The full MLT revolution was achieved every ∼22 months. The L-shells sampled by Van Allen Probes range from 1.2 to around 6.2 on the nightside and 5.8 on the dayside.
The Magnetic Electron Ion Spectrometer (MagEIS) instruments aboard each of the probes measured electron flux over a broad energy range using one low-energy unit (LOW) for energies 20–240 keV, two medium-energy units (M75 and M35) for observing electron flux at energies 80 keV–1.2 MeV, and a high-energy unit (HIGH) to sample data at energies from 0.8 to 4.8 MeV (Blake et al., 2013). LOW, HIGH and M75 units were mounted at 75° to the spin axis, and the M35 unit was installed at 35° to the spin axis. Such a configuration was selected to provide broader pitch angle coverage for the MagEIS detector. In this study we employ the full data set of the MagEIS pitch angle resolved electron flux (level 3) in 2012–2019 averaged by 5 min with an assumed symmetry with respect to 90° PA. Following Zhao et al. (2018), we remove PADs for which the maximum electron flux value is below 100 cm−2s−1sr−1keV−1 as those PADs correspond to background levels of the MagEIS detector and are less indicative of the physics.
In order to analyze pitch angle distributions at the geomagnetic equator, it is necessary to propagate the locally measured electron flux values for each pitch angle to the equatorial plane using an appropriate geomagnetic field model. Since in this study we are concerned with variation of pitch angle shapes with increasing geomagnetic activity, the values are propagated to the magnetic equator using the TS04D storm-time model (Tsyganenko and Sitnov, 2005) with the internal field specified by the International Geomagnetic Reference Field (IGRF) model. The TS04D model requires as inputs the By and Bz components of the interplanetary magnetic field (IMF), solar wind velocity, density and dynamic pressure and the Dst index, as well as special W and G indices defined in (Tsyganenko and Sitnov, 2005). The values of the solar wind parameters superposed for 129 storms used in this study are shown in the Supporting information (Supplementary Figure S2).
2.2 PAD Approximation Using Fourier Sine Series
In this study we approximate equatorial electron PADs using the Fourier sine series expansion of the form:
where j is electron flux as a function of pitch angle α. It should be noted that the even terms (sin 2α and sin 4α) represent shapes that are asymmetric around 90°, which is inconsistent with the trapped particle populations considered here, and therefore are omitted. In this study, we use the Fourier expansion up to degree 5, as this combination can effectively fit all the PAD types observed in the outer belt (shown in Figures 1, 2 and discussed below). We fit the values of electron flux to equatorial pitch angles in linear scale using least-squares and obtain values of the coefficients A0, A1, A3 and A5. As can be seen from Equation 1, the A0 coefficient shows the value of electron flux in the edge of the loss cone and represents the minimum flux value for a given PAD. Furthermore, we determine maximum value of electron flux, denoted as jmax, within each pitch angle distribution. Carbary et al. (2011) proposed a criterion to remove low quality PAD fits, which has been used in several other studies (e.g., Ni et al., 2016). This criterion uses the normalized standard deviation of the difference between the observed and fitted electron flux and is defined as σN = σ/(jmax − A0). The fits with the corresponding σN values
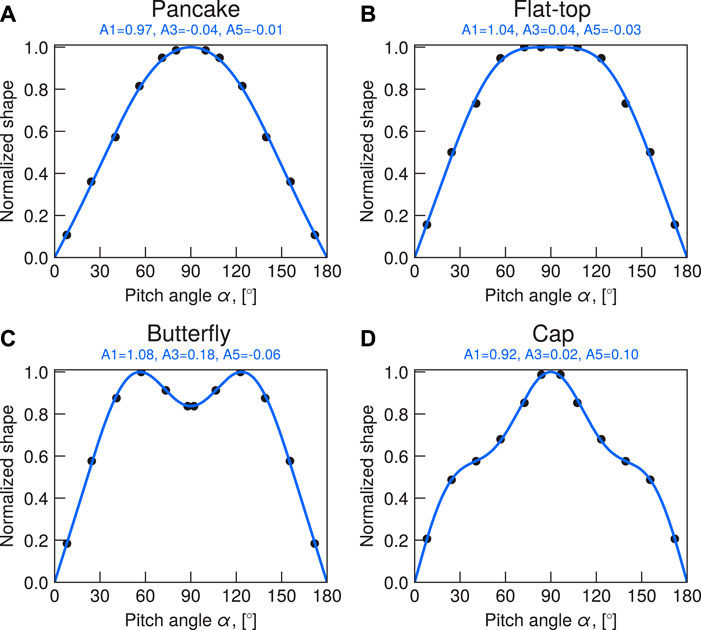
FIGURE 1. Examples of the fitted pancake (A), flat-top (B), butterfly (C) and cap (D) equatorial PADs, normalized using equation 2. The dots show normalized MagEIS observations and the solid lines give fitted shapes.
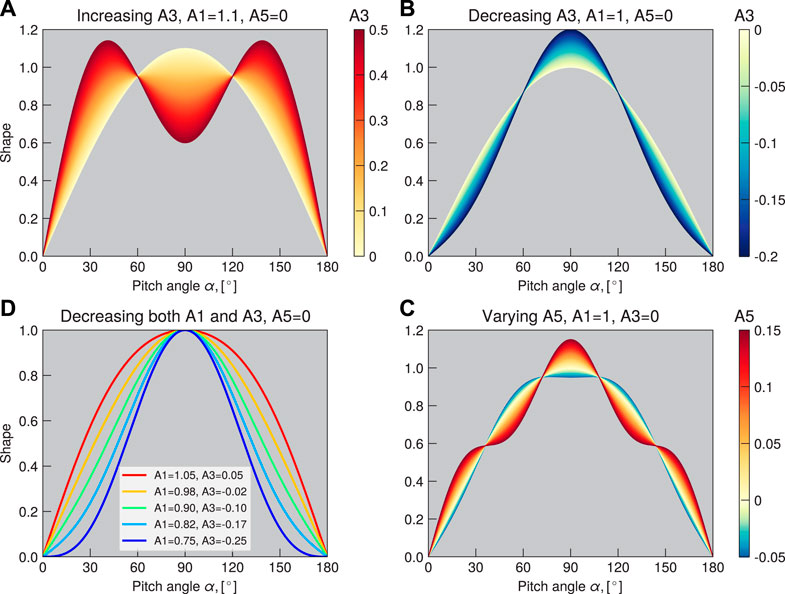
FIGURE 2. Sketches of PAD shapes resulting from different combination of the A1, A3 and A5 coefficients. (A) Increasing the butterfly coefficient A3 under fixed A1 and A5 = 0 leads to stronger 90° minima; (B) negative values of A3 (also under fixed A1 and A5 = 0) lead to more anisotropic pancake distributions; (C) decreasing both A1 and A3 also creates steeper pancake PADs; (D) Negative A5 values result in flat-top PADs, while positive A5 values correspond to cap PAD shapes.
In order to normalize PADs to span from 0 to 1, we apply the following equation to the coefficients Ai, i = {1, 3, 5}:
where
Figure 1 shows examples of the four main types of pitch angle distributions observed in the outer radiation belt region, namely the pancake, flat-top, butterfly and cap PADs, fitted using Equation 1 and normalized by Equation 2. Note that while distinguishing these shapes is useful for discussions, we do not assign these discrete categories to our PADs but keep describing them through the continuous A values. Generally, the pancake PAD shape, shown in Figure 1A, resembles the first sine harmonic, and therefore has a large value of the corresponding coefficient A1 and low values of coefficients before the third and fifth terms (A3 and A5, respectively). The A3 coefficient corresponding to the sin (3α) term shows contribution of the butterfly shape. Since sin (3α) exhibits two peaks at 30° and 150° PA with a minimum at 90°, it can be used together with the first sine harmonic to approximate butterfly PADs (an example is given in Figure 1C). The flat-top PAD shape (Figure 1B) corresponds to high values of A1 with low values of A3, and small negative values of A5. The cap distributions (Figure 1D) can be fitted by a combination of the first and fifth sine harmonics. The sin (5α) function has 3 peaks (at 30°, 90° and 150°) with two depletions in between of the peaks. In combination with the general pancake shape given by sin(α) it can well fit the head-and-shoulder structure.
In Figure 2 we show different combinations of the pancake (A1), butterfly (A3) and cap (A5) coefficients, and the resulting PAD shapes. In panel (a), we fix A1 = 1.1 and A5 = 0 and start increasing the A3 magnitude from 0 to 0.5. It can be seen that for A3 = 0 a pancake shape is observed, while under higher A3 values butterfly PADs are created, and the 90° minimum becomes more pronounced. In Figure 2B, the A3 coefficient is decreased from 0 to -0.2. As a result, the pancake distribution becomes steeper (i.e., the anisotropy increases). In panel (c) we decrease both A1 and A3 coefficients, which also results in narrower PAD shapes. Such an increase in anisotropy of electron PADs is observed on the dayside during geomagnetic storms, and will be discussed later in Sections 3 and 4. In Figure 2D we vary the cap coefficient A5 under fixed A1 and A3. When A5 is zero, a perfect pancake distribution is observed. When A5 becomes negative, there is a transition of pancake PADs into the flat-top distributions. When A5 increases and becomes positive, cap distributions are produced. It should be noted that in case of the butterfly distributions, the A3 coefficient can increase to relatively large values (up to 0.7), while only small A5 values (0.05–0.15) are needed to resolve the head-and-shoulders PAD shape. As can be seen from Figures 1, 2, the Fourier approximation fits well all main types (pancake, butterfly and cap) of equatorial pitch angle distributions. Other PAD shapes can also be resolved by this approximation, for instance, the field-aligned distributions (e.g., Clark et al., 2014, see also Supplementary Figure S5).
3 Superposed Epoch Analysis of Storm-Time PAD Evolution
3.1 L and MLT Dependence
In this section, we analyze evolution of the PAD shapes in the outer radiation belt for day and night MLTs during geomagnetic storms in 2012–2019. To select the storm events for this analysis, we follow the methodology of Turner et al. (2019). As a proxy of the magnetic storm strength, we use the SYM-H index. We select events corresponding to the minimum SYM-H of less than -50 nT, while also requiring that there are no storms 2 days before nor after the event in question, to avoid the repeat events. Using this procedure, we find 129 storms throughout the Van Allen Probes era (the list of storms from October 2012 until October 2017 is given in Turner et al. (2019), their table A1, and the additional events in starting from October 2017 and until the end of the Van Allen Probes mission in late 2019 are listed in Table 1). Figure 3A shows the SYM-H index, solar wind (SW) dynamic pressure (Pdyn) and SW electric field (-v⋅Bz) superposed for the storms used in this study. Following Turner et al. (2019), we select the values of indices, as well as PAD shape coefficients, starting from 84 h before the SYM-H minimum for each storm and up to 84 h after the minimum. The data are binned into 3-h epochs with the zero epoch corresponding to the time of SYM-H minimum. For the spatial binning, 0.2 L was selected as an appropriate step.
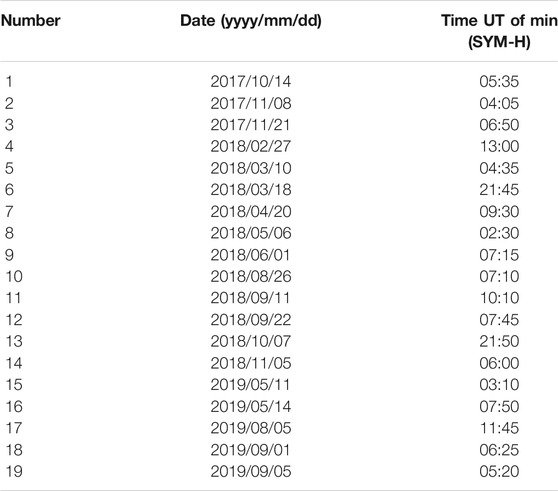
TABLE 1. Additional list of geomagnetic storms in October 2017—September 2019 used in this study (storms before October 2017 are listed in Turner et al. (2019) (their Table A1).
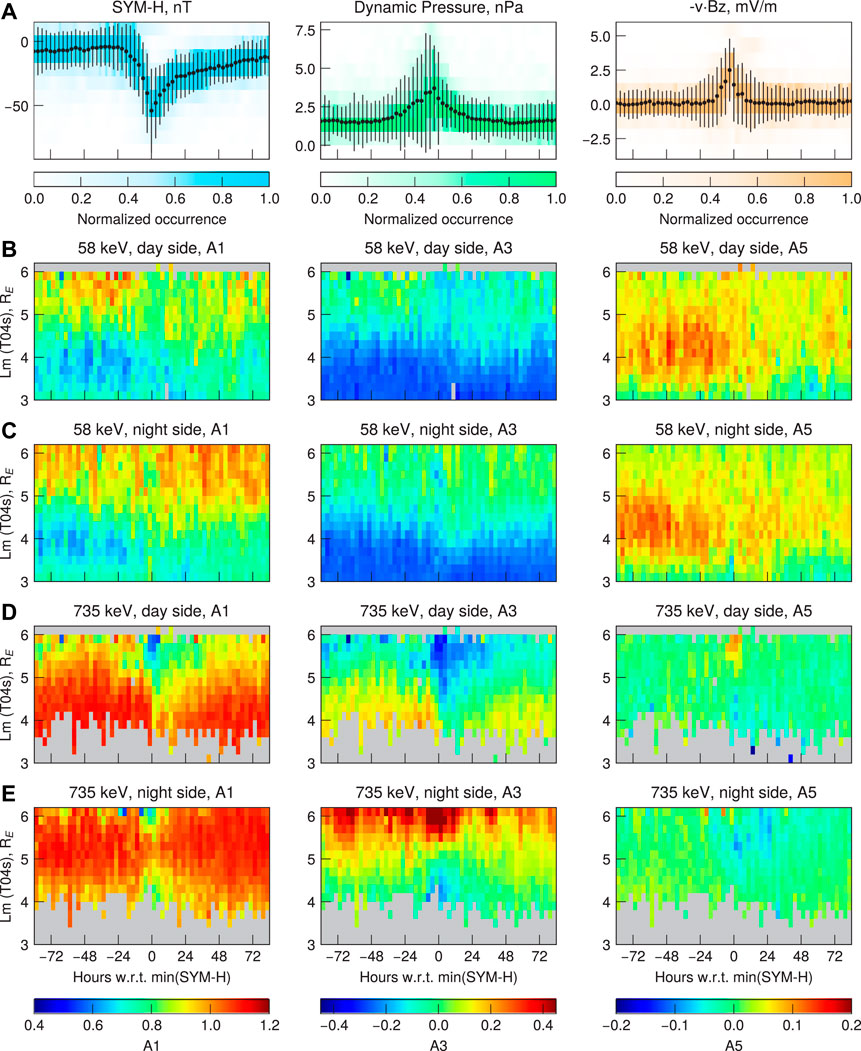
FIGURE 3. (A) SYM-H index, SW dynamic pressure and electric field superposed for 129 storms in 2012–2019, (B) 3-h averaged dayside values of the A1 (pancake), A3 (butterfly) and A5 (cap) coefficients for 58 keV electrons, binned by the epochs (with respect to the SYM-H index minimum) and Lm. The coefficients in the same format for nightside evolution of 58 keV coefficients is shown in row (C). The storm-time evolution of the 735 keV electron PADs for day- and nightside is given in rows (D) and (E), respectively.
In Figure 3, the rows (b-e) show the superposed evolution of the PAD shape coefficients A1, A3 and A5 for 58 keV, as well as a higher energy of 735 keV for day (09–15 h) and night (21–03 h) MLTs. In each subplot, the x-axis represents the time epochs with respect to min (SYM-H), and the y-axis gives the McIlwain L parameter (Lm), calculated using the TS04D storm-time model. The color-coded values of the pancake (A1), butterfly (A3) and cap (A5) coefficients in these coordinates are shown in the left, middle and right columns, respectively. The corresponding standard deviations and number of points in each bin are shown in the Supporting information (Supplementary Figure S3). In Figure 3 we concentrate on two energies, while the energy dependence will be later generalized in Section 3.2.
At lower energies on the dayside, shown in Figure 3B, the pancake coefficients A1 generally decrease from 0.9 to 0.7 with decreasing L-values. The same can be seen for the A3 coefficients that turn from around zero at L = 6 to negative values of approximately -0.2 at L = 3. When both A1 and A3 coefficients decrease, the pancake distributions become narrower (see Figure 2C). At the same time, the cap coefficient shows positive values at L = 3.5- ∼ 5.6 and has a maximum at L ∼ 4. This indicates that at a broad range of L-values, the cap distributions will be present (see also Figure 5), and that they are most pronounced around L ∼ 4. In Figure 3, the row (c) shows the storm-time evolution of the coefficients for night MLTs at the same energy of 58 keV.
Figure 3D shows the evolution of the PAD coefficients for the 735 keV MagEIS energy channel. For this energy, a very strong evolution during the geomagnetic storms can be observed. Based on the row (d), two regions separated by L ∼5.2 can be qualitatively defined during pre-storm times. At L
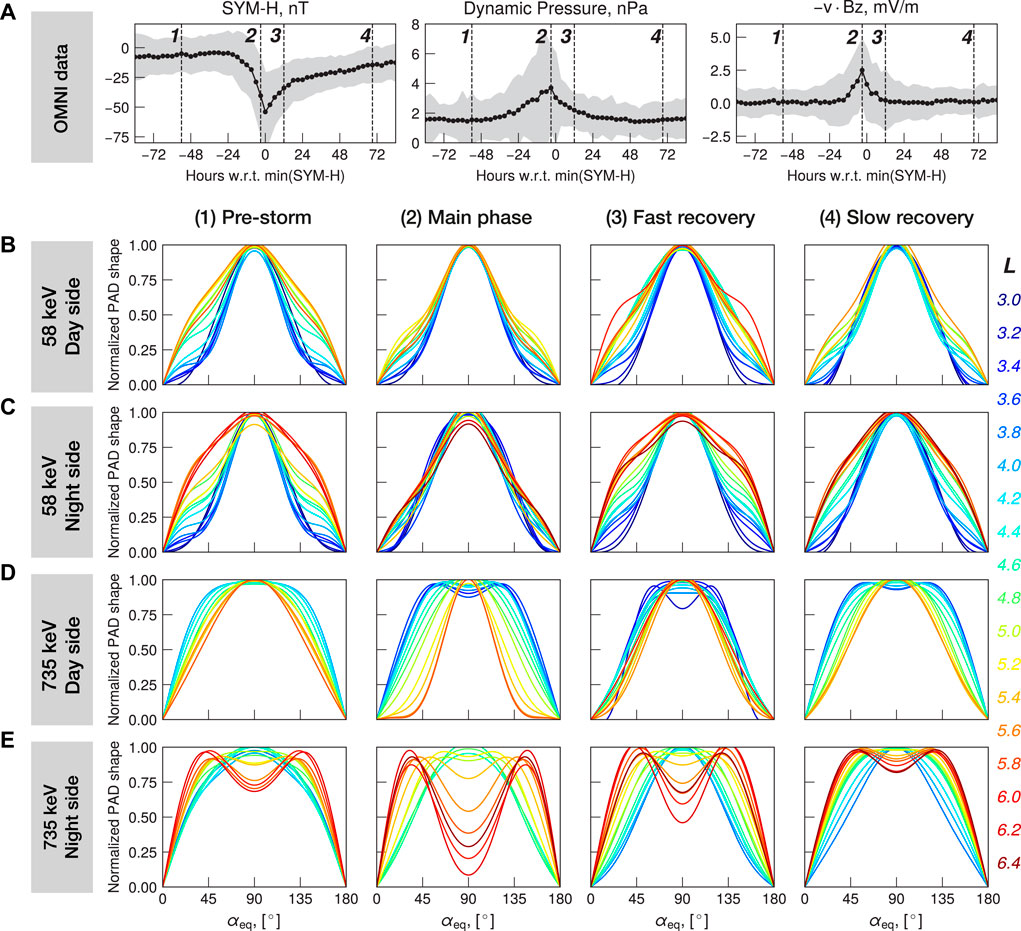
FIGURE 4. (A) Superposed SYM-H index, SW dynamic pressure and electric field. The dashed lines denote epochs at which the PAD shapes are shown below. (B) Normalized PAD shapes of 58 keV electrons for 4 phases of the storm at dayside MLT. The lines are colored by the Lm values shown in a legend below. (C) Same as (b) but for the nighttime MLT. (D) Normalized PAD shapes for 735 keV electrons at dayside, and (E) at nightside.
In contrast, on the nightside, the butterfly coefficients A3 increase at high L-shells when approaching the storm’s main phase. In Figure 3E, one can also distinguish two distinct regions separated by L = 5. At L
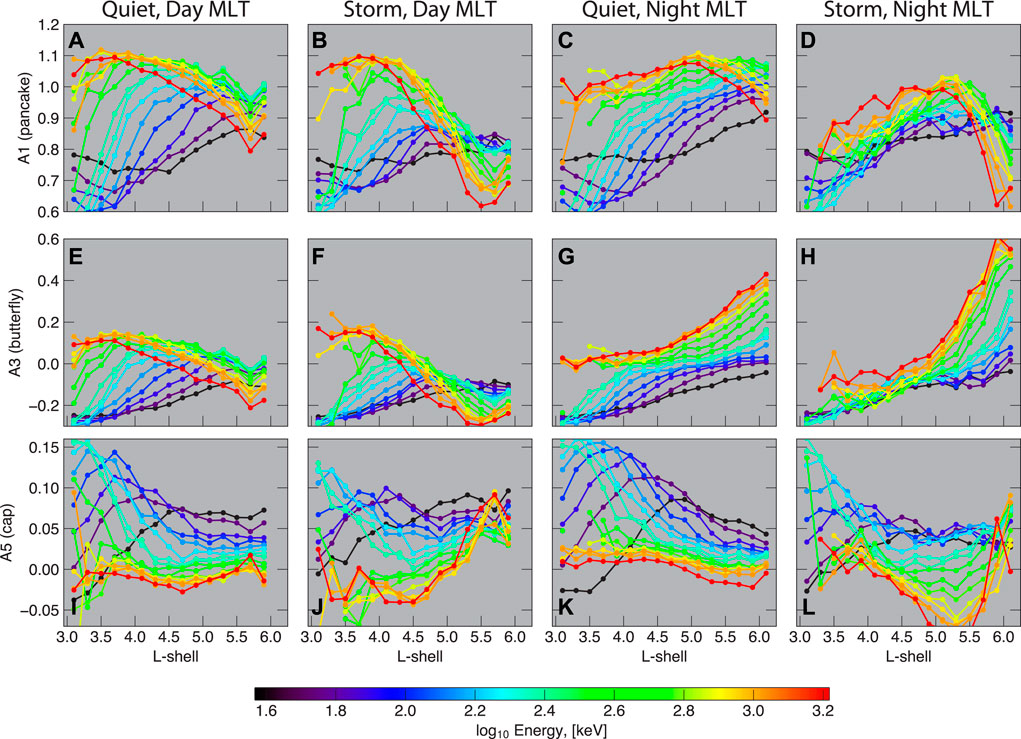
FIGURE 5. Energy dependence of the PAD shape coefficients for pre-storm and main phase conditions at day and night MLT sectors.
Figure 4 shows the normalized PAD shapes for the four phases of the geomagnetic storms. In the top row, we show the SYM-H index, solar wind dynamic pressure and y-component of the solar wind electric field superposed for 129 storms analyzed in this study. To demonstrate the PAD shapes corresponding to different phases of the storms, we select 4 epochs, the first one at around 54 h before the SYM-H minimum (indicating the pre-storm conditions), the second one coinciding with the maximum of the SW dynamic pressure (3 h before min (SYM-H), indicative of the main phase conditions), the third one at 12 h past the SYM-H minimum (referred to as “fast recovery”), and the fourth epoch at 69 h after min (SYM-H) (i.e., in the “slow recovery”). These four epochs are marked on the superposed SYM-H, Pdyn and SW electric field plots. In Figure 4, the row (B) shows normalized PAD shapes for the 58 keV MagEIS channel on the dayside. The pitch angle distributions at low L-values (L
In Figure 4 (row D), we show the PAD shapes of the 735 keV electrons on the dayside (09
The normalized PAD shapes of the 735 keV electrons at nightside MLTs for the 4 storm phases are demonstrated in Figure 4 (row E). Our statistics cover L from 3 to around 6.4 for nightside MLTs, and for the pre-storm conditions butterfly distributions are observed at L = 5.6–6.4. At L = 5–5.6, we observe the flat-top distribution shapes (as a transition region between butterfly and pancake PADs), and pancake distributions for L
3.2 Energy Dependence
Figure 5 demonstrates the energy dependence of the PAD shape coefficients for L = 3—6 at day and night MLTs. The resulting PAD shapes plotted as a function of energy under several fixed values of L are shown in Figure 6. The values shown here are superposed for 129 storms for the pre-storm and main phase conditions. We first analyze the day-time morphology. It can be seen from Figure 5 (A and B) that at energies of
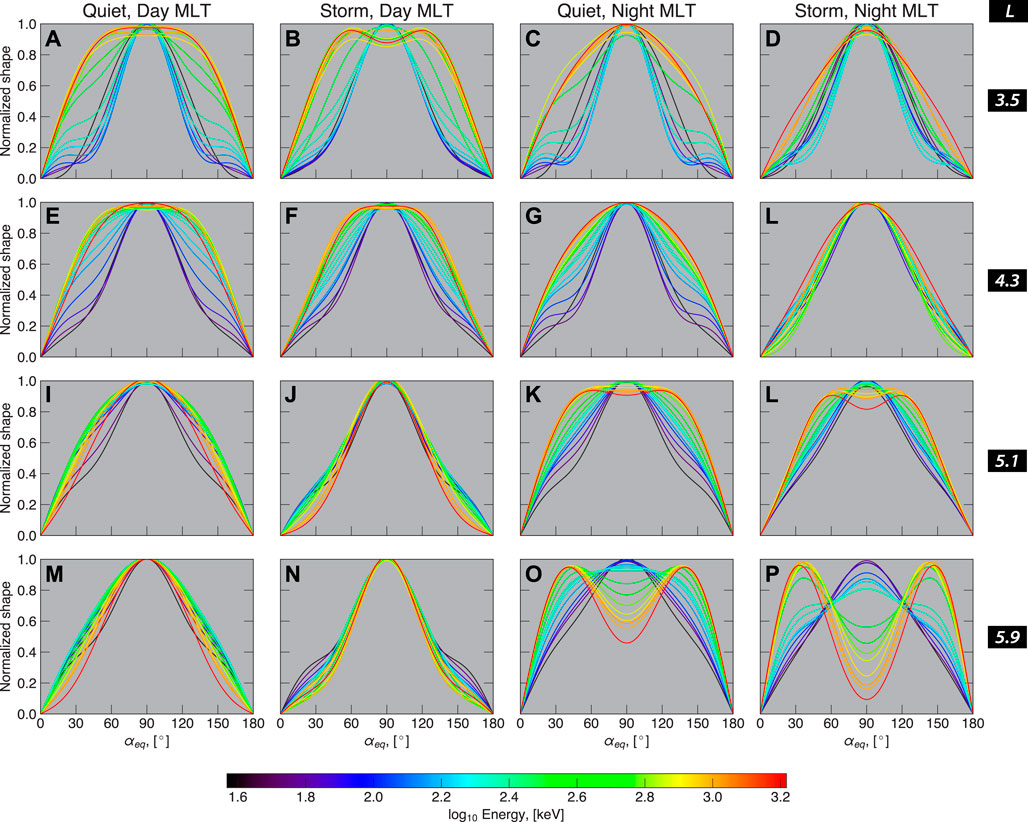
FIGURE 6. Energy dependence of pitch angle shapes at different L-values for quiet and storm conditions on the day and nightside MLT.
During the main phase at dayside MLTs, the A1 and A3 coefficients decrease (Figure 5, panels B and F), which is especially evident for L
During the pre-storm phase the butterfly distributions dominate at L
4 Discussion
In this study we employed a Fourier sine series expansion to approximate electron pitch angle distributions. It was shown that a combination of the first, third and fifth sine harmonics can effectively fit all main types of PADs in the outer radiation belt. This approximation has previously been used for analyzing distributions of electrons in planetary magnetospheres, for instance, by Clark et al. (2014). In case of the terrestrial radiation belts, most studies fitted electron PADs to the sinn(α) function, where n shows the steepness of the distribution (larger values of n correspond to more anisotropic distributions). This approximation is very easy to use, and the resulting values can be incorporated into the radiation belts simulations (e.g., Shi et al., 2016). However, the sinn(α) function can only approximate flat-top, pancake and isotropic distributions but is not capable of fitting butterfly and cap shapes. Butterfly distributions can account for up to 80% of PADs on the nightside, and cap distributions dominate lower energies both for day and night-side MLTs during geomagnetically quiet times. Allison et al. (2018) combined two sinn(α) terms with different n values which helped two resolve the cap but not butterfly distributions. Due to the fact that different types of PADs can be linked to specific processes acting within the radiation belts, it is crucial to use an approximation that can fit all of the PAD types. We have shown (Figures 1, 2) that the Fourier series are capable of resolving all main PAD shapes. Furthermore, the expression used here (Eq. 1) is easy to integrate over the solid angle and can be used to compute omnidirectional flux values using an analytic expression. We note that the methodology developed in this study can be extended to a range of magnetospheric problems, for instance, to analyzing pitch angle distributions of low-energy electrons and ions.
It is well-known that electrons in the inner radiation belt are stable both in terms of their amplitudes (e.g., Shprits et al., 2013), and pitch angle distributions (e.g., Zhao et al., 2018). Furthermore, electrons at energies over 1 MeV are generally absent in the inner zone (Fennell et al., 2015). Therefore, for analyzing the PAD dynamics during geomagnetic storms we concentrated on the outer radiation belt region. While several studies have already used RBSP data for analyzing the storm-time PAD evolution (e.g., Ni et al., 2015; Ni et al., 2016; Drozdov et al., 2019; Ni et al., 2020; Pandya et al., 2020; Greeley et al., 2021), they focused on relativistic and ultra-relativistic energies sampled by the REPT detector. In the current paper we concentrated on lower energies, from 30 keV to around 1.6 MeV, using observations by the MagEIS detector during the entire lifespan of the Van Allen Probes mission in 2012–2019. Our study has a certain overlap in energies (
It has been shown that the morphology of electron PADs is significantly different during geomagnetically quiet times compared to the active times (Lyons and Williams, 1975b). During periods of low geomagnetic activity, pitch angle distributions at energies below ∼300 keV exhibit cap (or, head-and-shoulder) shapes. This configuration results from cyclotron and Landau resonance with hiss waves, and is strongly energy-dependent (Lyons et al., 1972; Lyons and Williams, 1975a). In particular, in Figures 4, 5 we demonstrate that the cap coefficient A5 exhibits a peak at L ∼ 5 for 37 keV electrons, and then moves inward in L with increasing energy, which is in line previous results of (e.g., Shi et al., 2016) who reported that peak of PAD anisotropy, corresponding to cap PADs, was moving to smaller L-values under increasing energy. The same conclusion was reported by Allison et al. (2018). For each energy, Allison et al. (2018) highlighted regions where the combination of two sinn(α) terms was performing better than a single sine term. Those regions corresponded to the cap distributions. It was found that the extent of this region diminished with increasing energy, but was practically independent of Kp levels. In the current study we observed loss of the head-and-shoulders structure during the main phase of the storm at nightside MLTs, which is consistent with previous studies by Lyons and Williams (1975b) and Zhao et al. (2018). Due to the fact with increasing geomagnetic activity the plasmasphere is eroded (e.g., Goldstein et al., 2019), there would be no hiss waves at higher L-shells that could generate cap PADs (see e.g., Lyons and Williams, 1975b). Furthermore, during active times the low-energy particles are injected from the tail (e.g., Reeves et al., 1996). Turner et al. (2015a) demonstrated that injections of electrons with energies below 240 keV can be frequently observed within the geostationary orbit. Furthermore, Motoba et al. (2020) performed a superposed epoch analysis of dispersionless injections using RBSP data and showed that the corresponding pitch angle distributions of tens-of-keV electrons exhibited pancake shapes. Therefore, the transformation of cap PADs into pancakes during the main phase at low energies on the nightside (Figures 3C, Figure 4C) is likely due to the combination of the plasmasphere erosion and particle injections from the tail.
At energies
On the nightside, the PAD morphology is very different than on the dayside. At energies
During the main phase of the storm, the butterfly distributions on the nightside are intensified (Figures 4–6). Such an intensification is most likely due to a combination of the enhanced drift shell splitting and magnetopause shadowing. While the magnetopause is usually located at radial distances of
In this study, we analyzed the normalized electron pitch angle distributions measured by the MagEIS detector onboard the Van Allen Probes mission. The storm-time spin-averaged electron flux intensities were previously investigated by Turner et al. (2019), and it was reported that electrons of different energies exhibited a significantly different response to geomagnetic storms (see also Turner et al., 2015b). In our study, the storm-time morphology of the PAD shapes was also found to vary greatly with energy. It is worth noting that the results presented here can be combined with averaged picture of the spin-averaged electron flux evolution from Turner et al. (2019), as both the flux intensities and pitch angle distribution shapes are important for distinguishing between the loss and acceleration processes (e.g., Chen et al., 2005). Furthermore, due to complex mechanisms acting in the outer belt during the storm times, different particle populations can evolve into one another. For instance, electrons with energies up to tens of keV (the so-called seed population) can be injected during the substorm activity and produce waves that can energize the tens to hundreds of keV electrons to higher energies. In order to investigate these processes in detail, it is beneficial to analyze phase space densities under different values of μ and K, which gives an opportunity to see the time lags between the different populations (see, for instance, Boyd et al., 2016). We note, however, that in the current study we did not make any assumptions on the processes acting within the outer belt, and therefore the PAD shapes averaged for different storm epochs and energies obtained in this study already include part of the information on the mechanisms mentioned above and provide a good indication of the averaged storm-time behavior of the 30 keV–1.6 MeV electrons.
5 Conclusions
Using the full MagEIS data set of pitch angle resolved electron flux at energies 30 keV - ∼1.6 MeV in 2012–2019, we analyze equatorial electron PADs at L = 3–6. We use a combination of the first, third and fifth sine harmonics to approximate the pitch angle distributions. The corresponding expression can be analytically integrated, and the values of coefficients before the three terms relate to the main PAD shapes. We perform a superposed epoch analysis of 129 strong geomagnetic storms during the Van Allen Probes era for day and night MLTs. Our findings are as follows.
1. Cap distributions are mainly present at energies
2. At higher energies on the dayside, the distributions are mainly pancake. They exhibit broad shapes during quiet conditions and become more anisotropic during the main phase of the storm due to the field’s compression. The degree of this anisotropy smoothly increases with energy.
3. The butterfly distributions can be observed on the nightside at L
4. On the nightside, there is a transition region between the butterfly and pancake PADs, populated by the flat-top distributions. During quiet conditions, this transition is located at L ∼ 5.5 and moves inward to L ∼ 5 during the main phase of the storm.
The PAD shape coefficients for different L-shells, MLTs and phases of geomagnetic storms obtained in this study can be used for comparisons with the results achieved through the existing wave models when the flux magnitude is taken into consideration, as well as the outputs of the physics-based radiation belt simulations, in terms of PAD shapes. Furthermore, the dependencies reported here can further be used to improve the existing empirical models of the pitch angle distributions in Earth’s outer radiation belt.
Data Availability Statement
The original contributions presented in the study are included in the article/Supplementary Material, further inquiries can be directed to the corresponding author.
Author Contributions
AS and YS conceived the idea of the study. AS performed the analysis with input from YS, HA, NA, AD and PK. AS wrote the manuscript; YS, HA, NA, AD, PK, GR, DW and AAS contributed to structuring and editing the manuscript.
Funding
This project has received funding from the European Union’s Horizon 2020 research and innovation programme under grant agreement No. 870452 (PAGER). HA was supported by the Alexander von Humboldt foundation.
Conflict of Interest
The authors declare that the research was conducted in the absence of any commercial or financial relationships that could be construed as a potential conflict of interest.
Publisher’s Note
All claims expressed in this article are solely those of the authors and do not necessarily represent those of their affiliated organizations, or those of the publisher, the editors and the reviewers. Any product that may be evaluated in this article, or claim that may be made by its manufacturer, is not guaranteed or endorsed by the publisher.
Acknowledgments
AS acknowledges support from the International Space Science Institute (ISSI—Bern, Switzerland) through the ISSI team on “Imaging the Invisible: Unveiling the Global Structure of Earth’s Dynamic Magnetosphere”.
Supplementary Material
The Supplementary Material for this article can be found online at: https://www.frontiersin.org/articles/10.3389/fspas.2022.836811/full#supplementary-material
References
Albert, J. M., Starks, M. J., Horne, R. B., Meredith, N. P., and Glauert, S. A. (2016). Quasi‐Linear Simulations of Inner Radiation belt Electron Pitch Angle and Energy Distributions. Geophys. Res. Lett. 43, 2381–2388. doi:10.1002/2016gl067938
Allison, H. J., Horne, R. B., Glauert, S. A., and Del Zanna, G. (2018). Determination of the Equatorial Electron Differential Flux from Observations at Low Earth Orbit. J. Geophys. Res. Space Phys. 123, 9574–9596. doi:10.1029/2018ja025786
Artemyev, A. V., Agapitov, O. V., Mozer, F. S., and Spence, H. (2015). Butterfly Pitch Angle Distribution of Relativistic Electrons in the Outer Radiation Belt: Evidence of Nonadiabatic Scattering. J. Geophys. Res. Space Phys. 120, 4279–4297. doi:10.1002/2014ja020865
Blake, J. B., Carranza, P. A., Claudepierre, S. G., Clemmons, J. H., Crain, W. R., Dotan, Y., et al. (2013). “The Magnetic Electron Ion Spectrometer (MagEIS) Instruments Aboard the Radiation Belt Storm Probes (RBSP) Spacecraft,” in The Van Allen Probes Mission. Editors N. Fox, and J. L. Burch (Boston, MA: Springer), 383–421. doi:10.1007/978-1-4899-7433-4_12
Boyd, A. J., Spence, H. E., Huang, C. L., Reeves, G. D., Baker, D. N., Turner, D. L., et al. (2016). Statistical Properties of the Radiation Belt Seed Population. J. Geophys. Res. Space Phys. 121, 7636–7646. doi:10.1002/2016ja022652
Carbary, J., Mitchell, D., Paranicas, C., Roelof, E., Krimigis, S., Krupp, N., et al. (2011). Pitch Angle Distributions of Energetic Electrons at Saturn. J. Geophys. Res. Space Phys. 116. doi:10.1029/2010ja015987
Chen, Y., Friedel, R. H. W., Henderson, M. G., Claudepierre, S. G., Morley, S. K., and Spence, H. E. (2014). REPAD: An Empirical Model of Pitch Angle Distributions for Energetic Electrons in the Earth's Outer Radiation belt. J. Geophys. Res. Space Phys. 119, 1693–1708. doi:10.1002/2013ja019431
Chen, Y., Friedel, R., Reeves, G., Onsager, T., and Thomsen, M. (2005). Multisatellite Determination of the Relativistic Electron Phase Space Density at Geosynchronous Orbit: Methodology and Results during Geomagnetically Quiet Times. J. Geophys. Res. Space Phys. 110. doi:10.1029/2004ja010895
Clark, G., Paranicas, C., Santos-Costa, D., Livi, S., Krupp, N., Mitchell, D. G., et al. (2014). Evolution of Electron Pitch Angle Distributions across Saturn's Middle Magnetospheric Region from MIMI/LEMMS. Planet. Space Sci. 104, 18–28. doi:10.1016/j.pss.2014.07.004
Drozdov, A. Y., Aseev, N., Effenberger, F., Turner, D. L., Saikin, A., and Shprits, Y. Y. (2019). Storm Time Depletions of Multi‐MeV Radiation Belt Electrons Observed at Different Pitch Angles. J. Geophys. Res. Space Phys. 124, 8943–8953. doi:10.1029/2019ja027332
Fennell, J. F., Claudepierre, S. G., Blake, J. B., O'Brien, T. P., Clemmons, J. H., Baker, D. N., et al. (2015). Van Allen Probes Show that the Inner Radiation Zone Contains No MeV Electrons: ECT/MagEIS Data. Geophys. Res. Lett. 42, 1283–1289. doi:10.1002/2014gl062874
Gannon, J., Li, X., and Heynderickx, D. (2007). Pitch Angle Distribution Analysis of Radiation belt Electrons Based on Combined Release and Radiation Effects Satellite Medium Electrons A Data. J. Geophys. Res. Space Phys. 112. doi:10.1029/2005ja011565
Ganushkina, N. Y., Dandouras, I., Shprits, Y., and Cao, J. (2011). Locations of Boundaries of Outer and Inner Radiation Belts as Observed by Cluster and Double Star. J. Geophys. Res. Space Phys. 116. doi:10.1029/2010ja016376
Goldstein, J., Pascuale, S., and Kurth, W. S. (2019). Epoch‐Based Model for Stormtime Plasmapause Location. J. Geophys. Res. Space Phys. 124, 4462–4491. doi:10.1029/2018ja025996
Greeley, A. D., Kanekal, S. G., Sibeck, D. G., Schiller, Q., and Baker, D. N. (2021). Evolution of Pitch Angle Distributions of Relativistic Electrons during Geomagnetic Storms: Van Allen Probes Observations. J. Geophys. Res. Space Phys. 126, e2020JA028335. doi:10.1029/2020ja028335
Hao, Y. X., Zong, Q.-G., Zhou, X.-Z., Rankin, R., Chen, X. R., Liu, Y., et al. (2017). Relativistic Electron Dynamics Produced by Azimuthally Localized Poloidal Mode ULF Waves: Boomerang-Shaped Pitch Angle Evolutions. Geophys. Res. Lett. 44, 7618–7627. doi:10.1002/2017gl074006
Horne, R. B., Meredith, N. P., Thorne, R. M., Heynderickx, D., Iles, R. H., and Anderson, R. R. (2003). Evolution of Energetic Electron Pitch Angle Distributions during Storm Time Electron Acceleration to Megaelectronvolt Energies. J. Geophys. Res. Space Phys. 108, SMP–11. doi:10.1029/2001ja009165
Lyons, L. R., Thorne, R. M., and Kennel, C. F. (1972). Pitch-Angle Diffusion of Radiation belt Electrons within the Plasmasphere. J. Geophys. Res. 77, 3455–3474. doi:10.1029/ja077i019p03455
Lyons, L. R., and Williams, D. J. (1975b). The Quiet Time Structure of Energetic (35-560 keV) Radiation belt Electrons. J. Geophys. Res. 80, 943–950. doi:10.1029/JA080i007p00943
Lyons, L. R., and Williams, D. J. (1975a). The Storm and Poststorm Evolution of Energetic (35-560 keV) Radiation belt Electron Distributions. J. Geophys. Res. 80, 3985–3994. doi:10.1029/ja080i028p03985
Mauk, B. H., Fox, N. J., Kanekal, S. G., Kessel, R. L., Sibeck, D. G., and Ukhorskiy, A. (2012). “Science Objectives and Rationale for the Radiation Belt Storm Probes Mission,” in The Van Allen Probes Mission. Editors N. Fox, and J. L. Burch (Boston, MA: Springer), 3–27. doi:10.1007/978-1-4899-7433-4_2
Meredith, N. P., Horne, R. B., Johnstone, A. D., and Anderson, R. R. (2000). The Temporal Evolution of Electron Distributions and Associated Wave Activity Following Substorm Injections in the Inner Magnetosphere. J. Geophys. Res. 105, 12907–12917. doi:10.1029/2000ja900010
Motoba, T., Ohtani, S., Gkioulidou, M., Mitchell, D. G., Ukhorskiy, A., Takahashi, K., et al. (2020). Pitch Angle Dependence of Electron and Ion Flux Changes during Local Magnetic Dipolarization inside Geosynchronous Orbit. J. Geophys. Res. Space Phys. 125, e2019JA027543. doi:10.1029/2019ja027543
Ni, B., Yan, L., Fu, S., Gu, X., Cao, X., Xiang, Z., et al. (2020). Distinct Formation and Evolution Characteristics of Outer Radiation belt Electron Butterfly Pitch Angle Distributions Observed by Van Allen Probes. Geophys. Res. Lett. 47, e2019GL086487. doi:10.1029/2019gl086487
Ni, B., Zou, Z., Gu, X., Zhou, C., Thorne, R. M., Bortnik, J., et al. (2015). Variability of the Pitch Angle Distribution of Radiation belt Ultrarelativistic Electrons during and Following Intense Geomagnetic Storms: Van Allen Probes Observations. J. Geophys. Res. Space Phys. 120, 4863–4876. doi:10.1002/2015ja021065
Ni, B., Zou, Z., Li, X., Bortnik, J., Xie, L., and Gu, X. (2016). Occurrence Characteristics of Outer Zone Relativistic Electron Butterfly Distribution: A Survey of Van Allen Probes REPT Measurements. Geophys. Res. Lett. 43, 5644–5652. doi:10.1002/2016gl069350
Pandya, M., Bhaskara, V., Ebihara, Y., Kanekal, S. G., and Baker, D. N. (2020). Evolution of Pitch Angle-Distributed Megaelectron Volt Electrons during Each Phase of the Geomagnetic Storm. J. Geophys. Res. Space Phys. 125, e2019JA027086. doi:10.1029/2019ja027086
Reeves, G. D., Friedel, R. H. W., Larsen, B. A., Skoug, R. M., Funsten, H. O., Claudepierre, S. G., et al. (2016). Energy‐dependent Dynamics of keV to MeV Electrons in the Inner Zone, Outer Zone, and Slot Regions. J. Geophys. Res. Space Phys. 121, 397–412. doi:10.1002/2015ja021569
Reeves, G., Henderson, M., McLachlan, P., Belian, R., Friedel, R., and Korth, A. (1996). Radial Propagation of Substorm Injections. Int. Conf. substorms 389, 579.
Reeves, G., McAdams, K., Friedel, R., and O’Brien, T. (2003). Acceleration and Loss of Relativistic Electrons during Geomagnetic Storms. Geophys. Res. Lett. 30. doi:10.1029/2002gl016513
Roederer, J. G. (1967). On the Adiabatic Motion of Energetic Particles in a Model Magnetosphere. J. Geophys. Res. 72, 981–992. doi:10.1029/jz072i003p00981
Schulz, M., and Lanzerotti, L. J. (1974). Particle Diffusion in the Radiation Belts. New York: Springer-Verlag. doi:10.1007/978-3-642-65675-0
Selesnick, R., and Blake, J. (2002). Relativistic Electron Drift Shell Splitting. J. Geophys. Res. Space Phys. 107, SMP–27. doi:10.1029/2001ja009179
Shi, R., Summers, D., Ni, B., Fennell, J. F., Blake, J. B., Spence, H. E., et al. (2016). Survey of Radiation Belt Energetic Electron Pitch Angle Distributions Based on the Van Allen Probes MagEIS Measurements. J. Geophys. Res. Space Phys. 121, 1078–1090. doi:10.1002/2015ja021724
Shprits, Y. Y., Subbotin, D., Drozdov, A., Usanova, M. E., Kellerman, A., Orlova, K., et al. (2013). Unusual Stable Trapping of the Ultrarelativistic Electrons in the Van Allen Radiation Belts. Nat. Phys 9, 699–703. doi:10.1038/nphys2760
Sibeck, D. G., McEntire, R. W., Lui, A. T. Y., Lopez, R. E., and Krimigis, S. M. (1987). Magnetic Field Drift Shell Splitting: Cause of Unusual Dayside Particle Pitch Angle Distributions during Storms and Substorms. J. Geophys. Res. 92, 13485–13497. doi:10.1029/ja092ia12p13485
Smirnov, A., Shprits, Y., Allison, H., Aseev, N., Drozdov, A., Kollmann, P., et al. (2022). An Empirical Model of the Equatorial Electron Pitch Angle Distributions in Earth’s Outer Radiation belt. Space Weather under Rev.
Su, Z., Zheng, H., and Wang, S. (2009). Evolution of Electron Pitch Angle Distribution Due to Interactions with Whistler Mode Chorus Following Substorm Injections. J. Geophys. Res. Space Phys. 114. doi:10.1029/2009ja014269
Tsyganenko, N., and Sitnov, M. (2005). Modeling the Dynamics of the Inner Magnetosphere during strong Geomagnetic Storms. J. Geophys. Res. Space Phys. 110. doi:10.1029/2004ja010798
Turner, D. L., Claudepierre, S. G., Fennell, J. F., O'Brien, T. P., Blake, J. B., Lemon, C., et al. (2015a). Energetic Electron Injections Deep into the Inner Magnetosphere Associated with Substorm Activity. Geophys. Res. Lett. 42, 2079–2087. doi:10.1002/2015gl063225
Turner, D. L., Kilpua, E., Hietala, H., Claudepierre, S., O’Brien, T., Fennell, J., et al. (2019). The Response of Earth’s Electron Radiation Belts to Geomagnetic Storms: Statistics from the Van Allen Probes Era Including Effects from Different Storm Drivers. J. Geophys. Res. Space Phys. 124, 1013–1034. doi:10.1029/2018ja026066
Turner, D. L., O'Brien, T. P., Fennell, J. F., Claudepierre, S. G., Blake, J. B., Kilpua, E. K. J., et al. (2015b). The Effects of Geomagnetic Storms on Electrons in Earth's Radiation Belts. Geophys. Res. Lett. 42, 9176–9184. doi:10.1002/2015gl064747
Vampola, A. (1998). “Outer Zone Energetic Electron Environment Update,” in Conference on the high energy radiation background in space. Workshop record, Snowmass, CO, USA, 22-23 July 1997 (IEEE), 128–136.
Walt, M. (2005). Introduction to Geomagnetically Trapped Radiation. Cambridge, UK: Cambridge University Press.
West, H. I., Buck, R. M., and Walton, J. R. (1973). Electron Pitch Angle Distributions throughout the Magnetosphere as Observed on Ogo 5. J. Geophys. Res. 78, 1064–1081. doi:10.1029/ja078i007p01064
Zhao, H., Friedel, R., Chen, Y., Baker, D., Li, X., Malaspina, D., et al. (2021). Equatorial Pitch Angle Distributions of 1–50 keV Electrons in Earth’s Inner Magnetosphere: an Empirical Model Based on the Van Allen Probes Observations. J. Geophys. Res. Space Phys. 126, e2020JA028322. doi:10.1029/2020ja028322
Zhao, H., Friedel, R. H. W., Chen, Y., Reeves, G. D., Baker, D. N., Li, X., et al. (2018). An Empirical Model of Radiation Belt Electron Pitch Angle Distributions Based on Van Allen Probes Measurements. J. Geophys. Res. Space Phys. 123, 3493–3511. doi:10.1029/2018ja025277
Zhao, X., Hao, Y., Zong, Q.-G., Zhou, X.-Z., Yue, C., Chen, X., et al. (2020). Origin of Electron Boomerang Stripes: Localized ULF Wave-Particle Interactions. Geophys. Res. Lett. 47, e2020GL087960. doi:10.1029/2020gl087960
Keywords: pitch angle, pitch angle distributions, electrons, radiation belts, magnetosphere, van allen probes
Citation: Smirnov A, Shprits Y, Allison H, Aseev N, Drozdov A, Kollmann P, Wang D and Saikin AA (2022) Storm-Time Evolution of the Equatorial Electron Pitch Angle Distributions in Earth’s Outer Radiation Belt. Front. Astron. Space Sci. 9:836811. doi: 10.3389/fspas.2022.836811
Received: 15 December 2021; Accepted: 01 March 2022;
Published: 23 March 2022.
Edited by:
Olga V. Khabarova, Institute of Terrestrial Magnetism Ionosphere and Radio Wave Propagation (RAS), RussiaReviewed by:
Nickolay Ivchenko, Royal Institute of Technology, SwedenQiugang Zong, Peking University, China
Copyright © 2022 Smirnov, Shprits, Allison, Aseev, Drozdov, Kollmann, Wang and Saikin. This is an open-access article distributed under the terms of the Creative Commons Attribution License (CC BY). The use, distribution or reproduction in other forums is permitted, provided the original author(s) and the copyright owner(s) are credited and that the original publication in this journal is cited, in accordance with accepted academic practice. No use, distribution or reproduction is permitted which does not comply with these terms.
*Correspondence: Artem Smirnov, YXJ0ZW0uc21pcm5vdkBnZnotcG90c2RhbS5kZQ==