 J. Joseph
 A. N. Jaynes
 Q. Ma
Q. Ma D. P. Hartley
 M. E. Usanova
 W. Li
W. Li- 1Department of Physics and Astronomy, University of Iowa, Iowa City, IA, United States
- 2Center for Space Physics, Boston University, Boston, MA, United States
- 3Department of Atmospheric and Oceanic Sciences, University of California, Los Angeles, Los Angeles, CA, United States
- 4Laboratory for Atmospheric and Space Physics, University of Colorado Boulder, Boulder, CO, United States
In the past decade, many observations of transversely heated low energy protons were reported in the inner magnetosphere. Interestingly, most of the time heated protons were observed along with magnetosonic waves. Due to the strong correlation, it was often assumed that magnetosonic waves were responsible for the heating of low energy protons. By performing a case study under unusually disturbed geomagnetic conditions, this paper unravels the controversial relationship between the observed pitch angle anisotropy of warm protons and the accompanying magnetosonic waves in the inner magnetosphere. We perform a comparative analysis involving two nearly identical cases of pitch angle anisotropy of warm protons in low L-shell region–one with magnetosonic waves and one without them. It is found that magnetosonic waves are not responsible for primary heating of low-energy protons and may just marginally alter the shape of the distribution of heated protons in the events analyzed. Based on the recent Cluster and POLAR observations, we also show how the recirculated polar wind plasma in the Earth’s magnetosphere can cause the concurrent appearance of heated protons and magnetosonic waves.
Introduction
The evolution of particle pitch angle distributions (PADs) contains vital information on the movements of charged particles and wave-particle interactions. As such, PADs may be used as a diagnostic tool to gain important insights into magnetospheric dynamics. The current study examines certain occurrences of anomalous PADs of the thermal (few eV to tens of eV) and the suprathermal (tens of eV to 100s of eV) protons in the inner magnetosphere. The majority of low-energy ions (tens of eV to hundreds of eV) in the plasmasphere originate from ionospheric outflows (Chappell et al., 1987, 2000, 2008; Huddleston et al., 2005). Typically, ionospheric outflows consist of thermal and suprathermal ions which are guided by the Earth’s magnetic field lines and therefore are expected to have field-aligned PADs (flux peaks around 0°/180°). This expectation was confirmed by Yue et al. (2017) using 4 years of data from Van Allen Probes. Additionally, Yue et al. (2017) showed that, in general, geomagnetic activity does not affect the PADs of protons below several keV. Low-energy proton PADs that peaked around 90° were occasionally reported. Any radial diffusion that transports ions towards Earth can cause an enhancement of perpendicular energy due to conservation of the first and second adiabatic invariants (Schulz & Lanzerotti, 1974). The increase in perpendicular energy leads to a pancake PAD (flux peaks around 90°). Hiss/EMIC waves may cause the transverse heating of very low energy (<1 eV) ions to several eV over long timescales (Artemyev et al., 2017). However, most of the time, pancake PADs of thermal and suprathermal protons are observed in the presence of magnetosonic (MS) waves (Wu et al., 2022). In some recent studies (e.g., Yuan et al., 2018; Ma et al., 2019; Teng et al., 2019; Hill et al., 2020), MS waves were identified as the likely cause of proton heating. But according to the findings of Min et al. (2021), quasilinear diffusion is only effective in heating >1 keV protons and does not influence the thermal/suprathermal proton populations. Moreover, recent statistical studies (Ferradas et al., 2021; Wu et al., 2022) show that despite the possibility for the causal relationship of MS waves and thermal/suprathermal proton pitch angle anisotropy, these features are not strongly associated. But they also noted that the pitch angle anisotropies in the absence of MS waves are typically weaker than when MS waves are present.
Using Van Allen Probes observations of a set of unusually intense magnetospheric events, we reexamine the controversial relationship between MS waves and the pitch angle anisotropy of thermal and suprathermal protons. For the first time, we show that under geomagnetically disturbed conditions, MS waves may not cause the original anisotropy but can change the shape of the anisotropic distribution in accordance with the quasilinear theory.
To find the cause of the pitch angle anisotropy of thermal and suprathermal protons and their correlation with MS waves, a comprehensive examination of all the possible sources of magnetospheric plasma during geomagnetically disturbed conditions is required. Typically, the solar wind is the major source of hot magnetospheric plasma, whilst upward transport from the ionosphere is the source of cold/warm plasma. At high latitudes, streams of ionospheric plasma, known as polar wind, continuously flow out along the open magnetic field lines. Recent studies (Moore et al., 1999; Chappell et al., 2008; Haaland et al., 2012; Chappell et al., 2021) have found that polar wind and polar cusp plasma from ionospheric outflow often gets partially convected back into the magnetosphere. Survey results from polar TIDE observations (Liemohn et al., 2005) and Cluster wake measurements (Engwall et al., 2009b; Andre and Cully, 2012) verify the presence of polar wind particles in the lobes. This normally unaccounted for recirculated plasma can have very significant contributions to magnetospheric dynamics. Depending on the solar wind parameters, specifically the strength of the southward IMF
In this study, we highlight that simultaneous occurrence of MS waves and pitch angle anisotropy of the thermal and suprathermal proton population could be due to the contribution of polar wind under southward
Observations
Here we use wave and particle observations from the Van Allen Probes (Mauk et al., 2013). Wave observations are taken from the Electric and Magnetic Field Instrument Suite and Integrated Science (EMFISIS) (Kletzing et al., 2013). We particularly use the waveform receiver (WFR) of the EMFISIS suite, which provides electric and magnetic field data in the frequency range of ∼10 Hz to 12 kHz. Particle data is obtained from the Energetic Particle Composition and Thermal Plasma Suite, in particular the Helium Oxygen Proton Electron (HOPE) instrument, which measures the differential flux and pitch angles of low/medium energy (∼1 eV–∼50 keV) electrons and ions (Funsten et al., 2013; Spence et al., 2013).
We choose a particularly extended geomagnetically disturbed period with several southward
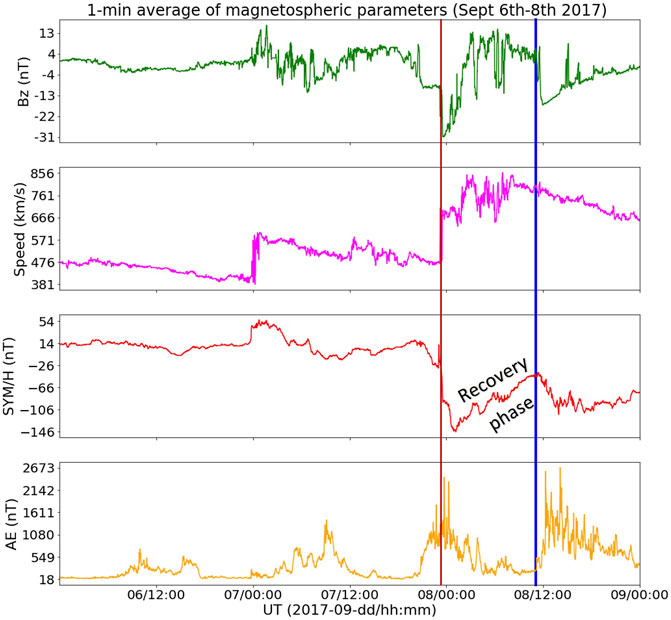
FIGURE 1. Near-earth solar wind parameters and geomagnetic activity indices during the extended disturbed period from 2017-09-06/00 UT to 2017-09-09/00 UT following the large solar X-ray (class X9.3) flare of 6 September 2017. Panels (A), (B), (C), and (D) show the magnetic field fluctuations, solar wind speed, SYM-H index, and AE index respectively. The vertical blue line marks the time when the strong pitch angle anisotropy of thermal and suprathermal protons was observed. The vertical red line marks the time of the first storm.
Van Allen Probe A was traversing away from perigee at an altitude of
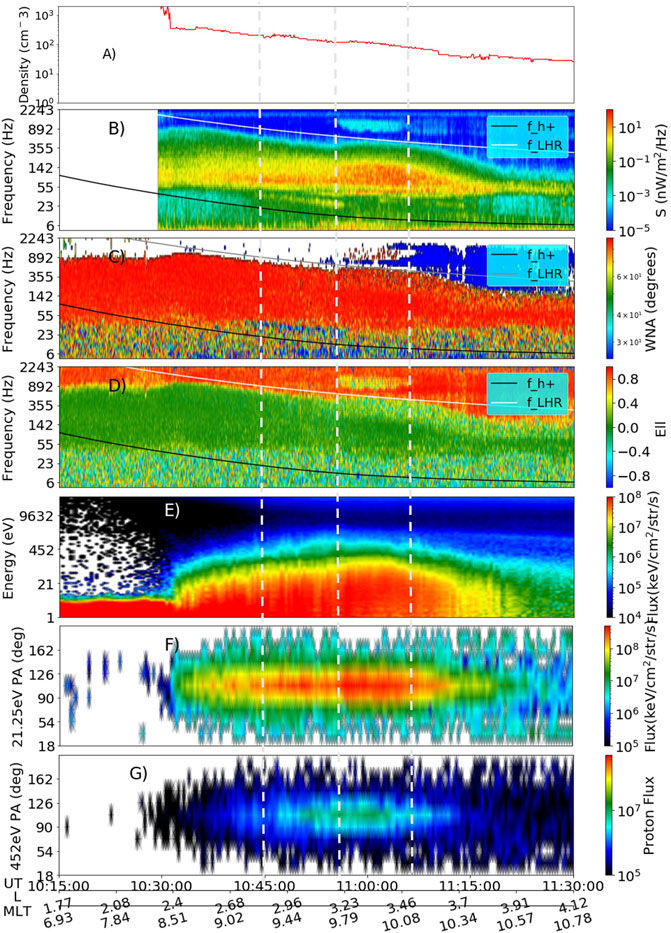
FIGURE 2. Correlation between thermal and suprathermal proton pancake pitch angle distributions (PADs) and the magnetosonic (MS) waves observed by Van Allen Probe A on 8 September 2017. Panel (A) shows the electron density profile. Panel (B) shows the Poynting flux density, panel (C) shows the wave normal angle, and panel (D) shows the ellipticity of the magnetic field polarization, in the frequency range from 5 to 2000 Hz. In panels (B), (C), and (D), the white and the black traces represent lower hybrid resonance frequency and proton cyclotron frequency, respectively. Electron density data and sheath corrected Poynting vector data (shown in panels A and B) are not available between 10:15 and 10:30 UT. Energy spectrogram of spin-averaged proton flux is shown in panel (E). Pitch angle distributions of proton fluxes at energies of ∼21 eV and ∼450 eV are shown in panels (F) and (G) respectively. The vertical white dashed lines mark the time intervals with different MS wave intensity, subsections of which are used for quasilinear analysis.
We also record a second case of pitch angle anisotropy of thermal and suprathermal proton under similar condition at 09:00 to 09:15 UT, a summary of which is shown in Figure 5. There were no MS waves observed during that interval.
Analysis
To determine the dependency of pitch angle anisotropy of thermal and suprathermal protons on MS waves, we conduct a comparative study. We choose two adjacent time intervals at 10:45-10:57 UT and at 10:57-11:05 UT with anisotropic pitch angle distributions of thermal and suprathermal protons (Figure 2F and 2G). The later interval had substantially larger MS wave intensities compared to the earlier one (Figure 2B). Poynting flux of the MS waves and spin-averaged flux density of thermal and suprathermal protons are shown in Panels A–B of Figure 3, respectively. Panels C1 and C2 of Figure 3 show the PADs of thermal and suprathermal protons at three different energies (21 eV, 98 eV, and 450 eV) for the two time intervals. Even though the general appearance of the distribution in both Figure 3 C1 and Figure 3C2 follows a pancake shape, there are subtle differences–in Figure 3C1, the lower energy (∼21 eV, red trace) protons have a cap-like (also called head-and-shoulder) distribution and in Figure 3C2, the higher energy (∼450 eV, blue trace) protons have a cap-like distribution.
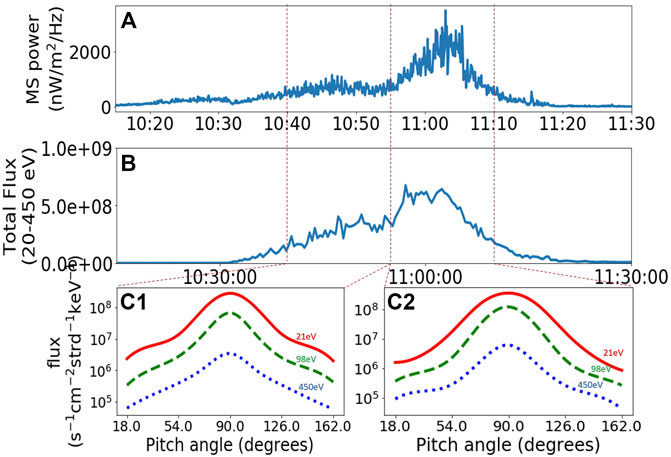
FIGURE 3. Comparison of pitch angle distribution of thermal/suprathermal protons in two adjacent time intervals. Panel (A) shows the Poynting flux density of MS waves. Panel (B) shows the flux density of protons in the energy range of 21–450 eV. Panel (C1), (C2) shows the pitch angle distributions of protons at energies 21 eV (red), 98 eV (green), and 450 eV (blue).
We perform a quasi-linear analysis of the MS waves in the two adjacent time intervals, at 10:52-10:57 UT and at 10:58-11:03 UT. Note that to limit the change in satellite L-shell, we use a slightly shorter time interval compared to the total duration of the observation. Figure 4 shows the result of the quasi-linear analysis. Top row (black traces) shows the continuous power spectrum of the magnetic field intensity as recorded by the EMFISIS WFR. However, this power spectrum could have hidden harmonic structures with high intensity near frequencies of
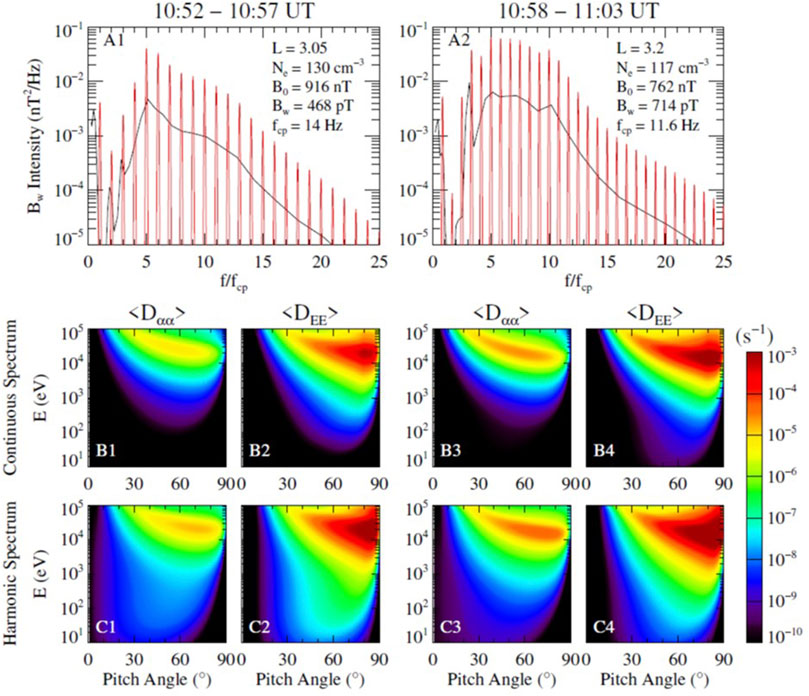
FIGURE 4. Quasi-linear analysis of MS waves interacting with protons during two adjacent time intervals. Black traces in (A1,A2) are the observed magnetic power spectral densities (PSDs) of MS waves. Corresponding assumed harmonic PSDs (red) are overplotted. Panels (B1,B2) show the pitch angle and momentum diffusion coefficients derived from the continuous PSD shown in A1. Corresponding diffusion coefficients derived from the discrete PSD are shown in panels (C1,C2). Same format is followed for (B3,B4), (C3,C4) for the PSDs in A2.
We use the Full Diffusion Code to calculate the bounce-averaged diffusion coefficients of protons due to MS waves (Ma et al., 2019). MS waves are assumed to have a latitude coverage from the equator to 5°. The wave normal angle (θ) is assumed to follow a Gaussian distribution in X = tan(θ), which is proportional to
The continuous spectrum (black traces in Figure 4A) is used to calculate the pitch angle diffusion coefficients
It is to be noted that the diffusion coefficients and proton heating efficiency due to MS waves depend on the wave normal angle and latitude distribution. Recent observations have shown MS waves at higher latitudes than 10° (Boardsen et al., 2016; Wu et al., 2021), which may have smaller wave normal angles. We performed tests of the diffusion coefficient calculations using different wave normal angle distributions (not shown). Although the energy diffusion coefficients are higher when the central wave normal angle is a few degrees lower than 89.3°, the timescale of proton heating is still longer than 1 day at the energies below several hundred eV. The magnetosonic waves generated at high latitudes could cause additional heating of protons at low pitch angles, but may not directly affect the protons with large pitch angles which mirror between low magnetic latitudes.
Discussion
Our analysis shows that MS waves mainly affect protons at pitch angles ∼30°–60° instead of ∼90° in the energy range of 10–450 eV. Moreover, the low diffusion coefficients, which correspond to timescales of at least several days for the discrete wave frequency spectrum, cannot explain the simultaneous appearance of MS waves and anisotropic PADs of low-energy protons. So, it is unlikely that MS waves can cause the formation of the pancake/cap distribution from the ambient field-aligned distribution of protons at energies below 100 eV. A very similar conclusion was drawn in a recent statistical study by Wu et al. (2022). We also excluded the effect of EMIC waves since no significant EMIC waves were detected during this event. This leads us to doubt the validity of the assumption that local wave-particle interaction is the main cause of the observed proton heating. However, the quasi-linear analysis shows that MS waves can marginally affect the pitch angle anisotropy of protons. For conclusive observational evidence, we need another event of pitch angle anisotropy of similar severity without MS waves. On the day of the event, 8 September 2017, we came across another event, which matched this criterion. Van Allen Probe A crossed the low L-shell region (2.1 < L < 2.5) for the inbound pass and (3.1 < L < 3.5) for the outbound pass within 2 hours and encountered a pitch angle anisotropy of similar strength at both the regions. Strong MS waves were detected during the outbound pass (10:55–11:10 UT) as opposed to negligible MS waves during the inbound pass (09:00–09:15 UT) as shown in Figure 5A. We have already examined the effect of the MS waves on thermal and suprathermal protons during the outbound pass (Figures 4B4, 4C4). During the inbound pass at the earlier time, thermal/suprathermal protons were not affected by MS waves. We see a clear increase in thermal and suprathermal proton flux density at 09:00–09:15 UT and at 10:55–11:10 UT during the inbound and the outbound passes (Figure 5B). We plot the cumulative fluxes of protons with energies 21 eV (red), 98 eV (green) and 450 eV (blue) at various pitch angles in Figure 5C, for the two time intervals. As evident from Panels B and C of Figure 5, both the total flux density and the pitch angle anisotropy of the 21 eV, 98 eV, and 450 eV protons were approximately identical during the two intervals. To compare and contrast the distribution shape, two time slices shown in Figure 5C are overlapped and plotted in Figure 5D. We see that the distributions coincide for the low energy protons (red traces). At higher energies (green and blue traces), the two distributions match around the center (90° ± 30°) but deviates substantially away from each other at the fringes. Thermal and suprathermal protons have higher fluxes at low pitch angles in presence of MS waves. This is the result we expected from the quasilinear analysis (Figures 4B,C). Our analysis result (Figure 4B and 4C4) shows that MS waves have negligible effects on very low energy (∼10–20 eV) protons. Though, higher energy protons (∼100–500 eV) with pitch angles away from 90° can be energized by MS waves. This serendipitous observation proves that MS waves can alter the shape of the PAD of thermal and suprathermal protons from pancake to cap but another non-local source is required to supply the initial anisotropic proton fluxes.
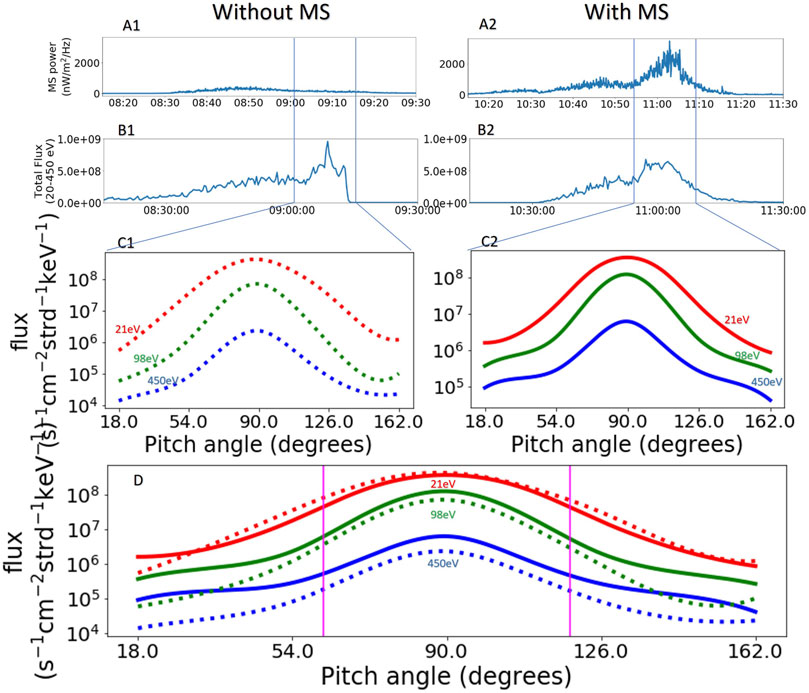
FIGURE 5. Comparison of pitch angle distribution of thermal/suprathermal protons in the presence and absence of MS waves. Panel (A1,A2) shows the Poynting flux of MS waves. Panel (B1,B2) shows the flux density of protons in the energy range of 20–450 eV. Panel (C1,C2) shows the pitch angle distributions of protons at energies of 21 eV (red), 98 eV (green), and 450 eV (blue). Distribution plots of panel C1 (dotted) and C2 (solid) are overplotted in panel (D) for comparison. Magenta vertical lines on panel D marks the regions of pitch angles around 90° beyond which the shapes of the distribution (solid and dotted lines) differ substantially for higher energies (green and blue traces).
One potential means of producing a pancake PAD at low energies is by additional proton injections and their subsequent radial diffusion. To conserve the first and second adiabatic invariants, proton pitch angles become larger as they travel towards regions of higher magnetic field strength, in otherwards to lower L-shells. We investigate the possible mechanism of particle injections under the geomagnetic conditions preceding the event. Recent theoretical and observational studies have shown that the cold (a few eV) polar wind that flows continuously upward from the ionosphere often reenters the magnetosphere. The polar wind convection process intensifies under geomagnetically disturbed conditions. The injected protons from the polar wind can get accelerated and eventually acquire energies typical of the ring current and/or the warm plasma cloak (Chappell et al., 2021). Figure 6 (top panel) is a cartoon representation of the polar wind trajectories under southward IMF
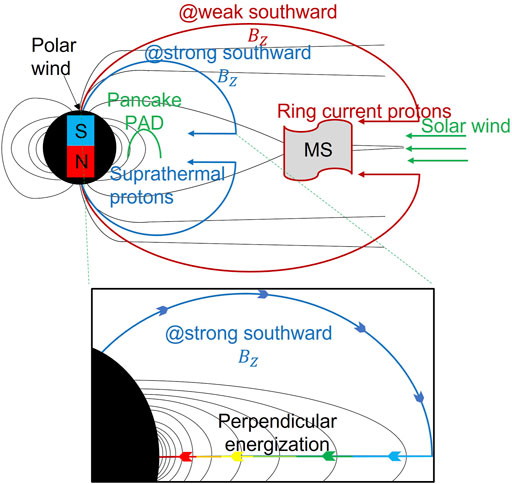
FIGURE 6. A cartoon representation of the polar wind trajectory under southward IMF
Conclusion
Thermal/suprathermal proton heating by MS wave is a controversial issue. The concurrent occurrences of pancake PADs and MS waves seemingly suggests that MS waves contribute to the formation of pancake PADs in low energy protons. On the one hand, past studies have shown that under special circumstances, e.g., in the density cavity of the plasmasphere, MS waves can heat cold H+ and He+ ions (Yuan et al., 2018) or MS waves with substantial
• Magnetosonic (MS) waves are inefficient in heating protons with energies below a few hundred eV despite their frequently synchronized occurrences.
• Polar wind under southward
• MS waves can only slightly affect the energies of warm protons at mid-range pitch angles, which may alter the shape of a preexisting pancake distribution to a cap distribution.
The observational evidence of polar wind is not provided in this paper. However, from previous studies (Moore et al., 1999; Chappell et al., 2008; Haaland et al., 2012; Chappell et al., 2021) polar wind is expected to be present during all south ward
At this point, all descriptions of the polar wind affecting the PADs of thermal/suprathermal protons and generating MS waves are speculation. No supporting observations exists as of now.
Data availability statement
Van Allen Probes HOPE data is available from the ECT Science Operations and Data Center, https://rbsp-ect.newmexicoconsortium.org/data_pub/, EMFISIS data from http://emfisis.physics.uiowa.edu. Solar wind data is available from https://omniweb.gsfc.nasa.gov/form/omni_min.html.
Author contributions
JJ conceived the study. JJ developed and implemented algorithms for data analysis, found a possible cause for the reported phenomenon and wrote the manuscript. QM conducted the quasi-linear simulations and edited the manuscript. DH advised on presenting the observational data. AJ, MU and WL read and helped in improving the manuscript.
Funding
The primary author (JJ) wishes to acknowledge the use of funds from NASA’s Van Allen Probes ECT project, through JHU/APL contract 967399 under prime NASA contract NAS5-01072. QM acknowledges the NASA grant 80NSSC20K0196.
Conflict of interest
The authors declare that the research was conducted in the absence of any commercial or financial relationships that could be construed as a potential conflict of interest.
Publisher’s note
All claims expressed in this article are solely those of the authors and do not necessarily represent those of their affiliated organizations, or those of the publisher, the editors and the reviewers. Any product that may be evaluated in this article, or claim that may be made by its manufacturer, is not guaranteed or endorsed by the publisher.
References
André, M., and Cully, C. M. (2012). Low-energy ions: A previously hidden solar system particle population. Geophys. Res. Lett. 39, L03101. doi:10.1029/2011gl050242
Artemyev, A. V., Mourenas, D., Agapitov, O. V., and Blum, L. (2017). Transverse eV ion heating by random electric field fluctuations in the plasmasphere. Phys. Plasmas 24 (2), 022903. doi:10.1063/1.4976713
Balikhin, M., Shprits, Y., Walker, S., Chen, L., Cornilleau-Wehrlin, N., Dandouras, I., et al. (2015). Observations of discrete harmonics emerging from equatorial noise. Nat. Commun. 6, 7703. doi:10.1038/ncomms8703
Boardsen, S. A., Hospodarsky, G. B., Kletzing, C. A., Engebretson, M. J., Pfaff, R. F., Wygant, J. R., et al. (2016). Survey of the frequency dependent latitudinal distribution of the fast magnetosonic wave mode from Van Allen Probes Electric and Magnetic Field Instrument and Integrated Science waveform receiver plasma wave analysis. J. Geophys. Res. Space Phys. 121, 2902–2921. doi:10.1002/2015JA021844
Chappell, C. R., Giles, B. L., Moore, T. E., Delcourt, D. C., Craven, P. D., and Chandler, M. O. (2000). The adequacy of the ionospheric source in supplying magnetospheric plasma. J. Atmos. Sol. Terr. Phys. 62, 421–436. doi:10.1016/s1364-6826(00)00021-3
Chappell, C. R., Glocer, A., Giles, B. L., Moore, T. E., Huddleston, M. M., and Gallagher, D. L. (2021). The key role of cold ionospheric ions as a source of hot magnetospheric plasma and as a driver of the dynamics of substorms and storms. Front. Astron. Space Sci. 8, 746283. doi:10.3389/fspas.2021.746283
Chappell, C. R., Huddleston, M. M., Moore, T. E., Gilse, B. L., and Delcourt, D. C. (2008). Observations of theWarm plasma cloak and an explanation of its formation in the magnetosphere. J. Geophys. Res. 113, A09206. doi:10.1029/2007ja012945
Chappell, C. R., Moore, T. E., and Waite, J. H. (1987). The ionosphere as a fully adequate source of plasma for the Earth’s magnetosphere. J. Geophys. Res. 92, 5896. doi:10.1029/ja092ia06p05896
Chen, L., Thorne, R. M., Jordanova, V. K., and Horne, R. B. (2010). Global simulation of magnetosonic wave instability in the storm time magnetosphere. J. Geophys. Res. 115, A11222. doi:10.1029/2010JA015707
Engwall, E., Eriksson, A. I., Cully, C. M., Andre, M., Torbert, R., and Vaith, H. (2009b). Earth’s ionospheric outflow dominated by hidden cold plasma. Nat. Geosci. 2 (24), 24–27. doi:10.1038/ngeo387
Ferradas, C. P., Boardsen, S. A., Fok, M. C., Buzulukova, N., Reeves, G. D., and Larsen, B. A. (2021). Observations of density cavities and associated warm ion flux enhancements in the inner magnetosphere. JGR. Space Phys. 126 (3), e28326. doi:10.1029/2020JA028326
Funsten, H., Skoug, R., Guthrie, A., MacDonald, E., Baldonado, J., Harper, R., et al. (2013). Helium, Oxygen, Proton, and Electron (HOPE) mass spectrometer for the radiation belt storm probes mission. Space Sci. Rev. 179 (1-4), 423–484. doi:10.1007/s11214-013-9968-7
Haaland, S., Eriksson, A., Engwall, E., Lybekk, B., Nilsson, H., Pedersen, A., et al. (2012). Estimating the capture and loss of cold plasma from ionospheric outflow. J. Geophys. Res. 117, A07311. doi:10.1029/2012ja017679
Hartley, D. P., Chen, L., Christopher, I. W., Kletzing, C. A., Santolik, O., Li, W., et al. (2022). The angular distribution of lower band chorus waves near plasmaspheric plumes. Geophys. Res. Lett. 49, e2022GL098710. doi:10.1029/2022gl098710
Hartley, D. P., Chen, Y., Kletzing, C. A., Denton, M. H., and Kurth, W. S. (2015). Applying the cold plasma dispersion relation to whistler mode chorus waves: EMFISIS wave measurements from the van allen probes. J. Geophys. Res. Space Phys. 120, 1144–1152. doi:10.1002/2014JA020808
Hartley, D. P., Kletzing, C. A., Kurth, W. S., Bounds, S. R., Averkamp, T. F., Hospodarsky, G. B., et al. (2016). Using the cold plasma dispersion relation and whistler mode waves to quantify the antenna sheath impedance of the Van Allen Probes EFW instrument. J. Geophys. Res. Space Phys. 121, 4590–4606. doi:10.1002/2016JA022501
Hartley, D. P., Kletzing, C. A., Kurth, W. S., Hospodarsky, G. B., Bounds, S. R., Averkamp, T. F., et al. (2017). An improved sheath impedance model for the Van Allen Probes EFW instrument: Effects of the spin axis antenna. J. Geophys. Res. Space Phys. 122, 4420–4429. doi:10.1002/2016JA023597
Hill, S., Buzulukova, N., Boardsen, S., and Fok, M. C. (2020). Local heating of oxygen ions in the presence of magnetosonic waves: Possible source for the warm plasma cloak? JGR. Space Phys. 125 (8), e27210. doi:10.1029/2019JA027210
Huddleston, M. M., Chappell, C. R., Delcourt, D. C., Moore, T. E., Giles, B. L., and Chandler, M. O. (2005). An examination of the process and magnitude of ionospheric plasma supply to the magnetosphere. J. Geophys. Res. 110 (12), A12202. doi:10.1029/2004ja010401
Jordanova, V. K., Welling, D. T., Zaharia, S. G., Chen, L., and Thorne, R. M. (2012). Modeling ring current ion and electron dynamics and plasma instabilities during a high speed stream driven storm. J. Geophys. Res. 117, A00L08. doi:10.1029/2011JA017433
Kletzing, C., Kurth, W., Acuna, M., MacDowall, R., Torbert, R., Averkamp, T., et al. (2013). “The electric and magnetic field instrument suite and integrated science (EMFISIS) on RBSP,” in The van allen Probes mission (New York, USA: Springer), 127–181. doi:10.1007/s11214-013-9993-6
Kurth, W. S., De Pascuale, S., Faden, J. B., Kletzing, C. A., Hospodarsky, G. B., Thaller, S., et al. (2015). Electron densities inferred from plasma wave spectra obtained by the Waves instrument on Van Allen Probes. JGR. Space Phys. 120, 904–914. doi:10.1002/2014JA020857
Liemohn, M. W., Moore, T. E., Craven, P. D., Maddox, W., Nagy, A. F., and Kozyra, J. U. (2005). Occurrence statistics of cold, streaming ions in the near-earth magnetotail: Survey of polar-TIDE observations. J. Geophys. Res. 110, A07211. doi:10.1029/2004ja010801
Ma, Q., Li, W., Chen, L., Thorne, R. M., and Angelopoulos, V. (2014a). Magnetosonic wave excitation by ion ring distributions in the Earth's inner magnetosphere. JGR. Space Phys. 119, 844–852. doi:10.1002/2013JA019591
Ma, Q., Li, W., Chen, L., Thorne, R. M., Kletzing, C. A., Kurth, W. S., et al. (2014b). The trapping of equatorial magnetosonic waves in the Earth's outer plasmasphere. Geophys. Res. Lett. 41, 6307–6313. doi:10.1002/2014GL061414
Ma, Q., Li, W., Yue, C., Thorne, R. M., Bortnik, J., Kletzing, C. A., et al. (2019). Ion heating by electromagnetic ion cyclotron waves and magnetosonic waves in the Earth’s inner magnetosphere. Geophys. Res. Lett. 46 (12), 6258–6267. doi:10.1029/2019GL083513
Mauk, B., Fox, N. J., Kanekal, S., Kessel, R., Sibeck, D., and Ukhorskiy, A. A. (2013). Science objectives and rationale for the radiation belt storm probes mission. Space Sci. Rev. 179 (1–4), 3–27. doi:10.1007/s11214-012-9908-y
Meredith, N., Horne, R. B., and Anderson, R. R. (2008). Survey of magnetosonic waves and proton ring distributions in the Earth’s inner magnetosphere. J. Geophys. Res. 113, A06213. doi:10.1029/2007JA012975
Min, K., Kim, J., Ma, Q., Jun, C., and Liu, K. (2021). Unusual high frequency EMIC waves: Detailed analysis of EMIC wave excitation and energy coupling between EMIC and magnetosonic waves. Adv. Space Res. 69 (2022), 35–47. doi:10.1016/j.asr.2021.07.039
Moore, T., Chandler, M. O., Chappell, C. R., Comfort, R. H., Craven, P. D., Delcourt, D. C., et al. (1999). “Polar/TIDE results on polar outflows,”. Editors J. L. Burch, R. L. Carovillano, and S. K. Antiochos, (Washington, D. C: AGU), 109, 87.Sun-Earth Plasma Connect. Geophys. Monogr. Ser.
Santolik, O., Parrot, M., and Lefeuvre, F. (2003). Singular value decomposition methods for wave propagation analysis. Radio Sci. 38 (1), 1010. doi:10.1029/2000RS002523
Schulz, M., and Lanzerotti, L. J. (1974). Particle diffusion in the radiation belts. Ser. Phys. Chem. Space 7, 978-3-642-65677-4. doi:10.1007/978-3-642-65675-0
Spence, H. E., Reeves, G. D., Baker, D. N., Blake, J. B., Bolton, M., Bourdarie, S., et al. (2013). Science goals and overview of the radiation belt storm probes (RBSP) energetic particle, composition, and thermal plasma (ECT) suite on NASA's van allen probes mission. Space Sci. Rev. 179 (1–4), 311–336. doi:10.1007/s11214-013-0007-5
Sun, J., Gao, X., Lu, Q., Chen, L., Liu, X., Wang, X., et al. (2017). Spectral properties and associated plasma energization by magnetosonic waves in the Earth's magnetosphere: Particle-in-cell simulations. J. Geophys. Res. Space Phys. 122 (5), 5377–5390. doi:10.1002/2017ja024027
Teng, S., Li, W., Tao, X., Ma, Q., Wu, Y., Capannolo, L., et al. (2019). Generation and characteristics of unusual high frequency EMIC waves. Geophys. Res. Lett. 46 (14), 14230–14238. doi:10.1029/2019GL085220
Wu, Z., Su, Z., Liu, N., Gao, Z., Zheng, H., Wang, Y., et al. (2021). Off-equatorial source of magnetosonic waves extending above the lower hybrid resonance frequency in the inner magnetosphere. Geophys. Res. Lett. 48, e2020GL091830. doi:10.1029/2020GL091830
Wu, Z., Teng, S., Ma, Q., and Tao, X. (2022). A statistical study of pancake pitch angle distribution of low-energy protons and their correlation with magnetosonic waves. JGR. Space Phys. 127 (5), e2021JA030174. doi:10.1029/2021JA030174
Yuan, Z., Yu, X., Huang, S., Qiao, Z., Yao, F., and Funsten, H. O. (2018). Cold ion heating by magnetosonic waves in a density cavity of the plasmasphere. J. Geophys. Res. Space Phys. 123, 1242–1250. doi:10.1002/2017JA024919
Keywords: magnetosonic wave, pitch angle anisotropy, wave-particle interaction, polar wind, quasi-linear analysis
Citation: Joseph J, Jaynes AN, Ma Q, Hartley DP, Usanova ME and Li W (2022) Relation between magnetosonic waves and pitch angle anisotropy of warm protons. Front. Astron. Space Sci. 9:1035563. doi: 10.3389/fspas.2022.1035563
Received: 02 September 2022; Accepted: 09 November 2022;
Published: 24 November 2022.
Edited by:
Olga Khabarova, Institute of Terrestrial Magnetism Ionosphere and Radio Wave Propagation (RAS), RussiaReviewed by:
Zhenpeng Su, University of Science and Technology of China, ChinaRoman Kislov, Space Research Institute (RAS), Russia
Copyright © 2022 Joseph, Jaynes, Ma, Hartley, Usanova and Li. This is an open-access article distributed under the terms of the Creative Commons Attribution License (CC BY). The use, distribution or reproduction in other forums is permitted, provided the original author(s) and the copyright owner(s) are credited and that the original publication in this journal is cited, in accordance with accepted academic practice. No use, distribution or reproduction is permitted which does not comply with these terms.
*Correspondence: J. Joseph, amF5YXNyaS1qb3NlcGhAdWlvd2EuZWR1