 Maria Loukitcheva1,2,3*
 Kevin P. Reardon4,5
- 1Max Planck Institute for Solar System Research, Goettingen, Germany
- 2Special Astrophysical Observatory, Russian Academy of Science, Nizhniy Arkhyz, Russia
- 3Department of Mathematics and Mechanics, Saint-Petersburg State University, Saint-Petersburg, Russia
- 4National Solar Observatory, Boulder, CO, United States
- 5Department of Astrophysical and Planetary Sciences, University of Colorado, Boulder, CO, United States
During the first few years of observing the Sun with the Atacama Large Millimeter/submillimeter Array (ALMA), the scientific community has acquired a number of observational datasets targeting various structures in active regions, including sunspot umbra and penumbra, active region pores, and plages. In this paper we review the results obtained from the extensive analysis of these interferometric millimeter data, together with the coordinated observations from IRIS, SDO, IBIS, and Hinode, that reveal information on the chromospheric thermal structure above active regions and properties of small-scale heating events near magnetic field concentrations. We discuss the properties of waves (especially the three-minute oscillations) in sunspots, plage, and network. We speculate how high-resolution millimeter data can supplement spectral line observations in the visible and UV and can improve chromospheric spectroscopic inversions. We identify challenges in the interpretation of the millimeter continuum emission due to the complex, non-local and time-dependent processes that determine the electron density through the chromosphere. Finally we overview the prospects for future active regions observations with ALMA during the ascending phase of the solar cycle.
1 Solar active regions
“Solar active regions” (hereafter ARs) is an observational term referring to the regions in the atmosphere of the Sun, spanning from the photosphere up to the solar corona, where a whole variety of phenomena related to strong concentrations of magnetic fields takes place. Principal structures of active regions, such as sunspots, plages, and pores, are all associated with magnetic field bundles of typically kiloGauss strength. These features are the primary source for a broad range of solar activity phenomena, especially transient events such as small-scale brightenings, dynamic loops, streamers, jets, flares, and coronal mass ejections (CMEs), which heat and shape the outermost solar atmospheric layers, and can drive the space weather.
This solar activity results in the emission from a wide range of wavelengths: from the X-ray to radio, and the most effective way to exploit diagnostic capabilities of each wavelength regime lies in the synergy between the observations at different wavelengths. In this respect, the complementary use of radio data is particularly valuable for diagnostics of the physical conditions in the solar atmosphere. In particular, the bulk of the millimeter continuum emission originates from the chromospheric heights (Kundu, 1965) and allows a rather straightforward measurements of the gas temperature across these heights, as the radiation is coupled linearly to the temperature owing to its formation in local thermodynamic equilibrium (LTE) and is in the Rayleigh-Jeans limit. Thereby, observations at mm wavelengths provide strong constraints to the thermal structure of the chromosphere in ARs. Furthermore, the solar chromosphere harbors plenty of highly nonlinear phenomena that result in local heating (e.g., magneto-acoustic waves and shocks, wave dissipation events, reconnection along magnetic field lines (see, e.g., Carlsson et al., 2019). Observations at mm wavelengths with sufficiently high spatial and temporal resolution would be able to diagnose the thermodynamic changes in the rapid, small-scale events.
The slowly-varying component of the solar radio emission from active regions was termed the S-component (Krueger, 1979) to distinguish it from emission from sporadic events, e.g. flares, radio bursts and storms). It gained a lot of interest starting from the early radio measurements, as it reflects the atmospheric structuring of solar activity features in the chromosphere and corona, which can exhibit very different physical characteristics. The single-dish observations of the Sun at mm and short cm wavelengths (Kundu, 1970; Efanov et al., 1972) provided the first radio maps of the solar chromosphere and transition region. Enhanced radio brightness from solar ARs (compared to the quiet-Sun level), showing good correspondence with the calcium plage regions as well as with the regions of enhanced magnetogram signals, were detected in the two-dimensional solar maps. But the spatial resolution of the single-dish antennas (typically not exceeding 1 arcmin) was not enough to resolve individual sunspots, pores and plage elements, and isolate their radio brightness from the surroundings. Since the first observations of the Sun at radio wavelengths the techniques of radio measurements have made a big leap forward and the greatest breakthrough originated with the start of solar observing with the Atacama Large Millimeter-Submillimeter Array (ALMA, Wootten and Thompson, 2009) in 2016. ALMA has proven to be a unique instrument that is capable of providing the required spatial, temporal and spectral resolution to contribute to solving some of the central questions of solar physics, like the energy transport and mechanisms of its deposition in the solar corona.
Mapping of the Sun with spatial resolution of order of arcseconds has revealed the fine structure of the solar radio emission from ARs. With ALMA it became possible to distinguish and describe sunspot umbra and penumbra in the mm images (Iwai et al., 2017; Loukitcheva et al., 2017), to study signatures of the three-minute oscillations and wave propagation in the mm brightness of sunspot umbra (Chai et al., 2022a), to detect oscillations of mm brightness in small bright features in a plage (Guevara Gómez et al., 2021), to study spatial association of the observed oscillations through the atmosphere mapped by the different passbands (Narang et al., 2022), and evaluate the contribution from detected high-frequency acoustic waves to the chromospheric heating in plages (Molnar et al., 2021), to explore AR small-scale transient brightenings as signatures of heating linked to magnetic reconnection events (da Silva Santos et al., 2020b) and to provide further evidence for heating in the upper chromosphere through current dissipation (da Silva Santos et al., 2022a), to image a solar active region filament at sub-arcsecond resolution with the Interface Region Imaging Spectrograph (IRIS, De Pontieu et al., 2014) and ALMA (da Silva Santos et al., 2022b), to explore the structure and the dynamics of chromospheric plages, namely, of fibrils (Chintzoglou et al., 2021a) and jet-like features (Type II spicules) (Chintzoglou et al., 2021b), to perform quantitative comparison between the mm continuum brightness and the chromospheric diagnostics from observations, e.g., with Hα (Molnar et al., 2019), and Mg II line (Bastian et al., 2017; Bastian et al., 2018; Jafarzadeh et al., 2019), to constrain the thermodynamical properties of the plage atmosphere using ALMA and IRIS data from a NLTE inversion code (da Silva Santos et al., 2020a), and finally, to identify small-scale bright features in the ALMA images and study their relation to the chromospheric structures seen in the EUV, UV and Hα images (Brajša et al., 2018, 2021), and to employ ALMA measurements in a data-constrained model of the sunspot’s atmosphere (de Oliveira e Silva et al., 2022). Below we provide more details about these observational results.
2 ALMA observations of solar active regions
Regular solar ALMA observations have became possible since 2016 (ALMA Cycle 4). They were preceded by six solar test campaigns, run by solar radio astronomy experts, as part of Commissioning and Science Verification/Extension of Capabilities (CSV/EOC) activities, that were summarized in (Shimojo et al., 2017; White et al., 2017).
The observational data, obtained during the CSV/EOC phase, were released to the scientific community in early 2017. The ALMA data sets consist of calibrated visibility data and scripts to synthesize images for a number of solar targets, including both single-pointing and mosaic observations of solar active regions (ARs).1 The following AR data were released: 149-pointing mosaics of the active region NOAA 12470 (hereafter AR 12470) in Band 3 (a frequency of 100 GHz, corresponding to a wavelength λ = 3 mm) and Band 6 (230 GHz, λ ≈ 1.3 mm) obtained on 16 December 2015 and 18 December, respectively (Table 1); single-pointing observations of the west side of the active region AR 12470 in Band 3 recorded with a cadence of 2 s (16–17 December 2015). The interferometric maps synthesized from the mosaic observations sampled a field of view (FOV) of 300″ x300 ″ in Band 3, covering the sunspot umbra and penumbra as well as the surrounding AR plage. In the Band 6 mosaic the FOV is limited to 140″ × 140″, covering mostly the sunspot with only a small portion of the surrounding plage. The observations were performed in the compact array configuration involving 36 antennas with a maximum baseline of ≃ 300 m, resulting in the full-width at half maximum (FWHM) of the synthesized beam of 4.9″ × 2.2″ in Band 3 and of 2.4″ × 0.9″ in Band 6.
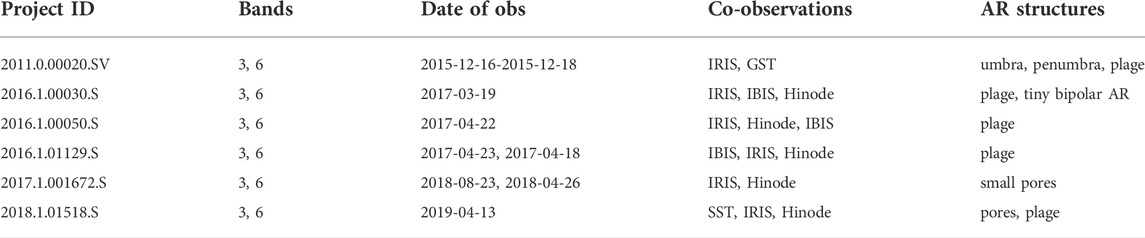
TABLE 1. Successful AR observational projects that have resulted in at least one publication.
The interferometric measurements are limited to observing areas of the solar surface limited by the field of view of a single dish (typically ≈60 ″ in diameter at 3 mm, or ≈25 ″ in diameter at 1.3 mm). While multiple pointings can be used to build up mosaic images, up to 10 s are required for each pointing. This makes it impractical to cover large regions of the Sun on reasonable timescales. Instead, a method was developed for fast-scan solar imaging using a single 12-meter dish with a “double-circle” continuous circular scanning pattern (White et al., 2017). While only achieving the spatial resolution of a single disk (50 and 22 ″ for 3 and 1.3 mm, respectively), this approach allows the full solar disk to be scanned in approximately 15 min, depending on the ALMA Band being used, and generates low-resolution observations of many active regions at once.
Up to the present day (August 2022), due to the declining of phase of the solar cycle from 2017–2020 and the low number of executed solar programs between 2019 and 2022, the science verification data on the sunspot in AR 12470 from 2015 remain the only successfully recorded ALMA interferometric measurements of sunspots. During periods of low activity, it was difficult to successfully propose observations of active regions due to uncertainties about their occurrence during those intervals when the array would be in configurations appropriate for solar observing. However the CSV/EOC data were extensively used for various studies resulting in new insights into the sunspot atmospheres.
ALMA observing of AR plages appeared to be more fortunate and successful in this period. During ALMA cycles 4-7 (2017–2019) at least five datasets of successful AR observations were acquired (Table 1) and are available via the ALMA Data Archive2 for download. The effective spatial resolution varies quite significantly between the datasets, as it depends on the wavelength, array configuration (maximum baseline), and the position of the target on the sky. Further information about the observational datasets can be found in (Jafarzadeh et al., 2021; Henriques et al., 2022).
3 Results on active regions from ALMA observations
3.1 Full-disk solar images
A first comparison of the full-disk solar images observed with ALMA with those observed in other UV and visible wavelengths was first presented in Alissandrakis et al. (2017) and further explored by Brajša et al. (2018). These authors utilized full-disk images obtained in Bands 3 and 6 (100 and 239 mHz, respectively), following the method of White et al. (2017), in the period 17–20 December 2015. They were able to compare these ALMA brightness temperature maps with simultaneous full-disk solar images using an Hα filter (NISP/NSO at the Cerro Tololo Observatory), in the He I 1083 nm line core (SOLIS/NSO), and with the AIA/SDO UV images and HMI/SDO magnetograms. The FWHM of the beam of these single-disk observations is 27″ at 239 GHz and 60″ at 100 GHz. At this resolution, in agreement with previous observations with similar or better resolution (Bastian et al., 1993; Lindsey and Kopp, 1995; Loukitcheva et al., 2014; Iwai and Shimojo, 2015), plages are the most prominent feature on the disk at 239 GHz, and only slightly less so at 100 GHz. Active regions were found to be brighter than the surrounding quiet Sun, as also expected from the theoretical modeling. Alissandrakis et al. (2017) noted that the one large sunspot visible on the disk was easily visible at 239 GHz but only barely detectable at 100 GHz, perhaps in part due to the lower spatial resolution. Brajša et al. (2018) found that the sunspot was not only cooler than the surrounding plage, but also than the quiet Sun regions. At wavelengths around ∼(1–5) mm, the brightness temperature of sunspots is expected to rise above that of the quiet Sun and the wavelength of this transition in the temperature contrast can be used to validate the temperature profiles of the various 1-D sunspot models (Loukitcheva et al., 2014).
de Oliveira e Silva et al. (2022) (this volume) used the brightness temperatures of AR 12470 obtained at 17 mm with the Nobeyama Radioheliograph (NoRH), and in Band 3 (3 mm) and Band6 (1.3 mm) derived from ALMA full-disk single-dish data, to construct a data-constrained model of the solar AR atmosphere. By modifying 5 parameters in the standard quiet Sun atmospheric model: the chromospheric gradients of temperature and electron density, the coronal temperature and density, and the TR height, the authors achieved a general agreement between the sunspot brightness synthesized from the model height profiles and the brightness values measured from the full-disk ALMA images. Their model indicates that the chromosphere above the sunspot umbra is compressed and the rise to transition region temperatures begins at about 1000 km above the surface. Instead above the penumbra and plage regions, the chromosphere is more extended and the transition region begins at 1800–2000 km .
3.2 Sunspots
3.2.1 Thermal structure
Single-dish measurements at mm wavelengths are not able to provide sufficient spatial resolution required to isolate brightness temperature of sunspots from their surroundings due to limitations of the antenna size. Previously, the highest spatial resolution with a single antenna was achieved in sunspot observations with the James Clerk Maxwell Telescope (JCMT) at 0.35, 0.85, and 1.2 mm by Lindsey and Kopp (1995), with spatial resolutions ranging from 6″ FWHM at the shorter wavelengths up to 16″ at 1.2 mm (analogous to ALMA’s Band 6). These observations found that sunspot umbrae at these wavelengths appeared colder than the surrounding quiet Sun, with temperatures below 4000 K at 0.35 mm, rising to 5000 K at 1.2 mm, indicating the presence of a positive temperature gradient in the upper atmosphere of the umbra and penumbra, similar to the quiet Sun.
However, much improved spatial resolution can be achieved by employing interferometric observations. White et al. (2006) reported observations of a sunspot with the 10-element Berkeley-Illinois-Maryland Array (BIMA) at 3.5 mm where the spatial resolution of
Iwai et al. (2017) presented the first analysis of the ALMA Band 3 mosaic image of the large sunspot in AR 12470 obtained with the spatial resolution of 4.9″ × 2.2″ at the wavelength of 3 mm. The map of the sunspot with clearly distinguished umbra and penumbra was compared with UV, EUV, and optical images observed by IRIS, AIA, and HMI.
The achieved spatial resolution allowed for the first time the fine structure of a sunspot’s umbra to be resolved with mm observations of the chromosphere and these authors detected a surprising umbral brightening, nearly as bright as the surrounding plage, in the core of the large sunspot umbra (Figure 1A). The enhanced central emission was found to correspond to a temperature excess of 800 K relative to the surrounding penumbral region. Similar bright features near the center of the umbra, adjacent to a partial lightbridge, were detected in the 1330 and 1,400 Å IRIS images, their location was found to be close but not identical to the mm feature. The lightbridge itself was not apparent in the ALMA Band 3 image. Surprisingly, no clear cospatial counterpart of the mm umbral enhancement was found in the AIA 1700A, 304A, or 171A channels, although they showed generally similar large-scale structure of the AR plage as in the mm image. Brajša et al. (2021) analyzed the same active region mosaic and confirmed the umbral brightening. These authors also identified several correspondences between temperature enhancements in the region surrounding the sunspot and chromospheric fibrils and coronal bright points seen in several AIA/SDO channels (Figure 2).
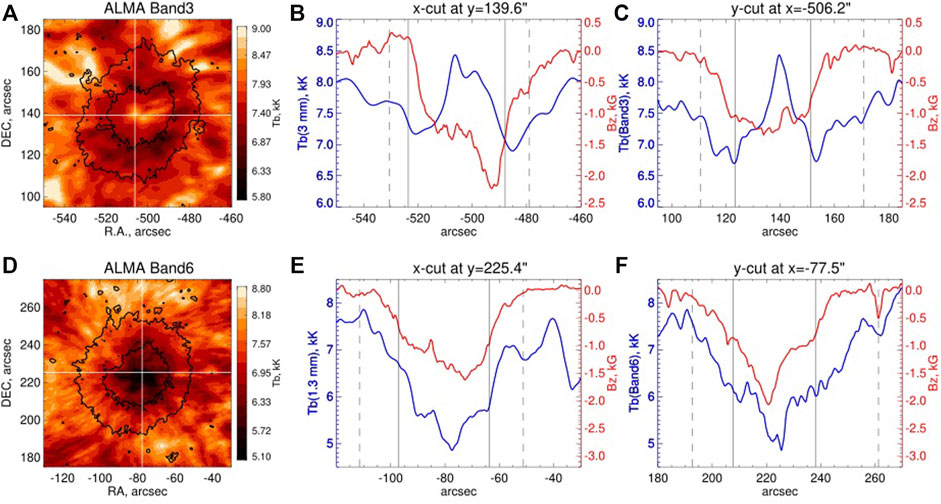
FIGURE 1. ALMA mosaic images of the sunspot in AR 12470 at 3 mm (A) and at 1.3 mm (D). The color bars correspond to the displayed range of mm brightness. Profiles of the mm brightness (blue, left axis) and of the longitudinal component of the magnetic field (red, right axis) for (B) the x-cut at y = 139.6, (C) the y-cut at x = −506.2 through the brightest umbral pixel at 3 mm; (E) the x-cut at y = 225.4, (F) the y-cut at x = −77.5 through the darkest umbral pixel at 1.3 mm. The black lines indicate the positions of umbral and penumbral boundaries along the cuts. Adapted from Loukitcheva et al. (2017).
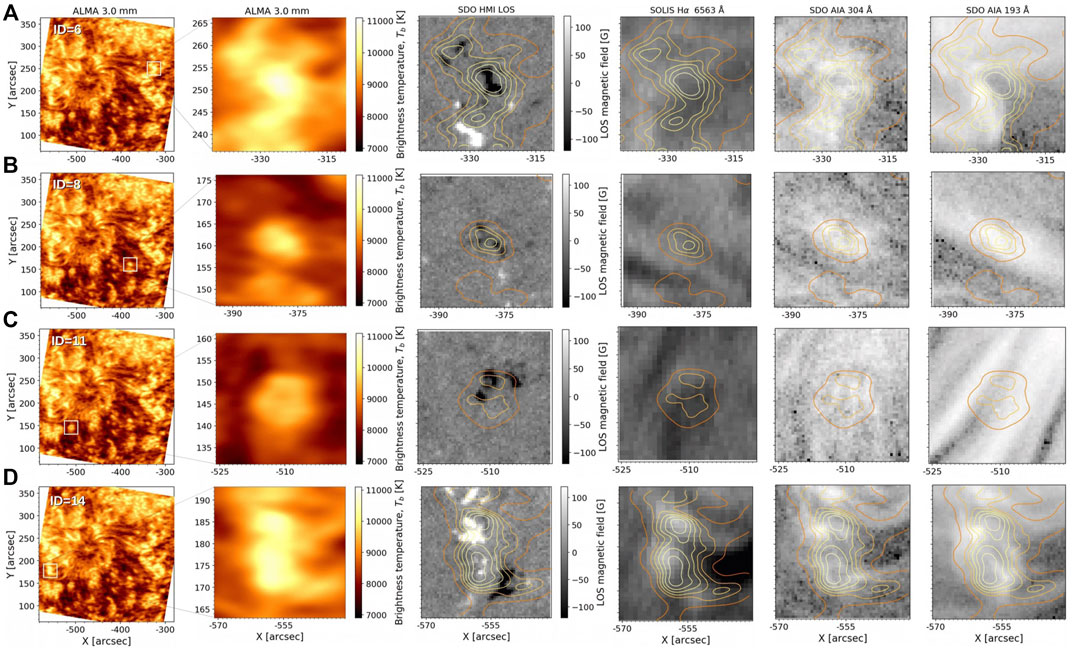
FIGURE 2. (A–D) four examples of comparison between ALMA Band 3 brightness structures (second column) observed within the FOV of the AR 12470 on 16 December 2015 (first column) and HMI/SDO magnetogram (third column), SOLIS Hα core 6563A (fourth column), AIA/SDO 304 and 193A (fifth and sixth columns, respectively). ALMA contours at 9000, 9500, 9750, 10000, 10250 and 10500 K are overlaid in each panel. White rectangles in the first column mark the structures of interest. From Brajša et al. (2021). Reproduced with permission ⓒ ESO.
However, Iwai et al. (2017) could not make clear conclusions about the origin of the central brightness from the available observational data. The authors suggest at least three possible explanations of the discovered brightness feature were proposed. According to a first explanation, the observed central brightness could be an intrinsic property of sunspots, not detected before only because of the insufficient resolution of earlier observations. In favor of this explanation is the fact that similar brightness enhancement in the umbral center was also seen in the Band 3 observations on the following day, implying that it is a steady or recurrent phenomenon. Moreover, the brightness of the central umbral feature is in agreement with some of the umbral atmospheric models (see, e.g., Loukitcheva et al., 2017, and below). Terminologically this would mean that not an “umbral brightness enhancement” but rather a “penumbral darkening” was observed. These different brightness temperatures do not necessarily indicate relative temperatures at the same height in the atmosphere for these features, but may be a manifestation of the difference in heights of formations of the millimeter continuum in the sunspot and penumbra due to distinct electron density profiles in the various structures.
The observed brightness enhancement could also be a signature of dynamic umbral flashes, often seen as brightenings in the cores of chromospheric spectral lines, such as Hα and the Ca II IR triplet, due to the passage of the shock waves in the umbral chromosphere. This scenario is supported by a recent study of Chai et al. (2022a), Chai et al. (2022b), (see Sect. 3.2.2), who detected the presence of the 3-min oscillations in the umbra analyzing the 1-hour observational set in Band 3 from the following day, 17 December 2015. The observed temperature fluctuations in the sunspot of as much as ± 500 K, comparable to the magnitude of the temperature excess seen in the snapshot observation from the mosaic.
And the final explanation proposed in (Iwai et al., 2017) was that the observed umbral brightness enhancement is related to signatures of downflowing coronal material interacting with the dense lower atmosphere (seen in coronal plumes), as its location corresponded to footpoints of coronal loops seen at 171A inside the umbra, and inside the umbra there was also a region bright at 1330 and 1400A. Finally, it was concluded that additional millimeter observations with better spatial and temporal resolution are required to understand the detected umbral brightness enhancement.
Loukitcheva et al. (2017) extended the study of Iwai et al. (2017) by analyzing the observations of the same sunspot but in Band 6 (a wavelength of 1.3 mm), and by comparing ALMA observations at the two wavelengths with the predictions of sunspot umbral and penumbral models. To account for radial brightness inhomogeneities seen in the structure of sunspot umbra and penumbra in both Band 3 and Band 6, the authors distinguished between inner and outer umbra, as well as between inner and outer penumbra when analyzing ALMA images. The distribution of brightness in the umbra in Band 6 was found to differ significantly from the distribution in Band 3 (Figure 1). In contrast to the Band 3 central brightness enhancement, the central part of umbra showed a temperature depression of 700 K relative to the QS level in Band 6, making it the coolest (≈5300 K) feature of the sunspot in Band 6 maps, while the outer umbra is significantly (≈1000 K) brighter.
ALMA sunspot observations have also resolved for the first time the penumbral structure in both bands. In Band 6 the penumbra was, on average, ≈ 1000 K hotter than the umbra with the larger difference between the inner and the outer parts of the penumbra (≈500 K) than between the outer penumbra and the surrounding plage (≈150 K). This result agrees with the presence of the superpenumbra (see, e.g. Giovanelli and Jones, 1982; Leka and Metcalf, 2003; Solanki, 2003), the idea that at chromospheric heights the sunspot’s magnetic field expands significantly beyond the photospheric boundary of the sunspot, so that there is essentially no difference in the appearance of the outer penumbra and the adjacent AR plage, which is dominated by sunspot magnetic fields. In Band 3 the penumbra shows up as a dark ring surrounding the umbra, with the inner part ≈100 K cooler than the outer part of the umbra and cooler than the QS. A clear brightness temperature gradient was found within the penumbra at both wavelengths (Figure 1) with brightness increasing from inside to outside by ≈ (400–500) K. In addition, the structure of the outer penumbra at both wavelengths was similar to that of the surrounding plage region.
The measured brightness temperatures for different parts of umbra and penumbra at the two ALMA wavelengths were compared with the expected mm brightness calculated from a number of selected sunspot models (Figures 3, 4). The models differ from each other, as well as from the reference QS model of Fontenla et al. (1993), in the location and extension of the temperature minimum region and in the height of the transition region. For improved wavelength coverage, the observed ALMA brightness in the two bands was supplemented with the earlier measurements at a number of other mm wavelengths.
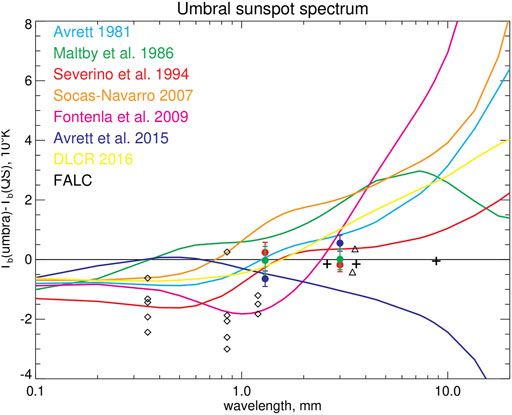
FIGURE 3. Difference between the umbral brightness (in temperature units) and the QS brightness, plotted as a function of wavelength for the umbral models, including the models of Avrett (1981), of Maltby et al. (1986), of Severino et al. (1994), of Socas-Navarro (2007), of Fontenla et al. (2009), of Avrett et al. (2015), and of de la Cruz Rodríguez et al. (2016), marked as DLCR 2016. The individual models are identified by color as indicated in the figure. The solid black line is the reference QS atmosphere FALC. The colored filled circles and error bars indicate the umbral ALMA mean brightness values together with the rms values for the inner umbra (blue), outer umbra (red), and the whole umbra (green) at 1.3 and 3 mm. The figure also depicts the BIMA measurements obtained at 3.5 mm by Loukitcheva et al. (2014) at a resolution of 12″ (triangles), the measurements at 0.35, 0.85, and 1.2 mm (diamonds) made by Lindsey and Kopp (1995) at a resolution of 14″–17″; and brightness observations at 2.6 and 3.5 mm obtained from the Nobeyama 45 m telescope by Iwai and Shimojo (2015) at a resolution of 15″, and at 8.8 mm from the NoRH by Iwai et al. (2016) at a resolution of 5″–10″ (plus signs). From Loukitcheva et al. (2017). Reproduced by permission of the AAS.
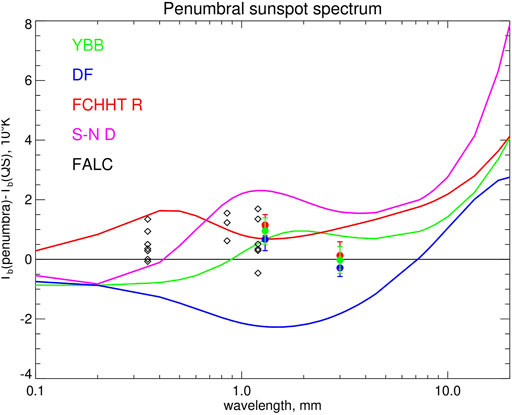
FIGURE 4. Same as in Figure 3 for the penumbral models of Yun et al. (1984) (1984; green), Ding and Fang (1989) (1989; blue), Fontenla et al. (2009) model R (red), and Socas-Navarro (2007) model D (violet). The colored filled circles and error bars indicate the observational penumbral mean values with the rms values for the inner penumbra (blue), the outer penumbra (red), and the whole penumbra (green) at 1.3 and 3 mm. The diamonds indicate the brightness measurements at 0.35, 0.85, and 1.2 mm from Lindsey & Kopp (1995). From Loukitcheva et al. (2017). Reproduced by permission of the AAS.
None of the analyzed umbral models provided an outstanding fit to the observations. However, the umbral model of (Severino et al., 1994) showed the best agreement for the ALMA observations of the inner umbrae in both bands among the models considered in this work. It also provided the best fit to the sunspot data from the earlier works (Figure 3). The authors concluded that the chromospheric temperature gradient in the model resembles the actual temperature gradient in the umbral chromosphere. According to this model, the bulk of the emission in Bands 6 and 3 comes from the heights of 1100 km and 1500 km in the umbral chromosphere, respectively, while the QS emission, estimated from the FALC model, is formed ≈500 km higher at both wavelengths. This model is consistent with that derived by de Oliveira e Silva et al. (2022) (2022, see Section 3.1) using a data-constrained model based on three different millimeter wavelengths and extrapolated chromospheric magnetic fields. One notable difference is that their model does not reach the same low temperatures in the sunspot umbra (Tmin of 4900 vs. 2900 K). Further work by Bogod et al. (2019) combined the ALMA sunspot observations with data from RATAN-600 in the frequency range 3–17 GHz and showed that the crucial wavelengths for capturing the transition region temperature rise lie between 3 and 18 mm.
In contrast to the numerous umbral models, only a few penumbral models that include the chromosphere have been published. The authors used four penumbral models from the literature for comparison with the observed brightness at the two ALMA wavelengths and also the penumbral measurements at short wavelengths from Lindsey and Kopp (1995). No penumbral model gave a really satisfactory fit to the analyzed measurements (Figure 4). Interestingly, the two models that came closest to being consistent with the data were found to be quite distinct in their thermal profiles and in the heights at which the 1.3 and 3 mm radiation is emitted. These results prevented the authors from making any certain conclusion about the best model fit to the penumbral data. The penumbral model derived by de Oliveira e Silva et al. (2022) reaches a similar minimum temperature as their umbral model, but a much slower decrease in density which correspondingly pushes the transition region ∼800 km higher.
The work of Loukitcheva et al. (2017) demonstrated that multi-wavelength ALMA data can be used to validate or rule out models of the umbral/penumbral atmospheres, and can also add important constraints to any new empirical models. At the same time, for a definite determination of the temperature gradient in the solar chromosphere at the heights where mm emission is formed, additional ALMA sunspot observations are required.
3.2.2 Sunspot oscillations
Observations of the same AR 12470 were used by Chai et al. (2022a,b) to study oscillations and wave propagation in sunspots for the first time. The one-hour ALMA Band 3 sequence acquired with a cadence of 2 s on 2015 December 17 was analyzed together with Hα spectral imaging observations from the Goode Solar Telescope (GST) operating at the Big Bear Solar Observatory, AIA/SDO and IRIS. Prominent 3-minute oscillation power was detected within the umbral boundaries in the ALMA data (Figure 5D), being stronger in the western part and weaker in the eastern part of the umbra. ALMA temperature variations demonstrated a sawtooth pattern (a tendency for a gradual rise and a steeper drop), which together with the amplitudes of brightness variations and phase relative to Hα Doppler velocity from GST, provided new exciting information about the three-minute-oscillatory behavior in sunspots. The authors concluded that the mm temperature fluctuations are in general consistent with propagating acoustic waves, although the nature of the asymmetry (gradual rise, steeper fall) was opposite what would be expected due to simple nonlinear steepening. Interestingly, penumbral 5 min oscillations, that were found in Hα (Figure 5C), were not detected in the ALMA Band 3 data (Figure 5E).
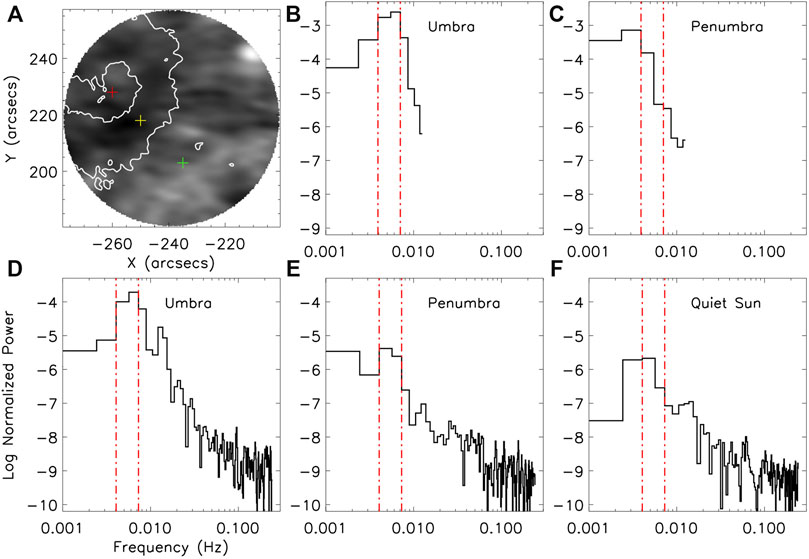
FIGURE 5. (A) ALMA Band 3 image of AR 12470 with 3 marked locations: in the sunspot umbra (a red plus sign), penumbra (yellow), and a quiet-Sun region (green); and (B–F) corresponding Fourier power spectra. The white contours in panel (A) mark the boundaries of the umbra and the penumbra, respectively. Panels (B,C) display the Fourier power spectra of GST Hα near blue wing (−0.4 (A). (D–F) of ALMA Band 3 data. The 3 min oscillation range is marked with red dotted–dashed lines. From Chai et al. (2022a). Reproduced by permission of the AAS.
3.3 Comparison of ALMA brightness with other chromospheric diagnostics
Comparisons between different observational parameters provide a key to the assessment of the diagnostic power, as well as to studying the physics of the observed solar structures. For the chromospheric diagnostics, good agreement is expected between the gas (radiation) temperatures deduced from the intensities of the millimeter and UV measurements, based on earlier low-resolution observations and expectations about the heights of formation from solar atmospheric models. With the onset of high-resolution and high-cadence ALMA observations, detailed comparison of spatially resolved morphological features within active regions has also become possible.
Bastian et al. (2017), Bastian et al. (2018) presented the first quantitative comparison between ALMA mm and IRIS UV chromospheric emissions from the sunspot umbra, plage, and quiet-Sun regions observed in AR 12470 on 2015 December 18 in Band 6. The authors reported a clear correlation between ALMA Band 6 (1.25 mm) brightness temperatures and radiation temperatures inferred from IRIS/Mg II h2v and h2r peak intensities, although with significant scatter (Figure 6). Additionally, a compressed range of radiation temperatures of Mg II lines as compared to the Band 6 brightness temperatures and an offset between the temperatures at the two wavelengths were detected. Among the considered AR features, the correlation coefficient was found to be higher in the umbra and plage, and lower in the quiet Sun. They attributed some of the scatter in the between this ALMA and IRIS diagnostics to the decoupling of the Mg II source function from the local conditions, as well as differences in the heights of formation of the different spectral lines and continuum emissions.
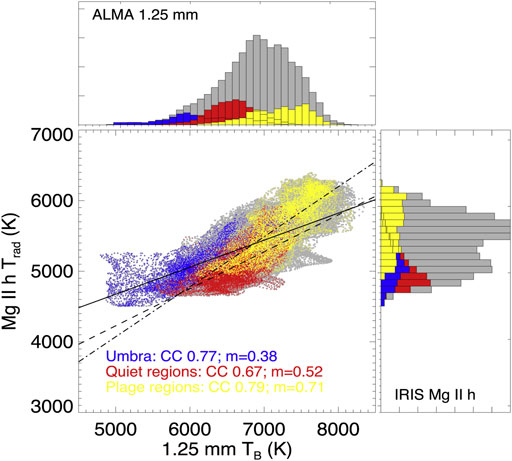
FIGURE 6. A scatter plot of IRIS Mg II h line radiation temperatures versus the ALMA 1.25 mm brightness temperatures together with the corresponding histograms. Gray points represent all pixels; blue points for the umbra; red for the quiet-Sun areas; and yellow for the plage. Linear fits to pixels in the umbra, quiet, and plage pixels are shown with a solid, dashed, and dotted–dashed line, respectively. From Bastian et al. (2018). Reproduced by permission of the AAS.
Using the same ALMA and IRIS observations Jafarzadeh et al. (2019) obtained similar results, comparing ALMA Band 6 brightness temperatures with radiation temperatures from Mg II for each of its h and k line features individually. They took into account the observation times for each location in the IRIS slit raster and ALMA mosaic, which sampled the region with overlapping but different patterns. For their analysis, they considered subsets of pixels where the sampling time difference in the pixel-to-pixel relationships was smaller than 2 or 0.5 min. As a result, the authors used only 28% and 8% of the spatial pixels, respectively, with only very few data points for analysis in the umbra itself. Good pixel-to-pixel correlations were found between most of the IRIS UV channels and ALMA Band 6 in all active region features (except the umbra), with the strongest correlation for the pair C II line in the FUV - ALMA Band 6. The authors concluded that the spatial variation of the UV radiation temperatures is similar to that of the ALMA Band 6 in these regions. However, we note that many of these active region features have relatively high brightness temperatures at 1.25 mm compared to quiet Sun regions, where the correlation between temperatures derived from Mg II and ALMA Band 6 might not be so strong.
In the umbral pixels, Jafarzadeh et al. (2019) found a very low correlation between the temperatures derived from Band 6 and Mg II h, much lower than what was found by Bastian et al. (2017, 2018), 0.04 vs. 0.77, respectively. Moreover, improved but still low correlations were detected for all the considered IRIS diagnostics (Figure 7). The authors speculated that such a significant difference in the umbral correlation coefficients could be due to a large uncertainty arising from the very few data points used. It might be important that the exact criteria for selecting umbral regions is somewhat different between these two works, and the mask used by Bastian et al. (2017) might have included some of the inner penumbral regions. However, Jafarzadeh et al. (2019) noted that in the umbra the time differences between diagnostics can be particularly essential, since dynamic events, e.g., umbral oscillations, can produce changes in the umbra on time scales shorter than 2 min, with their Band 6 vs. Mg II h correlation coefficients showing a slight improvement in the umbra when the allowable time differences between observables were reduced from 2 to 0.5 min (but interestingly no change for the Mg II k or C II correlation coefficients).
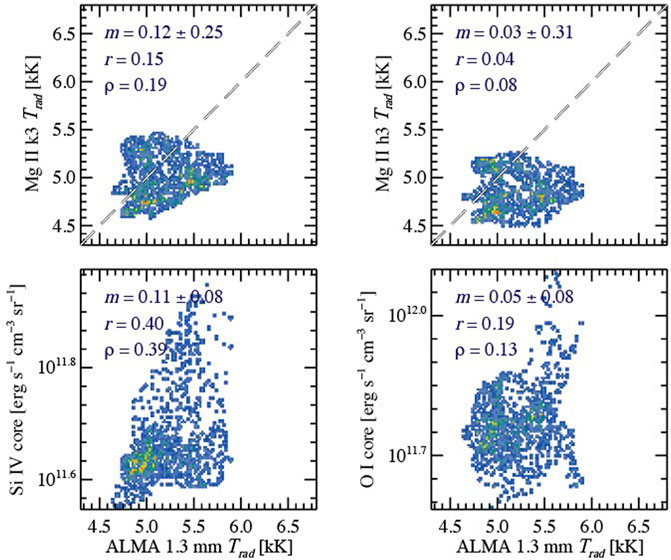
FIGURE 7. Scatter plots of radiation temperatures for IRIS NUV and FUV line features versus the ALMA 1.25 mm brightness temperatures limited to pixels in the umbral region. The density of the scatter points is denoted with the colours: the highest density number is coloured in red, the lowest density in dark blue. The regression slope of the linear fit (m), the Pearson correlation coefficient (r), and the Spearman’s rank correlation coefficient are listed for each relationship. From Jafarzadeh et al. (2019).Reproduced with permission ⓒ ESO.
Recently Chintzoglou et al. (2021a) reported much lower correlation coefficients found between Mg II and ALMA Band 6 in the leading part of NOAA AR 12651 observed on 2017 April 22. The observed FOV contained parts of a plage region with strong magnetic flux that included impulsive behavior such as dynamic fibrils. The authors employed an empirical approach and isolated plage elements from their surroundings using a magnetogram signal threshold of 100 G and also excluded such elements as pores and cool features in the superpenumbra. After applying these strict segmentation criteria and achieving very high time synchronization between IRIS and ALMA observations, the highest correlations were obtained for the combinations of ALMA Band 6 with Si IV or C II, but the degree of correlation between Mg II k and ALMA Band 6 was found to be relatively poor (∼0.5). The authors claimed that the scatter in the chromospheric diagnostics comparison is more significant than was previously thought and based on the obtained correlation coefficients speculated that even though both Mg II and ALMA Band 6 are sensitive to a similar range of temperatures, the formation height for ALMA Band 6 emission is above that of Mg II for most wavelengths along the Mg II line. Chintzoglou et al. (2021a) concluded that all three diagnostics, ALMA Band 6, C II, and Si IV, have formation heights relatively close to one another and are sampling similar parts of structures in the plage.
However, Hofmann et al. (2022) showed evidence based on spectroscopic inversions of the Ca II 8542 Å and Na I D1 5,896 Å lines compared with simultaneous ALMA observations that the height of formation of the Band 6 line can be highly variable, as was already explored using simulations by Loukitcheva et al. (2015). In particular, the authors suggest that relatively high temperatures (
3.4 Thermal diagnostic of plages
While the characterization of the thermal structure above sunspots needs more observations, sampling multiple sunspots, our understanding of the temperature above strong magnetic field concentrations above plages and network regions has been informed by multiple ALMA observations (see Jafarzadeh et al., 2021, for an overview of several plage observations). In general, above strong concentrations of magnetic fields, the brightness temperature in Band 3 tends to show regions of high temperatures, reaching up to 10–12 kK in isolated regions of a few arcseconds in diameter (i.e., marginally resolved with typical beam widths), embedded by a generally diffuse area of temperatures of 8–10 kK (above the quiet Sun average of 7.3 kK). In Band 6, similar locations with high temperatures (up to 9–10 kK) are sometimes seen above strong magnetic network. There have been a few cases where the same region was observed with both Bands in sequence, and a similar distribution of hot features can be seen in both bands (see Hofmann et al., 2022, for a direct comparison of a plage in both ALMA bands).
One notable feature of the plage and network observations is that features with high brightness temperatures are seen to extend away from the photospheric magnetic field concentrations. These features are seen to project approximately 10 arcseconds (7 Mm) into the internetwork. Beyond or in between these features, the brightness temperatures drop down to 6 kK or lower. They are most easily seen in the Band 3 observations, but are also sometimes present in Band 6 as well.
By comparing these features with simultaneous observations of the Hα line obtained with IBIS, Molnar et al. (2019) showed that these features correspond to the chromospheric fibrils extending outward from the magnetic concentrations and expanding into a more horizontal canopy. Even more intriguing, they showed a very direct relationship between the ALMA fibrils and the structures seen in maps of the width of the Hα line profile (see Figure 8). This was not entirely unexpected based on earlier studies showing the temperature sensitivity of the Hα line width (Cauzzi et al., 2009) and theoretical investigations of Hα line formation in the solar chromosphere (Leenaarts et al., 2012). The point-wise relationship between the brightness temperatures and the line widths was essentially linear, but the magnitude of the broadening of the Hα line (ranging from 0.9–1.25 Å) was greater than what would be produced by the temperature range indicated by the ALMA observations (6–12 kK). The authors use the 1-D FAL model to synthesize the millimeter continuum and Hα line profile, essentially reproducing the observed relationship. They find the observed coupling between these two diagnostics is in large part driven by changes in the n = 2 level population of hydrogen. As this parameter increases in the atmosphere, it also leads to and increased ionization fraction of hydrogen, a greater electron density, and a higher height of formation of the 3 mm continuum, closer to the steep temperature rise of the transition region. At the same time, a larger column mass of n = 2 hydrogen atoms leads to an opacity broadening of the Hα line (similar to a curve-of-growth effect). Tarr et al. in this collection reproduce the strong correlation between the Band 3 brightness temperature and Hα line width in their data set, but observe a more bimodal distribution, with two different slopes.
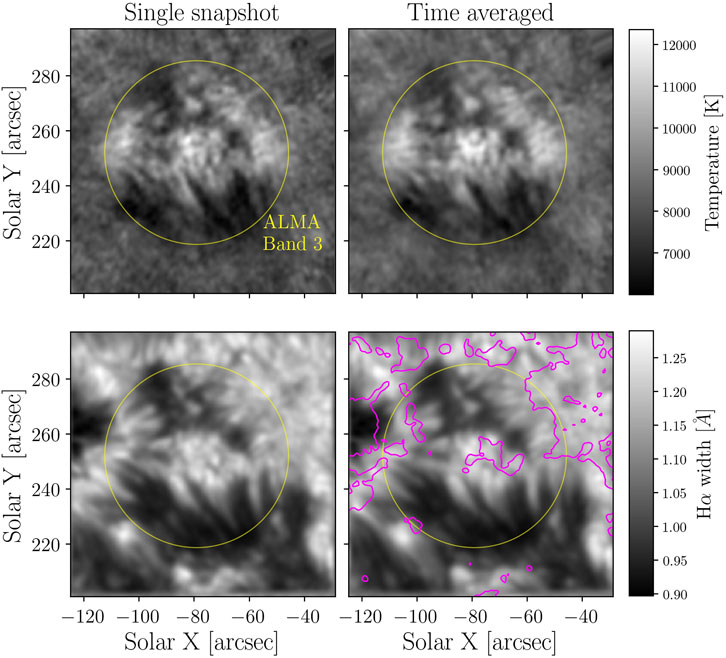
FIGURE 8. Maps of ALMA intensity (top row) and IBIS Hα line width (bottom row), the latter smoothed to match the resolution of the ALMA data. The left column shows the two parameters at single time step of the observations, while the right column shows the same two parameters averaged over the 10 minutes of a continuous ALMA observation block. The yellow circle has a diameter of 66″, slightly larger than the usable FOV of ALMA. The purple contours show areas with magnetic field strength above 500 Gauss, as measured by HMI. From Molnar et al. (2019). Reproduced by permission of the AAS.
In general, higher temperatures are seen above and around plages and magnetic network, compared to internetwork and the quiet Sun average. Disentangling the extent this reflects an actual increased temperature at comparable densities to the quiet Sun, or whether it is the result of a larger electron density and a corresponding increase in the height of formation of the millimeter continuum, will require additional multiwavelength observations and improved modelling.
3.5 Active region transient brightening and heating events
The two most widely discussed mechanisms for chromospheric heating include magneto-acoustic wave dissipation and small-scale magnetic reconnection (Carlsson et al., 2019). Possible signatures of both mechanisms have been reported in ALMA active region observations in the form of brightness enhancements, some of them quasi-periodic, with spatial scales at the limit of the current ALMA resolution for solar observations
Signatures of magnetic reconnection at the heights of the chromosphere and transition region might be present for features such as Ellerman bombs (EBs), ultraviolet bursts (UVBs), and flaring (dynamic) AR fibrils (FAFs). Some of these were studied by da Silva Santos et al. (2020b) in ALMA Band 3 observations of a group of pores and an arch-filament system south-west of a large sunspot in NOAA AR 12738 on 13 April 2019. The visibility of reconnection events at mm wavelengths, their formation heights, as well as their role in the energy balance in the chromosphere, were investigated using a snapshot of a Bifrost 3D r-MHD simulation of flux emergence. The authors found multiple bright compact mm-bursts (analogues of small nanoflares) with the temperatures above 9 kK up to 14 kK, with corresponding brightenings seen in the AIA EUV images from transition region and coronal heights (e.g. 304, 171 Å), but not the UV continuum at 1600 and 1700 Å. They suggest that these heating events could be the millimeter emission from UVBs, but did not have simultaneous IRIS observations to confirm that possibility. They used the temperature profiles derived from the AIA images to estimate that up to 5% of the signal at 3 mm could come from higher-temperature coronal plasma along the line of sight. They also detected FAF-like events in the Band 3 brightness, showing up as rapid motions of hot (over 10 kK) plasma launched from bright kernels with the visible velocities of 40–300 km/s. The mm FAFs were found to correspond to warm canopy fibrils connecting magnetic regions of opposite polarities. At the same time, no EBs were detected in the ALMA Band 3 images at the resolution of the observations (≃ 1.2″).
In a follow-up study, da Silva Santos et al. (2022a) analyzed the same ALMA Band 3 observations together with the optical spectropolarimetric observations from the CRISP instrument (Scharmer et al., 2008) at the Swedish Solar Telescope (SST) in the Fe I 6173A and the Ca II 8542A lines. The authors employed non-LTE STiC inversion package, field extrapolations using a magnetohydrostatic model based on the SST and HMI data, and the 3D r-MHD numerical simulation based on the MURaM code to study the processes of ongoing magnetic flux emergence into a preexisting arch-filament system of AR 12738. They found elongated patches of enhanced (over 3 kK relative to QS values) Band 3 brightness temperatures and bright Ca II 8542A lines profiles at the location of short low-lying chromospheric fibrils, where overlying arch-filament system is seen in absorption in the AIA 304 Å channel. From the computed heating rates and their comparison with the chromospheric diagnostics, the authors concluded that dissipation in current sheets might be, at least, a locally dominant source of atmospheric heating, producing brightenings in chromospheric diagnostics within ARs (Figure 9). The radiative energy losses were estimated to be in the range from 3 to 5 kW/m2 in regions where the 3 mm brightness temperature is over 9 kK. Although da Silva Santos et al. (2022a) could not unambiguously link the observed millimeter emission to heating in current sheets based on the analyzed data alone, they demonstrated that the ALMA Band 3 emission in their observations forms above Ca II 8542A line, but below the He II 304 Å line, strongly suggesting that it originates in this shear layer. The heating itself occurs on spatial scales that are not resolved with the
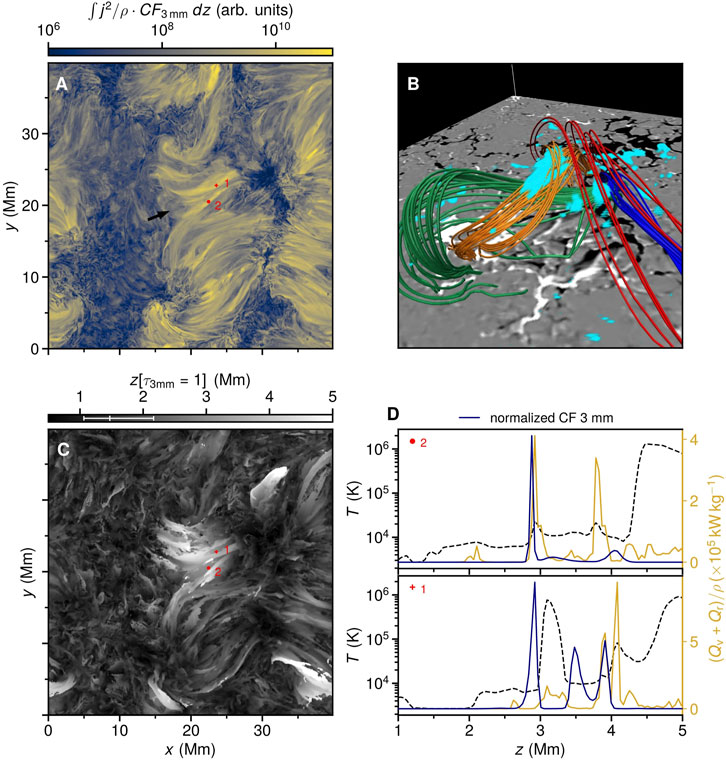
FIGURE 9. (A) Integrated j2/ρ weighted by the contribution function of the Band 3 emission (CF3mm); (B) Extrapolated magnetic field lines overlying photospheric magnetogram with the CF3mm depicted with blue shade from the region indicated by the arrow in (A); (C) heights of formation of the Band 3 emission; (D) temperature (dashed lines), total heating rates per mass (yellow lines), and normalized CF3mm (dark blue lines) as a function of height at two locations indicated in (A) and (C). From da Silva Santos et al. (2022a). Reproduced with permission ⓒ ESO.
3.5.1 (Magneto-)acoustic shocks
The diagnostic value of the ALMA measurements in the framework of spectroscopic inversions using some of the first ALMA data in Bands 3 and 6 was studied by da Silva Santos et al. (2020a). The authors performed inversions of IRIS Mg II observations and used ALMA data as an additional constraint for the STiC non-local thermodynamic equilibrium (NLTE) inversion code. ALMA and IRIS co-observed part of a plage in active region NOAA AR 12651 on 22 April 2017. The work demonstrated that the combination of IRIS and ALMA is a powerful tool for diagnosing a wider range of physical conditions in the atmosphere than IRIS alone, and the Mg II lines alone may not be sufficient to infer accurate chromospheric temperatures and microturbulence due to well-known NLTE effects (Figure 10). The presence of localized enhanced brightness in ALMA maps of plage was explained as non-equilibrium hydrogen ionization effects following acoustic shocks in the chromosphere driven by the 3–4 min wave oscillations detected in the Mg II lines. Hofmann et al. (2022) performed tests that showed that the non-LTE hydrogen ionization effects need to be taken into account when performing spectroscopic inversions to better estimate the temperatures at chromospheric heights. In their analysis, the authors used only an approximation to the full non-equilibrium ionisation balance, namely statistical equilibrium, and thus the results of their inversions of ALMA data still have an appreciable uncertainty in the heights of formation. This uncertainty is greater for the millimeter continuum than for spectral lines, since the opacity for the latter is much less sensitive to the electron density. They further showed that the ALMA Band 3 brightness temperatures improved inversion outputs, essentially by enforcing a temperature rise at the top of the chromosphere. However, the inclusion of Band 6 often led to unrealistic atmospheres, likely because poorly constrained estimates of the electron density led to errors in reconciling the height of formation of the 1.2 mm continuum with the overlapping contribution function of the Ca II 8542 Å line.
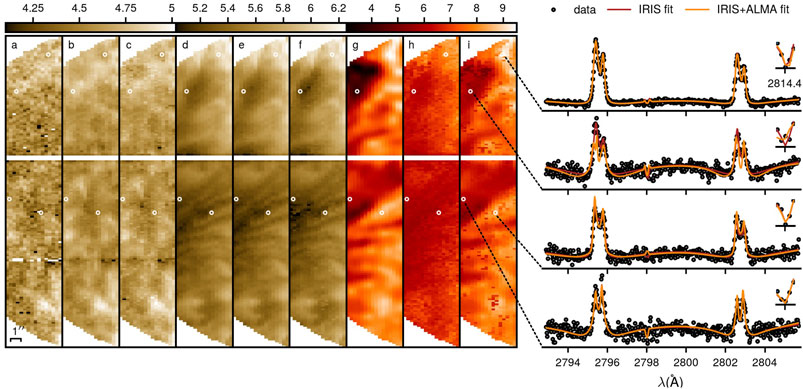
FIGURE 10. Comparison of the observed (a,d,g), synthetic from IRIS fit (b,e,i) and synthetic from IRIS + ALMA fit (c,f,i) temperature maps (kK) as a function of optical depth in a plage region: for averaged continuum at 2800 A (a–C), for averaged k core wavelengths (D–F), and for Band 6 (G–I). The panels on the right depict observed and synthetic IRIS spectra at selected locations. From da Silva Santos et al. (2020a). Reproduced with permission ⓒ ESO.
The work of (Chintzoglou et al., 2021a) also explored the potential of ALMA Band 6 observations for measuring the temporal evolution of plasma temperature in regions dominated by the passage of chromospheric oscillations and presented indications of heating by shocks propagating in the plage chromosphere. In ALMA Band 6 measurements of the brightness temperature in dynamic fibrils with the resolution of 0.7″ × 0.8″, the authors detected intensity enhancements of the order of 10%–20% above a basal value of 7500 K with a decay time back down to the basal levels of about 60–120 s. Sometimes these brightenings recurred with withing ≃120 s, and in some cases corresponded to times of blueshift excursions seen in the Mg II k and Si IV lines observed with IRIS (Figure 11).
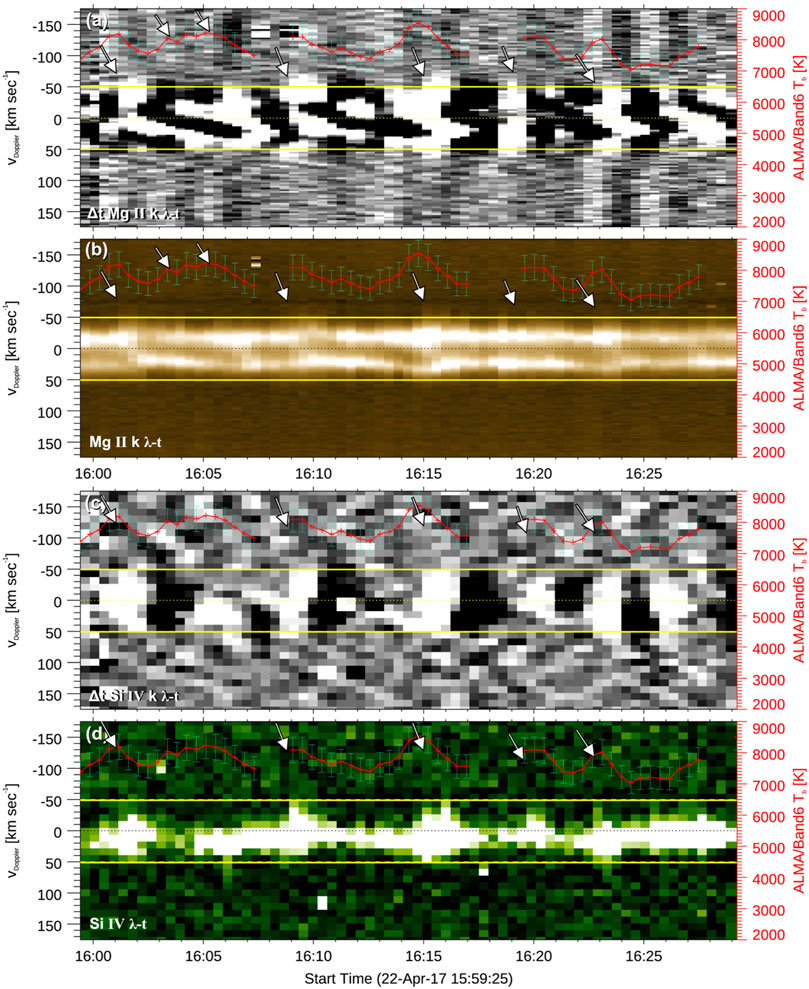
FIGURE 11. Signatures of recurrent shocks in the selected 1″ × 1″ area in plage in the form of the wavelength–t plots for (B) Mg II k and (A) its time derivative, (D) Si IV and (C) its time derivative. ALMA Band 6 brightness temperature is overplotted in red in all panels. The rest-wavelength position is plotted with a dotted line in all panels. The increases in mm brightness correlate with blueshifts, suggesting chromospheric heating due to the passing of shocks in Si IV and Mg II (indicated by arrows). From Chintzoglou et al. (2021a). Reproduced by permission of the AAS.
Recently (Narang et al., 2022), have presented a statistical comparison of oscillations in a plage region with focus on the correlation of power distribution of ALMA oscillations with the oscillations detected in the coordinated observations from IRIS and SDO obtained on 22 April 2017 (2016.1.00050.S.). A presence of oscillations in a wide range of periods (up to 35 min) was found in the ALMA and the AIA EUV images, with 12–14 min periods being the most prominent, while shorter dominant periods of 4–7 min were found for the AIA UV images (Figure 12). At the same time, no correlation was found in the spatial distribution of dominant periods and in the power in the considered intervals of periods between ALMA and any other considered diagnostics. The authors speculated that the result could be due to the large variations in the height of formation in the 1.25 mm continuum observed by ALMA. Analyzing the same ALMA plage data, Guevara Gómez et al. (2021) detected high-frequency brightness oscillations with periods less that 2 min in the three small bright features within the Band 3 FOV. The noted an anti-correlation between fluctuations in brightness temperature and variations of size of three features with changes below the resolution of the Band 3 data (Figure 13). The authors suggested that this could indicate the presence of MHD fast sausage-mode waves in them, but such a correlation could also be produced by a time varying beam size during the ALMA time series.
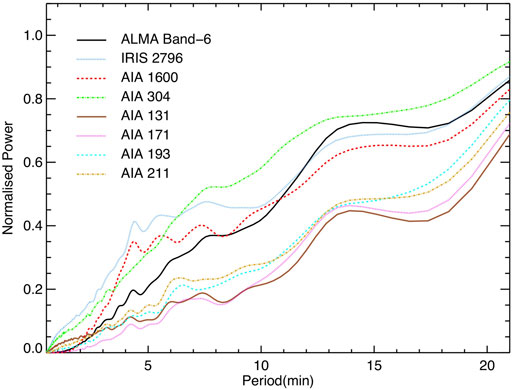
FIGURE 12. Average power spectra of the ALMA Band 6, IRIS 2796 A, and 6 selected AIA passbands in a plage region. From Narang et al. (2022). Reproduced with permission ⓒ ESO.
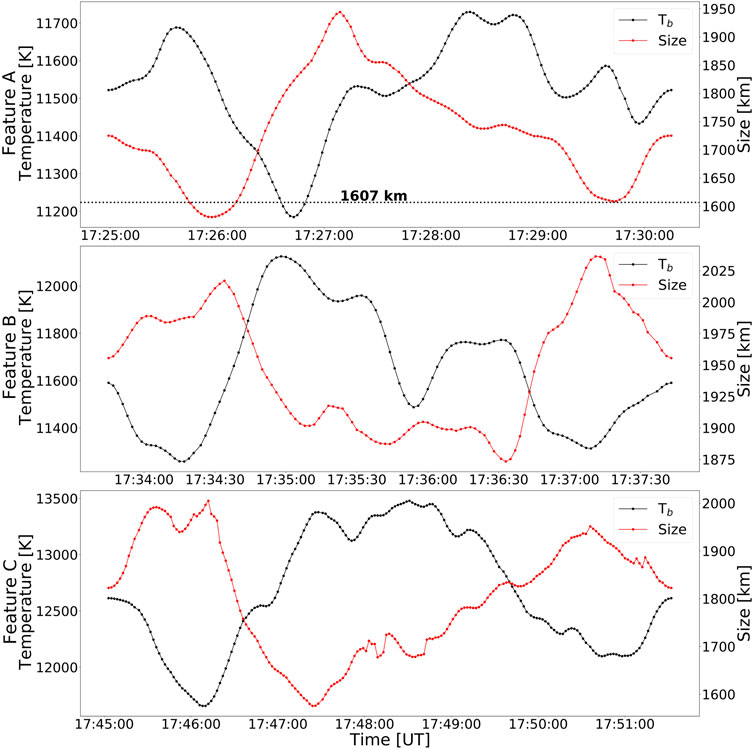
FIGURE 13. Temporal variations in brightness temperature (black, left axis) and size (red, right axis) of the three small bright features detected in a plage region. The horizontal dotted line marks the size of a spatial-resolution element. From Guevara Gómez et al. (2021).
Observational constraints on the chromospheric heating contribution from acoustic waves with frequencies between 5 and 50 mHz were presented in Molnar et al. (2021). The authors studied high frequency dynamics of the chromosphere using coordinated observations from ALMA and the Interferometric Bidimensional Imaging Spectrograph (IBIS) at the Dunn Solar Telescope (DST, Dunn and Smartt, 1991) on 23 April 2017. The obtained high-cadence data set contain spectral observations covering from the upper photosphere and the middle (Ca II 854.2 nm, Hα, and ALMA Band 6) and upper chromosphere (ALMA Band 3). They focused on the velocity diagnostics derived from Ca II 854.2 nm, as tracers of upward propagating compressive waves, and on the brightness temperature fluctuations from ALMA Bands 3 and 6 as indicators of local heating from those waves. The FOV was partitioned into five different classes solar structures: penumbra, internetwork, fibrils, network and plage. The authors found a very similar power-law behavior in the high-frequency Fourier Power Spectrum Densities (PSDs) from 5 to 50 mHz in all the considered chromospheric observables: namely velocity measurements of the Hα and Ca II 854.2 nm line core intensities and velocities, and ALMA Bands 3 and 6 brightness temperatures. The authors found that the slopes of the spectral diagnostics’ power laws depend on the observed solar region, in particular, hotter regions (network and plage) exhibit less steep power law slopes than was found in cooler, more dynamic, regions. Tarr et al. in this collection find a similar power law behavior at high temporal frequencies and explore the effects of spatial downsampling and intermittent, ALMA-like temporal sampling on the measured power-spectral density.
Molnar et al. (2021) then used RADYN model runs to generate synthetic observables, after accounting for a frequency-dependent transmission coefficient that accounts for power attenuation due to radiative transfer effects, and identify the range models with input power that matched the Ca II 8542 Å velocities and ALMA brightness temperature fluctuations. Using the model-derived transmission coefficient and assumptions about the local densities, they inferred and average acoustic flux from the Band 6 time series of 0.7 kW/m2 (with spatially resolved values ranging from ∼200–2000 kW/m2). For the Band 3 time series, observing emission expected to be formed higher in the atmosphere, the average flux was only 0.03 kW/m2, perhaps indicating the significant dissipation of the wave in between the two regions of formation (Figure 14). Using instead the Ca II 854.2 nm line Doppler velocity measurements, the estimations of the derived acoustic flux were in the range from 0.1 to 1.0 kW/m2. The amount of flux was the highest in the internetwork and plage regions, and the lowest in the penumbra and fibril regions, potentially due to the dissipation of waves lower down, below the inclined magnetic canopy, or the conversion of the waves to other wave modes. The average acoustic flux dissipated between the two layers probed by ALMA was found to be insufficient for heating of the middle chromosphere, but could potentially be a significant contribution to its energy budget, especially in localized regions where the acoustic flux was estimated to exceed 2 kW/m2.
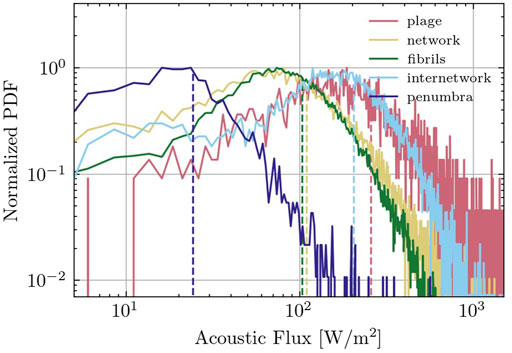
FIGURE 14. Acoustic flux distributions derived from ALMA Bands 3 and 6 brightness data and from the Ca II 854.2 nm line Doppler velocity data based on the RADYN models. The vertical lines mark the medians of the distributions. From Molnar et al. (2021). Reproduced by permission of the AAS.
4 Conclusion: Prospects for future observations and use of ALMA data
The main goal of this review was to demonstrate that, despite limited availability of appropriate observations, ALMA solar science of active regions has transformed from estimations and expectations to observational results and their quantitative interpretation. The applicability of solar ALMA data is extensive and their potential is huge (see, e.g. Wedemeyer et al., 2016). The presented here results have demonstrated that the best of the solar ALMA potential can be achieved when high-resolution ALMA data are paired with other spectral diagnostics, in particular in the ultraviolet and visible wavelength ranges. The synergy between ALMA and other chromospheric observations effectively expands the diagnostic capabilities of each wavelength and instrument.
Simulations and observations have shown that the typical heights of formation of the millimeter continuum at different wavelengths are highly variable, both spatially and temporally. The locations of the sources of the millimeter continuum emissions are more sensitive to the electron density profile than spectral lines which have been predominantly used in the past. This complicates the interpretation of the ALMA observations, but it also provides a critical test for advanced numerical simulations (motivating the inclusion non-equilibrium ionization of both hydrogen and helium (see, e.g. Golding et al. (2016)) in the chromosphere and incorporating the effect of the strong sunspot magnetic fields). In particular, the formation heights (and there must be an expectation that there may be a broad averaging of temperatures through multiple locations even along a single line of sight) of the millimeter continuum is strongly dependent on the run of electron density in the atmosphere, a parameter that is highly dependent on many of these hard-to-model physical processes and may not be well constrained by other diagnostics. Properly accounting for these effects in spectroscopic inversions will be challenging but will be essential to recovering fully realistic atmospheres above the photosphere (including constraining both the chromospheric temperature and turbulent motions over a wide range of heights). The possibility that some millimeter emission above sunspots is coming from transition region and coronal plasma will introduce additional complications in our interpretation of these observations.
As solar activity has returned and the 25th solar activity cycle is progressing, the hope of getting new AR observations, including more time sequences and a broader sampling of multiple sunspots, is growing. At the same time, ALMA capabilities for solar observations are getting more advanced: additional frequency bands providing diagnostics at both lower and higher heights, than the initial bands, are being added. The achievable spatial resolutions with ALMA in the allowed bands and array configurations is approximately one arcsecond, up to 0.6″ at the shortest wavelengths, which is still larger than the characteristic sizes of events we observe in the visible and UV at higher resolution. It would be advantageous to make possible the use of larger-baseline array configurations as well as to develop further interferometric reconstruction techniques for an extended object like the Sun, in order to archive higher spatial resolution and probe heating and temperature variations on smaller, more relevant scales. Capturing sporadic, impulsive events such as energetic flares would be highly valuable (Stepanov et al., 1992; Kundu et al., 1993) but will be a challenge given the small fields of view provided by the interferometric observations, especially for a facility under high observing pressure. Observations of flares will require the development (currently underway) of methods to avoid saturation or non-linear response of the receivers. The new fast-region-mapping mode for continuous active region scanning (albeit at low spatial resolution, 15–60″) with cadences of 10–30 s has been introduced, which may allow for more opportunities to capture flare profiles in these wavelengths (especially given the possibility for its independent use). The availability of circular polarization measurements is expected in the coming observing cycles, opening the possibility of direct evaluation of the magnetic field strength in the upper atmosphere.
Significant effort is being taken to make ALMA data practical and easy to exploit for scientists not specializing in radio interferometry. To this end, Henriques et al. (2022) released the first version of SALSA (The Solar ALMA Science Archive), a database of 26 science ready data sets of ALMA observations of the Sun obtained in 2017–2019. In the future, great benefits for solar AR science are expected from ALMA observations combined with multiwavelength spectropolarimetric capabilities in the photosphere and the chromosphere offered by Daniel K. Inouye Solar Telescope (DKIST, Rast et al., 2021). However, ALMA’s available observing windows are constrained by pointing limitations and typical weather conditions, making coordinated observations between ALMA and DKIST, as well as with the other solar observatories at different latitudes (and different weather conditions), severely time constrained. This will require efficient communication among facilities, as well as effective strategies to make reliable statistical comparisons when strict simultaneity is not possible.
Author contributions
All authors listed have made a substantial, direct, and intellectual contribution to the work and approved it for publication.
Funding
KR was supported by the National Solar Observatory (NSO). NSO is managed by the Association of Universities for Research in Astronomy, Inc., and is funded by the National Science Foundation (NSF). KR also acknowledges the support of NASA under the grant 80NSSC20K1282.
Acknowledgments
This paper makes use of the following ALMA data: ADS/JAO.ALMA#2011.0.000020.SV, ADS/JAO.ALMA#2016.1.00423.S, ADS/JAO.ALMA#2016.1.00050.S, ADS/JAO.ALMA#2016.1.00202.S, ADS/JAO.ALMA#2016.1.00788.S, ADS/JAO.ALMA#2016.1.01129.S, ADS/JAO.ALMA#2016.1.01532.S, ADS/JAO.ALMA#2017.1.00653.S, ADS/JAO.ALMA#2017.1.01672.S, and ADS/JAO.ALMA#2018.1.01518.S. ALMA is a partnership of ESO (representing its member states), NSF (United States), and NINS (Japan), together with NRC (Canada), MOST and ASIAA (Taiwan), and KASI (South Korea), in cooperation with the Republic of Chile. The Joint ALMA Observatory is operated by ESO, AUI/NRAO, and NAOJ.
Conflict of interest
The authors declare that the research was conducted in the absence of any commercial or financial relationships that could be construed as a potential conflict of interest.
Publisher’s note
All claims expressed in this article are solely those of the authors and do not necessarily represent those of their affiliated organizations, or those of the publisher, the editors and the reviewers. Any product that may be evaluated in this article, or claim that may be made by its manufacturer, is not guaranteed or endorsed by the publisher.
Footnotes
1The science verification data are available for download at .https://almascience.nrao.edu/alma-data/science-verification.
2ALMA data are available for download at https://almascience.nrao.edu/aq/.
References
Alissandrakis, C. E., Patsourakos, S., Nindos, A., and Bastian, T. S. (2017). Center-to-limb observations of the Sun with ALMA . Implications for solar atmospheric models. Astron. Astrophys. 605, A78. doi:10.1051/0004-6361/201730953
Avrett, E. H. (1981). “Reference model atmosphere calculation-the sunspot sunspot model,” in The physics of sunspots Editors Cram, L. E., and Thomas, J. H. 235–255.
Avrett, E., Tian, H., Landi, E., Curdt, W., and Wuelser, J. P. (2015). Modeling the chromosphere of a sunspot and the quiet sun. ApJ 811, 87. doi:10.1088/0004-637X/811/2/87
Bastian, T. S., Chintzoglou, G., De Pontieu, B., Shimojo, M., Schmit, D., Leenaarts, J., et al. (2017). A first comparison of millimeter continuum and Mg II ultraviolet line emission from the solar chromosphere. Astrophys. J. 845, L19. doi:10.3847/2041-8213/aa844c
Bastian, T. S., Chintzoglou, G., De Pontieu, B., Shimojo, M., Schmit, D., Leenaarts, J., et al. (2018). Erratum: “A first comparison of millimeter continuum and Mg II ultraviolet line emission from the solar chromosphere” (2017, ApJL, 845, L19). Astrophys. J. 860, L16. doi:10.3847/2041-8213/aac8dc
Bastian, T. S., Ewell, M. W., and Zirin, H. (1993). The center-to-limb brightness variation of the sun at lambda = 850 microns. Astrophys. J. 415, 364. doi:10.1086/173170
Bogod, V. M., Kal’tman, T. I., and Lukicheva, M. A. (2019). Millimeter observations at alma and in the microwave range with ratan-600. comparison for active regions on the sun. Geomagn. Aeron. 59, 783–788. doi:10.1134/s0016793219070077
Brajša, R., Skokić, I., Sudar, D., Benz, A. O., Krucker, S., Ludwig, H. G., et al. (2021). ALMA small-scale features in the quiet Sun and active regions. Astron. Astrophys. 651, A6. doi:10.1051/0004-6361/201936231
Brajša, R., Sudar, D., Benz, A. O., Skokić, I., Bárta, M., De Pontieu, B., et al. (2018). First analysis of solar structures in 1.21 mm full-disc ALMA image of the Sun. Astron. Astrophys. 613, A17. doi:10.1051/0004-6361/201730656
Carlsson, M., De Pontieu, B., and Hansteen, V. H. (2019). New view of the solar chromosphere. Annu. Rev. Astron. Astrophys. 57, 189–226. doi:10.1146/annurev-astro-081817-052044
Cauzzi, G., Reardon, K., Rutten, R. J., Tritschler, A., and Uitenbroek, H. (2009). The solar chromosphere at high resolution with ibis. iv. dual-line evidence of heating in chromospheric network. Astron. Astrophys. 503, 577–587. doi:10.1051/0004-6361/200811595
Chai, Y., Gary, D. E., Reardon, K. P., and Yurchyshyn, V. (2022a). A study of sunspot 3 minute oscillations using ALMA and GST. Astrophys. J. 924, 100. doi:10.3847/1538-4357/ac34f7
Chai, Y., Gary, D. E., Reardon, K. P., and Yurchyshyn, V. (2022b). Erratum: “A study of sunspot 3 minute oscillations using ALMA and GST” (2022, ApJ, 924, 100). Astrophys. J. 933, 247. doi:10.3847/1538-4357/ac7c1c
Chintzoglou, G., De Pontieu, B., Martínez-Sykora, J., Hansteen, V., de la Cruz Rodríguez, J., Szydlarski, M., et al. (2021b). ALMA and IRIS observations of the solar chromosphere. I. An on-disk type II spicule. Astrophys. J. 906, 82. doi:10.3847/1538-4357/abc9b1
Chintzoglou, G., De Pontieu, B., Martínez-Sykora, J., Hansteen, V., de la Cruz Rodríguez, J., Szydlarski, M., et al. (2021a). ALMA and IRIS observations of the solar chromosphere. II. Structure and dynamics of chromospheric plages. Astrophys. J. 906, 83. doi:10.3847/1538-4357/abc9b0
da Silva Santos, J. M., Danilovic, S., Leenaarts, J., de la Cruz Rodríguez, J., Zhu, X., White, S. M., et al. (2022a). Heating of the solar chromosphere through current dissipation. Astron. Astrophys. 661, A59. doi:10.1051/0004-6361/202243191
da Silva Santos, J. M., de la Cruz Rodríguez, J., Leenaarts, J., Chintzoglou, G., De Pontieu, B., Wedemeyer, S., et al. (2020a). The multi-thermal chromosphere. Inversions of ALMA and IRIS data. Astron. Astrophys. 634, A56. doi:10.1051/0004-6361/201937117
da Silva Santos, J. M., de la Cruz Rodríguez, J., White, S. M., Leenaarts, J., Vissers, G. J. M., and Hansteen, V. H. (2020b). ALMA observations of transient heating in a solar active region. Astron. Astrophys. 643, A41. doi:10.1051/0004-6361/202038755
da Silva Santos, J. M., White, S. M., Reardon, K., Cauzzi, G., Gunár, S., Heinzel, P., et al. (2022b). Subarcsecond imaging of a solar active region filament with ALMA and IRIS. Front. Astron. Space Sci. 9, 898115. doi:10.3389/fspas.2022.898115
de la Cruz Rodríguez, J., Leenaarts, J., and Asensio Ramos, A. (2016). Non-LTE inversions of the Mg II h & k and UV triplet lines. ApJL 830, L30. doi:10.3847/2041-8205/830/2/L30
de Oliveira e Silva, A. J., Selhorst, C. L., Costa, J. E. R., Simões, P. J. A., Giménez de Castro, C. G., Wedemeyer, S., et al. (2022). A genetic algorithm to model solar radio active regions from 3D magnetic field extrapolations. Front. Astron. Space Sci. 9, 911118. doi:10.3389/fspas.2022.911118
De Pontieu, B., Title, A. M., Lemen, J. R., Kushner, G. D., Akin, D. J., Allard, B., et al. (2014). The interface region imaging spectrograph (IRIS). Sol. Phys. 289, 2733–2779. doi:10.1007/s11207-014-0485-y
Dunn, R. B., and Smartt, R. N. (1991). High resolution telescopes at the national solar observatory. Adv. Space Res. 11, 139–148. doi:10.1016/0273-1177(91)90371-P
Efanov, V. A., Kislyakov, A. G., and Moiseev, I. G. (1972). Slowly varying component Spectrum of the solar radio emission at millimetre wavelengths. Sol. Phys. 24, 142–153. doi:10.1007/BF00231092
Fontenla, J. M., Avrett, E. H., and Loeser, R. (1993). Energy balance in the solar transition region. III. Helium emission in hydrostatic, constant-abundance models with diffusion. Astrophys. J. 406, 319. doi:10.1086/172443
Fontenla, J. M., Curdt, W., Haberreiter, M., Harder, J., and Tian, H. (2009). Semiempirical models of the solar atmosphere. III. set of non-LTE models for far-ultraviolet/extreme-ultraviolet irradiance computation. ApJ 707, 482–502. doi:10.1088/0004-637X/707/1/482
Giovanelli, R. G., and Jones, H. P. (1982). The three-dimensional structure of atmospheric magnetic fields in two active regions. Sol. Phys. 79, 267–278. doi:10.1007/BF00146244
Golding, T. P., Leenaarts, J., and Carlsson, M. (2016). Non-equilibrium helium ionization in an MHD simulation of the solar atmosphere. ApJ 817, 125. doi:10.3847/0004-637X/817/2/125
Guevara Gómez, J. C., Jafarzadeh, S., Wedemeyer, S., Szydlarski, M., Stangalini, M., Fleck, B., et al. (2021). High-frequency oscillations in small chromospheric bright features observed with Atacama Large Millimetre/Submillimetre Array. Phil. Trans. R. Soc. A 379, 20200184. doi:10.1098/rsta.2020.0184
Henriques, V. M. J., Jafarzadeh, S., Guevara Gómez, J. C., Eklund, H., Wedemeyer, S., Szydlarski, M., et al. (2022). The Solar ALMA Science Archive (SALSA). First release, SALAT, and FITS header standard. Astron. Astrophys. 659, A31. doi:10.1051/0004-6361/202142291
Hofmann, R. A., Reardon, K. P., Milic, I., Molnar, M. E., Chai, Y., and Uitenbroek, H. (2022). Evaluating non-LTE spectral inversions with ALMA and IBIS. Astrophys. J. 933, 244. doi:10.3847/1538-4357/ac6f00
Iwai, K., Koshiishi, H., Shibasaki, K., Nozawa, S., Miyawaki, S., and Yoneya, T. (2016). Chromospheric sunspots in the millimeter range as observed by the Nobeyama radioheliograph. ApJ 816, 91. doi:10.3847/0004-637X/816/2/91
Iwai, K., Loukitcheva, M., Shimojo, M., Solanki, S. K., and White, S. M. (2017). ALMA discovery of solar umbral brightness enhancement at λ = 3 mm. Astrophys. J. 841, L20. doi:10.3847/2041-8213/aa71b5
Iwai, K., and Shimojo, M. (2015). Observation of the chromospheric sunspot at millimeter range with the Nobeyama 45 m telescope. Astrophys. J. 804, 48. doi:10.1088/0004-637X/804/1/48
Jafarzadeh, S., Wedemeyer, S., Fleck, B., Stangalini, M., Jess, D. B., Morton, R. J., et al. (2021). An overall view of temperature oscillations in the solar chromosphere with ALMA. Phil. Trans. R. Soc. A 379, 20200174. doi:10.1098/rsta.2020.0174
Jafarzadeh, S., Wedemeyer, S., Szydlarski, M., De Pontieu, B., Rezaei, R., and Carlsson, M. (2019). The solar chromosphere at millimetre and ultraviolet wavelengths. I. Radiation temperatures and a detailed comparison. Astron. Astrophys. 622, A150. doi:10.1051/0004-6361/201834205
Kundu, M. R. (1970). Solar active regions at millimeter wavelengths. Sol. Phys. 13, 348–356. doi:10.1007/BF00153556
Kundu, M. R., White, S. M., Gopalswamy, N., and Lim, J. (1993). Interferometric observations of solar flares at 3 mm wavelength. Adv. Space Res. 13, 289–293. doi:10.1016/0273-1177(93)90492-T
Leka, K. D., and Metcalf, T. R. (2003). Active-region magnetic structure observed in the photosphere and chromosphere. Sol. Phys. 212, 361–378. doi:10.1023/A:1022996404064
Leenaarts, J., Carlsson, M., and Rouppe van der Voort, L. (2012). The formation of the Hα line in the solar chromosphere. ApJ 749, 136. doi:10.1088/0004-637X/749/2/136
Lindsey, C., and Kopp, G. (1995). Submillimeter radiometry of sunspots. Astrophys. J. 453, 517. doi:10.1086/176413
Loukitcheva, M. A., Iwai, K., Solanki, S. K., White, S. M., and Shimojo, M. (2017). Solar ALMA observations: Constraining the chromosphere above sunspots. Astrophys. J. 850, 35. doi:10.3847/1538-4357/aa91cc
Loukitcheva, M., Solanki, S. K., Carlsson, M., and White, S. M. (2015). Millimeter radiation from a 3D model of the solar atmosphere. I. Diagnosing chromospheric thermal structure. Astron. Astrophys. 575, A15. doi:10.1051/0004-6361/201425238
Loukitcheva, M., Solanki, S. K., and White, S. M. (2014). The chromosphere above sunspots at millimeter wavelengths. Astron. Astrophys. 561, A133. doi:10.1051/0004-6361/201321321
Maltby, P., Avrett, E. H., Carlsson, M., Kjeldseth-Moe, O., Kurucz, R. L., and Loeser, R. (1986). A new sunspot umbral model and its variation with the solar cycle. ApJ 306, 284. doi:10.1086/164342
Molnar, M. E., Reardon, K. P., Chai, Y., Gary, D., Uitenbroek, H., Cauzzi, G., et al. (2019). Solar chromospheric temperature diagnostics: A joint ALMA-hα analysis. Astrophys. J. 881, 99. doi:10.3847/1538-4357/ab2ba3
Molnar, M. E., Reardon, K. P., Cranmer, S. R., Kowalski, A. F., Chai, Y., and Gary, D. (2021). High-frequency wave power observed in the solar chromosphere with IBIS and ALMA. Astrophys. J. 920, 125. doi:10.3847/1538-4357/ac1515
Narang, N., Chandrashekhar, K., Jafarzadeh, S., Fleck, B., Szydlarski, M., and Wedemeyer, S. (2022). Power distribution of oscillations in the atmosphere of a plage region. Joint observations with ALMA, IRIS, and SDO. Astron. Astrophys. 661, A95. doi:10.1051/0004-6361/202142080
Rast, M. P., Bello González, N., Bellot Rubio, L., Cao, W., Cauzzi, G., Deluca, E., et al. (2021). Critical science plan for the Daniel K. Inouye solar telescope (DKIST). Sol. Phys. 296, 70. doi:10.1007/s11207-021-01789-2
Scharmer, G., Henriques, V., Hillberg, T., Kiselman, D., Löfdahl, M., Narayan, G., et al. (2008). “Spectropolarimetry of sunspots at 0.16 ARCSEC resolution,” in 12th European Solar Physics Meeting, Freiburg, Germany, September, 8-12, 2008.
Severino, G., Gomez, M. T., and Caccin, B. (1994). “Modelling umbrae,” in Solar surface magnetism. Editors R. J. Rutten, and C. J. Schrijver (Dordrecht: Kluwer Academic Publishers), 433, 169.
Shimojo, M., Bastian, T. S., Hales, A. S., White, S. M., Iwai, K., Hills, R. E., et al. (2017). Observing the sun with the Atacama large millimeter/submillimeter array (ALMA): High-resolution interferometric imaging. Sol. Phys. 292, 87. doi:10.1007/s11207-017-1095-2
Socas-Navarro, H. (2007). Semiempirical models of solar magnetic structures. ApJS 169, 439–457. doi:10.1086/510336
Solanki, S. K. (2003). Sunspots: An overview. Astronomy Astrophysics Rev. 11, 153–286. doi:10.1007/s00159-003-0018-4
Stepanov, A. V., Urpo, S., and Zaitsev, V. V. (1992). Diagnostics of solar flare and evaporated plasma using mm-wave emission. Sol. Phys. 140, 139–148. doi:10.1007/BF00148434
Wedemeyer, S., Bastian, T., Brajša, R., Hudson, H., Fleishman, G., Loukitcheva, M., et al. (2016). Solar science with the Atacama large millimeter/submillimeter array—a new view of our sun. Space Sci. Rev. 200, 1–73. doi:10.1007/s11214-015-0229-9
White, S. M., Iwai, K., Phillips, N. M., Hills, R. E., Hirota, A., Yagoubov, P., et al. (2017). Observing the sun with the Atacama large millimeter/submillimeter array (ALMA): Fast-scan single-dish mapping. Sol. Phys. 292, 88. doi:10.1007/s11207-017-1123-2
White, S. M., Loukitcheva, M., and Solanki, S. K. (2006). High-resolution millimeter-interferometer observations of the solar chromosphere. Astron. Astrophys. 456, 697–711. doi:10.1051/0004-6361:20052854
Wootten, A., and Thompson, A. R. (2009). The Atacama large millimeter/submillimeter array. Proc. IEEE 97, 1463–1471. doi:10.1109/JPROC.2009.2020572
Keywords: ALMA, Sun, Sun—active regions, solar radio astronomy, millimeter (mm) and submilli-meter (sub-mm) waves
Citation: Loukitcheva M and Reardon KP (2022) First looks at solar active regions with ALMA. Front. Astron. Space Sci. 9:1025368. doi: 10.3389/fspas.2022.1025368
Received: 22 August 2022; Accepted: 04 October 2022;
Published: 20 October 2022.
Edited by:
Alexander Nindos, University of Ioannina, GreeceReviewed by:
Jorrit Leenaarts, Stockholm University, SwedenAdriana Valio, Mackenzie Presbyterian University, Brazil
Copyright © 2022 Loukitcheva and Reardon. This is an open-access article distributed under the terms of the Creative Commons Attribution License (CC BY). The use, distribution or reproduction in other forums is permitted, provided the original author(s) and the copyright owner(s) are credited and that the original publication in this journal is cited, in accordance with accepted academic practice. No use, distribution or reproduction is permitted which does not comply with these terms.
*Correspondence: Maria Loukitcheva, bHVraWNoZXZhQG1wcy5tcGcuZGU=