 B. Lekshmi
 Kiran Jain
 Rudolf W. Komm
 Dibyendu Nandy
95% of researchers rate our articles as excellent or good
Learn more about the work of our research integrity team to safeguard the quality of each article we publish.
Find out more
ORIGINAL RESEARCH article
Front. Astron. Space Sci. , 18 October 2022
Sec. Stellar and Solar Physics
Volume 9 - 2022 | https://doi.org/10.3389/fspas.2022.1020748
This article is part of the Research Topic Connecting Solar Flows and Fields to Understand Surface Magnetism View all 6 articles
The extreme space weather conditions resulting from high energetic events likes solar flares and Coronal Mass Ejections demand for reliable space weather forecasting. The magnetic flux tubes while rising through the convection zone gets twisted by the turbulent plasma flows, energizing the system and resulting in flares. We investigate the relationship between the subsurface plasma flows associated with flaring active regions and their surface magnetic flux and current helicity. The near-surface horizontal velocities derived from the ring-diagram analysis of active region patches using Global Oscillation Network Group Doppler velocity measurements are used to compute the fluid dynamics descriptors like vertical divergence, vorticity and kinetic helicity used in this work. The flaring active regions are observed to have large value of vertical vorticity and kinetic helicity. Also, the horizontal flow divergence, vorticity, flux, kinetic and current helicities are observed to be significantly correlated and evolve in phase with each other. We observe that the integrated values of the above flow and magnetic parameters observed 1 day prior to the flare are significantly correlated with the integrated flare intensity of the active region. Hence, we show that strong vorticity/kinetic helicities lead to larger active region twisting, presumably generating high-intensity flares.
Strong magnetic flux tubes rise from the base of the convection zone to the solar surface due to magnetic buoyancy (Choudhuri and D’Silva, 1990; Fan et al., 1993) forming active regions and spread out to the solar atmosphere due to the low gas pressure environment. These flux tubes get twisted by the turbulent plasma flows in the convection zone (Longcope et al., 1998; Holder et al., 2004; Nandy, 2006). Following the emergence of an active region, surface shearing motions and rotation may also energise and twist the overlying magnetic loops (Kazachenko et al., 2009; Vemareddy et al., 2012). The magnetic energy gets stored as field-aligned electric current in the flux tube (Shibata and Magara, 2011). Hence, the twisted flux tubes gain high non-potentiality while rising to the solar atmosphere and leads to the build-up of large magnetic energy and helicity in the magnetic structure. The highly unstable flux tubes dissipate stored energy in the form of high energetic events likes Flares and CMEs. Apart from the above described surface dynamics, magnetic reconnection process in the solar corona can also result in these events.
The fluid dynamic descriptors like divergence, vorticity and kinetic helicity derived from subsurface flow measurements improve the ability to distinguish between flaring and non-flaring active regions (Komm and Hill, 2009; Komm et al., 2011). Flaring regions are characterized by large values of subsurface vorticity (Mason et al., 2006). Komm et al. (2005) has shown that the unsigned kinetic helicity density of flaring active regions correlates well with their corresponding total flare X-ray intensity. Studying the evolutionary curves of subsurface kinetic helicity, Gao et al. (2014) showed that a flare stronger than M5.0 can occur within 8 h before or after a rise in amplitude. Reinard et al. (2010) defined a parameter, Normalized Helicity Gradient Variance to study the connection between subsurface flows and flare productivity, and observed that this parameter increases two or 3 days prior to flare. However contradicting these observations, Braun (2016) reported that no visible precursor associated with high-intensity flares were observed using the descriptors obtained using helioseismic holography technique.
The twist of magnetic field lines indicates stressed, non-potential flux system and is a manifestation of magnetic helicity (Taylor, 1974; Pevtsov, 2008). Hahn et al. (2005) reported that flare occurs around regions with a high gradient in the magnetic twist and observations show that variance of twist distribution tends to decrease for more flare productive active regions (Nandy et al., 2003; Nandy, 2008). A more recent study (Sinha et al., 2022) using machine learning models has also shown that total current helicity, unsigned flux and total absolute twist of active regions are good indicators of flare productivity. Reinard et al. (2010) proposed that the magnetic field lines form an unstable configuration due to the subsurface rotational kinetic energy, resulting in explosive reconnection and flare. Also, the photospheric kinetic helicity and current helicity of active regions are observed to be correlated (Gao et al., 2012). These observations indicate that the twisting of field lines beneath the active region surface plays an important role in defining the current helicity distribution observed on the photosphere.
The extreme space weather conditions resulting from solar flares and CMEs make it essential to have a proper understanding of the physical processes responsible for these events and articulate methods to predict their occurrence and strength. The necessity to develop tools to predict the occurrence of solar flares calls for further studies exploring the empirical connection between subsurface flows and the flare productivity of active regions. In this article, we study the plasma flow and magnetic field properties of flaring active regions. The plasma flow velocities obtained from the helioseismic measurements are used to calculate the subsurface fluid dynamic descriptors around selected active regions. The temporal evolution of subsurface flow divergence, vorticity, magnetic flux, kinetic and current helicities of these regions and their correlation with flare intensity are investigated. Our study provides observational evidence linking active region parameters to the generation of high-intensity flares.
For our analysis, we select 18 isolated active regions which produce high-intensity (M and X class) flares in solar cycle 24. The tracking period, observed flares and maximum flux (during the tracking period) of these active regions are listed in Table 1. A control group of 12 non-flaring active regions are also selected. All the active regions are tracked for 7 days with the central meridian (CM) distance of the patch center constrained between ±45.5° during the tracking period to minimize systematic effects. We select 105 overlapping Global Oscillation Network Group (GONG; Harvey et al., 1996; Jain et al., 2021) Dopplergram patches of size 13° × 13° on each day. The patches are selected such that there are 15 overlapping patches centered between longitude ±45.5° and active region latitude (θar). Also, three overlapping patches are selected on either side of each longitudinal patch. A cartoon representing the patch selection is shown in Figure 1. According to this selection criteria, the active region is centred at CM distance −39° and 39° on the first and seventh day respectively. Hence we can define the longitudinal location of active region patch as φar = − 39°, −26°, −13°, 0°, 13°, 26° and 39° respectively on the 7 days of tracking. Ring-diagram analysis is performed on these customized active region patches to obtain the horizontal flow (vh) velocities (Hill, 1988; Gizon and Birch, 2005). In this study, selected 13° × 13° patches are tracked for 1,440 min with 1 min cadence Dopplergrams using the surface rotation rate (Snodgrass, 1984). Each tracked patch is apodized with a circular function and finally stacked in time to form a data cube. The 3-dimensional Fourier transform of this data cube in both spatial and temporal directions gives the 3-dimensional power spectra with power concentrated at constant temporal frequencies. These frequencies get shifted in the presence of horizontal flows. The spectra are fitted by Lorentzian profile to obtain the frequency shifts, depth averaged horizontal flow components and other parameters. The flow components from the fit are inverted using regularized least square method to obtain the horizontal flow components at different depths (Jain et al., 2012; Jain et al., 2015). The measured horizontal flow velocities are interpolated for 33 selected depths between 0–15.5 Mm by linear interpolation. The temporal mean of the horizontal flow components (zonal and meridional) of each patch is calculated, and is subtracted from all the individual patches to remove systematic effects. Velocities corresponding to the patch containing the active region are excluded while calculating the mean.
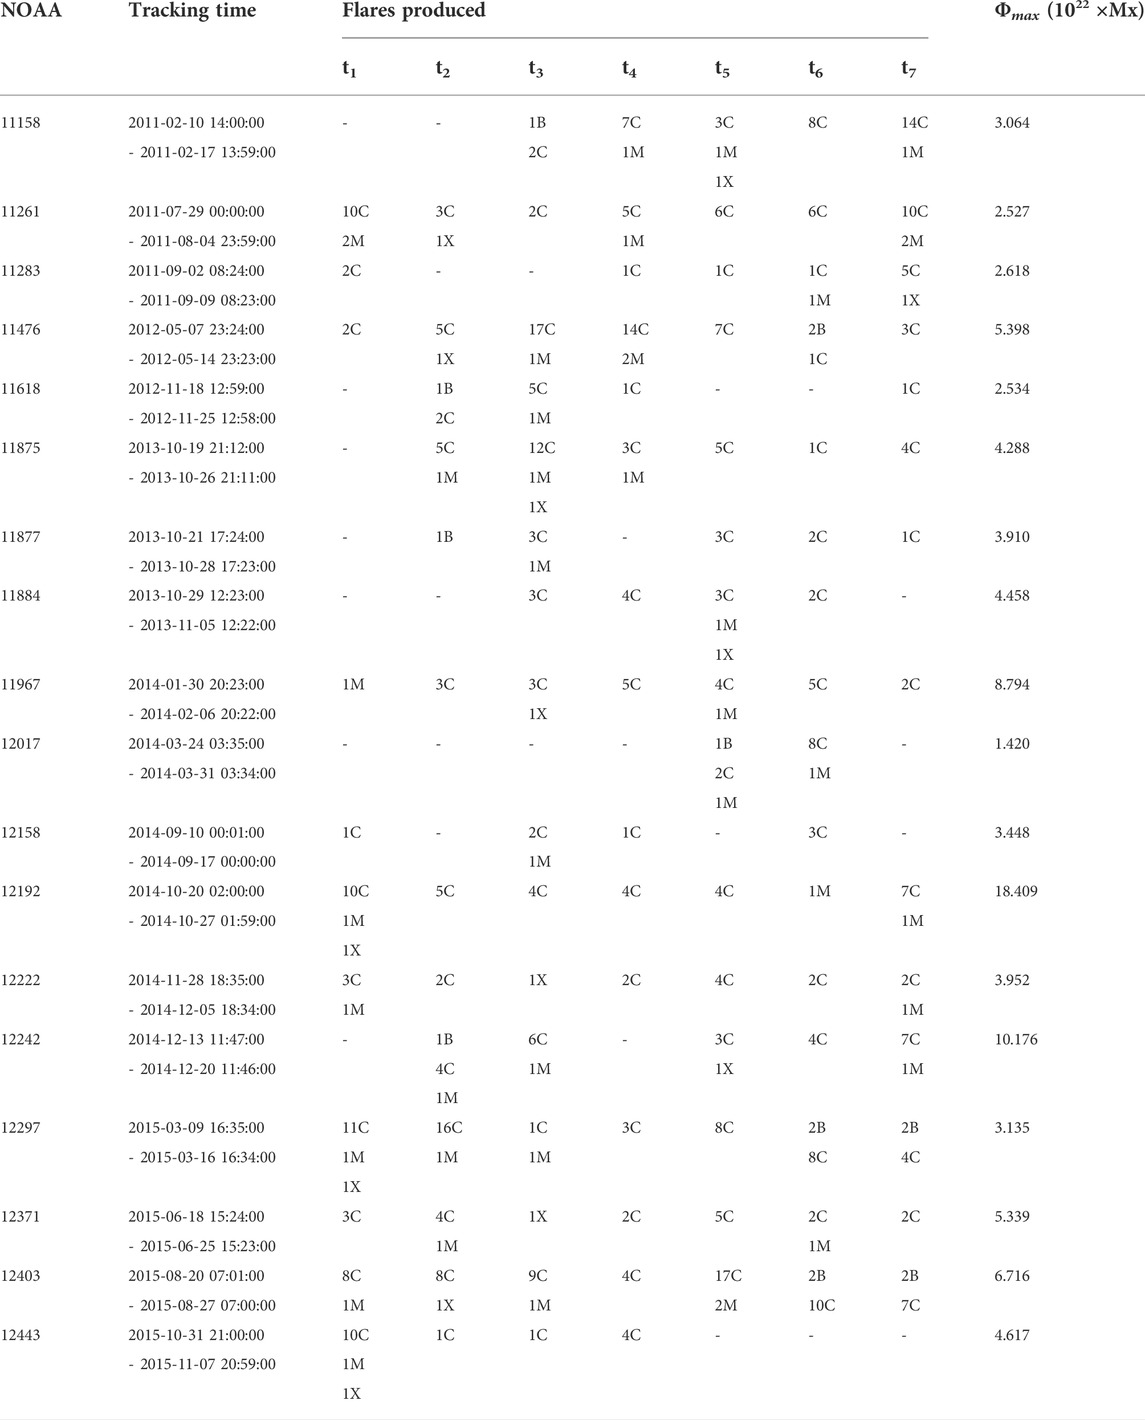
TABLE 1. NOAA number, tracking time, number of flares produced of each flare class (B,C,M and X) and the maximum unsigned flux of the active regions during the tracking period. The columns t1 − t7 represents the 7 days of tracking. The number of flares corresponding to each flare class are indicated as prefix.
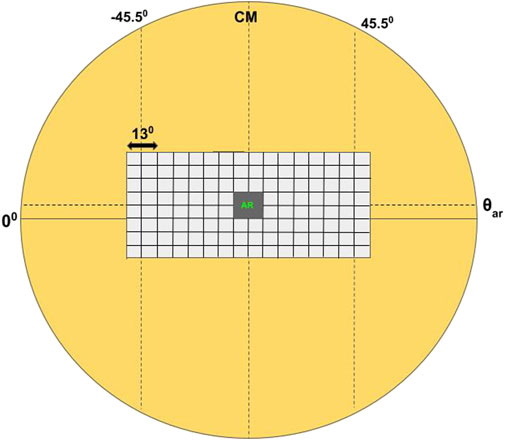
FIGURE 1. A cartoon representing the selection of patches for ring diagram analysis. The active region latitude is represented as θar. Each patch is of size 13° and there are 15 overlapping patches across longitude centered between ± 45.5° from the central meridian (CM). Corresponding to each longitude, there are seven overlapping patches across latitude with the middle patches centered at θar. The cartoon here represents the patch selection on the fourth day of tracking, when the active region (grey shaded area) patch is along the central meridian. (Grid sizes are not up to scale).
We compute plasma flow parameters such as horizontal flow divergence (∇r), vorticity (ωr), and kinetic helicity (Kr) of each patch as given below (Komm and Gosain, 2019):
where θ and φ are the colatitude and longitude corresponding to the patch center and, vφ and vθ represents the zonal and meridional flows. The kinetic helicity at different depths is given by
where kr = ωr.vr, d is the depth, vr is the radial velocity and A is the area of the patch. The radial velocity,
The density ρ(d) at each depth d is calculated from a solar model—Model S (Christensen-Dalsgaard, 1998) and vr on the solar surface is considered to be zero.
The surface magnetic flux (Φ) and total unsigned current helicity
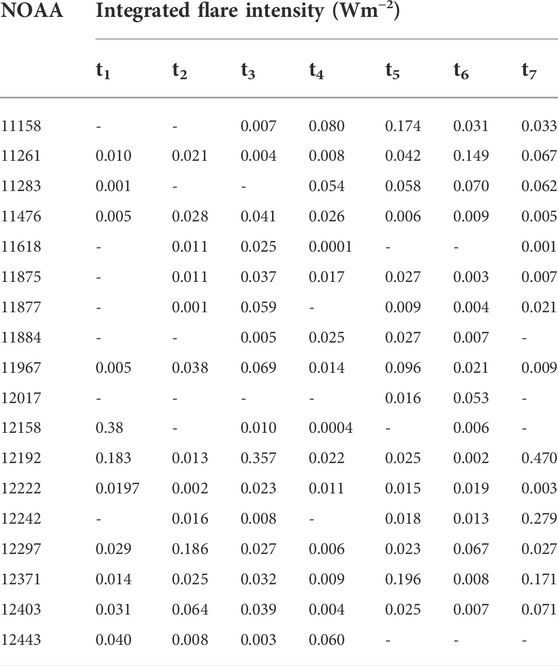
TABLE 2. Integrated intensity of all the flares produced by the active regions (see Table 1) on each day of tracking.
We compute the absolute values of horizontal flow divergence, vertical vorticity and kinetic helicity of all the tracked patches using systematic corrected flow velocities. The temporal mean (over the 7 days of tracking) of vertical vorticity, ωr, at each depth, corresponding to the flaring active region and its neighboring latitude patches at φar are plotted as a function of latitude and depth in Figure 2. The latitude of active region, θar is represented by black dashed line. The mean vorticity of active region patches and neighboring latitudes are observed to have large values and are strongest at deeper layers. It can be observed from Figure 2 that regions like 11967, 12192 and 12403 have large values of vorticities over all the depths considered. These regions have produced numerous X and M class flares during the tracking period and have large values of magnetic flux (>6 × 10²²Mx; see Table 1). However, regions like 11283, 11618 and 12158 have strong vorticities concentrated at deeper layers and have weaker magnetic flux. These regions produce fewer X and M class flares compared to the above mentioned case. This indicates that regions which produce more number of high intensity flares have large vorticities (>2 × 10⁻⁷s−1) spanning from deeper layers till the surface. The mean vorticity of non-flaring active region patches along with that of neighboring patches are plotted in Figure 3. The vorticity at the active region locations (dashed lines) are smaller in amplitude as compared to that of flaring regions. For comparison, the color bars of both the figures are saturated to vorticity 5 × 10⁻⁷s−1.
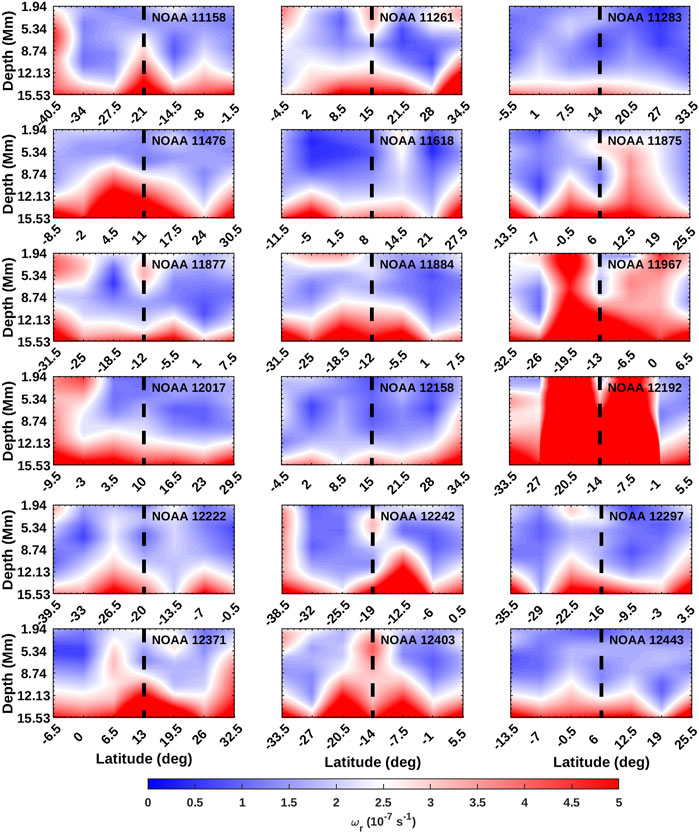
FIGURE 2. Temporal mean of absolute vertical vorticity, ωr corresponding to the 18 flaring active regions and neighboring patches at the active region longitude, φar as a function of latitude and depth. The latitude of active region is represented by dashed solid line.
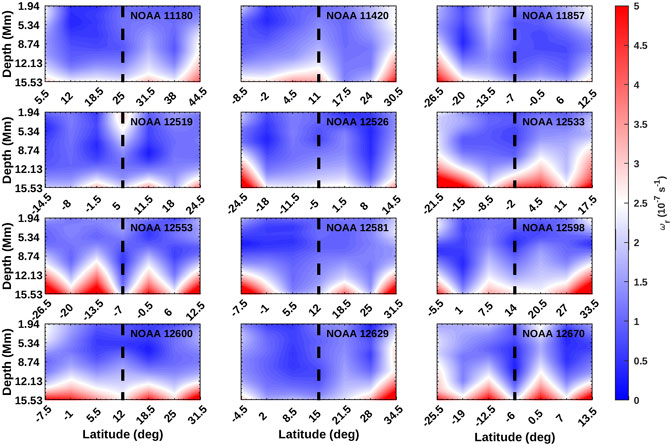
FIGURE 3. Same as Figure 2 but for 12 non-flaring active regions.
The temporal mean of kinetic helicity, Kr, of the flaring and non-flaring active regions along with the helicities of neighboring latitudes at φar are plotted in Figures 4, 5, respectively. The kinetic helicity of flaring active regions and neighboring latitudes are larger in amplitude (>1015m4s−2 over all depths) with respect to non-flaring regions, similar to that of vorticity. Also, the Kr of flaring active regions have larger values (>1016m4s−2) at deeper layers. The colorbars are saturated to 4 × 10¹⁶m4s−2.
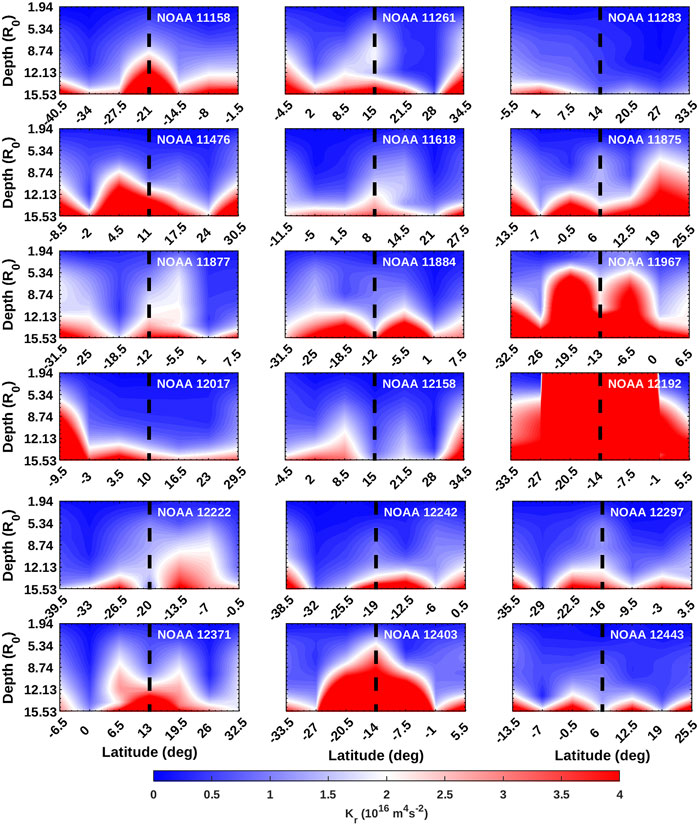
FIGURE 4. Temporal mean of absolute kinetic helicity, Kr corresponding to the flaring active regions and neighboring patches at φar as a function of latitude and depth. Dashed lines represent the active region latitude.
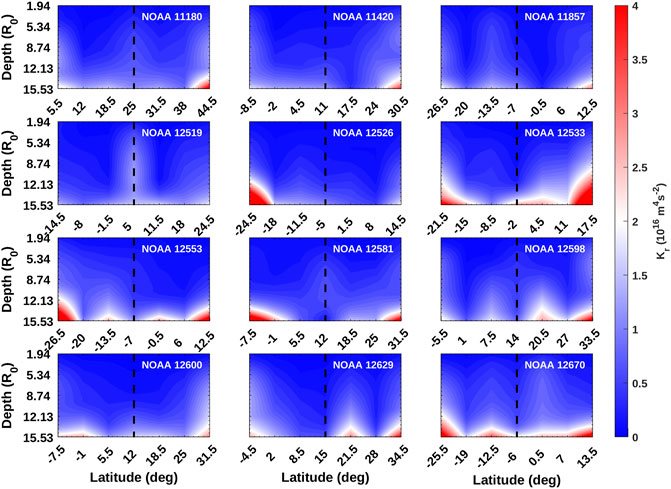
FIGURE 5. Same as Figure 4 but for non-flaring active regions and neighboring patches.
The active regions selected for our analysis have flared multiple times during the tracking period. The days (t) on which flares are observed and the corresponding integrated flare intensities are given in Table 2. In order to understand the inter-relationship between plasma flow and magnetic properties of flaring active regions, we integrate the ∇r, ωr, Kr, Φ and
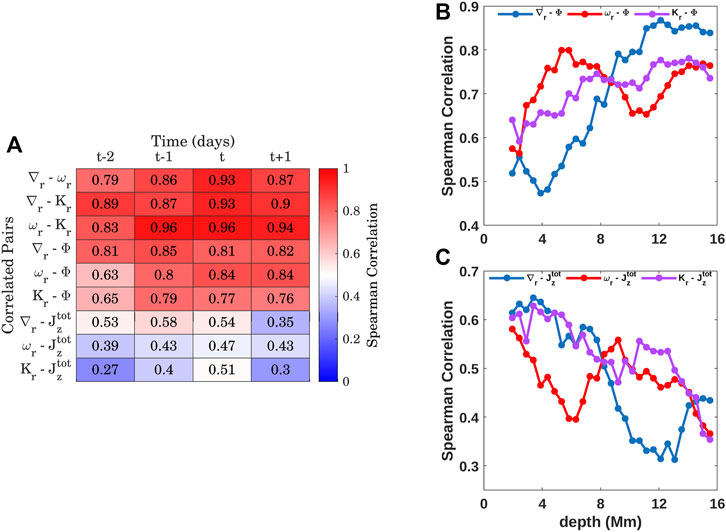
FIGURE 6. (A) Spearman correlation coefficients between the integrated horizontal flow divergence (∇r), vertical vorticity (ωr), kinetic helicity (Kr), surface magnetic field (Φ) and total unsigned photospheric current helicity
The relationship of the flow parameters at different depths with the current helicity and magnetic flux measurements at the surface are also investigated. Figures 6B,C represents the Spearman correlation coefficients computed between the integrated flow parameters at different depths on the day of flare with Φ and
Subsequently, we study the role of fluid and magnetic parameters of active regions with the intensity of flares they produce. For this, we correlate the integrated ∇r, ωr, Kr, Φ and
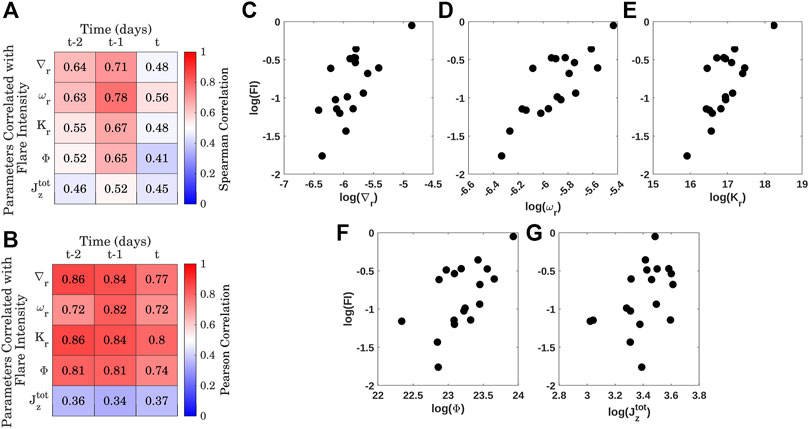
FIGURE 7. The integrated values of active region horizontal flow divergence (∇r), vertical vorticity (ωr), kinetic helicity (Kr), surface magnetic field (Φ) and total unsigned photospheric current helicity
Komm and Hill (2009) reported a linear relationship between surface magnetic flux and the subsurface vorticity of active regions and observed that regions which produce high intensity flares are characterized by large values of flux (>80G) and vorticity (>0.86 × 10⁻⁵s−1). Braun (2016) also reported results which qualitatively agrees with the above observation. We analyse the vertical vorticity and kinetic helicity of 18 flaring and 12 non-flaring active regions and observe that flaring active regions are characterized by large values of vorticity and helicity compared to its non-flaring counterpart. Also, vorticity and kinetic helicity strength of the flaring regions increase with depth. Our results also agree qualitatively with the previous studies.
The subsurface flow parameters of flaring active regions are significantly correlated with each other and significant correlations obtained on the days prior to, on the day and post flare indicate that the parameters evolve in phase with each other. The same is observed between the flow parameters and surface magnetic flux. Plasma flows converge towards active regions (Gizon et al., 2001; Zhao and Kosovichev, 2004) due to the temperature perturbations resulting from the presence of strong magnetic field (Schuessler, 1981; Spruit, 2003). The flow convergence increases with magnetic flux, increasing the strength of divergence and vorticity around the active region and hence the kinetic helicity (Eq. (3)). The flow parameters show significant correlation with photospheric current helicity 1 day prior to and on the day of flare. The rise in divergence and vorticity around active regions strengthens the kinetic helicity which results in the twisting of active region flux tubes and this is known as Σ-effect (Longcope et al., 1998). The kinetic and current helicities evolve in phase indicating that the twisting of flux tubes below the active region results in the build up of photospheric current helicity (Gao et al., 2012). We observe that the correlation between the flow parameters and flux increases with depth but incase of current helicity maximum correlations are observed at shallower depths.
In the presence of strong magnetic field, the subsurface divergence, vorticity and kinetic helicity of the active regions increases in strength. The resultant shearing motion twists the magnetic flux tubes beneath the surface, which are frozen in the plasma and energises them. The energized sub-surface flux systems are prone to be more flare productive (Nandy et al., 2003). Studies have shown that kinetic helicity/vorticity measurements of active regions show signatures of an upcoming flare, few days to hours prior to the event (Reinard et al., 2010; Gao et al., 2014). We observe that the flow parameters, flux and current helicity 1 day prior to the flare shows strong correlation with the intensity of the flares generated. This indicates that these parameters 1 day prior to the flare might be able to provide information about the strength of the flares that an active region can produce during its passage through the solar disc. However, more detailed studies on temporal evolution of active region parameters are required to explore the possibilities of using them to predict the strength of individual flares.
The raw data supporting the conclusion of this article will be made available by the authors, without undue reservation.
All the authors contributed to the conceivement of the presented idea. BL, KJ, and RK designed the analysis. Ring diagram velocity measurements of customised patches were done by KJ. BL performed the analysis and wrote the manuscript. RK, KJ, and DN along with BL contributed to the interpretation of results and in the preparation of final manuscript.
This work was supported by the Council of Scientific and Industrial Research and Ministry of Human Resource Development, Government of India. BL ackowledges Max Planck society for the funding. KJ and RK acknowledge the support from NASA grants 80NSSC18K1206, 80NSSC19K0261, 80NSSC20K0194, and 80NSSC21K0735 to the National Solar Observatory and by NASA grant NNH18ZDA001N-DRIVE to Stanford University.
This work utilises GONG data obtained by the NSO Integrated Synoptic Program, managed by the National Solar Observatory, which is operated by the Association of Universities for Research in Astronomy (AURA), Inc. under a cooperative agreement with the National Science Foundation and with contribution from the National Oceanic and Atmospheric Administration. The GONG network of instruments is hosted by the Big Bear Solar Observatory, High Altitude Observatory, Learmonth Solar Observatory, Udaipur Solar Observatory, Instituto de Astrofísica de Canarias, and Cerro Tololo Interamerican Observatory. The data used here are courtesy of NASA/SDO and the HMI Science Team. We acknowledge the use of Geostationary Operational Environmental Satellite (GOES) data. The Center of Excellence in Space Sciences India at IISER Kolkata is funded by the Ministry of Education, Government of India.
The authors declare that the research was conducted in the absence of any commercial or financial relationships that could be construed as a potential conflict of interest.
All claims expressed in this article are solely those of the authors and do not necessarily represent those of their affiliated organizations, or those of the publisher, the editors and the reviewers. Any product that may be evaluated in this article, or claim that may be made by its manufacturer, is not guaranteed or endorsed by the publisher.
Bobra, M. G., Sun, X., Hoeksema, J. T., Turmon, M., Liu, Y., Hayashi, K., et al. (2014). The helioseismic and magnetic imager (HMI) vector magnetic field pipeline: SHARPs – space-weather HMI active region patches. Sol. Phys. 289, 3549–3578. doi:10.1007/s11207-014-0529-3
Braun, D. C. (2016). A helioseismic survey of near-surface flows around active regions and their association with flares. Astrophys. J. 819, 106. doi:10.3847/0004-637x/819/2/106
Choudhuri, A. R., and D’Silva, S. (1990). Influence of turbulence on rising flux tubes in the solar convection zone. Atron. Astrophys. 239, 326–334.
Christensen-Dalsgaard, J. (1998). The ’standard’ Sun modelling and Helioseismology. Space Sci. Rev. 85, 19–36. doi:10.1023/A:1005116132024
Fan, Y., Fisher, G. H., and Deluca, E. E. (1993). The origin of morphological asymmetries in bipolar active regions. Astrophys. J. 405, 390. doi:10.1086/172370
Gao, Y., Zhao, J., and Zhang, H. (2014). A study of connections between solar flares and subsurface flow fields of active regions. Sol. Phys. 289, 493–502. doi:10.1007/s11207-013-0274-z
Gao, Y., Zhao, J., and Zhang, H. (2012). Analysis on correlations between subsurface kinetic helicity and photospheric current helicity in active regions. Astrophys. J. 761, L9. doi:10.1088/2041-8205/761/1/l9
Gizon, L., and Birch, A. C. (2005). Local Helioseismology. Living Rev. Sol. Phys. 2, 6. doi:10.12942/lrsp-2005-6
Gizon, L., Duvall, T. L., and Larsen, R. M. (2001). “Probing surface flows and magnetic activity with time-distance Helioseismology,” in Recent insights into the Physics of the Sun and heliosphere: Highlights from SOHO and other space missions. Editors P. Brekke, B. Fleck, and J. B. Gurman, Vol. 203, 189.
Hahn, M., Gaard, S., Jibben, P., Canfield, R. C., and Nandy, D. (2005). Spatial relationship between twist in active region magnetic fields and solar flares. Astrophys. J. 629, 1135–1140. doi:10.1086/431893
Harvey, J. W., Hill, F., Hubbard, R. P., Kennedy, J. R., Leibacher, J. W., Pintar, J. A., et al. (1996). The global oscillation network group (GONG) project. Science 272, 1284–1286. doi:10.1126/science.272.5266.1284
Hill, F. (1988). Rings and trumpets—three-dimensional power spectra of solar oscillations. Astrophys. J. 333, 996. doi:10.1086/166807
Holder, Z. A., Canfield, R. C., McMullen, R. A., Nandy, D., Howard, R. F., and Pevtsov, A. A. (2004). On the tilt and twist of solar active regions. Astrophys. J. 611, 1149–1155. doi:10.1086/422247
Jain, K., Komm, R. W., González Hernández, I., Tripathy, S. C., and Hill, F. (2012). Subsurface flows in and around active regions with rotating and non-rotating sunspots. Sol. Phys. 279, 349–363. doi:10.1007/s11207-012-0039-0
Jain, K., Tripathy, S. C., and Hill, F. (2015). Divergent horizontal sub-surface flows within active region 11158. Astrophys. J. 808, 60. doi:10.1088/0004-637x/808/1/60
Jain, K., Tripathy, S. C., Hill, F., and Pevtsov, A. A. (2021). Continuous solar observations from the ground - assessing duty cycle from GONG observations. Publ. Astron. Soc. Pac. 133, 105001. doi:10.1088/1538-3873/ac24d5
Kazachenko, M. D., Canfield, R. C., Longcope, D. W., Qiu, J., DesJardins, A., and Nightingale, R. W. (2009). Sunspot rotation, flare energetics, and flux rope helicity: The eruptive flare on 2005 may 13. Astrophys. J. 704, 1146–1158. doi:10.1088/0004-637x/704/2/1146
Komm, R., Ferguson, R., Hill, F., Barnes, G., and Leka, K. D. (2011). Subsurface vorticity of flaring versus flare-quiet active regions. Sol. Phys. 268, 389–406. doi:10.1007/s11207-010-9552-1
Komm, R., and Gosain, S. (2019). Kinetic helicity and lifetime of activity complexes during solar cycle 24. Astrophys. J. 887, 192. doi:10.3847/1538-4357/ab58ca
Komm, R., and Hill, F. (2009). Solar flares and solar subphotospheric vorticity. J. Geophys. Res. 114, A06105. doi:10.1029/2008JA013977
Komm, R., Howe, R., Hill, F., González Hernández, I., and Toner, C. (2005). Kinetic helicity density in solar subsurface layers and flare activity of active regions. Astrophys. J. 630, 1184–1193. doi:10.1086/432031
Longcope, D. W., Fisher, G. H., and Pevtsov, A. A. (1998). Flux-tube twist resulting from helical turbulence: The Σ-effect. Astrophys. J. 507, 417–432. doi:10.1086/306312
Mason, D., Komm, R., Hill, F., Howe, R., Haber, D., and Hindman, B. W. (2006). Flares, magnetic fields, and subsurface vorticity: A survey of GONG and mdi data. Astrophys. J. 645, 1543–1553. doi:10.1086/503761
Nandy, D., Hahn, M., Canfield, R. C., and Longcope, D. W. (2003). Detection of a taylor-like plasma relaxation process in the Sun. Astrophys. J. 597, L73–L76. doi:10.1086/379815
Nandy, D. (2006). Magnetic helicity and flux tube dynamics in the solar convection zone: Comparisons between observation and theory. J. Geophys. Res. 111, A12S01. doi:10.1029/2006JA011882
Nandy, D. (2008). “Magnetic helicity, coronal heating and solar flaring activity: A review of the role of active region twist,” in Subsurface and atmospheric influences on solar activity. Vol. 383 of astronomical society of the pacific conference series. Editors R. Howe, R. W. Komm, K. S. Balasubramaniam, and G. J. D. Petrie, 201.
Pevtsov, A. A. (2008). What helicity can tell us about solar magnetic fields. J. Astrophys. Astron. 29, 49–56. doi:10.1007/s12036-008-0006-1
Reinard, A. A., Henthorn, J., Komm, R., and Hill, F. (2010). Evidence that temporal changes in solar subsurface helicity precede active region flaring. Astrophys. J. 710, L121–L125. doi:10.1088/2041-8205/710/2/L121
Schuessler, M. (1981). The solar torsional oscillation and dynamo models of the solar cycle. Atron. Astrophys. 94, L17.
Shibata, K., and Magara, T. (2011). Solar flares: Magnetohydrodynamic processes. Living Rev. Sol. Phys. 8, 6. doi:10.12942/lrsp-2011-6
Sinha, S., Gupta, O., Singh, V., Lekshmi, B., Nandy, D., Mitra, D., et al. (2022). A comparative analysis of machine learning models for solar flare forecasting: Identifying high performing active region flare indicators. arXiv e-printsarXiv:2204.05910.
Snodgrass, H. B. (1984). Separation of large-scale photospheric Doppler patterns. Sol. Phys. 94, 13–31. doi:10.1007/BF00154804
Spruit, H. C. (2003). Origin of the torsional oscillation pattern of solar rotation. Sol. Phys. 213, 1–21. doi:10.1023/A:1023202605379
Taylor, J. B. (1974). Relaxation of toroidal plasma and generation of reverse magnetic fields. Phys. Rev. Lett. 33, 1139–1141. doi:10.1103/PhysRevLett.33.1139
Vemareddy, P., Ambastha, A., and Maurya, R. A. (2012). On the role of rotating sunspots in the activity of solar active region noaa 11158. Astrophys. J. 761, 60. doi:10.1088/0004-637x/761/1/60
Keywords: Sun, helioseismology, active regions, plasma flows, helicity, flares
Citation: Lekshmi B, Jain K, Komm RW and Nandy D (2022) Sub-surface plasma flows and the flare productivity of solar active regions. Front. Astron. Space Sci. 9:1020748. doi: 10.3389/fspas.2022.1020748
Received: 16 August 2022; Accepted: 03 October 2022;
Published: 18 October 2022.
Edited by:
Qiang Hu, University of Alabama in Huntsville, United StatesReviewed by:
Shuo Wang, University of Alabama in Huntsville, United StatesCopyright © 2022 Lekshmi, Jain, Komm and Nandy. This is an open-access article distributed under the terms of the Creative Commons Attribution License (CC BY). The use, distribution or reproduction in other forums is permitted, provided the original author(s) and the copyright owner(s) are credited and that the original publication in this journal is cited, in accordance with accepted academic practice. No use, distribution or reproduction is permitted which does not comply with these terms.
*Correspondence: B. Lekshmi, bGVrc2htaWJAbXBzLm1wZy5kZQ==
Disclaimer: All claims expressed in this article are solely those of the authors and do not necessarily represent those of their affiliated organizations, or those of the publisher, the editors and the reviewers. Any product that may be evaluated in this article or claim that may be made by its manufacturer is not guaranteed or endorsed by the publisher.
Research integrity at Frontiers
Learn more about the work of our research integrity team to safeguard the quality of each article we publish.