 Rudolf Komm
- National Solar Observatory, Boulder, CO, United States
We study the radial gradient of the solar rotation rate in the near-surface shear layer (NSSL) from about .950 R⊙ to the solar surface and its variation during Solar Cycles 23 and 24 with ring-diagram analysis applied to Global Oscillation Network Group (GONG) and Helioseismic and Magnetic Imager (HMI) Dopplergrams. The average radial gradient is ∂ log Ω/∂ log r = − 1.0 ± .1 at .990 R⊙ in agreement with previous studies. The average radial gradient is ∂ log Ω/∂ log r = − .11 ± .01 at the base of the NSSL at .950R⊙, while it is steeper than −1 closer to the surface between .990R⊙ and .997R⊙. The average radial gradient is rather flat within ±40° latitude from about .970 R⊙ to the solar surface. The radial gradient of the solar rotation rate varies with the solar cycle. At locations of high magnetic activity, the radial gradient is more negative than average from about .970 R⊙ to .990 R⊙, while in quiet regions the radial gradient is less negative than average at these depths. Close to the surface at .997 R⊙, this relationship appears to be reversed. Prominent features of the solar-cycle variation of large-scale flows, such as poleward branches or precursor flows, are not obviously present. The variation of the radial gradient thus more likely indicates the presence or absence of magnetic flux above a certain threshold. The temporal variations derived from the different HMI and GONG data sets agree within one error bar at most depths and latitudes, while their amplitudes might be different.
1 Introduction
In previous studies, we investigated the large-scale subsurface flows in the near-surface shear layer (NSSL) from a depth of about 35 Mm toward the solar surface, their variation with magnetic activity (Komm et al., 2020, for example), and their variation with the solar cycle (Komm et al., 2018; Komm, 2021, for example). The subsurface flows were derived with ring-diagram analysis (Hill, 1988; Haber et al., 2002) applied to Dopplergrams obtained by the Global Oscillation Network Group (GONG) instruments (Harvey et al., 1996, Harvey et al., 1998) and the Helioseismic and Magnetic Imager (HMI) instrument onboard the Solar Dynamics Observatory (SDO) spacecraft (Pesnell et al., 2012; Scherrer et al., 2012; Schou et al., 2012). In this study, we used these flows to derive the radial gradient of the solar rotation rate in the NSSL.
The NSSL is one of two regions of the solar interior with strong radial shear of the rotation rate with the other one, the so-called tachocline, being close to the bottom of the solar convection zone. In the shear layer close to the surface, the rotation rate shows a local maximum near .950R⊙ and decreases toward the solar surface (Rhodes et al., 1990; Thompson et al., 1996; Kosovichev et al., 1997; Schou et al., 1998). Such shear layers may be crucial for the solar dynamo (Charbonneau, 2020, for a review). The role of the NSSL has been explored by theoretical studies (Dikpati et al., 2002; Brandenburg, 2005; Pipin and Kosovichev, 2011, for example) and the NSSL itself has been modeled in some detail (Kitiashvili et al., 2022, for example).
Theoretical studies have shown that the negative radial gradient of the rotation rate in the NSSL might be maintained by a balance between angular momentum transport from viscous diffusion and meridional flow and that due to Reynolds stresses associated with convective motions (De Rosa et al., 2002; Kitchatinov and Rüdiger, 2005, for example). In addition, the shear might be weakly sensitive to magnetic fields with the shear increasing with increasing field strength (Kitchatinov, 2016).
The radial gradient of the solar rotation rate in the NSSL has been investigated with global helioseismic techniques using time series of f-modes representing the outer 2% of the solar radius. Corbard and Thompson (2002) analyzed about 4.5 years of f-mode data obtained with the Michelson Doppler Imager (MDI) instrument onboard the Solar and Heliospheric Observatory (SoHO) spacecraft, while Barekat et al. (2014) used about 15 years of MDI f-mode data together with about 4 years of f-mode data obtained with HMI. They found that the logarithmic radial gradient is very close to −1 and remarkably constant with latitude. Barekat et al. (2016) focused on the solar-cycle variation and found that the radial gradient increases in steepness with increasing solar activity during Solar Cycle 23.
The use of p-modes in addition to f-mode data allowed Antia et al. (2008) to study the rotation rate and its gradient in deeper layers than with f-modes alone. Expanding on this work, Antia and Basu (2022) used f- and p-modes obtained from about 26 years of GONG data, 15 years of MDI data, and 11 years of HMI data. They studied the radial gradient from about .950 R⊙ to the surface and found that the radial gradient increases in steepness with increasing solar activity at .990 R⊙ and decreases in steepness at .950 R⊙ during Solar Cycles 23 and 24. Reiter et al. (2020) developed a new methodology for fitting the peaks in solar oscillation power spectra and found that the logarithmic radial gradient has a peak value of −2.8 at a heliographic latitude of 28.1° latitude close to the solar surface not accessible with regular global fitting techniques.
Local helioseismic techniques, such as ring-diagram analysis (RDA), allow to measure the rotation rate in both hemispheres separately. Zaatri and Corbard (2009) applied RDA to 7 years of GONG data and found that the radial gradient of angular velocity remains negative and roughly constant between .980 R⊙ and .991 R⊙ below 40° of latitude. They also studied the radial gradient at 60° latitude during about half a year and found a positive gradient at this latitude in agreement with Corbard and Thompson (2002), while Antia and Basu (2022) found a steeper (negative) gradient at 60° latitude.
We derived the radial gradient of the rotation rate analyzing zonal flows obtained with RDA applied to about 20 years of GONG and 12 years of HMI Dopplergrams, which cover most of Solar Cycle 23, all of Solar Cycle 24, and the onset of Solar Cycle 25. First, we determined the average radial gradient from .950 R⊙ to the surface as a function of radius at different latitudes for GONG and HMI data. We then studied the temporal variation with the solar cycle focusing on GONG data, which cover more than one solar cycle. For the temporal variation, we created super-synoptic maps of the radial gradient where each point in time is an average over a synoptic map. Finally, we compared the solar-cycle variation derived from GONG and HMI data.
2 Materials and methods
We used helioseismic inversion products based on full-disk Dopplergrams obtained with the GONG network and the HMI instrument. The daily subsurface flows were determined with a ring-diagram analysis (RDA) obtained with the GONG and HMI pipelines (Corbard et al., 2003; Bogart et al., 2011a,b). We analyzed GONG data covering 266 consecutive Carrington rotations (CR 1979-2244; 22 July 2001–7 June 2021; gong. nso.edu/data) and HMI data obtained during 151 consecutive Carrington rotations (CR 2097-2247; 2 May 2010–28 August 2021; jsoc.stanford.edu).
We used daily horizontal flows determined from tracked tiles, which were apodized with a circular function to 15° diameter, covering the solar disk with a grid in latitude and longitude spaced by half the tile diameter and tracked for about a day (Komm et al., 2018, Komm et al., 2004, for details). Daily horizontal flows are given in units of [m s−1]. GONG data are tracked with a surface differential rotation rate (Snodgrass, 1984), while the HMI data are tracked with the constant Carrington rate. For each tile, the velocity values are measured from the fitted modes and the inversion procedure then determines velocity values as a function of depth. Since the actual depths depend on the modes used and the mode coverage varies from tile to tile across the solar disk, we linearly interpolated the inversion results onto a common grid of 16 depths from .6 to 15.8 Mm in depth. In this way, we created flow maps at the same depths for all longitude-latitude grid points.
In addition, we used daily flow maps determined from tiles apodized to 30° diameter and tracked twice as long as the 15° tiles produced by the HMI pipeline. The different mode sets that can be fit with 15° and 30° tiles and the different depth ranges that can be reached was discussed by González Hernández et al. (2006). Their tests using 45° tiles showed that RDA with tiles much larger than 30° is not useful since the plane-wave approximation is failing and projection uncertainties are increasing for such large tile sizes (González Hernández et al., 2006). We linearly interpolated the 30°-tile inversion results onto a common grid using 22 depths from .5 to 38.0 Mm (Komm, 2021). To distinguish between both HMI data sets, we call this one “30°-tile HMI data set” and use “HMI data set” for the 15°-tile HMI set. We then corrected the HMI and GONG daily flow maps for systematic variations with disk position, as outlined by Komm et al. (2015a), Komm et al. (2015b), and combined the corrected daily flow maps into synoptic maps covering complete Carrington rotations.
In this study, we averaged each synoptic map in longitude and created super-synoptic maps of the zonal subsurface flows. We then added the tracking rate appropriate to each data set (in [m s−1]), as a function of latitude, and created super-synoptic maps of the solar rotation rate. The rotation rate derived from RDA is known to agree quite well with that derived with global helioseismic inversion results (Basu et al., 1999; Howe et al., 2006; Howe, 2009). We calculated the dimensionless radial gradient of the rotation rate, ∂ log Ω/∂ log r, for every grid point in time, latitude, and depth. Throughout this study, we mean this quantity when discussing the radial gradient. We then repeated the analysis 100 times randomizing each flow value by its error and used the standard error of the mean of the randomized set as the error of the radial gradient.
We used synoptic maps of NSO/NISP magnetograms (nso.edu/data/nisp-data/) to compare the flow results with magnetic activity. We binned the synoptic magnetograms to the same grid as the synoptic flow maps matching the spatial resolution of the 15° and 30° flow maps and derived the signed magnetic activity index, sMAI (Komm et al., 2018). In addition, we binned their absolute values and derived the magnetic activity index, MAI (Basu et al., 2004). For long-term comparisons, we created super-synoptic maps from the MAI and sMAI synoptic maps (Komm et al., 2018).
To create a quiet-region subset, we used an MAI threshold of 3.6 G. Locations with MAI values at or below this threshold are considered quiet regions, following Komm et al. (2020). To create super-synoptic maps of the quiet-region subset, we determined the number of locations with MAI values at or below this threshold for every Carrington rotation (CR). To ensure that at least two independent quiet regions are present at a given latitude, we require that there are at least six locations that fulfill this criterion since RDA regions overlap. If this requirement is fulfilled, we calculated their average value and standard error and included them in the quiet-region subset at this latitude and CR. However, if there are only five or less such regions, there will be a gap at the particular latitude and CR of the quiet-region subset (Komm et al., 2020, for details).
3 Results
3.1 Average radial gradient during solar cycle 24
Figure 1 shows the radial gradient of the solar rotation rate as a function of radius (left) and density (right) at the equator averaged over Solar Cycle 24 (GONG: CR 2097-2244, HMI: CR 2097-2247). In the left panel, the gradient is close to zero at the base of the NSSL and increases to steeper negative values of about −1 at .990R⊙ and −2 closer to the surface. The radial gradient increases almost linearly in amplitude through most of the NSSL, as indicated by a linear regression from .960R⊙ to .980R⊙ using values derived with 30°-tile RDA of HMI data (dotted line). The radial gradient then increases rapidly toward larger negative values from about .9850R⊙ to .997R⊙.
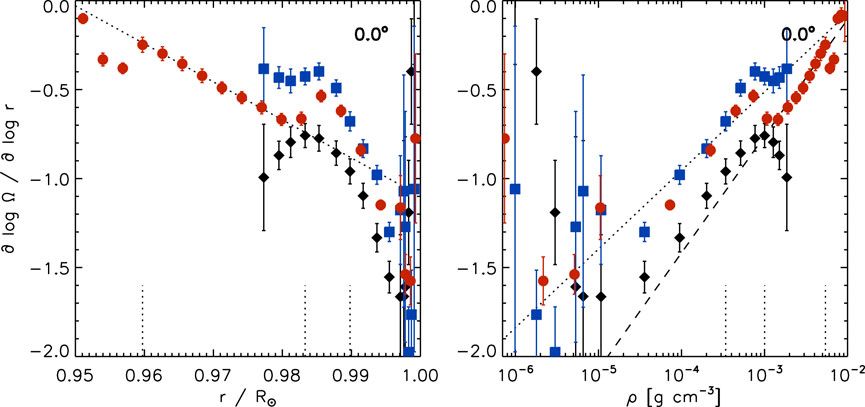
FIGURE 1. The radial gradient of the solar rotation rate as a function of radius (left) and density (right) using 15°-tile RDA (black diamonds: GONG, blue squares: HMI) and 30°-tile RDA (red circles: HMI) at the equator averaged over Solar Cycle 24. The dotted and dashed lines indicate linear and log-linear regressions, as described in the text. The short vertical dotted lines indicate four depths (.960R⊙, .983R⊙, .990R⊙, and .997R⊙).
This rapid change suggests that the radial gradient might be better represented as a function of density than radius, since the density rapidly decreases in the NSSL toward the solar surface. We used the density of a solar model, called model S (Christensen-Dalsgaard et al., 1996; Christensen-Dalsgaard, 1998). The difference in density between the Sun and model S is less than .5% at the depths considered here (Christensen-Dalsgaard, 2021, for a review). The radial gradient as a function of density also highlights its variation close to the solar surface (right). The radial gradient increases in amplitude with decreasing density from the high density region at the base of the NSSL to low density layers of 10–5 g cm−3 (or .997R⊙), reaches a maximum amplitude, and decrease in amplitude toward zero at even lower density values close to the surface. The values then vary greatly and the error bars increase very close to the surface, which reflects the increased uncertainty in the measured velocities due to the reduced number of fitted modes that represent these shallow depths.
The radial gradient varies almost linearly with logarithmic density over a range from about 10–5 g cm−3 to 10–2 g cm−3 (or about .950R⊙ to .997R⊙). This is indicated by a regression of a combination of HMI data, appropriately scaled GONG data, and scaled 30°-tile HMI data at greater density (dotted line) and a combination of GONG data from 10–5 g cm−3 to 10–3 g cm−3, appropriately scaled HMI data, and scaled 30°-tile HMI data with ρ ≥ 10–3 g cm−3 (dashed line).
Figure 2 shows the same as Figure 1 at 30° latitude. While the behavior is qualitatively the same as at the equator, the variation with radius is steeper than at the equator. This is noticeable when comparing the radial gradient at 30° to the included regressions at the equator (dotted and dashed lines). The values in the northern and southern hemisphere generally agree within one error bar.
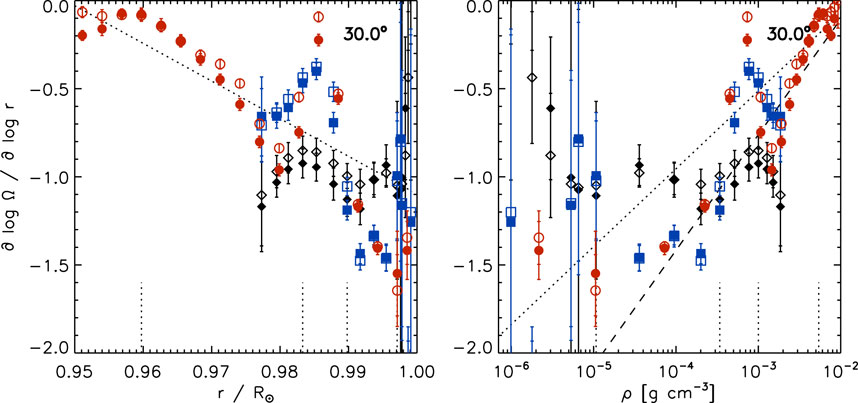
FIGURE 2. The radial gradient of the solar rotation rate as a function of radius (left) and density (right) using 15°-tile RDA (black diamonds: GONG, blue squares: HMI) and 30°-tile RDA (red circles: HMI) at 30° latitude for both hemispheres (filled symbols: southern, open symbols: northern hemisphere) averaged over Solar Cycle 24. The dotted and dashed lines are the same as in Figure 1. The short vertical dotted lines indicate four depths (.960R⊙, .983R⊙, .990R⊙, and .997R⊙). Compare with Figure 1.
When comparing the results of the GONG and the two HMI data sets in Figures 1, 2, the behavior is qualitatively the same between the three data sets. However, the gradient values differ more than one error bar. The reason for this discrepancy is that the zonal flows derived from HMI data show a local maximum near a depth of about 8 Mm (or .989R⊙), while the GONG data show a hint of a saddle point at this depth (Komm, 2021). This feature in the zonal flows leads to local maxima in the radial gradients of the three data sets with values closer to zero in HMI-derived results than in GONG-derived ones. Also, even after correcting for systematic effects, there remains an offset between the zonal flows derived from GONG and HMI data (Komm et al., 2015b), which might contribute to the quantitative differences in the radial gradient. Nevertheless, the change in the steepness of the radial gradient below and above .989R⊙ is clearly present in the zonal flow, reported by Komm (2021).
Figure 3 shows the radial gradient of the solar rotation rate as a function of latitude at different depths. Closest to the surface at .997R⊙ (top-left), the radial gradient is constant with latitude within the error bars for all three data sets. The GONG values “undulate” with latitude, while those of the HMI data are slightly steeper at the equator than at higher latitudes. Nevertheless, the radial gradients of both data sets agree within one error bar. The amplitude of the 30°-tile HMI data agrees with those of the other two data sets within ±15° latitude and increases further away from the equator.
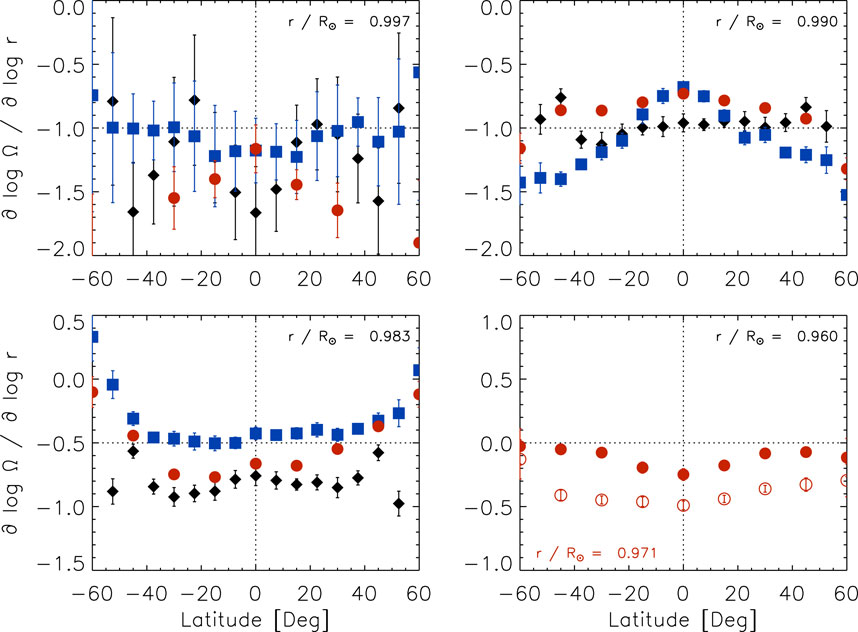
FIGURE 3. The radial gradient of the solar rotation rate as a function of latitude at four depths (top-left: .997R⊙, top-right: .990R⊙, bottom-left: .983R⊙, bottom-right: .960R⊙) using 15°-tile RDA (black diamonds: GONG, blue squares: HMI) and 30°-tile RDA (red circles: HMI) averaged over Solar Cycle 24. The open symbols indicate values at .971R⊙ (bottom-right).
At .990R⊙ (top-right), the gradients derived from the GONG and the 30°-tile HMI data are flat within about 45° latitude, while the HMI values are rather constant within ±15° and increase in amplitude at poleward latitudes. At .983R⊙ (bottom-left), the GONG- and HMI-derived values vary little within ±40° latitude, while the 30°-tile HMI values increase almost linearly with increasing latitude from −30° to 45° latitude. At poleward latitudes, both HMI data sets lead to gradients close to zero, while the corresponding GONG values remain closer to −1 at most latitudes.
At depths that can only be reached by 30°-tile RDA (bottom-right), the radial gradient varies somewhat within ±45° at .971R⊙ with slightly smaller amplitudes farther away from the equator. This variation is more pronounced at .960R⊙ where the radial gradient is close to zero at 45° and 60° latitude.
The effect of geometric foreshortening most likely explains the variation at high latitudes. For example, the HMI results are rather flat with latitude at shallow layers but large differences exist between latitudes poleward and equatorward of 45° at depths of .990R⊙ and deeper, while the GONG results show the opposite. They are rather flat at deeper layers and vary with latitude at shallow ones. This coincides with the depth and latitude ranges where both data sets show artifacts in the meridional flows (Komm et al., 2015b). It appears that the radial gradient is sensitive enough to indicate artifacts in the zonal flows that have not been noticed before.
Overall, the radial gradient of all three data sets is rather flat at low-to mid-latitudes at most depths with some exceptions. The average radial gradient of the three data sets is between about −1.1 and −1.7 at .997R⊙, about −1 at .990R⊙, between about −.5 and −.9 at .987R⊙, and negative but closer to zero at greater depths. This enables us to create the average radial gradient of the solar rotation rate over a suitable range in latitude. Figure 4 shows the radial gradient averaged over ±45° latitude. The errors are calculated as standard errors of the mean. The radial gradient almost linearly increases in amplitude from the NSSL to almost .990R⊙ (left), as in Figure 1. This variation is a bit steeper than that at the equator, indicated by the difference between the two regression curves (dashed and dotted lines). The amplitude of the radial gradient increases almost linearly with decreasing density from the base of the NSSL to less than 1.0 10–5 g cm−3 or .997R⊙, which corresponds to this density.
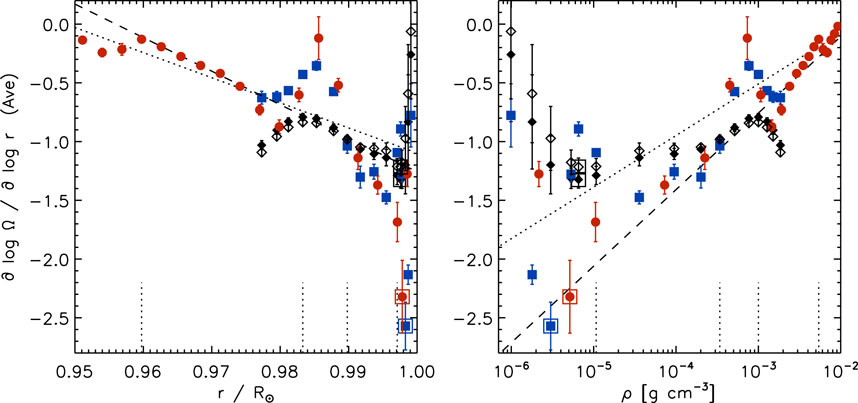
FIGURE 4. The radial gradient of the solar rotation rate as a function of radius (left) and density (right) averaged over ±45.0° latitude using 15°-tile RDA (black diamonds: GONG, blue squares: HMI) and 30°-tile RDA (red circles: HMI) covering Solar Cycle 24. The GONG values averaged over Solar Cycle 23 are included for comparison (open diamonds). Open squares indicate the location of the steepest gradient for each data set. The dashed line in the left panel is a linear regression over .960 R⊙ to .975 R⊙, while the other lines are the same as in Figure 1. The short vertical dotted lines indicate four depths (.960R⊙, .983R⊙, .990R⊙, and .997R⊙). Compare with Figures 1, 2.
The average radial gradient is steeper than −1 between .997R⊙ and .990R⊙ in all three data sets. The largest negative gradient of −2.6 ± .2 occurs close to the surface at .998R⊙ or .3 10–5 g cm−3 in density derived from HMI data. We have chosen the HMI value as representative because its mode coverage near the solar surface is better than that of GONG data due to its higher spatial resolution. The amplitude of the radial gradient then decreases toward zero close to the surface. At .990R⊙ or .34 10–3 g cm−3, the average gradient is −1.04 ± .06 derived from HMI and −.97 ± .03 from GONG data. The GONG results covering Solar Cycle 23 (CR 1979–2096) are included for comparison and show that the differences between the two cycles are within one error bar.
To summarize the results of this section, we show the radial gradient of the solar rotation rate as a function of latitude and depth averaged over Solar Cycle 24. We have chosen to show the average gradient derived from 30°-tile HMI data in Figure 5, since this data set reaches greater depths than the other two. The radial gradient is steeper than −1 between about .990R⊙ and .999R⊙ within ±60° latitude. The decrease toward zero with greater depth is the same within about 20° latitude, while at latitudes poleward of 40° this decrease is not monotonic. At these higher latitudes, the gradient can vary from close to zero at .985R⊙ to steeper than −1 at .978R⊙. The 15°-tile results derived from HMI data show the same variation with slightly more detail in latitude due to the finer RDA grid. The GONG results might be quantitatively different but show a similar behavior when accounting for the “undulations” with latitude close to the surface and the offsets at 45°, as seen in Figure 3.
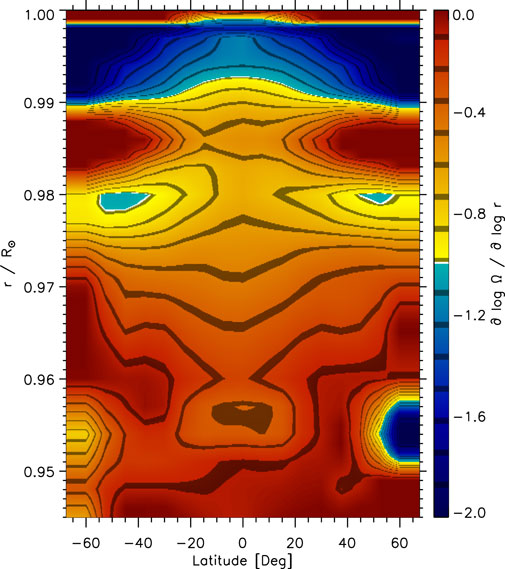
FIGURE 5. The radial gradient of the solar rotation rate as a function of latitude and radius using 30°-tile RDA results derived from HMI data averaged over Solar Cycle 24. The values have been interpolated on an equidistant grid in radius and onto the 7.5° grid in latitude used by 15°-tile RDA.
3.2 Temporal variation during solar cycles 23 and 24
In this section, we determine the long-term temporal variation of the radial gradient of the rotation rate focusing on GONG data since they provide the longest time series covering Solar Cycles 23 and 24. Figure 6 shows the radial gradient as a function of time and latitude at three depths. At locations of high magnetic activity (black contours), the radial gradient is steeper than average at .990R⊙ and .983R⊙, while closer to the surface at .997R⊙, any variation with activity is obscured by long-term offsets between latitudes. In addition, there is an offset between the values before and after 2015. At the other two depths, a similar kind of offset seems to exist between the values before and after 2017. These offsets are of unknown origin and will be investigated in the near future.
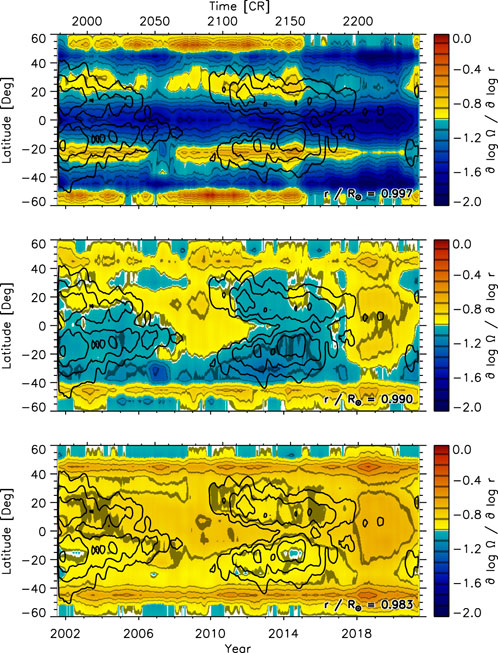
FIGURE 6. The temporal variation of the radial gradient of the solar rotation rate as a function of time and latitude at three depths (top: .997R⊙, middle: .990R⊙, bottom: .983R⊙) smoothed with a rectangular boxcar over 13 CRs (about 1 year) derived from GONG data. The time coordinate is given in years (bottom x-axis) and CRs (top x-axis). Black contours indicate magnetic activity (5, 10, 20, 40 G) smoothed over five CRs.
To determine offsets in time, we averaged the radial gradient in latitude over ±52.5° and subtracted the mean. Figure 7 shows the resulting averages for the three depths seen in the previous figure (top). There is indeed a large difference at .997R⊙ between the values before and after 2015 in the GONG data (blue crosses). At the other two depths, a jump occurs during 2017, which is also present at .997R⊙ but is not as apparent in Figure 6. The corresponding HMI averages derived with 15°- and 30°-tile RDA vary mainly with the level of magnetic activity (black line) except at .997R⊙ close to the surface. To exclude the variation with activity from the overall trend, we fitted the latitudinal averages with the corresponding averages of magnetic flux and subtracted the resulting fit from the latitudinal averages (bottom). These residual offsets are then used to detrend the time series of the radial gradients at all latitudes at each depth.
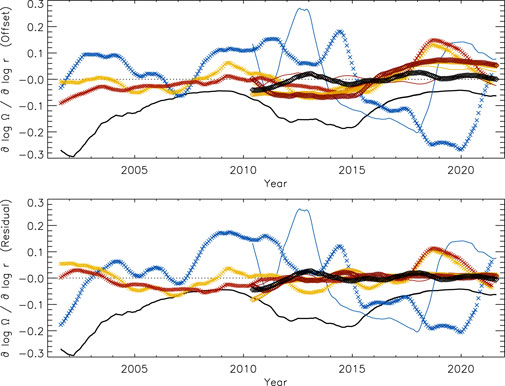
FIGURE 7. The temporal variation of the radial gradient of the solar rotation rate averaged in latitude over ±52.5° at three depths (blue: .997R⊙, yellow: .990R⊙, red: .983R⊙) using 15°-tile RDA (crosses: GONG, solid lines: HMI) and averaged over ±45.0° at three depths (yellow: .990R⊙, red: .983R⊙, black: .960R⊙) using 30°-tile RDA (diamonds: HMI) after subtracting the temporal mean (top) and subtracting the linear fit to the corresponding average of the mean activity index, MAI, (bottom). The temporal variation of the average MAI is included for comparison with its sign reversed and divided by 50 (black solid line). All curves were smoothed with a rectangular boxcar over 13 CRs.
Figure 8 shows the temporal variation of the radial gradient detrended with the residual offsets shown in Figure 7 (bottom). The variation with magnetic flux is now more apparent than in Figure 6. Even at .997R⊙, there is a hint of a flatter gradient at locations of high magnetic flux. To remove the long-term offsets between latitudes, we then subtracted the temporal mean at every latitude at each depth. Figure 9 shows the resulting residual radial gradient of the solar rotation rate. A variation with the solar cycle is now noticeable at all three depths. The residual gradient is larger (in amplitude) than average at locations of high magnetic activity at .990R⊙ and .983R⊙ and smaller than average at quiet locations. However, it is the opposite behavior at .997R⊙ with the residual gradient being smaller (in amplitude) than average at locations of high magnetic flux.
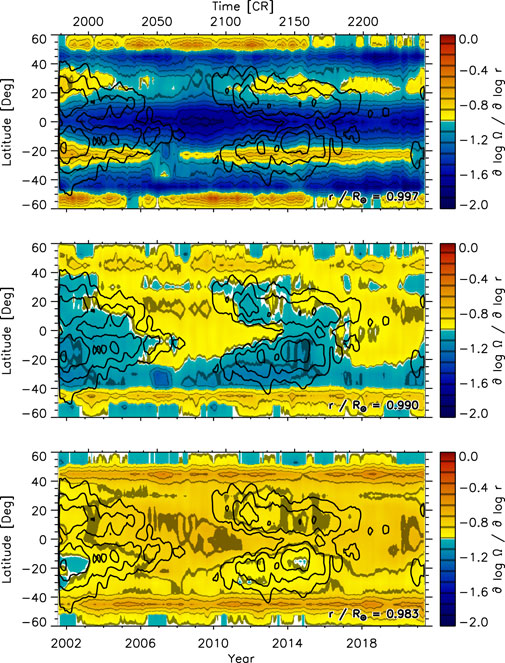
FIGURE 8. The temporal variation of the corrected radial gradient of the solar rotation rate after subtracting the average offset as a function of time and latitude at three depths (top: .997R⊙, middle: .990R⊙, bottom: .983R⊙) smoothed with a rectangular boxcar over 13 CRs derived from GONG data. The time coordinate is given in years (bottom x-axis) and CRs (top x-axis). Black contours indicate magnetic activity (5, 10, 20, 40 G) smoothed over five CRs. Compare with Figure 6.
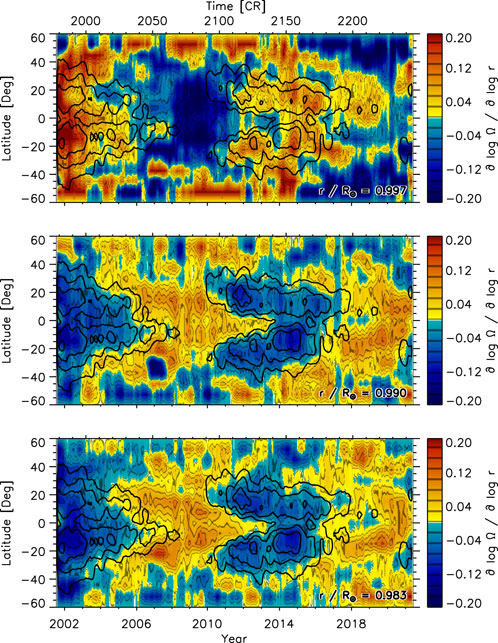
FIGURE 9. The temporal variation of the residual gradient of the solar rotation rate after subtracting the average offset and subtracting the temporal mean at every latitude at three depths (top: .997R⊙, middle: .990R⊙, bottom: .983R⊙) smoothed with a rectangular boxcar over 13 CRs derived from GONG data. The time coordinate is given in years (bottom x-axis) and CRs (top x-axis). Black contours indicate magnetic activity (5, 10, 20, 40 G) smoothed over five CRs. Compare with Figure 8.
The solar-cycle variation of the zonal and meridional flow show two other features namely poleward branches of the flow pattern and precursor patterns that appear two to 3 years before the magnetic flux (black contours) is present on the surface (Komm et al., 2018; Komm, 2021, for example). At .997R⊙, there is no discernible hint of these features given the large fluctuations at each latitude. There might be a hint of a precursor pattern in the southern hemisphere at .990R⊙ and .983R⊙ before 2010 and a hint of a poleward branch might be present in the northern hemisphere around 2014. However, the values fluctuate considerably in time at any given latitude even at these two depths and there appears to be an outlier near 2007 at −35° at all three depths. This makes the existence of these features not as conclusive as in the flow patterns themselves.
3.3 Comparing temporal variations of GONG and HMI results
In this section, we compare the GONG results with those derived from both HMI data sets. Figure 10 shows the temporal variation of the detrended radial gradient at 15° latitude averaged over both hemispheres. The corresponding MAI values are shown for comparison (top). The radial gradients derived with15°-tile and 30°-tile RDA of HMI data vary in a similar way as those derived with GONG data (2nd and 3rd). However, there are quantitative differences between the three data sets, as already discussed in the grand averages shown in Figures 1–3. For all three data sets, the steepness of the radial gradient is correlated with magnetic flux at these depths. The radial gradient at .960R⊙ and .971R⊙ derived with 30°-tile RDA of HMI data shows the same temporal variation (bottom).
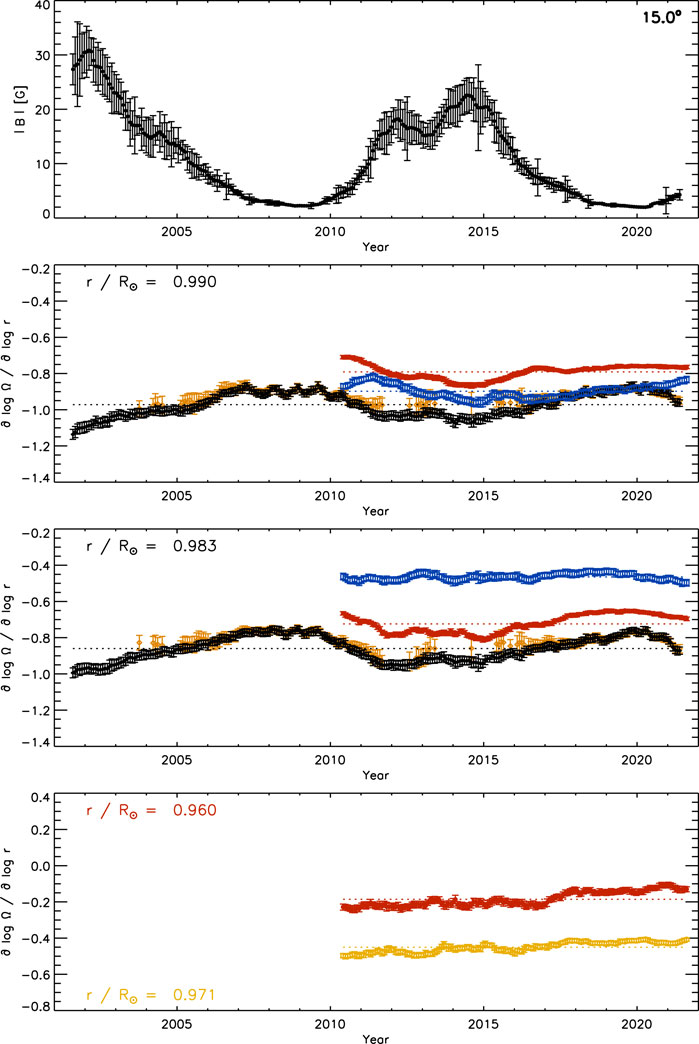
FIGURE 10. The temporal variation of the magnetic activity index, MAI, (top) and that of the corrected radial gradient of the solar rotation rate at three depths (2nd: .990R⊙, 3rd: .983R⊙, bottom: .960R⊙) at 15° latitude averaged over both hemispheres derived from 15°-tile RDA (black diamonds: GONG, blue squares: HMI) and 30°-tile RDA (red circles: HMI) smoothed with a rectangular boxcar over 13 CRs. The values of the GONG quiet-region subset are included (orange open diamonds). The bottom panel includes the variation at .971R⊙ (orange open circles). Compare with Figure 8.
To further explore the influence of magnetic flux, we include the temporal variation of the radial gradient of the rotation rate derived from the quiet-region subset of GONG data. Unsurprisingly, the values of the quiet-region subset agree within one error bar with those of the complete GONG data set at times of low magnetic activity. At times of high activity, the values of the quiet-region subset, if they can be defined, are close to the temporal mean of the complete data set.
Figure 11 shows the same as Figure 10 for the residual radial gradient after subtracting the temporal mean. At .990R⊙ and .983R⊙, the amplitude of the residual radial gradient of the three data sets is correlated with magnetic flux. The variation is similar between the GONG and the two HMI data sets. We use the standard deviation of the smoothed time series as a measure of the solar-cycle variation of the radial gradient. Using the smoothed time series ensures that fluctuations on time scales shorter than 1 year are suppressed. The resulting value is .065 for GONG data, .038 for HMI data, and .039 for 30°-tile HMI data at .990R⊙, while the corresponding values are .067, .016, and .050 at .983R⊙ respectively. At 0.960R⊙, the variation is .028 for 30°-tile HMI data. The HMI data set shows the smallest variation between times of minimum and maximum magnetic activity especially at .983R⊙, while the variation of the 30°-tile HMI data set is closer to that of GONG data. The values of the quiet-region subset derived from GONG data are close to the temporal mean of the complete GONG data set during times of high magnetic activity. The cycle variation is .033 at .990R⊙ and .040 at .983R⊙, which is close to one-half or two-thirds of that of the complete data set.
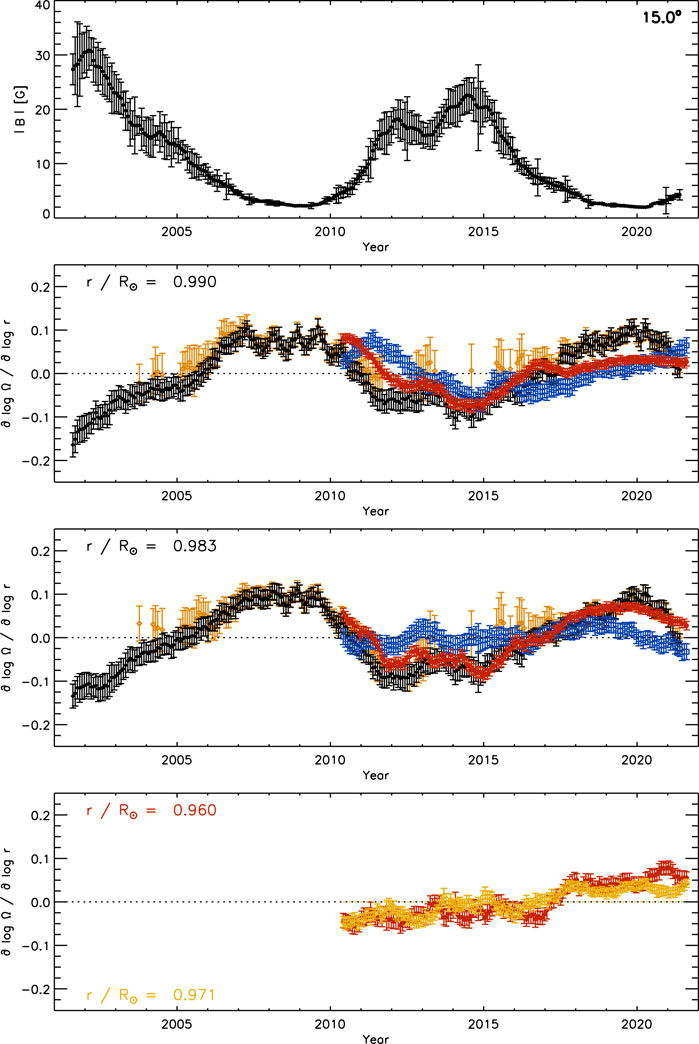
FIGURE 11. The temporal variation of MAI (top) and that of the residual radial gradient of the solar rotation rate after subtracting the temporal mean at every latitude at three depths (2nd: .990R⊙, 3rd: .983R⊙, bottom: .960R⊙) at 15° latitude averaged over both hemispheres derived from 15°-tile RDA (black diamonds: GONG, blue squares: HMI) and 30°-tile RDA (red circles: HMI) smoothed with a rectangular boxcar over 13 CRs. For the GONG quiet-region subset (orange open diamonds), the mean of the complete data set was subtracted. The bottom panel includes the variation at .971R⊙ (orange open circles). Compare with Figures 9, 10.
Figure 12 shows the same as Figure 11 for the residual radial gradient at 30° latitude averaged over both hemispheres. The temporal variation is similar to that at 15° latitude. The strong outlier in the GONG data at .990R⊙ close to 2007 is due to a large negative value in the southern hemisphere, as seen in Figure 9. To avoid this, we exclude values between 2006 and 2008 when calculating the amplitude variation. The solar-cycle variation of the radial gradient is .037 for GONG data, .054 for HMI data, and .056 for 30°-tile HMI data at .990R⊙, while the corresponding values are .037, .020, and .059 at .983R⊙ respectively. At .960R⊙, the variation is .018 derived with 30°-tile HMI data. The amplitude variation between maximum and minimum activity is, on average, comparable to that at 15° latitude even though the variation in magnetic flux is almost a factor of three smaller with 2.7 G at 30° and 8.0 G at 15° latitude. At .990R⊙, all three data sets vary in a similar way, while at .983R⊙ the variation of the HMI and GONG data sets are close and that of the 30°-tile HMI data set is somewhat different.
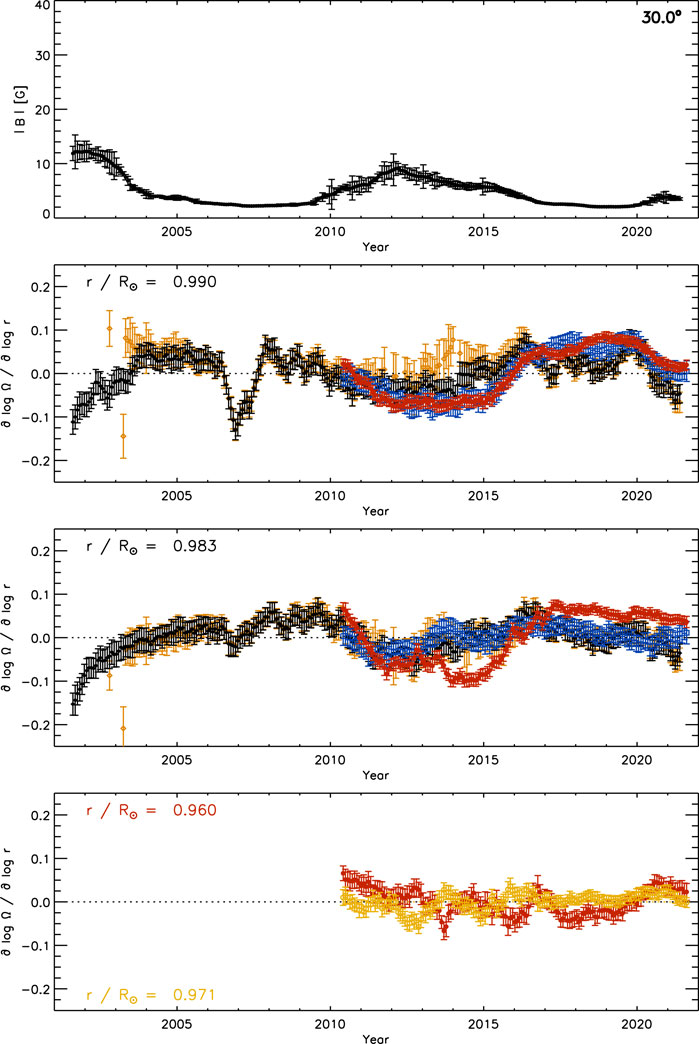
FIGURE 12. The temporal variation of MAI (top) and that of the residual radial gradient of the solar rotation rate after subtracting the temporal mean at every latitude at three depths (2nd: .990R⊙, 3rd: .983R⊙, bottom: .960R⊙) at 30° latitude averaged over both hemispheres derived from 15°-tile RDA (black diamonds: GONG, blue squares: HMI) and 30°-tile RDA (red circles: HMI) smoothed with a rectangular boxcar over 13 CRs. For the GONG quiet-region subset (orange open diamonds), the mean of the complete data set was subtracted. The bottom panel includes the variation at .971R⊙ (orange open circles). Compare with Figures 9, 11.
The values of the quiet-region subset at 30° latitude are close to those of the complete data set near solar-cycle minimum and close to the temporal mean of the complete GONG data set during times of high magnetic activity, as seen before at 15° latitude. The cycle variation is .031 at .990R⊙ and .033 at .983R⊙, which is slightly smaller than that of the complete data set.
We also compared the temporal variation of the radial gradient at .997R⊙. The radial gradient derived from GONG data is flatter than average at times of high magnetic activity and steeper at times of low activity, as seen in Figure 9, while that derived from HMI data is correlated with flux at some latitudes and anti-correlated at others. For example, at 15° latitude the HMI gradient is steeper at times of high activity and flatter at times of low activity, which contradicts the GONG results. However, the error bars are so large at this depth that the residual gradients derived with HMI and GONG data agree within one error bar even though the radial gradients show opposite temporal trends. At .997R⊙, the average error of the radial gradient derived from GONG data is .14 ± .02 at 15° and .15 ± .02 at 30° latitude, while the corresponding errors derived from HMI data are .12 ± .02 and .12 ± .02 respectively.
The base of the NSSL at .950R⊙ is accessible with 30°-tile HMI data. However, with the coarser resolution in latitude and the shorter time series compared to GONG data, we studied the variation only at .960R⊙, where we found the same behavior as shown in Figures 11, 12.
4 Discussion and conclusion
We study the radial gradient of the solar rotation rate in the near-surface shear layer (NSSL) and its variation during Solar Cycles 23 and 24 with ring-diagram analysis (RDA) applied to GONG and SDO/HMI Dopplergrams. We found that the average dimensionless radial gradient is ∂ log Ω/∂ log r = − 1.0 ± .1 at .990 R⊙. The average radial gradient is rather flat within ±40° latitude in both hemispheres from about .970 R⊙ to the solar surface. These results agree with previous global helioseismic studies (Corbard and Thompson, 2002; Barekat et al., 2014; Antia and Basu, 2022, for example). It has been suggested that the negative gradient of the rotation rate in the NSSL might be maintained by Reynolds stresses associated with the convection, transporting angular momentum inward to balance the outward transport achieved by viscous diffusion and large-scale flows in the meridional plane (De Rosa et al., 2002; Gilman and Foukal, 1979, for example).
The radial gradient, averaged over 45° latitude, increases in amplitude from −.11 ± .01 at the base of the NSSL at .950R⊙ to −.42 ± .02 at .97R⊙ and then to −1.04 ± .06 at .990R⊙, which is comparable to global helioseismic results (Antia and Basu, 2022). Between .990R⊙ and .998R⊙, the average radial gradient is steeper than -1 within the latitude range covered by GONG and HMI data. Such an increase in amplitude close to the surface has been observed before by Zaatri and Corbard (2009). They measured a radial gradient of about -350 nHz
The steepest slope of the average radial gradient is ∂ log Ω/∂ log r = − 2.6 ± .2 at .998 R⊙ (or 1.5 Mm in depth) derived from HMI data. In the corresponding GONG data, a slope steeper than −1.5 is found only at the equator. Close to the surface, substantially more modes can be fit in HMI than in GONG data due to the higher spatial resolution of the former, which might explain this difference. A radial gradient steeper than −2 close to the surface agrees with recent global results using a new technique that allows to fit high degree modes (Reiter et al., 2020).
The amplitude of the radial gradient of the rotation rate increases rapidly toward the solar surface from .986R⊙ to .998R⊙, while the radial gradient decreases slower with increasing depth below this range. This change in the steepness of the radial gradient below and above .989R⊙ is clearly present in the zonal flow, reported by Komm (2021), and leads to a local maximum or saddle point at this depth. While this behavior is qualitatively the same in all three data sets, their amplitudes differ. This illustrates how small differences in the rotation rate are amplified when calculating the derivative. Also, since the known offset between the zonal flows derived from HMI and GONG data increases with increasing latitude (Komm et al., 2015b), this might indicate that not all systematic effects are accounted for. The quantitative differences between GONG and HMI results might be due to some combination of instrumental or processing differences that range from different spectral lines (Norton et al., 2006) to different tracking rates (see Section 2).
Taken at face value, this change in the steepness of the radial gradient might imply that the NSSL consists of two separate regimes. The one near the surface coincides with a shallow shear layer within 10 Mm of the surface present in a numerical model of the NSSL with radial gradients steeper than −1 (Kitiashvili et al., 2022). While intriguing, it would be helpful if this feature of the rotation rate could be confirmed with other techniques or data sets.
Assuming that the angular momentum conservation is due to the action of supergranules, a radial gradient of −2 would be expected (Gilman and Foukal, 1979). We take the depth where the average radial gradient reaches the mean between −2 and −1 as a simple estimate of the depth extent of the influence of supergranules on the angular momentum transport. Such a value of −1.5 occurs on average at .996R⊙ (or 3.1 Mm in depth). This depth coincides with the maximum of the flow divergence of quiet regions, which represents supergranular flows, and the divergence decreases to half its maximum amplitude by a depth of about 8 Mm (Komm et al., 2017). This might imply that the upper layer of the NSSL is heavily influenced by supergranules.
The conservation of angular momentum by solar surface convection might not be the only process that maintains the NSSL. For example, Miesch and Hindman (2011) suggested that the base of the NSSL is marked by a transition from baroclinic to turbulent stresses in the meridional plane which suppress Coriolis-induced circulations. Such processes might maintain the negative radial gradient in the lower part of the NSSL.
The measured values of the radial gradient are less certain at latitudes poleward 40° than at lower latitudes. At high latitudes, some studies have shown a decrease in the absolute value of the radial gradient (Corbard and Thompson, 2002; Barekat et al., 2014), while others have shown an increase (Antia and Basu, 2022). This is generally taken as an indication that these contradictory results are due to the increased influence of systematics at high latitudes, such as geometric foreshortening, and that these results cannot be trusted. The 30°-tile HMI results offer an additional explanation; the variation of the radial gradient with depth might not be monotonic at high latitudes. The different measurements might reflect that the acoustic modes used in these studies sample somewhat different distributions in depth. A 30°-tile RDA of GONG Dopplergrams could help to distinguish between these two interpretations since GONG and HMI data have systematics with different depth dependences at high latitudes (Komm et al., 2015b).
The dimensionless radial gradient of the solar rotation rate varies with the solar cycle. At locations of high magnetic activity, the radial gradient is more negative (steeper) than average from about .97 R⊙ to .99 R⊙, while in quiet regions the radial gradient is less negative than average at these depths. The steepness of the radial gradient is thus correlated with the magnetic flux agreeing with other observations (Barekat et al., 2016; Antia and Basu, 2022). The temporal variations derived from the different GONG and HMI data sets agree within one error bar at most depths and latitudes, while their amplitudes might be different. This variation with activity might be due to the effect of magnetic field suppressing the turbulent viscosity more than the non-diffusive component of the Reynolds stress (Kitchatinov, 2016).
The solar-cycle variation of large-scale flows have other prominent features, such as poleward branches or flow patterns that are precursors of magnetic activity (Howe et al., 2013a, Howe et al., 2013b; Komm et al., 2018; Komm, 2021, for example). These features are not obviously present in the radial gradient of the rotation rate. There are some hints but they are not conclusive given the large fluctuations in time. The potential absence of these features might imply that the variation of the radial gradient indicates the presence or absence of magnetic flux. This would not be too surprising if the radial shear is only weakly sensitive to magnetic fields requiring sufficiently strong magnetic fields of the order of 1 kg (Kitchatinov, 2016). The absence of poleward branches and precursor flows then simply implies that the level of magnetic flux is below a certain threshold at these locations.
The relationship between flux and radial gradient appears to be reversed close to the surface at .997 R⊙; the steepness of the radial gradient is anti-correlated with the magnetic flux. This result is less certain than those at other depths due to the increased noise level resulting in measurement errors larger than the temporal variation. Such an anti-correlation has been previously observed near the base of the NSSL at .950R⊙ (Antia and Basu, 2022). If the near-surface result can be confirmed, this would imply that the dominant processes in the boundaries are different from those in the main body of the NSSL.
We have shown that the radial gradient of the rotation rate can be derived with local helioseismic techniques, such as RDA, and that the results agree with previous global helioseismic studies. Some of the more intriguing results will hopefully be confirmed with different global and local techniques and data sets.
Data availability statement
The raw data supporting the conclusion of this article will be made available by the authors, without undue reservation.
Author contributions
RK created the study, performed the analysis, and wrote the manuscript.
Funding
This work was supported by NASA grants 80NSSC18K1206, 80NSSC19K0261, and 80NSSC20K0194 to the National Solar Observatory and by NASA grant NNH18ZDA001N-DRIVE to Stanford University.
Acknowledgments
The data used here are courtesy of NASA/SDO and the HMI Science Team. This work also utilizes GONG data and NISP magnetograms obtained by the NSO Integrated Synoptic Program (NISP), managed by the National Solar Observatory, which is operated by the Association of Universities for Research in Astronomy (AURA), Inc. under a cooperative agreement with the National Science Foundation. I thank the reviewers for helpful comments. This study was motivated by Antia and Basu (2022).
Conflict of interest
The author declares that the research was conducted in the absence of any commercial or financial relationships that could be construed as a potential conflict of interest.
Publisher’s note
All claims expressed in this article are solely those of the authors and do not necessarily represent those of their affiliated organizations, or those of the publisher, the editors and the reviewers. Any product that may be evaluated in this article, or claim that may be made by its manufacturer, is not guaranteed or endorsed by the publisher.
References
Antia, H. M., and Basu, S. (2022). Changes in the near-surface shear layer of the Sun. Astrophys. J. 924, 19. doi:10.3847/1538-4357/ac32c3
Antia, H. M., Basu, S., and Chitre, S. M. (2008). Solar rotation rate and its gradients during cycle 23. Astrophys. J. 681, 680–692. doi:10.1086/588523
Barekat, A., Schou, J., and Gizon, L. (2016). Solar-cycle variation of the rotational shear near the solar surface. Astron. Astrophys. 595, A8. doi:10.1051/0004-6361/201628673
Barekat, A., Schou, J., and Gizon, L. (2014). The radial gradient of the near-surface shear layer of the Sun. Astron. Astrophys. 570, L12. doi:10.1051/0004-6361/201424839
Basu, S., Antia, H. M., and Bogart, R. S. (2004). Ring-diagram analysis of the structure of solar active regions. Astrophys. J. 610, 1157–1168. doi:10.1086/421843
Basu, S., Antia, H. M., and Tripathy, S. C. (1999). Ring diagram analysis of near-surface flows in the Sun. Astrophys. J. 512, 458–470. doi:10.1086/306765
Bogart, R. S., Baldner, C., Basu, S., Haber, D. A., and Rabello-Soares, M. C. (2011b). HMI ring diagram analysis II. Data products. J. Phys. Conf. Ser. 271, 012009. doi:10.1088/1742-6596/271/1/012009
Bogart, R. S., Baldner, C., Basu, S., Haber, D. A., and Rabello-Soares, M. C. (2011a). HMI ring diagram analysis I. The processing pipeline. J. Phys. Conf. Ser. 271, 012008. doi:10.1088/1742-6596/271/1/012008
Brandenburg, A. (2005). The case for a distributed solar dynamo shaped by near-surface shear. Astrophys. J. 625, 539–547. doi:10.1086/429584
Charbonneau, P. (2020). Dynamo models of the solar cycle. Living Rev. Sol. Phys. 17, 4. doi:10.1007/s41116-020-00025-6
Christensen-Dalsgaard, J., Dappen, W., Ajukov, S. V., Anderson, E. R., Antia, H. M., Basu, S., et al. (1996). The current state of solar modeling. Science 272, 1286–1292. doi:10.1126/science.272.5266.1286
Christensen-Dalsgaard, J. (2021). Solar structure and evolution. Living Rev. Sol. Phys. 18, 2. doi:10.1007/s41116-020-00028-3
Christensen-Dalsgaard, J. (1998). The ’standard’ Sun modelling and Helioseismology. Space Sci. Rev. 85, 19–36. doi:10.1023/A:1005116132024
Corbard, T., and Thompson, M. J. (2002). The subsurface radial gradient of solar angular velocity from MDI f-mode observations. Sol. Phys. 205, 211–229. doi:10.1023/A:1014224523374
Corbard, T., Toner, C., Hill, F., Hanna, K. D., Haber, D. A., Hindman, B. W., et al. (2003). “Ring-diagram analysis with GONG++.” In GONG+ 2002. Local and global Helioseismology: The present and future, ed. H. Sawaya-Lacoste. 517, (CA, United States: ESA SP).
De Rosa, M. L., Gilman, P. A., and Toomre, J. (2002). Solar multiscale convection and rotation gradients studied in shallow spherical shells. Astrophys. J. 581, 1356–1374. doi:10.1086/344295
Dikpati, M., Corbard, T., Thompson, M. J., and Gilman, P. A. (2002). Flux transport solar dynamos with near-surface radial shear. Astrophys. J. Lett. 575, L41–L45. doi:10.1086/342555
Gilman, P. A., and Foukal, P. V. (1979). Angular velocity gradients in the solar convection zone. Astrophys. J. 229, 1179–1185. doi:10.1086/157052
González Hernández, I., Komm, R., Hill, F., Howe, R., Corbard, T., and Haber, D. A. (2006). Meridional circulation variability from large-aperture ring-diagram analysis of global oscillation network Group and Michelson Doppler imager data. Astrophys. J. 638, 576–583. doi:10.1086/498642
Haber, D. A., Hindman, B. W., Toomre, J., Bogart, R. S., Larsen, R. M., and Hill, F. (2002). Evolving submerged meridional circulation cells within the upper convection zone revealed by ring-diagram analysis. Astrophys. J. 570, 855–864. doi:10.1086/339631
Harvey, J., Tucker, R., and Britanik, L. (1998). High resolution upgrade of the GONG instruments. In Struct. Dyn. Interior Sun Sun-like Stars, 418 of ESA Special Publication, 209.
Harvey, J. W., Hill, F., Hubbard, R. P., Kennedy, J. R., Leibacher, J. W., Pintar, J. A., et al. (1996). The global oscillation network Group (GONG) project. Science 272, 1284–1286. doi:10.1126/science.272.5266.1284
Hill, F. (1988). Rings and trumpets—three-dimensional power spectra of solar oscillations. Astrophys. J. 333, 996. doi:10.1086/166807
Howe, R., Christensen-Dalsgaard, J., Hill, F., Komm, R., Larson, T. P., Rempel, M., et al. (2013a). The high-latitude branch of the solar torsional oscillation in the rising phase of cycle 24. Astrophys. J. Lett. 767, L20. doi:10.1088/2041-8205/767/1/L20
Howe, R., Christensen-Dalsgaard, J., Hill, F., Komm, R., Larson, T. P., Schou, J., et al. (2013b). “The torsional oscillation and the timing of the solar cycle: Is it maximum yet?” in Fifty years of seismology of the Sun and stars. Editors K. Jain, S. C. Tripathy, F. Hill, J. W. Leibacher, and A. A. Pevtsov (San Francisco: Astronomical Society of the Pacific Conference Series), 478, 303.
Howe, R., Komm, R., Hill, F., Ulrich, R., Haber, D. A., Hindman, B. W., et al. (2006). Large-scale zonal flows near the solar surface. Sol. Phys. 235, 1–15. doi:10.1007/s11207-006-0117-2
Howe, R. (2009). Solar interior rotation and its variation. Living Rev. Sol. Phys. 6, 12942. doi:10.12942/lrsp-2009-1
Kitchatinov, L. L. (2016). Rotational shear near the solar surface as a probe for subphotospheric magnetic fields. Astron. Lett. 42, 339–345. doi:10.1134/S1063773716050054
Kitchatinov, L. L., and Rüdiger, G. (2005). Differential rotation and meridional flow in the solar convection zone and beneath. Astron. Nachrichten 326, 379–385. doi:10.1002/asna.200510368
Kitiashvili, I. N., Kosovichev, A. G., Wray, A. A., Sadykov, V. M., and Guerrero, G. (2022). Leptocline as a shallow substructure of near-surface shear layer in 3D radiative hydrodynamic simulations. arXiv e-prints, arXiv:2203.01484.
Komm, R., Corbard, T., Durney, B. R., González Hernández, I., Hill, F., Howe, R., et al. (2004). Solar subsurface fluid Dynamics descriptors derived from global oscillation network Group and Michelson Doppler imager data. Astrophys. J. 605, 554–567. doi:10.1086/382187
Komm, R., González Hernández, I., Howe, R., and Hill, F. (2015a). Solar-cycle variation of subsurface meridional flow derived with ring-diagram analysis. Sol. Phys. 290, 3113–3136. doi:10.1007/s11207-015-0729-5
Komm, R., González Hernández, I., Howe, R., and Hill, F. (2015b). Subsurface zonal and meridional flow derived from gong and SDO/HMI: A comparison of systematics. Sol. Phys. 290, 1081–1104. doi:10.1007/s11207-015-0663-6
Komm, R., Howe, R., and Hill, F. (2017). Solar-cycle variation of subsurface-flow divergence: A proxy of magnetic activity? Sol. Phys. 292, 122. doi:10.1007/s11207-017-1142-z
Komm, R., Howe, R., and Hill, F. (2020). Solar-cycle variation of the subsurface flows of active- and quiet-region subsets. Sol. Phys. 295, 47. doi:10.1007/s11207-020-01611-5
Komm, R., Howe, R., and Hill, F. (2018). Subsurface zonal and meridional flow during cycles 23 and 24. Sol. Phys. 293, 145. doi:10.1007/s11207-018-1365-7
Komm, R. (2021). Subsurface horizontal flows during solar cycles 24 and 25 with large-tile ring-diagram analysis. Sol. Phys. 296, 174. doi:10.1007/s11207-021-01923-0
Kosovichev, A. G., Schou, J., Scherrer, P. H., Bogart, R. S., Bush, R. I., Hoeksema, J. T., et al. (1997). Structure and rotation of the solar interior: Initial results from the MDI medium-L Program. Sol. Phys. 170, 43–61. doi:10.1023/A:1004949311268
Miesch, M. S., and Hindman, B. W. (2011). Gyroscopic pumping in the solar near-surface shear layer. Astrophys. J. 743, 79. doi:10.1088/0004-637X/743/1/79
Norton, A. A., Graham, J. P., Ulrich, R. K., Schou, J., Tomczyk, S., Liu, Y., et al. (2006). Spectral line selection for HMI: A comparison of Fe I 6173 Å and Ni I 6768 Å. Sol. Phys. 239, 69–91. doi:10.1007/s11207-006-0279-y
Pesnell, W. D., Thompson, B. J., and Chamberlin, P. C. (2012). The solar Dynamics observatory (SDO). Sol. Phys. 275, 3–15. doi:10.1007/s11207-011-9841-3
Pipin, V. V., and Kosovichev, A. G. (2011). The subsurface-shear-shaped solar αΩ dynamo. Astrophys. J. Lett. 727, L45. doi:10.1088/2041-8205/727/2/L45
Reiter, J., Rhodes, J., Kosovichev, A. G., Scherrer, P. H., Larson, T. P., and Pinkerton, S. F. (2020). A method for the estimation of f- and p-mode parameters and rotational splitting coefficients from un-averaged solar oscillation power spectra. Astrophys. J. 894, 80. doi:10.3847/1538-4357/ab7a17
Rhodes, J., Edward, J., Cacciani, A., Korzennik, S., Tomczyk, S., Ulrich, R. K., et al. (1990). Depth and latitude dependence of the solar internal angular velocity. Astrophys. J. 351, 687. doi:10.1086/168507
Scherrer, P. H., Schou, J., Bush, R. I., Kosovichev, A. G., Bogart, R. S., Hoeksema, J. T., et al. (2012). The helioseismic and magnetic imager (HMI) investigation for the solar Dynamics observatory (SDO). Sol. Phys. 275, 207–227. doi:10.1007/s11207-011-9834-2
Schou, J., Antia, H. M., Basu, S., Bogart, R. S., Bush, R. I., Chitre, S. M., et al. (1998). Helioseismic studies of differential rotation in the solar envelope by the solar oscillations investigation using the Michelson Doppler imager. Astrophys. J. 505, 390–417. doi:10.1086/306146
Schou, J., Scherrer, P. H., Bush, R. I., Wachter, R., Couvidat, S., Rabello-Soares, M. C., et al. (2012). Design and ground calibration of the helioseismic and magnetic imager (HMI) instrument on the solar Dynamics observatory (SDO). Sol. Phys. 275, 229–259. doi:10.1007/s11207-011-9842-2
Snodgrass, H. B. (1984). Separation of large-scale photospheric Doppler patterns. Sol. Phys. 94, 13–31. doi:10.1007/BF00154804
Thompson, M. J., Toomre, J., Anderson, E. R., Antia, H. M., Berthomieu, G., Burtonclay, D., et al. (1996). Differential rotation and Dynamics of the solar interior. Science 272, 1300–1305. doi:10.1126/science.272.5266.1300
Zaatri, A., and Corbard, T. (2009). “The solar subsurface radial gradient of angular velocity as revealed by ring diagram analysis,” in Dynamos as revealed by helio- and asteroseismology: Gong 2008/SOHO 21. Editors M. Dikpati, T. Arentoft, I. González Hernández, C. Lindsey, and F. Hill (San Francisco: Astronomical Society of the Pacific Conference Series), 416, 99.Solar-Stellar.
Keywords: the Sun, solar cycle, solar interior, solar rotation, helioseismology, observations, velocity fields
Citation: Komm R (2022) Radial gradient of the solar rotation rate in the near-surface shear layer of the Sun. Front. Astron. Space Sci. 9:1017414. doi: 10.3389/fspas.2022.1017414
Received: 12 August 2022; Accepted: 12 December 2022;
Published: 22 December 2022.
Edited by:
Mausumi Dikpati, National Center for Atmospheric Research (UCAR), United StatesReviewed by:
Shravan Hanasoge, Tata Institute of Fundamental Research, IndiaJoão Manuel Fernandes, University of Coimbra, Portugal
Copyright © 2022 Komm. This is an open-access article distributed under the terms of the Creative Commons Attribution License (CC BY). The use, distribution or reproduction in other forums is permitted, provided the original author(s) and the copyright owner(s) are credited and that the original publication in this journal is cited, in accordance with accepted academic practice. No use, distribution or reproduction is permitted which does not comply with these terms.
*Correspondence: Rudolf Komm, cmtvbW1AbnNvLmVkdQ==