
95% of researchers rate our articles as excellent or good
Learn more about the work of our research integrity team to safeguard the quality of each article we publish.
Find out more
ORIGINAL RESEARCH article
Front. Astron. Space Sci. , 30 January 2023
Sec. Cosmology
Volume 9 - 2022 | https://doi.org/10.3389/fspas.2022.1014433
In response to all current cosmological controversies, this paper provides a reliable explanation of the Hubble tension and of the apparent acceleration of space expansion detected by SN Ia. In the first place, it calculates the redshift from Einstein field equations (EFE) assuming a Friedman–Lemaitre–Robertson–Walker–Trinchera (FLRWT) metric framework due to the deformation of the spacetime fabric, causing a redshift due to a time dilation. In the second place, this study computes the dominant cosmological redshift contribution given by the transit redshift due to multiple interactions between photons and electrons in the intergalactic medium and not sustained in Einstein field equations. It is fully consistent with Wigner’s solid-state physics and Ashmore’s physics which predict the crystallization of free electrons at very low temperatures and the interaction with photons of light without scattering and blurring effects. The outcome of this inquiry fully matches the observational data given by the redshift-independent extragalactic distances (NED-D) and by the Chandra/XMM-Newton database of quasars for a specific density of matter in the Universe.
The Hubble tension problem concerns the detection of different Hubble constant values, varying from 67 km/secMpc up to 73 km/secMpc, based on different applied measurement methods and depending on the direction in the sky toward which the observations are conducted. According to standard cosmology, the Hubble constant is associated with the expansion rate of the Universe, and therefore, the deviating measurements may only involve an effective different spatial rate of space expansion, leading accordingly to a revision of the fundamental assumptions and calculations, or an intrinsic theoretical issue in the concordance model recently come to the surface though cutting-edge observational methods which requires accordingly a new mindset in cosmology. It is important to point out that Friedmann equations (Friedmann, 1999) describe an expanding Universe in the concordance model, which represent only one set of several admissible solutions of Einstein field equations (EFEs) (Einstein, 1917). The Friedmann–Lemaitre–Robertson–Walker metric (FLRW) (Robertson, 1935; Robertson, 1936; Walker, 1937; Lemaitre, 2013), on which Friedmann’s result is based, assumes that the proper time is equal to the coordinate time anywhere in the Cosmos. However, the FLRW metric leaves open many cosmological scenarios if its single terms are differently analyzed. Indeed, other scientific studies have been performed to modify the FLRW metric in different forms (Endean, 1994; Ibison, 2007; Grøn and Johannesen, 2011; Vavrycuk, 2022) with different outcomes. On this trail, this work starts from the assumption that the deformation of the spacetime fabric, conceived through EFE in general relativity (GR), provides a redshift in terms of time dilation meant as a permitted solution set in outcome from GR. Moreover, we rigorously compare this outcome with the latest observational data in order to investigate if this contribution alone is sufficient to characterize the cosmological redshift or if another existing component has to be brought into play. In this regard, it is important for us to point out that GR can only intrinsically conceive, independently under the boundary conditions considered in input such as the metric, an outcome strictly related to the intrinsic spacetime properties in its entirety and for a specific density of matter in the Universe, excluding any a priori possible physical effect occurring in the space itself (e.g., interactions between photons and free particles on the journey through space) as accurately discussed in this work.
Einstein’s GR is the currently accepted theory of gravitation which describes many astrophysical phenomena and objects such as gravitational waves, black holes, precession of stars, planet orbits, and lensing effects. In cosmological terms, a solution of EFE in which the space is not expanding, but rather is an apparent phenomenon as a result of a time dilation effect, is formally conceived in the scientific literature by other important studies (Potter and Preston, 2007; Li, 2014; Baird, 2018) and in other inquiries due to the influence that the encounter of photons has with astronomical objects in space (Churchman, 2004; Meures and Bruni, 2012). For this reason, this study aims to define a metric in the EFE capable of describing the influence that the distorted fabric of spacetime has on photons from a temporal perspective during their long journey throughout space and from which we can draw important conclusions on the cosmological redshift origin. The latter is still debated in the so-called cosmological crisis. For our purpose, in the most recent and relevant scientific document (Vavrycuk, 2022), which will be mentioned again during the calculations, the author claims that the FLRW metric itself can predict the cosmological redshift in terms of time dilation independently on the expansion of space, which cannot change the frequency of the transit photons throughout the Universe. Moreover, it excludes the dark energy as a cosmological argument as it is no longer required in the equations. This inquiry agrees that the dark energy is only a result of one different set of solutions from GR in standard terms and that, in contrast to Vavrycuk’s calculations, the time dilation effect can be calculated as one small contribution to the cosmological redshift given by the introduction of a time factor in the metric, whereas the main contribution is given by the transit redshift. The latter cannot be sustained by EFE under any circumstance. For this reason, it has to be introduced as an external factor in the equations, similar to the introduction of the scale factor in standard cosmology. Another inquiry (Grøn and Johannesen, 2011) introduced the conformal time in parametric form into the FLRW metric which leads to a coordinate transformation. In this case, the scale and time factor are basically the same entity in the FLRW equation, undergoing the same assumptions of homogeneity and isotropy and leading to a non-expanding Universe characterized by a flat-spatial curvature. Moreover, introducing a quantum approach (Potter and Preston, 2007), the inquiry explains the acceleration of SNe Ia through the gravitational potential, eliminating, in this case, the need for an expanding space. It is also stated that each gravitationally bound system obeys some specific quantum rules for which any observer can only detect a redshift due to the transit of photons through gravitational wells. Intrinsically, this inquiry involving the FLRWT metric in the EFE distinguishes between the gravitational redshift and cosmological redshift as we are dealing with, respectively, the spatial and temporal changes in the gravitational field and their influence on photons of light between an emitter and a receiver in the Cosmos, as also concluded by the previously mentioned inquiry (Vavrycuk, 2022).
In order to establish a mutual interdependence between energy in the Universe and its geometry, a metric has to be defined. It is a 4D geometry in which two events in spacetime located on its spherical surface can be properly described. The time required by a photon of light to travel inside the spacetime geometry depends on the assumptions that we make. Indeed, we introduce, derive, and discuss the Friedmann–Lemaitre–Robertson–Walker–Trinchera metric (FLRWT) in this paragraph. The standard approach to build up the modified FLRW metric, which introduces a symmetry, homogeneity, and isotropy in the mathematical framework and strongly reduces the number of differential equations in EFE, starts from the basic definition of the distance between two events,
where R is the radius of the Universe, r’ is the radial coordinate, and
which, in differential terms, becomes
from which, in turn, we determine
As the spatial curvature is related to the radius of the Universe as follows:
we obtain from Eq. 5 that
Due to this, the metric previously formulated in Eq. 2 becomes
from which we can now explicitly distinguish between proper time
from which
and accordingly, in differential terms from Eq. 9, we can write that
and
In turn, the curvature of the Universe, previously defined mathematically in Eq. 6, is k’ = k’(t) and can be accordingly expressed as
By introducing the time factor
where squaring both members yields
We openly created a relation between the time measured by an emitter and that measured by an observer in the Universe. Moreover, in order to make the symbology uniform, without any specific physical meaning, we can write in Eq. 8 that
In his recent scientific document, V. Vavrycuk rigorously demonstrated how, by considering light photons traveling through null geodesics in the FLRW metric in an expanding space, an important mathematical and physical inconsistency emerges (Vavrycuk, 2022): the invalidity of the fundamental FLRW hypothesis of invariance of the time coordinates. The author solves the problem by assuming the equality of the distance traveled by light photons propagating along the same path from an emitter to a receiver. Consequently, the cosmological redshift is accordingly only a result of the time dilation rather than an expanding space. Moreover, in his approach, he openly compares the inconsistency of the Friedmann solutions with the intrinsic results and physical boundaries contained in the Schwarzschild solution in which a photon of light is emitted close to a massive object, deforming the spacetime surrounding and received by an observer at a certain distance. In this case, the difference between proper and cosmic or cosmological time plays an important role in the calculation of the redshift of light photons during the path toward the observer. If we ignore this aspect in the FLRW, by means of the time invariance applied to the entire Universe, we lose information on the real origin of the cosmological redshift. As opposed to Vavrycuk’s approach, we consider the variance of time coordinates by introducing a time factor T(t) in the FLRW metric in order to remain conceptually on the trail of Schwarzschild’s approach in his historical solution. An important common outcome from Vavrycuk’s study is that gravitational and cosmological redshifts are well-distinguished entities: the first one is due to the spatial change of the gravitational field surrounding gravitational objects, whereas the second one is the result of the temporal change in the gravitational field, or rather, the apparent expansion of space here properly described by means of a time dilation effect (despite, as we will see later, another contribution which has to be summed up to match the whole cosmological redshift based on observational data). These considerations allow us to proceed with the mathematical steps starting from the last obtained expression of the metric contained in Eq. 8, together with the remark in Eqs 15, 16 and replacing all terms previously calculated, as follows:
In case of
Going back to the FLRWT metric of Eq. 17, we can explicitly separate the variables from their multiplying factors and impose
for facilitating the GR calculations contained in Appendix A and Appendix B, and by simplifying the symbolism for space and time factor, we can determine its final expression as
The metric tensor in EFE can be extracted from Eq. 20 as
At this point, we can enter in more detail the GR mathematics which will eventually lead us to the redshift calculation. We have to solve EFE for the zero–zero components of the Ricci tensor, the metric tensor, and the stress–energy–momentum tensor, as follows:
corresponding exactly to Eq. A36 in Appendix A. As shown, we adopt the mathematical expression of EFE presented in Einstein’s first GR paper, which does not yet involve the cosmological constant. Due to this, starting from the Christoffel symbols and the calculation of all their components, we can also determine the non-zero components of Ricci curvature tensor and the non-zero components of the stress–energy–momentum tensor (in the hypothesis of a homogenous and isotropic universe and in the perfect fluid hypothesis) as precisely shown in Appendix A. It leads to a differential equation that is function of the time and space factor according to the following expression recalled by Eq. A44 is:
At this stage, contrary to the assumption and the procedure followed by the concordance cosmology, we conceptually and mathematically impose a non-expanding Universe, with
A unitary space factor literally means that the distance of an astronomical object from an observer’s perspective is unique and does not co-move in concordance terms. Accordingly, from Eq. 23, we obtain that
The latter shows how EFE can also be characterized in terms of time dilation instead of an expanding space. In order to re-build and make the units of measurement uniform, the square of the speed of light is inserted again, which was previously set to one in Eq. 19; now, it is not applied, so Eq. 25 becomes
With the assumption that the radius R of the spherical geometry is extremely huge and tending to infinity or rather
we basically define a flat spacetime with these properties. Accordingly, as the radius of the Universe, R, can be approximated with the radial coordinate, r, at infinity, its spatial curvature now assumes the following expression:
Replacing this value in Eq. 26 yields
or rather
In Eq. 20, on the trail of the mathematical considerations made by de Sitter (in form and not in content as he actually dealt with the scale or space factor through effective argumentation), we impose an exponential time factor in the following form:
where
Therefore, due to the square factor, we can mathematically describe the zero–zero component of the metric tensor in Eqs 20, 21 as
The presence of a time factor in the denominator of the expression is exponentially characteristic and is not randomly established, but rather, it is based on the physics of the problem: in the first place, our search concerns an observed exponential redshift trend, based on observational data, for increasing distances (as we will see later in the redshift plots), and in the second place, the equations can only admit a reliable physical result with this kind of reasoning and mathematical approach, on the conceptual trail of Schwarzschild and the de Sitter approach.
Our target is now to express the result of Eq. 30 in a reliable approximated exponential form without altering the physical and mathematical meaning. Therefore, according to a Taylor expansion series
(this assumption is justified by low values of time dilation as shown in the later plots). We can approximate the zero–zero component of the metric tensor of Eq. 33 as
which implies that in Eq. 30
where we identify Einstein’s cosmological constant
Indeed, the parameter
which is exactly the cosmological constant derived in Eqs 38, 39. Going back to the result obtained in Eq. 40 and extending Eq. 33, the zero–zero term of the metric tensor becomes
For this reason, the FLRWT metric of Eq. 20 now takes the form
and accordingly, the time dilation is expressed by
or, namely,
The absence of the coefficient
As shown in Figure 1, it is possible to visualize the concept of time dilation in a deformed spacetime due to the presence of an average density of matter embedding the emitter and the receiver. This kind of event, under investigation in this inquiry, is conceptually compared to the Schwarzschild solution due to the presence of a compact object close to the emitter. The emitter and the receiver, instead of being placed in vacuum (in the Schwarzschild solution, the emitter is embedded in the gravitational field of the compact object), are now fully embedded in the average density of matter which, in turn, determines a redshift associated with a time dilation.
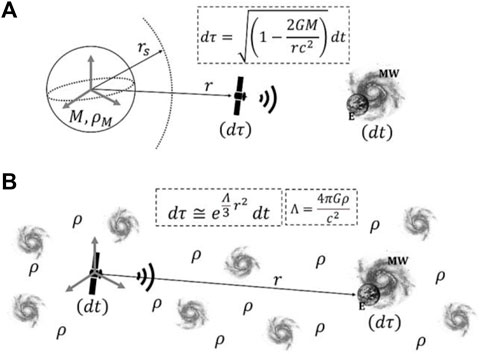
FIGURE 1. Schematic representation of the comparison between the Schwarzschild solution (A) and the solution of EFE through a FLRWT metric framework (B), both in terms of time dilation. r is the radial distance,
Accordingly, an important aspect in the result of Eq. 47 concerns both the definition of the radial distance r and the definition of the astronomical object experiencing the proper time. The radial coordinate departs theoretically from the center of the 4-dimensional sphere, and we know that the center of an infinite sphere (in a flat spacetime) can be anywhere. Moreover, we rely on the fact, based on observations, that the longer the path traveled by the photon, the higher the redshift measured. It is a result we want to converge. Thus, due to the assumptions of homogeneity, isotropy, and flat spacetime, we can arbitrarily set the position of the center of the sphere in correspondence with the emitter, whereas the proper time can only be associated with the receiver in order to detect a time dilation and, accordingly, a positive redshift. The swap in the assignment of cosmic time and proper time is allowed by the boundary conditions of the inquiry, and it is physically sustained by the result of the main derived equation.
Referring to the time solution of Eq. 47, by using a different symbolism, respectively, at which the photon (identified by the index “
and multiplying both members by the speed of light c
From the known general relation between wavelength and frequency
we can, therefore, introduce the wavelength of the photons in reception and in emission
Accordingly, the redshift due to a time dilation in the FLRWT framework applied to EFE becomes
We can finally make important remarks as follows:
and
As a consequence of the deformation of the spacetime fabric from EFE, the photons exponentially increase their wavelength during their journey. A receiver will, therefore, detect a redshift. The higher the distance traveled by the photons, the greater, although small in quantity, the time dilation and, accordingly, the redshift experienced. Conversely,
and
The shorter the distance traveled from the photons, the smaller the time dilation; in this case, the photons are emitted closer to the receiver. The photons have to overcome less resistance, in terms of time variation of the gravitational potential of the average mass density in the Universe, during its short journey through space compared to a grand voyage. At
The cosmological redshift cannot be given by the time dilation contribution alone
where
Collecting the values, we found that the cosmological redshift is eventually equal to a nominal component
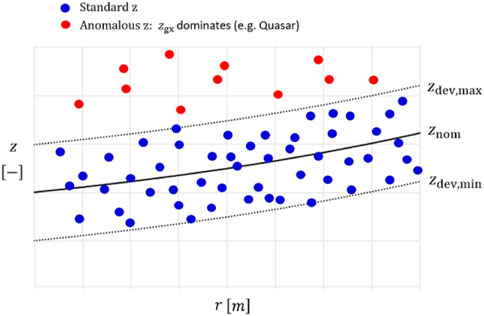
FIGURE 2. Schematization of the cosmological redshift given by the sum of a nominal contribution and a deviating contribution. Red dots represent the anomalous redshift deviating from the standard observational range zdev,max and zdev,min.
We always measure and visualize a dispersion of data following an exponential trend. The data will generally occupy positions across the exponential curve across a nominal value depending on the proper motion of the galaxies. Redshift data lying exactly on the exponential curve (black) might indicate that the galaxy motion is purely tangential without recession or approach components. Similarly, with data values exceeding the redshift range between two extreme values, it means that the galaxies have an extreme electron density driving the anomalous redshift (it might be the case of quasars (QSOs) which show an excess redshift in the Hubble curve: they have a big data dispersion in the z-plot as well since they do not follow any specific linear or exponential trend for increasing distance in space). Indeed, they do not follow the same trend as that of the galaxies and cannot be considered as cosmological objects, in concordance model terms. If we zoom in for small redshift values, the exponential curve appears like a straight line (consideration made by E. Hubble with the first extragalactic redshift–distance relation for “small” extragalactic distances). To summarize, we can mention two concrete astrophysical instances for a better comprehension: in the first case, an AGN has a full tangential motion with respect to our terrestrial perspective, and therefore, we can expect a redshift lying within the deviation strip (exactly on the nominal trend in black, in this specific case); but if the electron density of the astronomical object is extremely high and multiple interactions between photons and free electrons take place in the galactic environment, we can detect an excessive redshift value with respect to our expectations according to the trendline. An assumption is that we know the distance of the AGN by means of at least one distance ladder method. In a second instance case, a classic spiral galaxy, similar to the Milky Way or Andromeda, with a known free-electron density due to the photoionization of HI regions, shows a proper motion toward our direction, and therefore, the redshift appears at the lower limit of the deviation strip, under the nominal curve, without any redshift excess. Also, in this case, the distance observer-galaxy has to be known through one of the distance ladder methods, in order to succeed in the calculation of the
The interactional or transit redshift is the shift of the absorption and emission lines in the light spectrum as a result of the encounter of a photon of light with an electron-Wigner crystal in the IGM, supposed to be empty but actually containing .5 el/m3. This factor and its impact on the cosmological redshift are not considered by the current concordance cosmology. Solid-state physics is the theory involved. It is really important to document in a clear and concise manner the main mechanism based on known physics driving the redshift in the Cosmos in an alternative to a purely mathematical expanding space. The first conceptual ideas regarding photons of light losing energy traveling throughout space has been expressed first by some important papers (Zwicky, 1929; Nernst, 1938) and reconsidered by other prominent scientists (Pecker and Vigier, 1987; Arp, 1990) until recent successful and rigorous developments (Ashmore, 2019; Ashmore, 2022). Due to the photoelectric effect, stars literally split neutral hydrogen atoms, separating electrons by protons in the galaxies. For this reason, free electrons fill the IGM and are subject to extremely low temperatures between galaxies. A similar process occurs to the free protons which are pushed out together with the free electrons by stellar winds in the outer regions of the galaxies. Free electrons are lighter (rest mass energy equal to 511 keV) and move toward the IGM, whereas the heavier protons (938 MeV) might be gravitationally bound to the external galactic regions, most likely forming dark matter which influences the galactic rotational curves. Certainly, some electrons and protons recombine to form neutral hydrogen again. The freedom of movement of the electron, or, namely, its kinetic energy, is related to its temperature. From a certain range and going toward the absolute zero, the electrons start to crystallize and coalesce (Wigner, 1934; Wigner, 1938). Moreover, the existence of Wigner crystals has been confirmed by recent investigations (Smoleński et al., 2021) in an application field different from cosmology. At lower temperatures, the potential energy of the electron
where ne is the electron density, e is the electron charge, ε0 is the permittivity in vacuum, Rsp is the radius of the Wigner–Seitz sphere surrounding the electron, kB is the Boltzmann constant, and T is the temperature. A Wigner crystal is a transparent object having a polyhedral shape; two or more electron crystals together form a structure such as a grid and permeate the IGM. Each electron is centered in the crystal and the system electron crystal behaves like a harmonic oscillator. It is visualized in Figure 3.
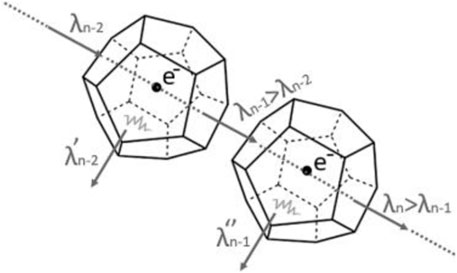
FIGURE 3. Schematization of Weigner–Seitz electron crystals centered on electrons. No scattering process occurs. The incoming photon of light undergoes a redshift due to absorption and re-emission by the system electron crystal. Secondary photons originate from the recoil of the electron crystals and undergo the same process.
When the light passes through the crystal, it causes the system to recoil. The transparency of the crystal is the dominant factor in order to avoid the blurring effect of the light. Indeed, based on observational data, we do receive photons of light without blurring effects. They travel in a straight line through the Cosmos and scatter, in concordance terms, with a 0° scattering angle. We now know that only an absorption and re-emission process with a recoil of the electron crystal system takes place, in which the photons of light lose energy at each transit. Indeed, during these steps and in order to oscillate, the system gains energy from the photon of light and the latter loses part of its initial energy. A less energetic photon of light has a longer wavelength, or rather it is redshifted as illustrated in Figure 4. Every single step of the process is innovatively described in Ashmore’s new tired light (NTL) theory. Moreover, the recoiling system dissipates the energy by emitting a secondary photon in the Cosmos which, in turn, undergoes the same interactional process as the previous “father” photon in income.
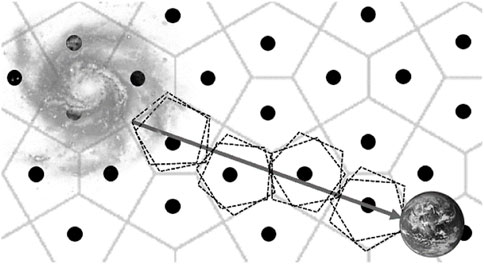
FIGURE 4. Schematization of the IGM made of a Wigner–Seitz electron crystal grid through which photons of light travel. The arrow represents the photon path. Dotted lines characterize the harmonic motion performed by each crystal for a photon transit. The observed wavelength is redshifted compared to the emitted one.
Compton scattering and Thomson scattering are generally based on a “local” investigation in a galactic environment at high temperatures and, therefore, not consistent with the behavior of the IGM. It is important to stress that the cosmological distances are extremely huge on a human scale. In a short distance, the redshift is negligible but at a cosmological scale, the multiple interactions between photons and electron crystals play an important role in the cosmological redshift. It increases exponentially with the distance, and it is the function of the electron density in the IGM. Similarly, even the free-electron density in the ISM must play a role in the redshift measurements. As previously mentioned in Eqs 60, 61, the mathematical expression for the interactional redshift in the IGM according to Ashmore’s theory is given by
where the Hubble constant is the function of the electron density and of the electron properties as
This result is only valid in the IGM for that specific free-electron density. It is conceptually easy to understand that the redshift varies with the electron density of the medium through which photons of light travel. It is the reason why we detect different Hubble constants in different directions in space (so-called Hubble tension problem) on a wide value range varying from 67 km/secMpc up to 73 km/secMpc with many values in between. It is a clear signal that these redshift anomalies cannot be related to the expanding space in the concordance model but rather to another cause: the multiple interactions between photons and electrons causing a transit redshift
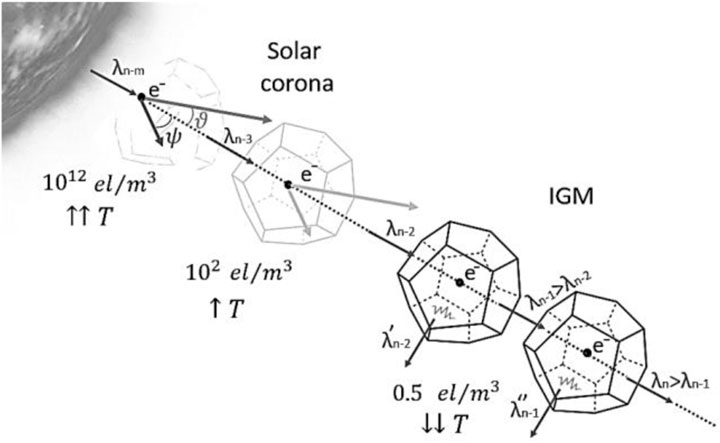
FIGURE 5. Schematization of the different interactions between photons and electrons from a stellar photosphere up to the IGM. The further the light travels from the source, the less dominant the Compton and Thomson scattering processes become. T indicates the temperature.
The concordance model assumes that the distance between the emitter and the observer was lower at the moment of emission as the space expanded during the long journey of the photons. This assumption can be misleading as a high redshift is accordingly associated with an expanding space and a different epoch of emission. However, there are some tools that do not consider this mechanism and allow scientists to compare a redshift with the spatial position of an astronomical object exclusively based on known distance ladder methods excluding the “epoch reasoning” (Lerner, 2018). Indeed, we can refer to the observational redshift data from the database of redshift-independent extragalactic distances (NED-D) and plot in Figure 6, represented by black dots. The method adopted for the measurements is based on standard candles such as Cepheids and Type Ia supernova, or standard rulers such as globular cluster radii and masers. Moreover, distances are also provided by known recognized methods such as the Tully–Fisher method or fundamental plane (Steer, 2020). The linear trendline (violet line) of the observational data in the outcome from the spreadsheet is given by
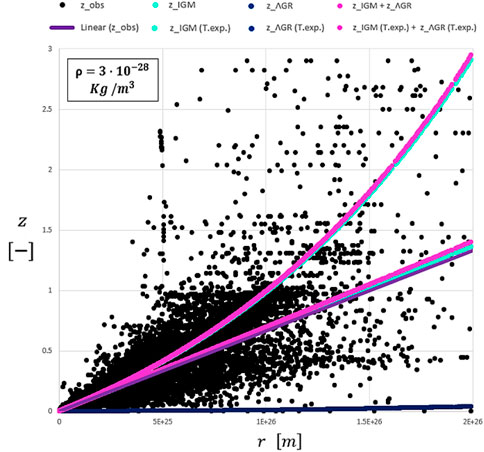
FIGURE 6. Comparison between independent extragalactic redshifts (black dots) and its linear trend (violet line) with nominal redshifts determined by pure formulations (fuchsia, sky-blue, and blue exponential curves) and by Taylor expansion (fuchsia, sky-blue, and blue lines) reported as “T.exp.” The blue lines overlap with the blue curve.
By means of a Taylor expansion series to the first order, we obtain the trendline of the redshift due to EFE using the FLRWT metric (blue line) as
whereas the trendline of the redshift due to multiple interactions between photons and electrons in the IGM (sky-blue line) is given by
The latter overlaps with its exponential trend. Accordingly, the summed-up contribution (fuchsia line) of Eqs 67, 68 is
In order to have a better awareness of the units, 1E+26 m corresponds to 3.24 Gpc (or 10.5 Gly). As explained, the violet line represents the linear trend of the observational redshift measurements (black dots), and it is accordingly compared with the Einsteinian redshift approach by means of a FLRWT metric and the contribution of the transit redshift (fuchsia line). It is also possible to identify its exponential trend (fuchsia curve).
From the graph, it is possible to state that the redshift calculated with the Einsteinian approach due to time dilation together with the transit redshift contribution in the IGM (fuchsia line) based on Ashmore’s physics approximates well with the trendline (violet line) of the observational data. Much closer is the single trendline (sky-blue line) of the transit redshift contribution alone due to multiple interactions between photons and electrons in the IGM. However, there might be an overestimation of the density of visible matter in the Universe. Therefore, the plot visibly changes by reducing the density value so that we observe a flattening of the curves as shown in Figures 7 and 8; the trendlines tend to overlap with each other by reducing the matter density in the Universe.
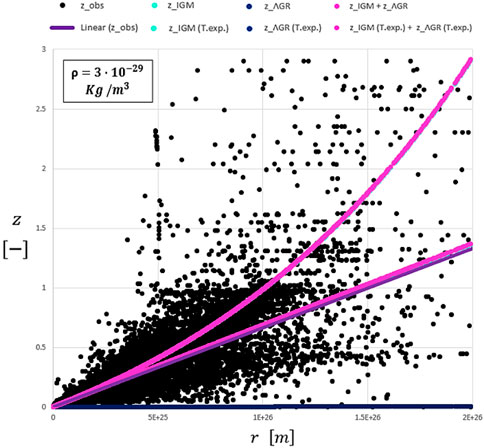
FIGURE 7. Plot of Figure 6 with a smaller average mass density of visible matter.
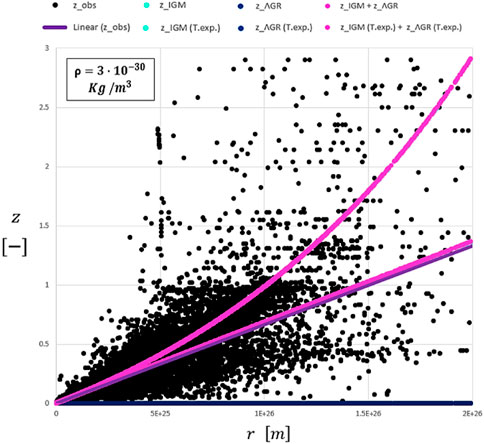
FIGURE 8. Plot of Figure 7 with a smaller average mass density of visible matter.
Moreover, it is important to point out that the current observational NED-D plot (black dots) is still incomplete due to the current telescope resolutions and due to the time dedicated for observations for this scope. In this case, the linear trendline determined in the spreadsheet might show a different gradient which could match the Einsteinian trendline with the first value of density considered or even with higher values at first strike.
A perfect match can be obtained for smaller values of the average density of matter in the Universe. The final value can only be given by exact and converging observations from all satellites and calculation methods.
Starting from the mathematical expression of the cosmological redshift in Eq. 69, we can calculate the cosmological redshift gradient as
Moreover,
By shifting to a temporal approach, the time that the light takes to reach an observer is directly proportional to the distance as
from which,
Substituting the value in Eq. 69 yields
From Eq. A35 in Appendix A, we can calculate the equation of state of the Universe after several mathematical steps as derived in Appendix B. It leads to Eq. B14, here recalled by
relating the pressure to the energy density in the Cosmos and representing the equation of state of our Universe as it can be equally written in concordance terms as
We can investigate the following case:
if the following condition is satisfied
It is the threshold distance
Based on what we daily observe through ground and space telescopes, the Universe is dominated by radiation and matter. The latter is responsible for the emission of radiation. However, it is possible to highlight how Eq. 77 recalls a relativistic expression for a radiation-dominated Universe in which the pressure is equal to one-third of the energy density
under the condition:
which admits the following solutions:
or
From the perspective of this mathematical framework, they are supposed to be logical solutions. Indeed, in the first case of Eq. 87, at infinity and due to geometrical considerations, we would apparently observe the entire sky filled with sources emitting radiation, although the radiation would be redshifted or time dilated (not detected) as argued in the next paragraph. Moreover, we know from Olbers’ paradox that there is an observational limit over which we cannot receive photons of light. In the second case of Eq. 88, we would similarly observe a full sky filled with radiation-emitting sources at any generic distance r as the cosmological constant is directly related to the matter content of the Universe.
Due to the deformation of the spacetime fabric and due to the transit physics previously discussed, any observer in the Cosmos will experience a delay in the arrival of the light photons, given by
The first contribution is provided by Eq. 47, whereas the second one can be derived from Eq. 64 as
The third contribution is due to the physical time required by the light to cover any distance r in the Cosmos. According to all these contributions, Eq. 89 becomes
As shown in Figure 10, the third contribution, given by the time required by the light to travel in space and represented by the linear trend, is dominant. It is a result compatible with a non-expanding Universe.
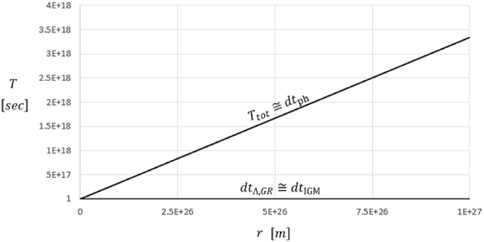
FIGURE 10. Total time dilation varying with the distance to the emitter experienced by any observer in the Cosmos. The graph has been calculated for a matter density in the Universe equal to 3E-28 kg/m3.
From 1E+27 m (corresponding to almost 31 Gpc and 106 ly), both time dilation due to EFE and the photon transit start to increase until they diverge, overcoming the time required by the light to reach the observer, for higher distance values.
Considering the redshift in terms of “apparent” recession velocities as repeatedly expressed by E.P. Hubble regarding the non-expanding nature of the redshift (Hubble and Tolman, 1935; Hubble, 1947), we can write the known Hubble approximation as
from which
From observational data in Eq. 66, we can write that
which yields
As Eq. 69 is formally not an exact straight line, we can also extract the linear trendline from the spreadsheet with the following result:
Similarly, for a different value of the matter density in the Universe,
and
With the same procedure, we can calculate the related values of the Hubble constant as follows:
Due to these steps, we can finally state that the observed Hubble constant coincides with the equivalent Hubble constant extracted by the cosmological redshift as follows:
Also, in this case, it is important to stress that if we were able to fill in the whole redshift plot with observational data (more black dots) in Figure 6, especially for higher distances and redshifts, we might expect a slight increase in the gradient of the observational trendline (and its related observational Hubble constant), and therefore, we would match the equivalent Hubble constant by means of a different density of matter in the Universe at first strike, without arguing about the variability of the density parameter.
In temporal terms, considering Eq. 60 and its dominant nominal contribution,
expanding the right-hand side according to a Taylor expansion series, this time, up to the second order:
Also, in this case, due to Eq. 72, it yields
equivalent to writing
where the equivalent temporal Hubble constant is
Derived with respect to time and substituting Ashmore’s value of Eq. 65, it follows that
The latter precisely represents the value of the acceleration found by observational data through SN Ia (Riess et al., 1996; Schmidt et al., 1998; Perlmutter et al., 1999). Also, in this case, it is possible to state that not only the expansion of space itself but also its acceleration is a deception given by the increase of the cosmological redshift for increasing distances, due to a time dilation effect from EFE and a dominant contribution given by multiple interactions between photons and electron crystals in the IGM due to the photon transit physics.
We can extend the same mathematical and physical arguments to quasars with the difference of having to identify in advance some intrinsic peculiarities in this particular category of AGNs. Recently, very important studies on quasars focused their attention on angular size measurements from data outcomes based on the very long baseline interferometry (VLBI) (Cao et al., 2017), on the apparent magnitude included in the distance modulus (DM), and on the flux received in the UV and X-ray domain of the light spectrum (Risaliti and Lusso, 2019). In the results, QSOs are considered in accordance with the standard cosmology as a standard ruler in the Cosmos. Specifically, the second article mentioned provides a comparison between the measured DM against the detected redshift according to important quasar catalogs: QSOs follow the SN Ia trend within z < 1.4 in the context of an accelerating Universe for the current recognized cosmology model. It is important to stress that despite the objective scientific importance of the paper, the inquiry does not provide a concrete distance between QSOs and a terrestrial observer. The authors implicitly infer the distances on the basis of the DM and the flux corrections without plotting them as a well-identified parameter. Conversely, in this inquiry, we do use the same database as a reference, extended in samples, and apply a different approach not based on the DM and flux received but rather on the redshift measurement with a remarkable outcome. The redshift itself is decisively the main parameter on which we focus. Independently, on the energy content of the radiation per unit of square centimeters, just one single photon is necessary for undergoing the redshift chain described in this unique scientific approach, for calibrating distances, and for drawing conclusions on the cosmological redshift. Indeed, once the physical conformation and characteristics of the astronomical object under investigation, redshift included, are well-identified, we are able to extract all required information: distance, redshift corrected from the intrinsic components, and apparent QSO acceleration trend in line with the inquiry on galaxies performed in Section 4. For our purpose, the nature of analyzed light also plays an important role in the sense that, for instance, an X-ray emission in QSOs is associated with the inner part of the accretion disk (AD) close to the supermassive black hole (SMBH), from which we can accurately determine the gravitational redshift contribution at the point of departure of the photons.
A key feature of a generic QSO object lies in its definition as an AGN in which we identify an SMBH at the center, an accretion disk, and other elements which play a part in the redshift analysis. Based on transit physics reasoning, these factors are the density of electrons in its surroundings, in the narrow line region (NLR), broad line region (BLR), and the dusty torus and the perspective line of an external observer. In this regard, the angle of observation is very important: indeed, a QSO is defined within an angular observation smaller than 90° between the relativistic jet direction and its orthogonal direction. Thus, depending on the spatial orientation of the quasar with respect to the observer position, we could detect higher or smaller apparent magnitude. Indeed, a QSO is perfectly represented in section on a plane, but it is possible to imagine it as a three-dimensional object that can assume different spatial positions with respect to the observer, varying accordingly the amount of energy received. A QSO/AGN schematization is shown in Figure 11, where all single parameters are accurately described in Section 5.3.
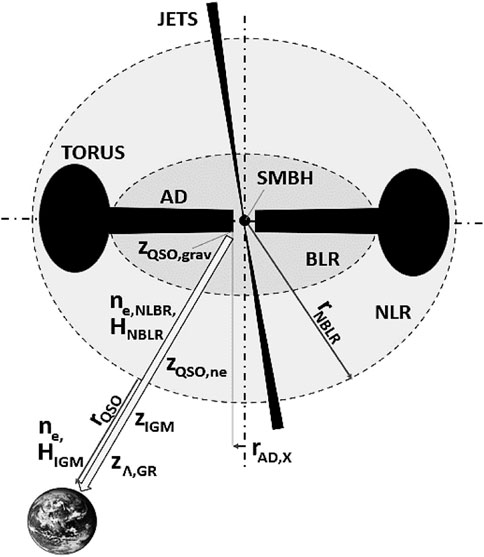
FIGURE 11. Schematization of the unified AGN model of a QSO from a terrestrial observer (not on scale) in the context of transit physics. The long solid arrow represents the photon path undergoing chain electron encounters in the broad and narrow line regions and in the IGM. The departure point is the most inner radius of the accretion disk from which X-ray photons form.
In general terms, the standard model of cosmology over the years focused its attention on theoretical concepts in which the further we look into the Cosmos, the younger any astronomical object should be. However, observations show that young and old galaxies are present at any epoch (Krauss, 1997; Girelli et al., 2019) including our current one, where we should detect only old objects. Therefore, we expect to observe young and old QSOs at any epoch of the Universe. Furthermore, QSOs are believed to be decisive in the re-ionization of the Universe in its early stages as to their alleged cosmological distance, despite them showing a peculiar average redshift range between one and two in the vast majority of observed samples. As an AGN in its gradual evolving process, the central SMBH of QSOs begins to swallow up mass, due to the presence of an accretion disk, and to release a large amount of energy outward through the relativistic jets; then, in a late stage, it gradually fades out. The surrounding neutral hydrogen HI is significantly ionized with a separation between the proton and the electron in the atom. In addition to this process, dust particles of the torus inject extra free electrons into the QSO environment due to the photoelectric effect (Ashmore, 2022). As a result, we identify an NLR and a BLR in the QSO surroundings characterized by a high free-electron density.
With the previous arguments and the related AGN overview, we can correlate transit physics to the detected redshift, as, according to this approach, it is precisely the electron density that rules the redshift: the greater the density of free electrons around the QSO, the greater the redshift that we measure. Also, in the case of QSOs, as with galaxies, the important contribution of the intergalactic redshift, by means of the small electron density in the IGM, affects the cosmological redshift during the long journey through space. Excluding the inquiry on galaxies in previous sections, evidence for this statement is provided on smaller scales, such as our solar environment, by observational data by means of the so-called limb-redshift anomaly at the solar corona: at any orbital position of the Earth with respect to the Sun, the path traveled by the photons is higher at the limb than that at the center. It determines anomalous measurements in which photons are over-redshifted at the limb as the photons themselves encounter more free electrons on their longer geometrical path (Trinchera, 2021). Now, we can imagine a similar process occurring on bigger astronomical objects and scales such as galaxies or quasars. In these specific cases, however, the free-electron density is extremely high and the distance traveled by the photons is short, despite being much longer than 1 AU in the NLR and BLR of QSOs. It causes an excess redshift or an intrinsic redshift value to include in the calculation. In intergalactic terms, we can also shift perspectives as the transit redshift can also take place along immense distances (in the IGM) in which the smallest electron density ever measured, equal to .5 el/m3, comes into play. Although this inquiry is original, the argument concerning an intrinsic redshift component in QSOs is not new in the scientific community (Zackrisson, 2005; Bell and McDiarmid, 2006; Bell, 2007; López-Corredoira, 2011), and it is still a topic of debate. Other controversies are provided by other detailed studies on the physical proper motion possessed by quasars, not related to the relativistic effects of jets, where we actually expect firm QSOs in the background (Souchay et al., 2022) if we really expect them at those cosmological distances. Moreover, QSOs apparently in front of low-redshift galaxies have also been detected and reported in other studies (López-Corredoira and Gutiérrez, 2006), which further reinforce the enigma of these mysterious astronomical objects. These discoveries are labeled as an observational coincidence and a special astronomical case diverging from the recognized theory, whereas in reality, these exceptions are the concrete tools that provide powerful information on the true nature of the cosmological redshift. A change of mindset is required for the correct interpretation and understanding of QSO scientific data.
QSOs can be handled as a cosmological probe once the excess or intrinsic redshift components are removed. In the first place, we assume that the parameter pair redshift measurements and DM together are synonymous with distance in the standard model of cosmology (as QSOs have high redshift and high luminosity and, therefore, are associated with high astronomical distances at time of emission). According to this reasoning, we can synthetically estimate the distance of QSOs from the DM relation
from which the apparent inferred distance
As mentioned, the QSO catalog to which we refer is much more extended (database J/A + A/642/A150/table3.dat) and includes 2,421 quasar samples (Lusso et al., 2020). In a very similar way to what we performed previously with galaxies, we can also calculate the two main contributions, namely,
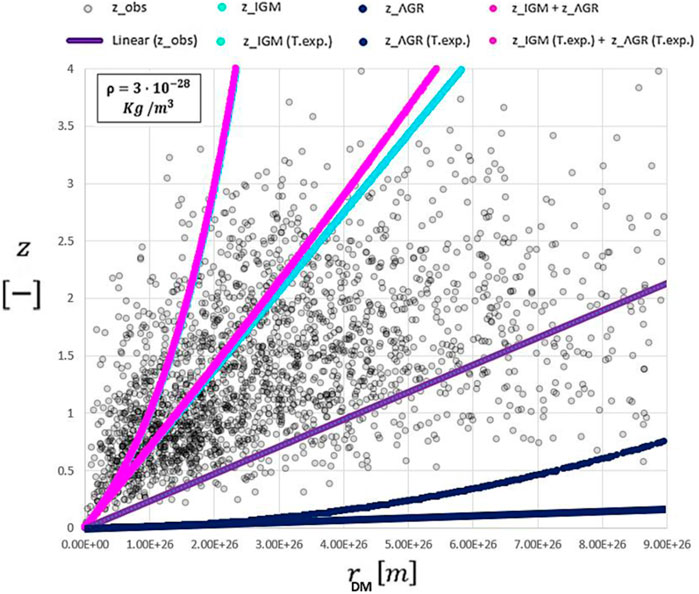
FIGURE 12. Comparison between quasar redshifts (gray dots) and its linear trend (violet line) with nominal redshifts determined by pure formulations (fuchsia, sky-blue, and blue exponential curves) and by Taylor expansion (fuchsia, sky-blue, and blue lines) reported as “T.exp.” Lines and curves of this plot are affected by errors due to the calibration of the QSO distances.
The problem in determining distances in QSOs lies crucially in the absence of similar and alternative measurement methods used for galaxies. In every galaxy investigation, all distance values determined by other methods are compared with the DM. The deviation is very low. It accordingly provides reliable distance measurements. The point to investigate concerns how it is possible to obtain such high DM values from QSOs, or rather such low apparent magnitude, and high apparent distances and, simultaneously, redshift values in a specific range. This is the core not only of this study but of the entire modern cosmology. As we will see, it is the conformation or the nature of QSOs themselves through the electron density in their surroundings that imply these very high apparent distances when, in reality, QSOs are located closer in space than expected by the DM relation. In fact, from simple deductions, it is possible to calculate the excess redshift possessed by QSOs and their corresponding distance in space from a terrestrial perspective. This clearly indicates that the measurement of the QSO DM, given by the apparent magnitude minus the absolute one, distorts the results with respect to that obtained for the 147,363 available galaxies. Effectively, QSOs are totally different from galaxies in every respect, especially in conformation, spectrum lines, and redshift. Based on their morphology, we can deduce their distance by focusing on the redshift and not on the DM. In order to carry out a realistic analysis of the parameters and plot the redshift versus the real distances, we have to recall the fundamental Eq. 59 and re-name the components as follows:
from which
Here,
where
where
where, according to Ashmore’s physics, the Hubble constant in the QSO surroundings is given by the modification of Eq. 65 as
Based on these considerations and after several algebraic steps contained in Appendix D, we can extract the following expression of the unknown variable from Eq. 114:
Eq. 118 coincides with derived Eq. D8, and it is a quadratic equation; therefore, it admits only this physically consistent solution. On average, the effective distances
It is important to point out that, regardless of the method used to determine the distances of QSOs, almost all of their redshifts, as visible in Figures 12 and 13, are located between one and two which denotes de facto the intrinsic nature of the redshift measurements.
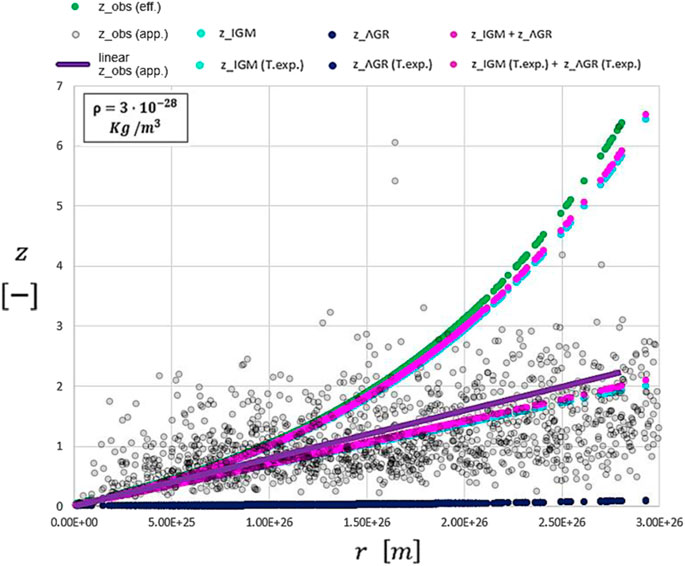
FIGURE 13. Comparison between apparent quasar redshifts (gray dots) with effective quasar redshifts (green dots) based on the effective distances and its linear trend (violet line). All other contributions are represented by the fuchsia, sky-blue, and blue exponential curves and by their Taylor expansions (fuchsia, sky-blue, and blue lines) reported as “T.exp.” The blue line overlaps with the blue curve.
As previously investigated and performed, we can now reduce the matter density of the Universe from 3E-28 kg/m3 directly to 3E-30 kg/m3; all curves shown in Figure 14 overlap. It is consistent proof that even QSOs, after identifying the intrinsic contributions due to transit physics and the intensive local gravitational field near the SMBH, perfectly follow the same apparent Hubble constant
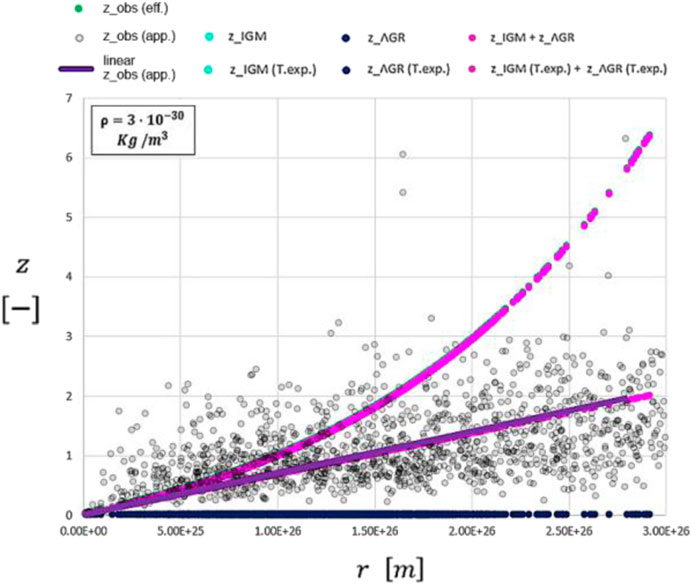
FIGURE 14. Plot of Figure 13 with a smaller matter density of the Universe.
Ultimately, we can state that the Hubble constant is not related to the expansion of the Universe but rather to the interactions between photons and electrons along the cosmic path throughout the Cosmos. Moreover, QSOs follows the same apparent expansion rate as galaxies and SNe Ia.
It is possible to summarize the important outcomes of this QSO chapter based on the recognized scientific model of a QSO described as AGN of Figure 11 and in the plots of Figures 13, 14. The radiation travels first through a high-dense bubble of free electrons surrounding the QSO due to the HI photoionization process and the photoelectric effect on dust particles in the torus. This causes a first peak in redshift when the radiation leaves the QSO. This contribution is the redshift excess of QSOs
The higher the distance traveled by a photon from an emitter to a receiver, the higher the time dilation measured in the receiver reference frame. It is purely a consequence of the distortion of the spacetime fabric due to the presence of an estimated mass density of visible matter in the Universe as an outcome of EFE in flat spacetime by means of an FLRWT framework. However, in addition to the small redshift contribution provided by the time dilation from EFE, the dominant cosmological redshift contribution is given by multiple interactions between photons and electrons in the IGM: the transit redshift. Its mechanism is well supported by Wigner’s solid-state physics, Ashmore’s physics, and observational data from the NED-D database of independent redshifts concerning galaxies and from the Chandra/XMM-Newton database regarding quasars. Due to low temperatures, free electrons crystallize in space and form sturctures such as an oscillating grid which is responsible for the photon energy loss at each crystal transit. One crystal is centered into one free electron. Indeed, the sum of these two mentioned contributions
The current average value of the Hubble constant intrinsically encloses information on the main redshift contributions previously calculated. It should not be surprising to detect different Hubble constants in the sky in the Hubble tension problem as they are strictly related, in addition to the constant and small free-electron density in the IGM, to the free-electron density in the surroundings of the astronomical object which varies from case to case in the Universe. Therefore, different values of the Hubble constant are not necessarily associated with the rate of expansion of the Universe. Furthermore, the acceleration of the apparent expansion, claimed to be measured by means of the SN Ia curves, is a deception given by the increase in the nominal redshift with the distance traveled by the photons. The acceleration value calculated for galaxies and quasars coincides with that calculated in expanding terms. The pillars in the accepted concordance cosmology, cosmological redshift, and acceleration of SNe Ia, can be alternatively explained without resorting to standard arguments and stumbling across a pure mathematical expanding space.
Due to the constancy of the speed of light, the time dilation provided by the speed of light in arrival and detected by a receiver is dominated by the time itself required by the light to travel the cosmic distances. Also, this result is compatible with a non-expanding Universe. Once the threshold corresponding to about E+27 m is reached, corresponding to about 30 Gpc or 100 Gly, the time dilation from EFE diverges. These results are fully consistent with the threshold distance within which we calculate a negative pressure, given by EFE, balancing the apparent expansion of space.
Regarding the galaxies, the assumption of an expanding space in the EFE misleads the observational data which can be interpreted based on the known calculation distance methods without involving the epoch of emission. Indeed, the redshift-independent extragalactic distances (NED-D) are the main references for the cosmological redshift in the equations and in the plots of this inquiry.
The gravitational redshift is a tiny vanishing component of the cosmological redshift. Its contribution in emission is counterbalanced during the transit of photons in the IGM and in detection. The cosmological redshift takes into account two main contributions.
- The redshift due to the time dilation is associated with the deformation of the spacetime fabric due to the average density matter in the Universe. This contribution is sustained by EFE by adopting a FLRWT metric framework in its entirety.
- The transit redshift in the IGM due to multiple interactions between photons and crystallized electrons (forming an oscillating grid) is based on Wigner and Ashmore’s physics and not sustained by EFE.
The redshift measured vs. effective distance of QSOs is in agreement with the apparent expansion of space, deduced by galaxies and SNe Ia, at z < 1.4 for a matter density of the Universe equal to 3E-28 kg/m3, whereas it is in full agreement at any redshift for a matter density of the Universe equal to 3E-30 kg/m3. Moreover, the study reveals that, by means of the Transit Physics method, QSOs are 40% closer in space with respect to the distance modulus approach.
All the results of this inquiry are valid in the reference frame of any receiver all over the Cosmos. Any receiver will detect an increasing redshift for increasing distances traveled by photons: the “apparent” space expansion of the Universe is actually related dominantly in the first place to the transit of photons of light in the IGM and in the second place to the time dilation from EFE with a FLRWT metric due to the deformation of the spacetime fabric.
The original contributions presented in the study are included in the article/Supplementary Material, further inquiries can be directed to the corresponding author.
The author confirms being the sole contributor of this work and has approved it for publication.
The author declares that the research was conducted in the absence of any commercial or financial relationships that could be construed as a potential conflict of interest.
All claims expressed in this article are solely those of the authors and do not necessarily represent those of their affiliated organizations, or those of the publisher, the editors, and the reviewers. Any product that may be evaluated in this article, or claim that may be made by its manufacturer, is not guaranteed or endorsed by the publisher.
Arp, H. C. (1990). Comments on tired-light mechanisms. IEEE Trans. Pl. Sci. 18 (1), 77. doi:10.1109/27.45508
Ashmore, L. E. (2019). Calculating the redshifts of distant galaxies from first principles by the new tired light theory (NTL). J. Phys. Conf. Ser. 1251, 012007. doi:10.1088/1742-6596/1251/1/012007
Ashmore, L. E. (2022). Data from 14, 577 cosmological objects and 14 FRBs confirm the predictions of new tired light (NTL) and lead to a new model of the IGM. J. Phys: Conf. Ser. 2197 012003.
Baird, E. (2018). Cosmological redshifts vs. gravitational redshifts. doi:10.13140/RG.2.2.26042.29128
Bell, M. B. (2007). Further evidence that the redshifts of AGN galaxies may contain intrinsic components. ApJ 667, L129. doi:10.1086/522337
Bell, M. B., and McDiarmid, D. (2006). Six peaks visible in the redshift distribution of 46,400 SDSS quasars agree with the preferred redshifts predicted by the decreasing intrinsic redshift model. ApJ 648, 140. doi:10.1086/503792
Cackett, E. M., Bentz, M. C., and Kara, E. (2021). Reverberation mapping of active galactic nuclei: From X-ray corona to dusty torus. iScience 24, 102557. doi:10.1016/j.isci.2021.102557
Cao, S., Zheng, X., Biesiada, M., Qi, J., Chen, Y., and Zhu, Z. H. (2017). Ultra-compact structure in intermediate-luminosity radio quasars: Building a sample of standard cosmological rulers and improving the dark energy constraints up to z ∼ 3. Astronomy Astrophysics 606, A15. doi:10.1051/0004-6361/201730551
Churchman, J. (2004). “Cosmological redshift and gravitational potential in a spatially flat universe,” (Milton Keynes: The Open University). MPhil thesis.
Einstein, A. (1917). Kosmologische Betrachtungen zur allgemeinen Relativitätstheorie. Sitzungsb. König. Preuss Akad. des Wissens, 142–152. Available at: https://articles.adsabs.harvard.edu/cgi-bin/get_file?pdfs/SPAW./1917/1917SPAW.142E.pdf.
Endean, G. (1994). Redshift and the Hubble constant in conformally flat spacetime. ApJ 434, 397. doi:10.1086/174741
Fields, B. D., Olive, K. A., Yeh, T-H., and Young, C. (2020). Big-Bang nucleosynthesis after planck. J. Cosmol. Astropart. Phys. 2020, JCAP03. doi:10.1088/1475-7516/2020/03/010
Friedman, A. (1999). On the curvature of space. Gen. Relativ. Gravit. 31, 1991–2000. doi:10.1023/A:1026751225741
Girelli, G., Bolzonella, M., and Cimatti, A. (2019). Massive and old quiescent galaxies at high redshift. Astronomy Astrophysics 632, A80. doi:10.1051/0004-6361/201834547
Grøn, O., and Johannesen, S. (2011). FRW universe models in conformally flat-spacetime coordinates I: General formalism. Eur. Phys. J. Plus. 126, 28. doi:10.1140/epjp/i2011-11028-6
Hubble, E. P. (1947). The 200-inch telescope and some problems it may solve. Astron. Soc. pac. 59, 153–167. doi:10.1086/125931
Hubble, E. P., and Tolman, R. C. (1935). Two methods of investigating the nature of the nebular redshift. ApJ 22, 302–426. doi:10.1086/143682
Ibison, M. (2007). On the conformal forms of the Robertson-Walker metric. J. Math. Phys. 48, 122501. doi:10.1063/1.2815811
Kakkad, D., Groves, B., Dopita, M., Thomas, A. D., Davies, R. L., Mainieri, V., et al. (2018). Spatially resolved electron density in the Narrow Line Region of z<0.02 radio AGNs. Astronomy Astrophysics 618, A6. doi:10.1051/0004-6361/201832790
Krauss, L. M. (1997). Old galaxies at high redshift and the cosmological constant 1997. ApJ 480, 466. doi:10.1086/304009
Lemaitre, G. (2013). Republication of: A homogeneous universe of constant mass and increasing radius accounting for the radial velocity of extra-galactic nebulae. Gen. Relativ. Gravit. 45, 1635–1646. doi:10.1007/s10714-013-1548-3
Lerner, E. J. (2018). Observations contradict galaxy size and surface brightness predictions that are based on the expanding universe hypothesis. MNRAS 477 (3), 3185–3196. doi:10.1093/mnras/sty728
Li, M. (2014). Understanding the gravitational and cosmological redshifts as Doppler shifts by gravitational phase factors. Cl. Quantum Grav. 31, 145001. doi:10.1088/0264-9381/31/14/145001
López-Corredoira, M., and Gutiérrez, C. M. (2006). “Research on candidates for non-cosmological redshifts,” in First crisis in cosmology conference (AIP conference proceedings 822). Editors E. J. Lerner, and J. B. Almeida (Melville, New York: AIP), 75–92.
López-Corredoira, M. (2011). Pending problems in QSOs. Int. J. Astronomy Astrophysics 1 (2), 73–82. doi:10.4236/ijaa.2011.12011
Lusso, E., Risaliti, G., Nardini, E., Bargiacchi, G., Benetti, M., Bisogni, S., et al. (2020). Quasars as standard candles. III. Validation of a new sample for cosmological studies. Astronomy Astrophysics 642, A150. doi:10.1051/0004-6361/202038899
McLure, R. J., and Dunlop, J. S. (2004). The cosmological evolution of quasar black hole masses. Mon. Not. R. Astron. Soc. 352, 1390–1404. doi:10.1111/j.1365-2966.2004.08034.x
Meures, N., and Bruni, M. (2012). Redshift and distances in a ΛCDM cosmology with non-linear inhomogeneities. MNRAS 419 (3), 1937–1950. doi:10.1111/j.1365-2966.2011.19850.x
Nernst, W. (1938). Weitere Prüfung der Annahme eines stationären Zustandes im Weltall. Z. Phys. 106, 633–661. doi:10.1007/BF01339902
Pecker, J.-C., and Vigier, J.-P. (1987). “A possible tired-light mechanism,” in International astronomical union symposia. Editors R. BenderRoger, and L. Davies (Beijing: IAU), 507–511. doi:10.1007/978-94-009-3853-3_48
Perlmutter, S., Aldering, G., Goldhaber, G., Knop, R. A., Nugent, P., Castro, P. G., et al. (1999). Measurements of Ω and Λ from 42 high-redshift supernovae. ApJ 517, 565–586. doi:10.1086/307221
Potter, F., and Preston, G. (2007). Cosmological redshift interpreted as gravitational redshift. Prog. Phys. 3, 31–33.
Riess, A. G., Press, W. H., and Kirshner, R. P. (1996). A precise distance indicator: Type Ia supernova multicolor light-curve shapes. ApJ 473, 88–109. doi:10.1086/178129
Risaliti, G., and Lusso, E. (2019). Cosmological constraints from the Hubble diagram of quasars at high redshifts. Nat. Astron 3, 272–277. doi:10.1038/s41550-018-0657-z
Schmidt, B. P., Suntzeff, N. B., Phillips, M. M., Schommer, R. A., Clocchiatti, A., Kirshner, R. P., et al. (1998). The high-Z supernova search: Measuring cosmic deceleration and global curvature of the universe using Type Ia supernovae. ApJ 507, 46–63. doi:10.1086/306308
Smoleński, T., Dolgirev, P. E., Kuhlenkamp, C., Popert, A., Shimazaki, Y., Back, P., et al. (2021). Signatures of Wigner crystal of electrons in a monolayer semiconductor. Nature 595, 53–57. doi:10.1038/s41586-021-03590-4
Souchay, C. J., Secrest, N., Lambert, S., Zacharias, N., Taris, F., Barache, C., et al. (2022). Quasars with large proper motions: A selection from the LQAC-5 catalogue combined with gaia EDR3. Focusing on astrometric and photometric properties. A&A 660, A16. doi:10.1051/0004-6361/202141915
Steer, I. (2020). Mean estimate distances for galaxies with multiple estimates in NED-D. Astronomical J. 160, 199. doi:10.3847/1538-3881/abafba
Trinchera, A. (2021). Redshift anomaly on the solar disk as multiple interactions between photons and electrons. J. High Energy Phys. Gravit. Cosmol. 7, 1–51. doi:10.4236/jhepgc.2021.71001
Vavrycuk, V. (2022). Cosmological redshift and cosmic time dilation in the FLRW metric. Front. Phys. 10, 826188. doi:10.3389/fphy.2022.826188
Walker, A. G. (1937). On milne's theory of world-structure. Math. Soc. 42, 90–127. doi:10.1112/plms/s2-42.1.90
Wigner, E. P. (1938). Effects of the electron interaction on the energy levels of electrons in metals. Trans. Faraday Soc. 34, 678–685. doi:10.1039/TF9383400678
Wigner, E. P. (1934). On the interaction of electrons in metals. Phys. Rev. 46, 1002–1011. doi:10.1103/PhysRev.46.1002
Zackrisson, E. (2005). On quasar host galaxies as tests of non-cosmological redshifts. Mon. Notices R. Astronomical Soc. 359 (3), 1193–1200. doi:10.1111/j.1365-2966.2005.08989.x
The Christoffel symbols are fully described by the following expression
whose components are
Accordingly, the Ricci curvature tensor can be expressed as
Each non-zero component can be calculated as follows:
Similarly,
In the same way,
The last non-zero component of the Ricci tensor is
Moreover, from EFE, the zero–zero components can be identified by the reduction of the tensor order to a rank zero as follows:
Based on the previous non-zero components of the Ricci tensor, the expression of the scalar curvature in EFE is
Moreover, in the hypothesis of a homogenous and isotropic Universe and in the perfect fluid hypothesis, we can write the non-zero component of stress–energy–momentum tensor as follows:
in which we can identify the first component of the tensor as
Accordingly, substituting the obtained expressions in Eq. A36
From Eq. A35, multiplying both members by the inverse metric
where
We indicate that Tr is the trace of a tensor. Replacing the expression of the Ricci curvature in Eq. A35 yields
Basically, we have contracted the indices of EFE in order to produce scalars of rank zero in the form
which, in our framework, becomes
Due to Eq. 24 and inserting back the speed of light previous neglected, in order to uniform the unity of measurements, it yields
Eq. A34 in Appendix A, here recalled with the presence of the cosmological term introduced by A. Einstein, becomes:
Following all mathematical steps in GR, we can also obtain the second Friedmann equation characterizing an expanding Universe, in which
Also, in this case, in a stationary Universe, where the scale factor is equal to 1 (or rather the radial distance is fixed in the spacetime grid and it is not co-moving), similar to Eq. 24, its time derivative is zero
Assuming that the contribution from the pressure forces is much smaller than the energy density, we can also write that
Due to this, the second Friedmann expression of equation Eq. C2 becomes
Starting from Eq. 114, we can approximate the two exponential factors in general terms as ea + eb = e(a + b), with a, b > 0, if one term has a smaller order of magnitude (as in the case of the lambda term).
Keywords: time dilation, cosmological redshift, cosmological constant, solid-state physics, intergalactic medium, spacetime curvature
Citation: Trinchera A (2023) Cosmological redshift and Hubble tension explained by means of the FLRWT time-metric framework and transit physics in the IGM. Front. Astron. Space Sci. 9:1014433. doi: 10.3389/fspas.2022.1014433
Received: 08 August 2022; Accepted: 28 December 2022;
Published: 30 January 2023.
Edited by:
Vladimir Yershov, University College London, United KingdomReviewed by:
Abdul Jawad, COMSATS University Islamabad, PakistanCopyright © 2023 Trinchera. This is an open-access article distributed under the terms of the Creative Commons Attribution License (CC BY). The use, distribution or reproduction in other forums is permitted, provided the original author(s) and the copyright owner(s) are credited and that the original publication in this journal is cited, in accordance with accepted academic practice. No use, distribution or reproduction is permitted which does not comply with these terms.
*Correspondence: Alessandro Trinchera, dHJpbmNoZXJhLmFsZUBnbWFpbC5jb20=
Disclaimer: All claims expressed in this article are solely those of the authors and do not necessarily represent those of their affiliated organizations, or those of the publisher, the editors and the reviewers. Any product that may be evaluated in this article or claim that may be made by its manufacturer is not guaranteed or endorsed by the publisher.
Research integrity at Frontiers

Learn more about the work of our research integrity team to safeguard the quality of each article we publish.