 David H. Hathaway
 Lisa A. Upton2
- 1HEPL, Stanford University, Stanford, CA, United States
- 2Southwest Research Institute, Boulder, CO, United States
We measure differential rotation and meridional flow in the Sun’s surface shear layer by tracking the motions of the magnetic network seen in magnetograms from SOHO/MDI and SDO/HMI over solar cycles 23, 24, and the start of 25 (1996–2022). We examine the axisymmetric flows derived from 15 to 24 daily measurements averaged over individual 27-day Carrington rotations. Variations in the differential rotation include the equatorial torsional oscillation—cyclonic flows centered on the active latitudes with slower flows on the poleward sides of the active latitudes and faster flows equatorward. The fast flow band starts at
1 Introduction
The Sun’s axisymmetric flows (differential rotation and the meridional circulation) are key aspects of the convection zone dynamics and are the principal drivers of the solar activity cycle. The shearing motions of the differential rotation stretch north-south and radially oriented magnetic field into the azimuthal direction thereby producing strong toroidal field that eventually is buoyed up to produce the bipolar active regions of the solar activity cycle. The meridional flow at the top of the surface shear layer transports magnetic field to the poles to reverse the polar fields at cycle maximum and build up new polar fields by cycle minimum. Those polar fields appear to determine the strength of the next solar activity cycle (Babcock, 1961; Leighton, 1969; Schatten et al., 1978; Svalgaard et al., 2005). The equatorward meridional flow deeper within the Sun may play a part in the equatorward drift of the active latitudes (Choudhuri et al., 1995).
These axisymmetric flows are likely produced by the effects of the Sun’s rotation on the convective flows and thermal structure in the Sun’s convection zone (Busse, 1970; Belvedere and Paterno, 1976; Glatzmaier and Gilman, 1982; Featherstone and Miesch, 2015; Hotta et al., 2015). However, Karak et al. (2015), Mahajan (2019) and Hotta et al. (2022) have recently shown that Maxwell stresses associated with the Sun’s magnetic fields may also play an important part. Variations in these flows occur as consequences of the interactions between the flows and the magnetic field and conversely the variations in the flow can have consequences for the magnetic field configuration itself.
Ideally we would like to know the variations in both differential rotation and meridional flow at all latitudes and depths within the convection zone over the course of many solar cycles. This would help to answer key questions concerning how the variations result from solar activity (the effects of magnetic field on the flows) and how the variations influence solar activity (effects of the flows on the magnetic field). In actuality we have measurements at a good range of latitudes and depths for just the last two cycles. The differential rotation is fairly well characterized throughout the convection zone by global helioseismology (with the exception of a cone of uncertainty extending from the polar regions and expanding inward) (Howe, 2009). The meridional flow is an order of magnitude weaker and is therefore more poorly characterized—even at the photosphere—but more so deeper into the convection zone where the equatorward return flow must be (Hathaway, 2012; Zhao et al., 2013).
Here we examine variations in these flows over the course of two and a half solar cycles—cycles 23, 24, and the start of 25—by measuring the flows at a small range of depths in the surface shear layer several times daily using magnetic pattern tracking on magnetograms from the Michelson Doppler Interferometer (MDI) instrument on the ESA/NASA Solar and Heliospheric Observatory (SOHO) spacecraft (Scherrer et al., 1995) and from the Helioseismic and Magnetic Imager (HMI) instrument on the NASA Solar Dynamics Observatory (SDO) spacecraft (Scherrer et al., 2012). The measurements start in May of 1996 and continue through May of 2022 with a short break in the summer of 1998 when radio contact with SOHO was temporarily lost.
2 Measurement method
The axisymmetric flows can be measured either by direct Doppler measurements of the photospheric plasma or by tracking photospheric features. Tracked features include white-light intensity features (sunspots, faculae, and granules), spectroscopically derived features (Hα filaments and the Ca II network), features identified by spectral line Doppler shifts (supergranules and the acoustic waves used in helioseismology), and features identified by spectral line Zeeman splitting (the magnetic network and its elements).
Each method and/or feature gives results for a given range of depths within the Sun. Each has advantages and disadvantages depending on spatial coverage, accuracy, sources of systematic errors, and the flow being measured (differential rotation or meridional flow). Sunspots were used as the earliest tracers of solar rotation and led to the discovery of the latitudinal differential rotation (Carrington, 1859). Direct Doppler measurements of solar rotation produced the first indications of possible variations in the rotation rate (Howard, 1976) and led to the discovery of the torsional oscillations (Howard and Labonte, 1980)—changes in rotation rate at given latitudes that vary with the 11-year period of the solar cycle. Gilman and Howard (1984) used six decades (1921–1982) of sunspot measurements from the Mt. Wilson Observatory to find cycle related variations in rotation—an increase in rotation rate just after cycle maximum and another increase near minimum—which are now recognized as manifestations of the torsional oscillation signal at high and low latitudes respectively. Helioseismic measurements of the rotation profile with latitude and depth using global oscillation modes now show that the torsional oscillation signal extends deep into the convection zone (Howe, 2009).
Measurements of the meridional flow have been much more difficult with even the direction of the flow being in question until the 1980s. Howard and Labonte (1981) found a poleward meridional flow of about 10 m s−1 for photospheric magnetic features, with evidence of solar cycle related variations (slower early in the cycle and faster later). Komm et al. (1993) measured the movement of small photospheric magnetic features to find a similar meridional flow and further evidence of variations (slower at cycle maximum and faster at minimum). In previous papers (Hathaway and Rightmire, 2010, 2011; Hathaway and Upton, 2014; Mahajan et al., 2021) we have adopted a similar method.
Here we measure the differential rotation and meridional flow by tracking the movement of the Sun’s magnetic network with our MagTrak program. Tracking the magnetic network pattern has several advantages. These features cover the entire surface of the Sun and persist for hours to days. Tracking their motions provide measurements of both the differential rotation and meridional flow at a wide range of latitudes and a range of depths within the Sun’s surface shear layer. We do this by first mapping full disk magnetograms from SOHO/MDI and SDO/HMI onto heliographic longitude and latitude using a bi-cubic interpolator and then cross-correlating long (
In mapping the full disk magnetograms to grids with points equispaced in both latitude and longitude we make several corrections to the image geometry based on studies of the 1 year overlap between SOHO/MDI and SDO/HMI as well as other reported image issues. The location of disk center in MDI data was found to be different depending upon the orientation of SOHO with (x0, y0) → (x0+0.45, y0+0.90) when north is up and (x0, y0) → (x0+2.10, y0+1.00) when north is down. (Note: we take the origin of the image to be the lower left corner of the lower left pixel rather than the center of that pixel.) We correct the given latitude at disk center, B0, and the position angle of the rotation axis, P0, for the corrections to the orientation of the Sun’s rotation axis given by Beck and Giles (2005) along with P0 → P0−0.21 prior to 2003 and P0 → P0−0.27 after 2003. We then correct the plate scale by taking the radius of the image r0 → r0 × 0.9996. For HMI data we also take the origin to be at the lower left corner of the lower left pixel and correct B0 and P0 for the changes in the orientation of the Sun’s rotation axis given by Beck and Giles (2005).
Some studies have questioned the accuracy of our measurement technique. Dikpati et al. (2010) and Guerrero et al. (2012) examined the effects of diffusion on measurements of the movement of the magnetic pattern by producing artificial data in the form of a diffuse magnetic field with simple dipoles representing active regions, transporting those fields with diffusion and axisymmetric advection, and then measuring the motions. They both conclude that there are large systematic errors in the magnetic feature tracking technique due to the effects of diffusion. While neither of these studies describe precisely how the motions were measured (no mention of time lags or correlation windows) but they do suggest that we should see apparent motion away from the active latitudes. We (Hathaway and Rightmire, 2011), tested our MagTrak program using artificial data that matched the characteristics of the magnetic network itself by advecting magnetic elements with an evolving supergranule flow field. The resulting magnetic pattern is not diffuse but instead faithfully mimics the network pattern seen on the Sun. Our measurements found no evidence of any apparent flows away from active latitude. Furthermore, we see no evidence of flow away from the active latitudes in actual data as suggested by the effects of diffusion. Recently however, a true source of systematic error has been discovered which was unanticipated by any of these previous tests. In the following section we describe how this error is removed in MagTrak 3.0 along with a number of other improvements to the program.
3 Improved measurements from magnetic network feature tracking
Recently, Mahajan et al. (2021) found a spurious signal in flow measurements associated with tracking the Sun’s magnetic network. This spurious signal manifests itself as an apparent shift of the magnetic features away from disk center much like that seen for acoustic waves in time-distance helioseismology studies (Zhao et al., 2012) It has the interesting property of reaching a fixed shift within about an hour of solar rotation. The magnitude of this spurious shift as a function of heliocentric angle from disk center can be determined by measuring the apparent shift using three different time lags as discussed in Mahajan et al. (2021). The correlation tracking measurements can then be corrected by removing this spurious shift from the measured shifts before dividing by the time lag to get flow velocities in m s−1. The spurious shift in the north-south direction determined using the HMI data and time lags of 2, 4, and 8 h is shown in blue in Figure 1 while the shift determined using MDI data with time lags of 96, 192, and 480 min is shown in black. Note that a shift of 150 km gives a spurious poleward velocity of 5 m s−1 for an 8 h time lag but increases to 20 m s−1 for a 2 h time lag. This spurious shift has influenced previous measurements, introducing large errors for time lags less than 8 h and small but significant errors for longer time lags. The source of this signal is still somewhat uncertain but most likely related to the spectral line depth of formation at different angles from disk center. The slight differences between the profiles for MDI and HMI might be attributed to the different spectral lines used along with the differences in spatial and spectral resolution.
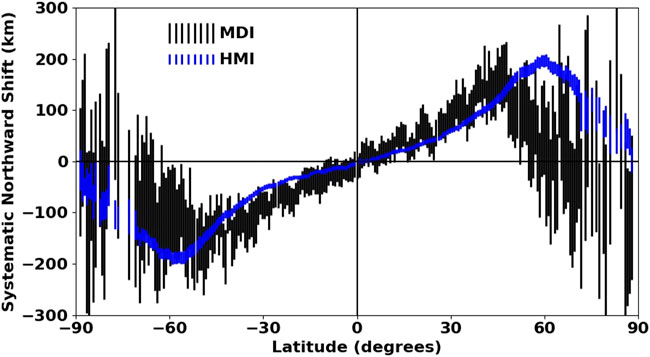
FIGURE 1. The average (spurious) poleward shift as a function of latitude is shown in blue with 2σ error bars for the HMI data and in black with 2σ error bars for the MDI era. This apparent shift away from disk center must be removed from meridional flow measurements.
Further improvements on the measurement method as described in Mahajan et al. (2021) include broadening the displacement search area for finding the maximum in the cross correlation. This is to ensure that we are sampling the full range of displacements. We also iteratively shift the data strips by fractional pixels to avoid the “peak locking” problem associated with the tendency of these methods to avoid giving half pixel shifts.
We have measured the differential rotation and meridional flow profiles at 255 equi-spaced latitude positions from pole to pole at 96 min intervals with the MDI instrument and at 60 min intervals with the HMI instrument. The several hundred individual measurements made over each 27-day Carrington rotation are averaged and standard errors are calculated. While the 7° tilt of the Sun’s rotation axis relative to the plane of the Earth’s orbit allows us to see all the way to its north pole in September of each year and all the way to its south pole in March of each year, the foreshortening of our view near the limb makes the polar measurements most uncertain.
The differential rotation and meridional flow profiles averaged over nearly 100,000 individual profiles measured with 8-h, 4-h, and 2-h time lags over the 11 years from May 2010 through April 2021 are shown in Figure 2. The differential rotation profile has a flattened peak at the equator with a slight dip right at the equator. The latitudinal velocity shear reaches a maximum at about 30°. The meridional flow profile reaches its maxima of 9 m s−1 at about 30°. The high latitude meridional flow now appears to drop to zero at about 80° instead of going all the way to the poles. This aspect of the meridional flow profile only becomes apparent with the removal of the spurious shift away from disk center.
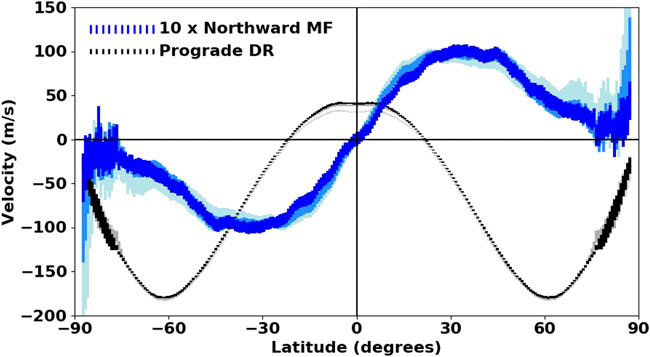
FIGURE 2. The average axisymmetric flows. The north/south symmetric differential rotation (positive in the prograde direction) is shown in black with 2σ error bars for 8-h time lags, in gray for 4-h time lags, and in light gray for 2-h timelags. The north/south anti-symmetric meridional flow (multiplied by 10, positive in the northward direction) is shown in dark blue with 2σ error bars for 8-h time lags, in medium blue for 4-h time lags, and in light blue for 2-h time lags.
The equatorial differential rotation velocity increases with longer time lags—30.7 m s−1 at 2-h, 38.1 m s−1 at 4-h time lags, and 40.4 m s−1 at 8-h time lags. The meridional flow speed decreases with increasing time lag but not as much as was reported in Hathaway (2012). This is directly attributed to the effects of the spurious systematic shift on the short time lag velocities. The 8-h time lag average profiles are removed from the individual Carrington rotation profiles to reveal the variations in these flows over solar cycles 23, 24, and the start of 25.
4 Variations in the differential rotation
The history of the Carrington rotation averaged profiles of the differential rotation is shown in the top panel of Figure 3. The history of the variations from the average profile is shown in the central panel. The monthly sunspot numbers (V2.0) are shown for reference in the bottom panel to illustrate the progression of the sunspot cycle. The small black dots in each of the two upper panels mark the locations of the sunspot area centroids in each hemisphere for reference to the locations of the active latitudes.
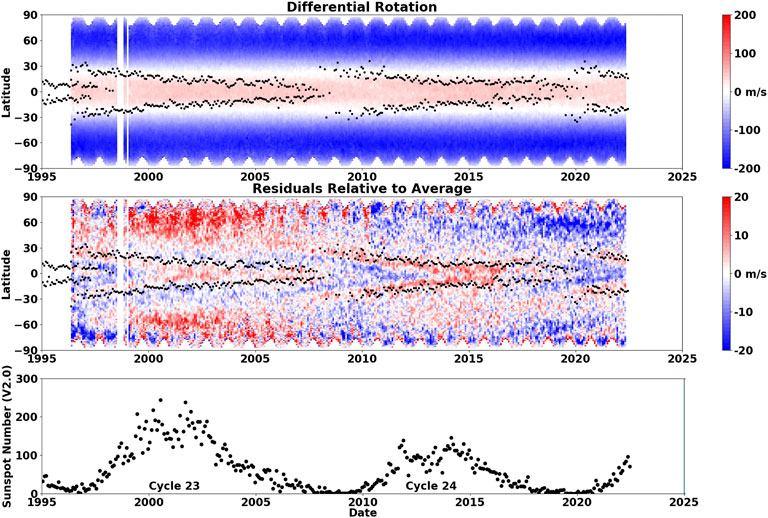
FIGURE 3. Differential rotation (east-west flow relative to the frame of reference rotating at the Carrington rate and positive in the direction of rotation) as a function of time and latitude is shown in the upper panel. The residual east-west flow found by removing the north/south symmetric average profile is shown in the central panel. The latitudes of the centroids of sunspot areas for each Carrington rotation are shown by the black dots in each upper panel. The monthly average of the daily sunspot number (V2.0) is shown for reference in the bottom panel.
Variations in the differential rotation are at a level less than about 5% of the flow speed itself. This is evident in the lack of any obvious variations in the full profile history shown in the top panel of Figure 3. The variations seen in the residuals relative to the average shown in the central panel of Figure 3 have two primary components, one at low latitudes and one at high latitudes. These components may, or may not, be connected. The torsional oscillation (an 11-year oscillation of faster and then slower flow in the active latitudes, first reported by Howard and Labonte (1980)) is seen straddling the sunspot zones in the center panel of Figure 3. Faster than average flows are seen on the equatorward side of the active latitudes delineated by the black dots at the latitudes of the sunspots area centroids in each hemisphere. These faster than average flows can be traced to higher latitudes and earlier times, giving rise to the recognition of an extended cycle with several years of overlap between adjacent cycles (Martin and Harvey, 1979; Snodgrass, 1987; Wilson et al., 1988). The slower than average flows are seen on the poleward sides of the sunspot zones and become strongest near the equator after the sunspots have disappeared. The second component presents as an oscillation at latitudes above about 45° with faster rotation at times of cycle maxima and slower rotation at times of minima.
Both of These oscillating components vary significantly from cycle to cycle. The faster rotation near the equator was stronger in cycle 24 than it was in cycle 23. The faster rotation at high latitudes near cycle maximum was much stronger in cycle 23 than it was in cycle 24 while the slower rotation at high latitudes near cycle minimum was much stronger at cycle 24/25 minimum than it was at cycle 23/24 minimum.
We also see significant north/south differences in these flow variations. The faster rotation at high latitudes near cycle maximum was stronger in the north in cycle 23 but stronger in the south in cycle 24. Notably, this increase in rotation in the north for cycle 24, while present, is almost imperceptible in Figure 3. The slower rotation at high latitudes near cycle minimum was stronger in the south at cycle 23/24 minimum but stronger in the north at cycle 24/25 minimum. Similar cycle-to-cycle and hemispheric differences in the differential rotation as well as other features seen in Figure 3 have also been reported by Lekshmi et al. (2018) and Getling et al. (2021) from helioseismic studies.
The variations in the differential rotation can be quantified by fitting each latitudinal profile with vector spherical harmonics. The coefficient histories for the first three axisymmetric and north/south symmetric components are shown in Figure 4 along with the monthly sunspot numbers for reference.
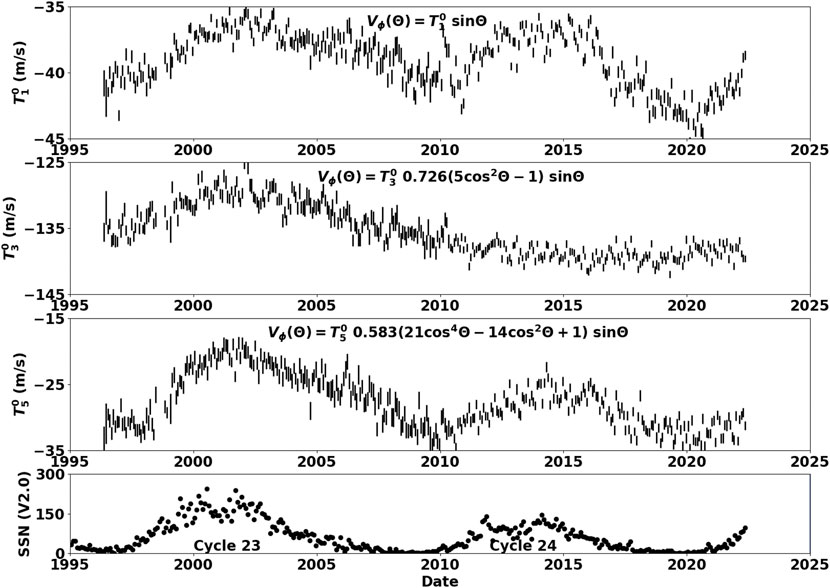
FIGURE 4. Legendre polynomial fit coefficient histories for the differential rotation. The top panel shows the
The
The
The
These variations in differential rotation are thought to be consequences of feedback from the magnetic structures of the activity cycle (active latitudes and polar fields). This includes flows associated with thermal structures Spruit (2003) and Maxwell stresses associated with the magnetic field itself Schussler (1981); Yoshimura (1981); Rempel (2012). The variations we observe may help to further constrain the mechanisms involved.
5 Variations in the meridional circulation
The history of the Carrington rotation averaged profiles of the meridional flow is shown in the top panel of Figure 5. The history of the residual variations relative to the average profile is shown in the central panel. The monthly sunspot numbers (V2.0) are shown in the bottom panel to illustrate the progression of the sunspot cycle for reference. The small black dots in each of the two upper panels mark the locations of the sunspot area centroids in each hemisphere for reference to the locations of the active latitudes.
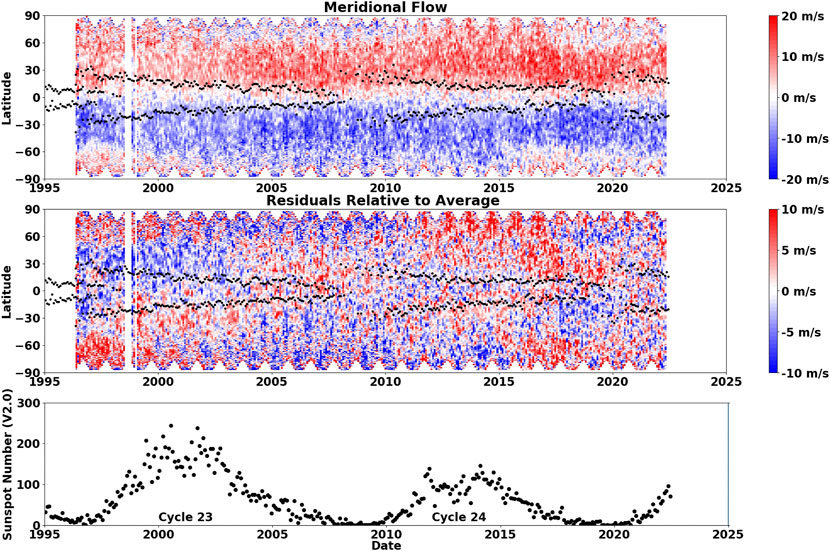
FIGURE 5. Meridional flow (north-south flow, positive northward) as a function of time and latitude is shown in the upper panel. The residual meridional flow found by removing the north/south antisymmetric average profile is shown in the central panel. The latitudes of the centroids of sunspot areas for each Carrington rotation are shown by the black dots in each upper panel. The monthly average of the daily sunspot number (V2.0) is shown for reference in the bottom panel.
The variations in the meridional flow are relatively large and are apparent even in the history of the individual flow profiles (top panel in Figure 5). The residuals relative to the average profile (central panel in Figure 5) show a slowing of the poleward meridional flow in both hemispheres during the rise and maximum of cycle 23. This slowing during rise and maximum is much less evident in cycle 24 and 25 and appears to be concentrated in the sunspot zones. Note that this is a slowing of the meridional flow at a range of latitudes, including latitudes on the equatorward sides of the sunspot zones. We do not see inflows toward the sunspot zones. Inflows would be characterized by an increased poleward flow on the equatorward sides of the sunspot zones which is not present here. (This is likely a consequence of the depth associated with these measurements—the middle of the surface shear layer rather than nearer to the surface.) The poleward flow increases during the declining phase of each cycle and the approach to minimum. This increase was stronger in cycle 24 than it was in cycle 23.
In addition to the changes in the poleward flow seen in the lower, active latitudes, we also see polar countercells—equatorward flow from the poles down to about 60° latitude appearing from time to time. These countercells can be seen in the full profiles shown in the upper panel of Figure 5. We see a counter cell in the south fully established at the start of the dataset in 1996. This counter cell shrinks and disappears by 2001/2002. As this southern countercell disappears, a countercell forms in the north, extends down to 60° by 2006 and then shrinks and disappears by 2011. From 2011 to 2015 there are no countercells but a cell forms in the south in 2016 and then in the north in 2017 and both continue to exist until the end of the dataset in mid-2022. These countercells are likely real features. They persist for years but come and go without any apparent connection to instrumental changes, spacecraft orientation, or solar magnetic fields. The presence of these countercells and the low latitude variations in the meridional flow can have consequences for the solar dynamo (Dikpati et al., 2004; Karak, 2010).
The variations in the meridional flow can also be quantified by fitting each latitudinal profile with vector spherical harmonics. The coefficient histories for three key components are shown in Figure 6 along with the monthly sunspot numbers for reference.
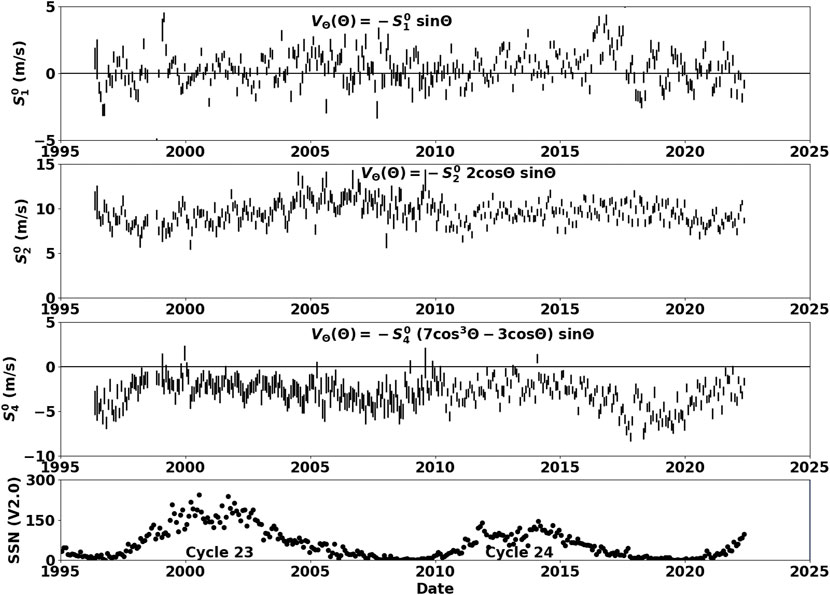
FIGURE 6. Legendre polynomial fit coefficient histories for the meridional circulation. Values for each Carrington rotation are shown with 2σ error bars. The top panel shows the
The
The
The
The cross equator flow holds some interest in terms of how it might be related to hemispheric differences in solar activity (Komm, 2022). In Figure 7 we superimpose a measure of hemispheric asymmetry—the difference in sunspot area between the two hemispheres divided by the sum of the sunspot areas. We find periods (2012–2016) when there is flow across the equator away from the dominant hemisphere (northward flow away from the stronger south and southward flow away from the stronger north) but there are also times when the opposite is seen (2017). A statistical test of the relationship between cross equator flow and hemispheric sunspot area asymmetry indicates a weak, but significant, anti-correlation—i.e. flow across the equator away from the dominant hemisphere. This flow away from the more active hemisphere is opposite to the flows toward the active hemisphere found by Komm (2022). The likely explanation for this discrepency is the difference in flows around active regions at different depths—inflows near the surface and outflows at greater depths.
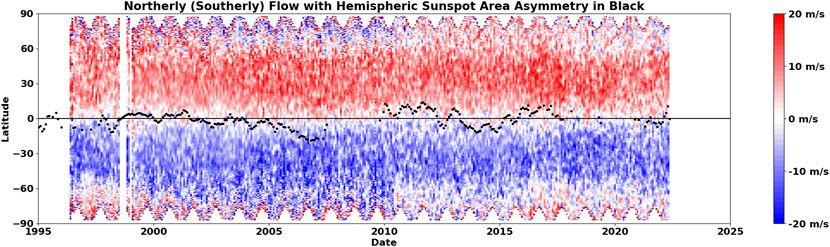
FIGURE 7. The meridional flow and hemispheric asymmetries in sunspot area. The asymmetry in hemispheric sunspot area, (North - South)/(North + South), is shown multiplied by 30 with the black dots near the equator.
6 Variations with depth
As previously described, We make measurements of the axisymmetric flows using three different time lags for both the MDI and the HMI data. This is necessary for our determination of the systematic shift but it also provides us with information about the flows at various depths within the surface shear layer. Measurements at longer time lags are dominated by the magnetic pattern associated with larger, longer-lived convection cells that extend to greater depths within the Sun. We can estimate depths associated with each time lag by comparing the equatorial rotation rate to that found from global helioseismology at depths within the surface shear layer. This comparison (cf. Hathaway (2012)) indicates that the measurements made with the 8-h time lags represent flows about 25 Mm deep, while the 4-h time lag measurements represent 22 Mm deep, and the 2-h time lag measurements represent 18 Mm deep.
Subtracting the differential rotation and meridional flow profiles at shorter time lags from those measured at 8-h time lags and dividing by the difference in depth gives a measure of the radial gradients in these flows Figure 8 shows these gradients using the 4-h time lag measurements from HMI and the 192-min time lag measurements from MDI as the shorter time lags. Virtually the same results are found using the even shorter time lags—2-h for HMI and 96-min for MDI.
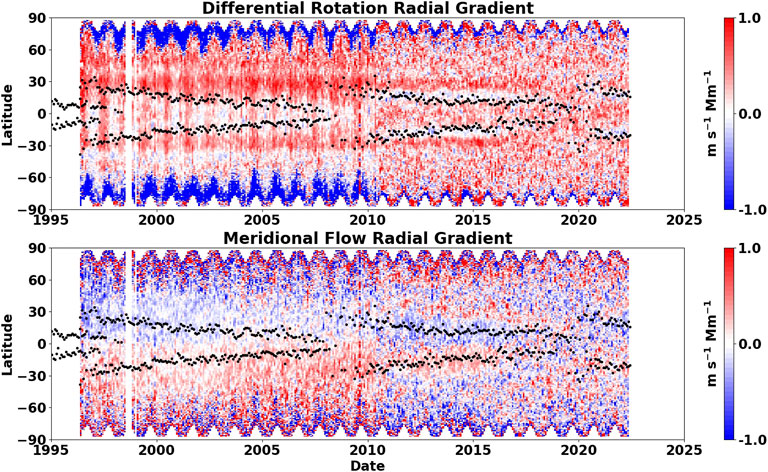
FIGURE 8. The radial gradients in differential rotation (top panel) and meridional flow (bottom panel) in m s−1 Mm−1. Positive values for the differential rotation indicate faster rotation going inward. Positive values for the meridional flow indicates faster northward flow going inward.
These radial gradient measurements show that the rotation rate increases inward while the meridional flow speed decreases inward. Figure 8 shows that, in addition to these well known variations with depth, there are variations in these gradients with both time and latitude. It also reveals artifacts which we don’t fully understand. The MDI era data suggests that the rotation rate gradient is stronger in the north than in the south while the HMI era data indicates that they are very similar. The MDI era data shows an annual increase in the gradient at nearly all latitudes while this signal is absent from the HMI era data. This is an obvious artifact. Both MDI and HMI data show an enhanced gradient in the rotation rate at about 28°. This enhancement does not drift equatorward with the active latitudes, but fades away during the HMI era—suggesting that it may not be an artifact.
The radial gradients in the differential rotation do not reveal the torsional oscillation signal. This supports the findings from helioseismology indicating that these flow variations extend relatively unchanged through the surface shear layer (Howe et al., 2000).
The radial gradient in the meridional flow also has surprises. During the MDI era the slowing of the meridional flow is evident at all latitudes. During the HMI era the slowing of the meridional flow appears to be concentrated in the active latitude bands for both cycle 24 and 25.
7 Conclusion
We have used our improved MagTrak program for measuring the differential rotation and meridional flow indicated by the motions of the magnetic network features to determine the latitudinal profiles of the flows several times each day from mid-1996 through mid-2022. This dataset covers the entirety of cycles 23 and 24 and catches the rise of cycle 25. Our findings confirm several aspects of these flows and their variations and introduce new features. Figure 9 shows the axisymmetric flow variations along with the longitudinally averaged magnetic field to help guide our conclusion.
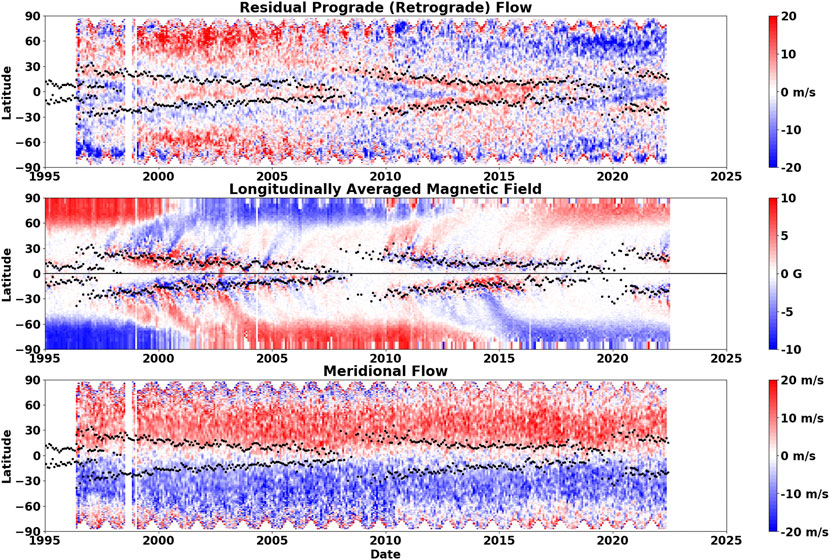
FIGURE 9. Axisymmetric flow variations and associated magnetic field variations. The differential rotation flow variations are shown in the top panel. The meridional flow is shown in the bottom panel. The evolution of the Sun’s surface magnetic field averaged over longitude for each Carrington rotation is shown for reference in the central panel.
Our measurements of the differential rotation find the torsional oscillations associated with the sunspot zones and their extensions to higher latitudes earlier than the appearance of sunspots. The cyclonic nature of these flow variations are consistent with either their association with inflows toward the sunspot zones (Spruit, 2003) or Maxwell stresses due to the presence of magnetic fields (Schussler, 1981; Yoshimura, 1981; Rempel, 2012) and would suggest that they are a response to the activity and not a cause of it. However, we find that the active latitude variations were stronger in cycle 24 than in cycle 23 in spite of the fact that cycle 24 was the weaker cycle. We might expect stronger torsional oscillation flows to be associated with the stronger inflows or magnetic structures in the more active cycle. We also find a weak association with cross equator flow directed away from the more active hemisphere—an indication of outflow from, not inflow to, the activity bands at the depths we probe. The apparent lack of any signal associated with the torsional oscillation in the radial gradient data shown in Figure 8 suggests the torsional oscillations flows don’t change with depth. Yet the change from inflows to outflows with depth—if that is the source—would suggest a more significant change.
The high latitude spin-up at cycle maxima is most prominent in the north in cycle 23. It is seen weakly in the south in cycle 24 but is virtually non-existent in the north in that cycle. The spin-ups don’t appear to be associated with changes in the meridional flow—a faster poleward flow might tend to spin up the poles but we see a slowing of the high latitude meridional flow at the maxima in cycle 23 and a speed up at high latitudes in the north in cycle 24—the opposite to what would be expected if the meridional flow was the source of this signal. These observations suggest that neither the low latitude nor the high latitude torsional oscillations are caused by the Coriolis force acting on meridional flows.
The meridional flow is known to play a dominant role in transporting magnetic fields poleward as seen in a multitude of surface magnetic flux transport studies (Jiang et al., 2014; Wang, 2017). We now find that the meridional flow tends to disappear above about 80°—a feature employed ad hoc in some surface flux transport models. We also find that the speed of the meridional flow varies by 10–20% and, more importantly, exhibits polar countercells from time to time. The effects of these meridional flow variations are not immediately obvious when comparing the meridional flow and the magnetic field histories shown in Figure 9. Further experimentation with these flows in surface flux transport models are needed to explore these connections.
Data availability statement
Publicly available datasets were analyzed in this study. This data can be found here: http://jsoc.stanford.edu/ajax/lookdata.html.
Author contributions
DH analyses data, produces figures, write first draft. LU analyses data, edits paper SM analyses data, edits paper.
Funding
DH and SM are supported by NASA contract NAS5-02139 (HMI) to Stanford University. LU was supported by NASA Heliophysics Living With a Star grants NNH16ZDA010N-LWS and NNH18ZDA001N-LWS and by NASA grant NNH18ZDA001N-DRIVE to the COFFIES DRIVE Center managed by Stanford University. HMI data used in this study are courtesy of NASA-SDO and the HMI science team. MDI data used in this study are courtesy of NASA/ESA-SOHO and the MDI science team.
Conflict of interest
The authors declare that the research was conducted in the absence of any commercial or financial relationships that could be construed as a potential conflict of interest.
Publisher’s note
All claims expressed in this article are solely those of the authors and do not necessarily represent those of their affiliated organizations, or those of the publisher, the editors and the reviewers. Any product that may be evaluated in this article, or claim that may be made by its manufacturer, is not guaranteed or endorsed by the publisher.
References
Babcock, H. W. (1961). The topology of the Sun’s magnetic field and the 22-YEAR cycle. ApJ. 133, 572. doi:10.1086/147060
Beck, J. G., and Giles, P. (2005). Helioseismic determination of the solar rotation Axis. ApJ. 621, L153–L156. doi:10.1086/429224
Belvedere, G., and Paterno, L. (1976). Large scale circulation in the convection zone and solar differential rotation. Sol. Phys. 47, 525–539. doi:10.1007/BF00154761
Busse, F. H. (1970). Differential rotation in stellar convection zones. ApJ. 159, 629. doi:10.1086/150337
Carrington, R. C. (1859). On certain phenomena in the motions of solar spots. Mon. Notices R. Astronomical Soc. 19, 81–84. doi:10.1093/mnras/19.3.81
Choudhuri, A. R., Schussler, M., and Dikpati, M. (1995). The solar dynamo with meridional circulation. Astron. Astrophys. 303, L29.
Dikpati, M., de Toma, G., Gilman, P. A., Arge, C. N., and White, O. R. (2004). Diagnostics of polar field reversal in solar cycle 23 using a flux transport dynamo model. ApJ. 601, 1136–1151. doi:10.1086/380508
Dikpati, M., Gilman, P. A., and Ulrich, R. K. (2010). Physical origin of differences among various measures of solar meridional circulation. ApJ. 722, 774–778. doi:10.1088/0004-637X/722/1/774
Featherstone, N. A., and Miesch, M. S. (2015). Meridional circulation in solar and stellar convection zones. ApJ. 804, 67. doi:10.1088/0004-637X/804/1/67
Getling, A. V., Kosovichev, A. G., and Zhao, J. (2021). Evolution of subsurface zonal and meridional flows in solar cycle 24 from helioseismological data. ApJL. 908, L50. doi:10.3847/2041-8213/abe45a
Gilman, P. A., and Howard, R. (1984). Variations in solar rotation with the sunspot cycle. ApJ. 283, 385–391. doi:10.1086/162316
Glatzmaier, G. A., and Gilman, P. A. (1982). Compressible convection in a rotating spherical shell. V - induced differential rotation and meridional circulation. ApJ. 256, 316–330. doi:10.1086/159909
Guerrero, G., Rheinhardt, M., Brandenburg, A., and Dikpati, M. (2012). Plasma flow versus magnetic feature-tracking speeds in the Sun. Mon. Not. Roy. Astron. Soc. 420, L1–L5. doi:10.1111/j.1745-3933.2011.01167.x
Hathaway, D. H., and Rightmire, L. (2011). Variations in the axisymmetric transport of magnetic elements on the sun: 1996-2010. ApJ. 729, 80. doi:10.1088/0004-637X/729/2/80
Hathaway, D. H., and Rightmire, L. (2010). Variations in the Sun’s meridional flow over a solar cycle. Science 327, 1350–1352. doi:10.1126/science.1181990
Hathaway, D. H. (2012). Supergranules as probes of the Sun’s meridional circulation. ApJ. 760, 84. doi:10.1088/0004-637X/760/1/84
Hathaway, D. H., and Upton, L. (2014). The solar meridional circulation and sunspot cycle variability. J. Geophys. Res. Space Phys. 119, 3316–3324. doi:10.1002/2013JA019432
Hotta, H., Kusano, K., and Shimada, R. (2022). Generation of solar-like differential rotation. ApJ. 933, 199. doi:10.3847/1538-4357/ac7395
Hotta, H., Rempel, M., and Yokoyama, T. (2015). High-resolution calculation of the solar global convection with the reduced speed of sound technique. II. Near surface shear layer with the rotation. ApJ. 798, 51. doi:10.1088/0004-637X/798/1/51
Howard, R. (1976). A possible variation of the solar rotation with the activity cycle. ApJ. 210, L159–L161. doi:10.1086/182328
Howard, R., and Labonte, B. J. (1981). Surface magnetic fields during the solar activity cycle. Sol. Phys. 74, 131–145. doi:10.1007/BF00151283
Howard, R., and Labonte, B. J. (1980). The sun is observed to be a torsional oscillator with a period of 11 years. ApJ. 239, L33–L36. doi:10.1086/183286
Howe, R., Christensen-Dalsgaard, J., Hill, F., Komm, R., Larsen, R., Schou, J., et al. (2000). Dynamic variations at the base of the solar convection zone. Science 287, 2456–2460. doi:10.1126/science.287.5462.2456
Howe, R. (2009). Solar interior rotation and its variation. Living Rev. Sol. Phys. 6, 1. doi:10.12942/lrsp-2009-1
Jiang, J., Hathaway, D. H., Cameron, R. H., Solanki, S. K., Gizon, L., and Upton, L. (2014). Magnetic flux transport at the solar surface. Space Sci. Rev. 186, 491–523. doi:10.1007/s11214-014-0083-1
Karak, B. B. (2010). Importance of meridional circulation in flux transport dynamo: The possibility of a maunder-like grand minimum. ApJ. 724, 1021–1029. doi:10.1088/0004-637X/724/2/1021
Karak, B. B., Käpylä, P. J., Käpylä, M. J., Brandenburg, A., Olspert, N., and Pelt, J. (2015). Magnetically controlled stellar differential rotation near the transition from solar to anti-solar profiles. A&A 576, A26. doi:10.1051/0004-6361/201424521
Komm, R. (2022). Is the subsurface meridional flow zero at the equator? Sol. Phys. 297, 99. doi:10.1007/s11207-022-02027-z
Komm, R. W., Howard, R. F., and Harvey, J. W. (1993). Meridional flow of small photospheric magnetic features. Sol. Phys. 147, 207–223. doi:10.1007/BF00690713
Leighton, R. B. (1969). A magneto-kinematic model of the solar cycle. ApJ. 156, 1. doi:10.1086/149943
Lekshmi, B., Nandy, D., and Antia, H. M. (2018). Asymmetry in solar torsional oscillation and the sunspot cycle. ApJ. 861, 121. doi:10.3847/1538-4357/aacbd5
Mahajan, S. S., Hathaway, D. H., Muñoz-Jaramillo, A., and Martens, P. C. (2021). Improved measurements of the Sun’s meridional flow and torsional oscillation from correlation tracking on MDI and HMI magnetograms. ApJ. 917, 100. doi:10.3847/1538-4357/ac0a80
Mahajan, S. S. (2019). Observational constraints on the solar dynamo and the hunt for precursors to solar flares. Ph.D. thesis, Atlanta, GA: Georgia State University.
Martin, S. F., and Harvey, K. H. (1979). Ephemeral active regions during solar minimum. Sol. Phys. 64, 93–108. doi:10.1007/BF00151118
Rempel, M. (2012). High-latitude solar torsional oscillations during phases of changing magnetic cycle amplitude. ApJ. 750, L8. doi:10.1088/2041-8205/750/1/L8
Schatten, K. H., Scherrer, P. H., Svalgaard, L., and Wilcox, J. M. (1978). Using dynamo theory to predict the sunspot number during solar cycle 21. Geophys. Res. Lett. 5, 411–414. doi:10.1029/GL005i005p00411
Scherrer, P. H., Bogart, R. S., Bush, R. I., Hoeksema, J. T., Kosovichev, A. G., Schou, J., et al. (1995). The solar oscillations investigation - Michelson Doppler imager. Sol. Phys. 162, 129–188. doi:10.1007/BF00733429
Scherrer, P. H., Schou, J., Bush, R. I., Kosovichev, A. G., Bogart, R. S., Hoeksema, J. T., et al. (2012). The helioseismic and magnetic imager (HMI) investigation for the solar dynamics observatory (SDO). Sol. Phys. 275, 207–227. doi:10.1007/s11207-011-9834-2
Schussler, M. (1981). The solar torsional oscillation and dynamo models of the solar cycle. Astron. Astrophys. 94, L17.
Snodgrass, H. B. (1987). Torsional oscillations and the solar cycle. Sol. Phys. 110, 35–49. doi:10.1007/BF00148200
Spruit, H. C. (2003). Origin of the torsional oscillation pattern of solar rotation. Sol. Phys. 213, 1–21. doi:10.1023/a:1023202605379
Svalgaard, L., Cliver, E. W., and Kamide, Y. (2005). Sunspot cycle 24: Smallest cycle in 100 years? Geophys. Res. Lett. 32, L01104. doi:10.1029/2004GL021664
Wang, Y. M. (2017). Surface flux transport and the evolution of the Sun’s polar fields. Space Sci. Rev. 210, 351–365. doi:10.1007/s11214-016-0257-0
Wilson, P. R., Altrocki, R. C., Harvey, K. L., Martin, S. F., and Snodgrass, H. B. (1988). The extended solar activity cycle. Nature 333, 748–750. doi:10.1038/333748a0
Yoshimura, H. (1981). Solar cycle Lorentz force waves and the torsional oscillations of the sun. ApJ. 247, 1102–1112. doi:10.1086/159120
Zhao, J., Bogart, R. S., Kosovichev, A. G., Duvall, T. L., and Hartlep, T. (2013). Detection of equatorward meridional flow and evidence of double-cell meridional circulation inside the sun. ApJ. 774, L29. doi:10.1088/2041-8205/774/2/L29
Keywords: solar velocity fields, solar photosphere, solar convection zone, rotation, meridional flow, solar cycle
Citation: Hathaway DH, Upton LA and Mahajan SS (2022) Variations in differential rotation and meridional flow within the Sun’s surface shear layer 1996–2022. Front. Astron. Space Sci. 9:1007290. doi: 10.3389/fspas.2022.1007290
Received: 30 July 2022; Accepted: 05 December 2022;
Published: 15 December 2022.
Edited by:
Mausumi Dikpati, National Center for Atmospheric Research (UCAR), United StatesReviewed by:
Dibyendu Nandi, Indian Institute of Science Education and Research Kolkata, IndiaBidya Bina Karak, Indian Institute of Technology (BHU), India
Copyright © 2022 Hathaway, Upton and Mahajan. This is an open-access article distributed under the terms of the Creative Commons Attribution License (CC BY). The use, distribution or reproduction in other forums is permitted, provided the original author(s) and the copyright owner(s) are credited and that the original publication in this journal is cited, in accordance with accepted academic practice. No use, distribution or reproduction is permitted which does not comply with these terms.
*Correspondence: David H. Hathaway, ZGF2ZS5oYXRoYXdheUBjb21jYXN0Lm5ldA==