 Paul A. Bradley
- Los Alamos National Laboratory, XCP-6, MS F-699, Los Alamos, NM, United States
Most pulsating white dwarf stars pulsate with many periods, each of which is a probe of their interior, which has made asteroseismolgy of these stars an active field. However, disentangling the multiple periodicities requires long, uninterrupted strings of data. We briefly describe the history of multi-site observing campaigns that culminated in the development of the Whole Earth Telescope in the late 1980s that still functions today. Through examples from the May 1990 campaign on GD 358, we show how critical it is to eliminate periodic gaps in data to greatly reduce aliasing in Fourier Transforms normally used to analyze the frequency content of pulsating white dwarfs. We close with a brief description of space satellite-based data, along with the advantages and disadvantages of these data compared to ground-based data.
Introduction
White dwarf stars are the most common endpoint of stellar evolution and are the ultimate fate of all stars with masses less than about 8–10 Mo (Woosley and Heger, 2015). Because their luminosity comes from radiating away the thermal energy in their cores, they are relatively simple to model as complicated thermonuclear reaction networks are not needed (Wood, 1992; Althaus et al., 2010). The typical structure of a white dwarf is a carbon/oxygen core (the ashes of core helium burning), with a helium mantle comprising about 1% of the star’s mass. About 80% of these stars also have an outermost hydrogen layer that is 0.01% (or less) of the stellar mass (Bradley, 1996; Bradley, 1998; Giammichele et al., 2016). As these stars cool, the outer layers pass through temperature and density conditions where the opacity reaches a maximum, and this can modulate the outward heat flow, leading to pulsations (Winget et al., 1982a; Winget et al., 1982b). Nature has been kind enough to provide several classes of pulsating white dwarfs, including (but not limited to) the hot PG 1159 stars, DBV, and ZZ Ceti stars. The DBV and ZZ Ceti stars in particular appear to be phases that all helium atmosphere (DBV) and hydrogen atmosphere (ZZ Ceti) stars go through, so that what we learn about the structure of the pulsating white dwarfs should apply to white dwarfs more generally. Good recent reviews of pulsating white dwarfs include: Winget and Kepler (2008), Fontaine and Brassard (2008), Kepler and Romero (2017), and Corsico et al. (2019). Numerous white dwarfs pulsate with many different periods at once. While white dwarfs with multiple periods offer great potential for asteroseismology, with each mode offering a different probe of the interior, they also make data collection and analysis a challenge. The best way to analyze these data is to assume the periods are stable over the course of an observing run, as it can be impossible to disentangle real periods from noise and additional peaks resulting from gaps due to single-site data and bad weather. The most common additional peaks arise from daily sunrise and sunset, and this creates a pattern of side lobes usually separated by multiples of 1 cycle/day or 11.57 μHz surrounding the main peak. Examples of such patterns may be found in Figure 1, (Winget et al., 1985; Nather et al., 1990).
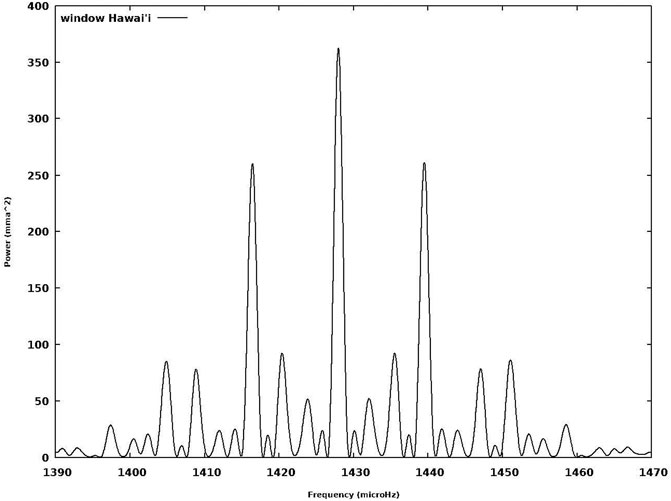
FIGURE 1. A spectral window for a single mode at 700 s (which happens to be the largest amplitude mode (l = 1, k = 15) seen in May 1990) from a single site (Hawai’i) operating for 7 of 8 nights. The most prominent secondary peaks are 1 cycle/day “aliases” that are 11.57 μHz away.
The Whole Earth Telescope and the May 1990 Observing Run
The problems of single-site data analysis became especially acute with the discovery of PG 1159–035 (McGraw et al. 1979), which was found to have a number of equally spaced (in period) modes. Theoretical models suggested that the star should be cooling rapidly enough that changes in the pulsation period should be observable; the time of maximum brightness (phase) is an even more sensitive indicator of cooling than the length of the period. A change in the phase of the dominant 516 s period should be visible within a few years (McGraw et al. 1979). Observers in Texas and South Africa obtained telescope time near the same calendar dates and the longer daily data strings reduced the aliasing enough to allow a detection of the cooling rate as measured by the 516 s mode (Winget et al. 1985). While these multi-site observations showed promise, the alias pattern was still an issue. Clearly, something better was needed.
The Whole Earth Telescope (aka WET; Nather, 1989; Nather et al., 1990) was created in the late 1980s by the white dwarf community to address the need for continuous photometric data sets to reduce aliasing noise to low levels and realize the potential for asteroseismology of white dwarf stars. The paper on PG 1159-035 (Winget et al., 1991) demonstrated that the Whole Earth Telescope could eliminate aliasing; the alias peaks were only 5% of the power of the main peak. By contrast, the alias peaks could be 70–90% of the power of the main peak for single-site data (Nather, 1989, Figure 1). In May 1990, the primary target of the WET was the prototype pulsating DB (DBV) star GD 358. The results of the observing run were published by Winget et al. (1994) as well as Bradley and Winget (1994) and we refer the reader to those papers for details. Here, we summarize the observations and show how adding sites reduces the aliasing peaks in the Fourier Transform (FT). Our aim is to show which longitude distribution is optimal for reducing the alias peaks (if a gap must exist) and the dramatic reduction in the alias peaks once the longitude gaps are filled, even once. We will not be describing the seismological results for GD 358, but refer the reader to Bischoff-Kim et al. (2018) and Corsico et al. (2021) for the latest results.
GD 358 is a northern hemisphere target with an RA of 16h 47m and declination of +32° 28′. The observing sites for GD 358 included: McDonald Observatory (Texas, 0.9 m), Kitt Peak Observatory (Arizona, 1.3 m), Mauna Kea (Hawai’i, 0.6 m), Perth (Australia, 0.6 m), Wise Observatory (Israel, 1 m), South African Astrophysical Observatory (SAAO, South Africa, 0.75 m), Itajuba (Brazil, 1.60 m); European Southern Observatory (Chile, 1.0 m). The sites are shown as stars on the world map in Figure 2.
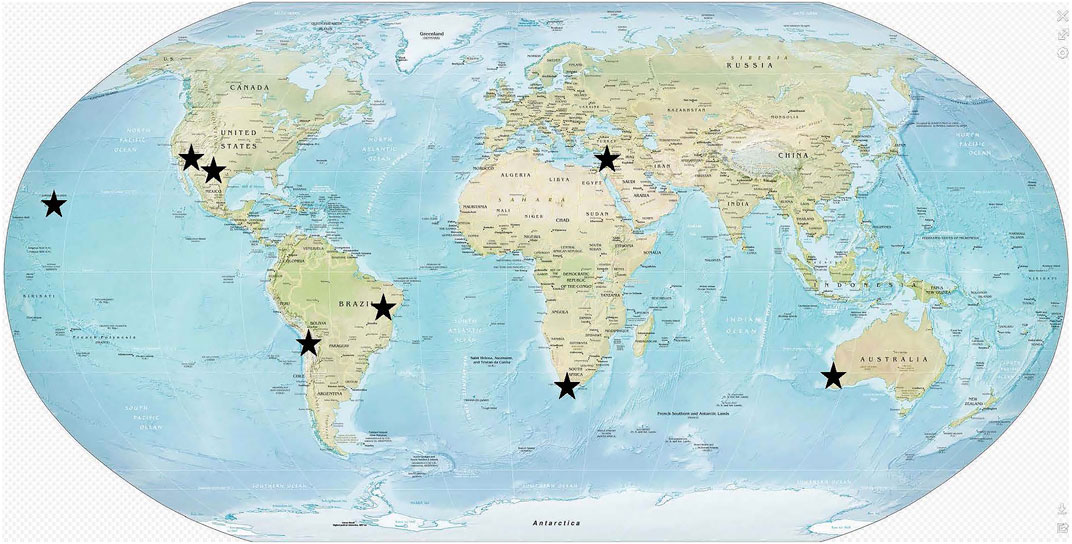
FIGURE 2. Map of the World with WET sites contributing data for GD 358 in May 1990. The sites are marked with stars. Note that the sites are distributed over most longitudes. (image from Wikimedia Commons; “Physical map of the world, from CIA “The World Factbook” in 2021).
There are a couple things worth noting about the observation strategy that are key for GD 358. First is that GD 358 is relatively bright (mag = 13.65) and is a large amplitude pulsator (up to 0.3 mag). As a result, telescopes as small as 0.6 m contributed excellent data. Requiring smaller telescopes means that potentially more sites could participate. The second thing to note is that several longitudes had more than one observing site, which made it more likely that we would observe GD 358 over an entire 24 h cycle (see also O’Donoghue and Provencal, 1992) and less likely that weather would create gaps in the data. Figure 3 shows the reduced data from all the sites. The first thing to note is that there is not a continuous 24 h span of coverage at any time during the run. However, all of the 24 h of a day have at least some coverage, as we describe. On day 1, there are gaps between 22,000 and 32,000 s as well as 42,000 to 68,000 s. The first gap gets filled between days 3 and 4 (281,000 to 291,000 s) and days 4 and 5, while the second gap is largely filled by data from Israel and Perth on subsequent days (days 3 and 4 for example). As we will show, just filling all 24 h of longitude even once during the entire observing run is enough to nearly wipe out the 1 cycle per day alias.
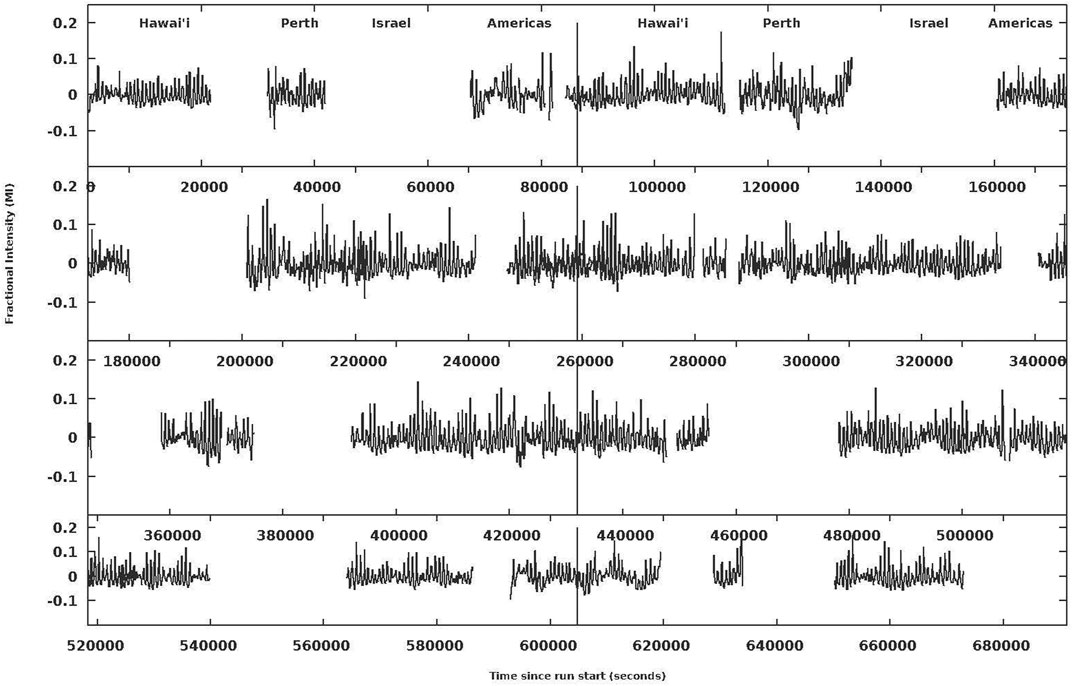
FIGURE 3. The reduced data of GD 358 from the May 1990 WET run. Each panel covers 2 days, with vertical lines in the middle denoting 1 day units. The light curve is measured in modulation intensity units, which for small values is roughly comparable to magnitudes. The observed gaps are due to a combination of observing time allocation and weather. Note that while there is no day with complete 24 h coverage, all 24 h of longitude are covered at least once during the WET run, as can be seen by looking down from top to bottom at a given point.
The Fourier Transform and “Window Function”
Fourier Transform
To analyze data for pulsating stars, we start by assuming the observed periodicities are constant over the course of an observing run. This allows us to process the data with a Fourier Transform (FT; Blackman and Tukey, 1958) to analyze the frequency content of the pulsations. Problems arise when the data have gaps. If the interval between individual data points is short relative to the periods of interest, then the gaps will not have a significant effect on data interpretation. For this reason, the observers of GD 358 used 10 s integration times, which is short compared to the shortest observed periods of >400 s for the pulsation modes and >200 s for the combination peaks arising from the non-sinusoidal shape of the light curve. Another requirement is that the observing runs are long enough to sample several cycles of the dominant modes; in this case, the runs need to be at least 2–3 h long. The problem arises with the fact that the Sun comes up at every observing site once per day. Thus, while an FT may compute the largest amplitude for a pulsation mode at, say, 1,428 μHz (123.4 cycles/day), the periodic gap implies there is a non-negligible chance that a mode at 1,439.6 and 1,416.4 μHz (or 1 cycle/day different) can fit the data (with a lower amplitude) as shown in Figure 1. If the pulsations are monoperiodic, the “comb” pattern can be recognized and the true period determined. However, almost all white dwarfs are multiperiodic and have modes with similar amplitudes, which can make disentangling single-site data impossible. This impasse, the favorable experience with 2-site data, and a desire to perform asteroseismology of white dwarfs amongst the community led to the development of the WET (Nather, 1989; Nather et al., 1990).
The “Window Function” for GD 358
With this said, we can turn to the main point of this article, which is to show how minimizing the single-site daylight observing gaps can reduce the alias pattern and make asteroseismology possible. We show the main result in Figure 4. In this example, we take a single sine wave with a period of 700 s (which is the dominant mode of GD 358) that has l = 1, and is the 15th radial overtone (k = 15). We then sample this mode with exactly the same time span as the data selected. This is commonly called the “window function”. In Figure 4, we show the results for data from a single site with good weather (7 of 8 nights; dark blue curve for Hawai’i), data from two sites (red, green, and cyan curves), and finally all of the data shown in Figure 3 (black curve). The results from a single site (about 8 h of data per night) exhibit prominent 1 cycle/day and other alias peaks. The red and green curves show the result when two adjacent sites (Hawai’i and Perth) or (Hawai’i and the Americas) are used. The 1 cycle/day alias power is cut in half, and the other peaks virtually disappear. The alias patterns are very similar, because each represents 12–14 h of continuous data each day. When two sites on opposite sides of the Earth are used (Hawai’i and Israel, cyan curve), the 1 cycle/day peak disappears, and the peak at 2 cycles/day (23.14 μHz) is the most prominent. In this case, the roughly 14 h of data have periodic gaps of about 5.5 and 4.5 h each day. Finally, when all the data are used, the alias peaks become negligible (<6% in power). As mentioned earlier, it is not necessary to obtain a continuous 24 h string of data in 1 day; it just needs to be done at least once during an observing run of about 10 days.
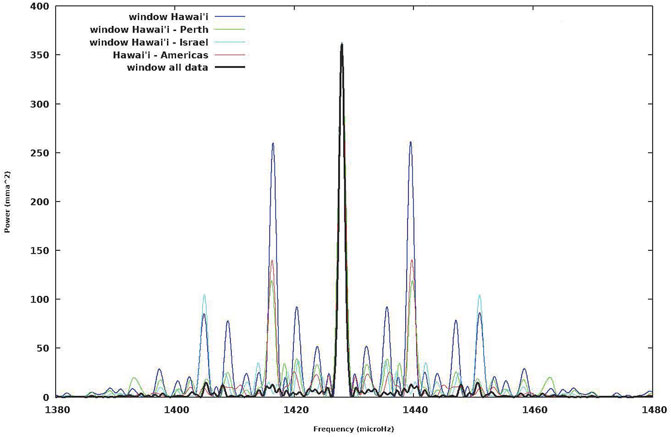
FIGURE 4. A summary of the spectral window for a single mode at 700 s (which happens to be the largest amplitude mode (l = 1, k = 15) seen in May 1990). The dark blue curve shows the results from a single site, with prominent 1 cycle/day and other peaks. The red and green curves show the result when two adjacent sites (Hawai’i and Perth) or (Hawai’i and the Americas) are used. The 1 cycle/day alias power is cut in half, and the other peaks virtually disappear. When two sites on opposite sides of the Earth are used (Hawai’i and Israel, cyan curve), the 1 cycle/day peak disappears, and the peak at 2 cycles/day is the most prominent. Finally, when all the data are used, the alias peaks become negligible (<6% in power).
The window function suggests that two-site data will have an alias pattern considerably reduced from single-site data, but it will still imprint a pattern that makes discerning individual modes challenging, especially if the mode content is rich. Most of the pulsation power (amplitude squared) in GD358 lies in the range of 1,200–2,500 μHz, with “combination” peaks arising from nonlinear pulse shape modulations showing up outside this range. In Figure 5, we show the FT of the main region using data from Hawai’i and Perth. Each of the main modes happens to be a rotationally split l = 1 triplet, but aliasing makes this identification difficult. For example, the k = 15 (15th radial overtone) mode shows 6 large peaks and many smaller peaks nearby, while the k = 13 mode has two large peaks. In this case, with the benefit of hindsight, we would be able to identify the different overtones, but we would have difficulty picking out the rotationally split sidelobes from the alias pattern, which would compromise our confidence that these are all the same spherical harmonic index modes. If we compare Figure 5 to Figure 6, where we compute an FT for the region from 2000 to 2,500 μHz, the difference in the alias pattern is dramatic. Each of the main modes now shows a clear triplet pattern and the overall “noise” level is greatly reduced. We refer the reader to Winget et al. (1994) for the definitive data analysis (see especially their Figures 3 and 7); our aim here is to graphically illustrate that the WET achieved the goal of nearly eliminating alias peaks and making asteroseismology of white dwarf stars possible.
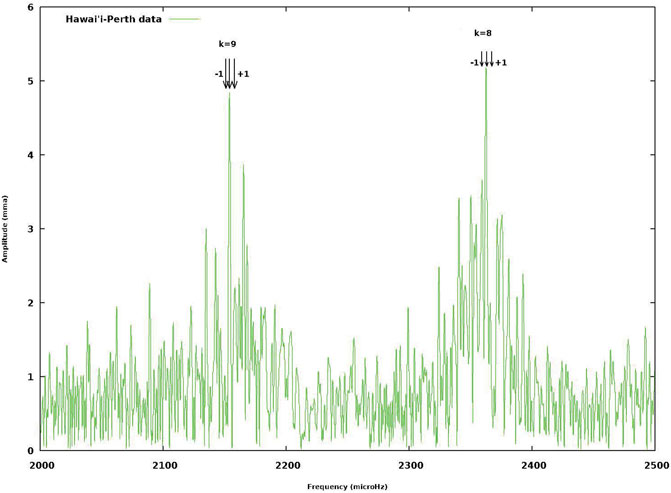
FIGURE 5. A Fourier Transform of the GD 358 data from Hawai’i and Perth taken in May 1990. The numbers indicate the l = 1 overtone of the mode. Here we show only the k = 8 and 9 modes. Each mode has considerable “structure”, which is partly due to the modes being rotationally split triplets and partly due to aliasing. Also, the mean noise level is higher here than in Figure 6. Compare this figure with Figure 6 (below), where all of the WET data are used.
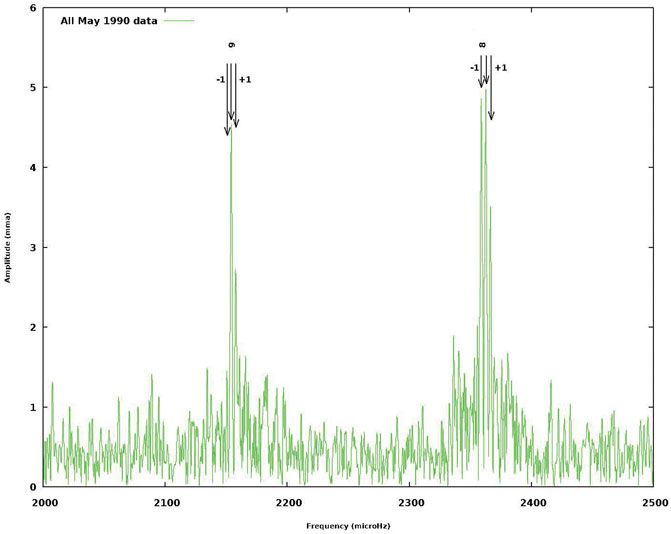
FIGURE 6. A Fourier Transform of the GD 358 data from all of the May 1990 WET data. The numbers indicate the l = 1 overtone of the mode. Here we show only the k = 8 and 9 modes. Each of the overtone modes is now resolved into unequal amplitude triplets (see arrows) that arises from rotational splitting of l = 1 modes. (The k = 9, m = −1 component is in the noise.)
Satellite Data and the Future
Satellite Data
The recognized need for long time baseline photometric data without being subject to the vagaries of weather, allocations of telescope time, and the circumstances of astronomers at each site on the globe led to the recognition that space-based photometry offered compelling opportunities. An early space probe dedicated to photometric seismology was MOST (Walker et al., 2003), which was a small satellite that could only observe bright (mag <6) stars. However, it demonstrated that satellite photometry could obtain long (∼30 days) strings of data of uniform quality, sufficient for asteroseismology of some bright stars. COROT (Baglin et al., 2002; Baglin et al., 2009; Poretti et al., 2009) was another satellite that was used to obtain roughly 30–60 days timespan data sets for pulsating and rotationally modulated variable stars. The major breakthrough came with the KEPLER (Koch et al., 2010; Borucki et al., 2010) spacecraft, which was designed to look for extrasolar planet transits via photometry, but was also ideally suited for variable star research. KEPLER discovered many thousands of new variable stars (with mag <17; Koch et al., 2010) with unprecedented measurement accuracy. In the original field (Borucki et al., 2010), some stars had up to 4 years of nearly continuous data. Currently, the TESS satellite (Ricker et al., 2014) is being used for asteroseismology. Based on the results of Bognar et al. (2020), the limiting magnitude of TESS to observe pulsating white dwarfs is ∼17). Corsico et al. (2021) have recently analysed TESS results for GD 358.
A Comparison of Ground-Based Versus Space-Based Data Collection
Ground-based and space-based photometry have their advantages and disadvantages for long time baseline precision photometry and should be viewed as complimentary tools.
Ground-based photometry has the singular advantage of being far cheaper to implement than building, launching and running a spacecraft, even a modest one such as MOST. In addition, observing sites can be chosen based on the declination of the target star and all of the sky is potentially available. Also, a ground-based network typically involves far fewer people than a satellite collaboration.
That being said, ground-based photometry has some significant drawbacks. Foremost is the issue of weather. Multiple sites at each longitude can mitigate weather-related data gaps, but not eliminate them. In addition, low frequency (on order of hours) transparency variations are very hard to remove unless careful work is done with the photometric data collection to remove these effects. Another serious issue is dealing with the bureaucracy of different telescope allocation committees and different countries’ views of funding asteroseismology, especially when the papers have many co-authors. These constraints affect which sites can participate. Also, resources and observer fatigue make it difficult for runs to last longer than 2 weeks or occur more than twice a year. Another issue is creating a “standard instrument” that mitigates cross-calibration issues. As discussed by Nather et al. (1990), this turned out not to be a major issue, but it cannot be ignored. Finally, the telescopes are of different sizes (and state of repair) and observing sites are of different quality. In addition, it is much easier to obtain time on smaller telescopes (which are frequently controlled by one institution) than large ones. This tended to limit targets to magnitude 15 or brighter in many cases. Small telescopes at premier observing sites are also at risk of being removed in favor of building a larger telescope. This fate befell the two 24 inch telescopes at Mauna Kea; they were removed to allow much larger telescopes to be built.
Ground-based photometry typically has a frequency resolution limit of 0.1 days (∼0.5 μHz for a 10 days observing run) and a noise limit of about 0.1 mmag.
Space-based photometry has the enormous advantage of the instrument being above the Earth’s atmosphere. This means no atmospheric data artifacts and no sunrise/sunset issues. As a result, the noise limit is typically in the 1 μmag range, or up to 100 times better than from the ground. Most satellites were (and are) set up to observe a particular spot in the sky for 1–2 months, although KEPLER observed some targets for up to 4 years. The frequency resolution is therefore 0.1 to 0.005 μHz. Observations with extremely long time baselines (>1 year) also showed amplitude variations in pulsation modes and infrequently occurring phenomena (the “sforzando” event in GD 358; Provencal et al., 2009) being a case in point. Once funded, satellites tend to have many more resources available for observing, data reduction, and analysis, so that there is a large quantity of data collected and a large number of people available (even the entire astronomical community, once the “exclusive rights” period expires).
The biggest drawback of space-based photometry is the extreme expense of the mission and competition with other space missions. This means only a few missions have been flown and almost all of these missions were multi-purpose, in that the photometry was used for extrasolar planet transits, pulsations, and other sources of light variations in stars. Competition to observe stars, especially with rapid cadence, can be intense. The observing pattern for some satellites has resulted in some parts of the sky being relatively poorly sampled. The expense of launching large amounts of mass means that the telescope size is typically rather modest, with KEPLER being a 0.95 m telescope and TESS being four 10.5 cm lenses.
Conclusion
We have shown that multi-site data with 24 h coverage at some point during an observing run can drastically reduce the 1 cycle/day alias pattern seen in FTs of pulsating white dwarfs, which have enabled asteroseismology of these (and other) stars. In our illustration, we describe how the need to remove these alias peaks motivated the creation of the Whole Earth Telescope and similar networks. Later, this promise led to the development of satellites that could “stare” continuously at a target for 1–2 months with photometric precisions not possible from the ground. Each method has advantages and disadvantages, and hopefully people and funding agencies will continue to have an interest in asteroseismology in general and white dwarf asteroseismology in particular.
Author Contributions
PB conceived the idea for this article, performed the Fourier Transforms and wrote the article.
Funding
Funding was provided by Los Alamos National Laboratory for publishing this article.
Conflict of Interest
The author declares that the research was conducted in the absence of any commercial or financial relationships that could be construed as a potential conflict of interest.
Publisher’s Note
All claims expressed in this article are solely those of the authors and do not necessarily represent those of their affiliated organizations, or those of the publisher, the editors and the reviewers. Any product that may be evaluated in this article, or claim that may be made by its manufacturer, is not guaranteed or endorsed by the publisher.
Acknowledgments
We thank Ed Nather and Don Winget for having the vision to create the Whole Earth Telescope, and the many people (too numerous to mention by name) that contributed observing time, time at “headquarters” during observing runs, doing data reduction, creating the theoretical tools for extracting science from the data, and showing that asteroseismology of white dwarfs is really possible. Thanks also go to D. Saumon and J. Guzik for reading and providing comments on this article. We thank the reviewers, whose comments improved this paper. This work was performed at Los Alamos National Laboratory under the auspices of the U.S. Department of Energy under Contract No. 89233218NCA00000.
References
Althaus, L., Corsico, A. H., and Bischoff-Kim, A. (2010). New Chemical Profiles for the Asteroseismology of ZZ Ceti Stars. ApJ 717, 897.
Baglin, A., Auvergne, M., Barge, P., Buey, J.-T., Catala, C., Michel, E., et al. (2002). “COROT: Asteroseismology and Planet Finding,” in Proceedings of the 1st Eddington Workshop “Stellar Structure and Habitable Planet Finding”. Editors F. Favata, I. W. Roxburgh, and D. Galadi-Enriquez (Noordwijk: ESA SP-485ESA), 17.
Baglin, A., Miglo, A., Michel, E., and Auvergne, M.the COROT team (2009). “Seismic Landscape as Seen from CoRoT,” in Proceedings “Stellar Pulsation: Challenges for Observation and Theory”. Editors J. A. Guzik, and P. A. Bradley (New York: American Institute of Physics), 310. doi:10.1063/1.3246500
Bischoff-Kim, A., Provencal, J. L., Bradley, P. A., Montgomery, M. H., Shipman, H. L., et al. (2018). GD 358: Three Decades of Observations for the In-Depth Asteroseismology of a DBV star. ApJ 871, 13. doi:10.3847/1538-4357/aae2b1
Blackman, R. R., and Tukey, J. W. (1958). The Measurement of Power Spectra. New York: Dover Publications, Inc.
Bognár, Z., Kawaler, S. D., Bell, K. J., Schrandt, C., Baran, A. S., Bradley, P. A., et al. (2020). TESS First Look at Evolved Compact Pulsators. A&A 638, A82. doi:10.1051/0004-6361/202037470
Borucki, W. J., Koch, D., Basri, G., Batalha, N., Brown, T., Caldwell, D., et al. (2010). Kepler Planet-Detection Mission: Introduction and First Results. Science 327, 977–980. doi:10.1126/science.1185402
Bradley, P. A. (1998). Asteroseismological Constraints on the Structure of the ZZ Ceti Stars G117‐B15A and R548. Astrophys J. Suppl. S 116, 307–319. doi:10.1086/313102
Bradley, P. A. (1996). Theoretical Models for Asteroseismology of DA White Dwarf Stars. ApJ 468, 350. doi:10.1086/177696
Bradley, P. A., and Winget, D. E. (1994). An Asteroseismological Determination of the Structure of the DBV white dwarf GD 358. ApJ 430, 850. doi:10.1086/174456
Córsico, A. H., Althaus, L. G., Miller Bertolami, M. M., and Kepler, S. O. (2019). Pulsating white Dwarfs: New Insights. Astron. Astrophys Rev. 27, 7. doi:10.1007/s00159-019-0118-4
Corsico, A. H., Uzundag, M., Kepler, S. O., Althaus, L. G., Silvotti, R., Baran, A. S., et al. (2021). Pulsating Hydrogen-Deficient white Dwarfs and Pre-white Dwarfs Observed with TESS: III. Asteroseismology of the DBV star GD 358. A&A. in press.
Fontaine, G., and Brassard, P. (2008). The Pulsating white dwarf Stars. Publ. Astron. Soc. Pac. 120, 1043–1096. doi:10.1086/592788
Giammichele, N., Fontaine, G., Brassard, P., and Charpinet, S. (2016). A New Analysis of the Two Classical Zz Ceti White Dwarfs Gd 165 and Ross 548. Ii. Seismic Modeling. ApJS 223, 10. doi:10.3847/0067-0049/223/1/10
Kepler, S. O., and Romero, A. D. (2017). Pulsating white Dwarfs. EPJ Web Conf. 152, 01011. doi:10.1051/epjconf/201715201011
Koch, D. G., Borucki, W. J., Basri, G., Batalha, N. M., Brown, T. M., Caldwell, D., et al. (2010). KEPLER mission Design, Realized Photometric Performance, and Early Science. ApJ 713, L79–L86. doi:10.1088/2041-8205/713/2/l79
McGraw, J. T., Starrfield, S. G., Liebert, J., and Green, R. (1979). “PG1159-035: A New, Hot, Non-DA Pulsating Degenerate,” in IAU Colloquium 53, “White Dwarfs and Variable Degenerate Stars”. Editors H. M. Van Horn, and V. Weidemann (Rochester: University of Rochester), 377–381. doi:10.1017/s0252921100076223
Nather, R. E. (1989). “The Whole Earth Telescope,” in Proc. IAU Colloquium 114, “White Dwarfs”. Editor G. Wegner (Berlin: Springer-Verlag), 109–114. doi:10.1017/s0252921100099371
Nather, R. E., Winget, D. E., Clemens, J. C., Hansen, C. J., and Hine, B. P. (1990). The Whole Earth Telescope - A New Astronomical Instrument. ApJ 361, 309. doi:10.1086/169196
O’Donoghue, D., and Provencal, J. L. (1992). “Progress with the Whole Earth Telescope,” in Proc. IAU Colloquium 136, “Stellar Photometry”. Editors C.J. Butler, and I. Elliot (Cambridge, UK: Cambridge U. Press), 250.
Poretti, E., Michel, E., Garrido, R., Lefèvre, L., Mantegazza, L., Rainer, M., et al. (2009). HD 50844: A New Look atδScuti Stars from CoRoT Space Photometry. A&A 506, 85–93. doi:10.1051/0004-6361/200912039
Provencal, J. L., Montgomery, M. H., Kanaan, A., Shipman, H. L., Childers, D., Baran, A., et al. (2009). 2006 Whole Earth Telescope Observations of Gd358: A New Look at the Prototype Dbv. ApJ 693, 564–585. doi:10.1088/0004-637x/693/1/564
Ricker, G. R., Winn, J. N., Vanderspek, R., Latham, D. W., Bakos, G. Á., Bean, J. L., et al. (2014). The Transiting Exoplanet Survey Satellite. Proc. SPIE 9143, 9144320. doi:10.1117/12.2063484
Walker, G., Matthews, J., Kuschnig, R., Johnson, R., Rucinski, S., Pazder, J., et al. (2003). TheMOSTAsteroseismology Mission: Ultraprecise Photometry from Space. Publ. Astron. Soc. Pac. 115, 1023–1035. doi:10.1086/377358
Winget, D. E., and Kepler, S. O. (2008). Pulsating White Dwarf Stars and Precision Asteroseismology. Annu. Rev. Astron. Astrophys. 46, 157–199. doi:10.1146/annurev.astro.46.060407.145250
Winget, D. E., Nather, R. E., Clemens, J. C., and Provencal, J. L. (1991). Asteroseismology of the DOV star PG 1159-035 with the Whole Earth Telescope. ApJ 378, 326.
Winget, D. E., Nather, R. E., Clemens, J. C., Provencal, J. L., Kleinman, S. J., Bradley, P. A., et al. (1994). Whole Earth Telescope Observations of the DBV White Dwarf GD 358. ApJ 430, 839. doi:10.1086/174455
Winget, D. E., Robinson, E. L., Nather, R. D., and Fontaine, G. (1982a). Photometric Observations of GD 358 - DB white Dwarfs Do Pulsate. ApJ 262, L11. doi:10.1086/183902
Winget, D. E., Robinson, E. L., Nather, R. E., Kepler, S. O., and Odonoghue, D. (1985). A Measurement of Secular Evolution in the Pre-White dwarf star. ApJ 292, 606. doi:10.1086/163193
Winget, D. E., Van Horn, H. M., Tassoul, M., Fontaine, G., Hansen, C. J., and Carroll, B. W. (1982b). Hydrogen-Driving and the Blue Edge of Compositionally Stratified ZZ Ceti star Models. ApJ 252, L65. doi:10.1086/183721
Wood, M. A. (1992). Constraints on the Age and Evolution of the Galaxy from the White Dwarf Luminosity Function. ApJ 386, 539. doi:10.1086/171038
Keywords: stars, white dwarfs-stars, oscillations-stars, asteroseismology-stars, GD 358, photometry—instruments
Citation: Bradley PA (2021) How Gaps in Time-Series Data Affect Asteroseismic Interpretation. Front. Astron. Space Sci. 8:793930. doi: 10.3389/fspas.2021.793930
Received: 12 October 2021; Accepted: 24 November 2021;
Published: 22 December 2021.
Edited by:
Santiago Torres, Universitat Politecnica de Catalunya, SpainReviewed by:
Ali Luo, National Astronomical Observatories (CAS), ChinaGiovanni Catanzaro, Osservatorio Astrofisico di Catania (INAF), Italy
Mike Montgomery, University of Texas at Austin, United States
Copyright © 2021 Bradley. This is an open-access article distributed under the terms of the Creative Commons Attribution License (CC BY). The use, distribution or reproduction in other forums is permitted, provided the original author(s) and the copyright owner(s) are credited and that the original publication in this journal is cited, in accordance with accepted academic practice. No use, distribution or reproduction is permitted which does not comply with these terms.
*Correspondence: Paul A. Bradley, cGJyYWRsZXlAbGFubC5nb3Y=