
94% of researchers rate our articles as excellent or good
Learn more about the work of our research integrity team to safeguard the quality of each article we publish.
Find out more
ORIGINAL RESEARCH article
Front. Astron. Space Sci., 02 December 2021
Sec. Space Physics
Volume 8 - 2021 | https://doi.org/10.3389/fspas.2021.776992
This article is part of the Research TopicCoupled Feedback Mechanisms in the Magnetosphere-Ionosphere SystemView all 25 articles
In August 2015, the Balloon Array for Radiation belt Relativistic Electron Losses (BARREL) observed precipitation of energetic (
On August 10, 2015, BARREL balloon payload 3 A observed bremsstrahlung x-rays (∼5–150 keV) attributed to precipitation of energetic electrons with energies
Plasmaspheric hiss is a major driver of radiation belt loss inside the plasmasphere, contributing to the creation of the slot region between the inner and outer radiation belts (Lyons and Thorne, 1973). These low-frequency (∼50 Hz-2 kHz) electromagnetic whistler-mode waves are broadband and incoherent. Their power is also proportional to the density, with more power in dense regions (Malaspina et al., 2016; Malaspina et al., 2018). Recent RBSP observations and simulations demonstrate the importance of hiss waves; these waves generate major loss up to L = 5.5 from pitch angle diffusion when the plasmasphere is widely extended during quiet times (Ripoll et al., 2016; Ripoll et al., 2017; Ripoll et al., 2019). More information about hiss waves and the dynamics of the radiation belts can be found in the review of Ripoll et al. (2020a).
Outside the plasmasphere, at higher L-values, energetic electron precipitation has been primarily attributed to whistler mode chorus waves or electromagnetic ion cyclotron (EMIC) waves [e.g., Millan and Thorne (2007); Thorne (2010)]. Recent work suggests that hiss may also be active at higher L-values in dense plasmaspheric plumes and detached plasma regions. A plasmaspheric plume (also called a “tail” in the literature) is a narrow region of dense cold plasma that extends out from the main plasmasphere at Earth. The EUV instrument on the IMAGE spacecraft provided the first global observations of plasmaspheric plumes, their formation and evolution (Sandel et al., 2001; Goldstein, 2004). Plume evolution is driven by changes in the dawn-dusk convection electric field due to changes in the solar wind (Grebowsky, 1970; Lemaire, 2000). A sudden increase in the convection electric field causes the plasmapause boundary to move inward leaving behind plasma that E × B drifts towards the dayside, forming a dayside plume that is wide in magnetic local time (MLT). With a subsequent decrease in the convection electric field, the plume wraps around Earth and the MLT extent narrows. Spacecraft passing through a plume observe a localized increase in cold plasma density over a narrow range in MLT. In the absence of global imaging, the twin Van Allen Probes spacecraft, moving in similar orbits - one following the other, provide an opportunity to distinguish between temporal and spatial variations, helping to identify spatial density structures like plumes.
Properties of hiss waves in plumes have been statistically characterized in Shi et al. (2019). The occurrence rate of hiss in plumes has a clear dependence on MLT and geomagnetic activity, peaking near the dusk sector during active times. These waves are more powerful in plumes than inside the plasmasphere, particularly during active times, and have low wave normal angles compared to the wide wave distribution function in the plasmasphere. Plume whistler-mode waves were frequently observed by Van Allen Probes and may be an efficient loss mechanism for radiation belt seed electrons (Zhang et al., 2019). Zhang et al. (2018) calculated loss rates due to observed hiss emissions in a nightside plume and found that such emissions may result in fast (few hours) loss of 10–100 keV electrons at L in [4.5, 5.5] and a slower decay of higher energy particles. Li et al. (2019) examined a particular event and found that plume whistler mode waves are an effective pitch-angle scattering mechanism, particularly for electrons with energies from tens to hundreds of keV.
In this paper, we investigate plume whistler-mode hiss waves as the primary cause of the energetic electron precipitation observed by BARREL balloon 3 A on 10 August, 2015. The observations are described in Section 2.1. Data from Van Allen Probes are used to precisely determine the properties of observed waves, trapped electrons, and cold plasma density. An event-driven quasi-linear diffusion model is then used (Section 2.2) to investigate wave-particle interactions between the plume whistler-mode waves and the trapped electrons, seeking to identify the theoretical energy of the precipitating electrons. We further investigate the time evolution of the electron phase space density.
In this study, we use data from BARREL Campaign 3 and the two Van Allen Probes spacecraft to characterize observed electron precipitation and in situ plasma and wave properties respectively. BARREL measures electron precipitation by detecting the bremsstrahlung x-rays produced as electrons collide with the neutral atmosphere [see e.g., Sample et al. (2020) for review]. Each BARREL payload carries a single 3“ diameter by 3” tall sodium-iodide scintillator nominally sensitive to x-rays from 20 keV to 10 MeV (Millan et al., 2013). Several BARREL data products are available as described in Woodger et al. (2015). In the present study, we use the fast spectra (FSPC) with 50 ms x-ray count rates, available in six energy channels covering 3–1300 keV. Note that the nominal FSPC energy range is 25–1500 keV but the Level 2 data product used here is calibrated to account for temperature-dependent gain shifts. GPS timing and positioning are transmitted using the Iridium satellite network along with the science and other housekeeping data. The third BARREL campaign was carried out at the Esrange facility near Kiruna, Sweden in August 2015. A total of seven balloons were launched over 16 days. Here, we use data from BARREL 3 A which was launched on 10 August at 13:50 UT and terminated on 10 August at 21:18 UT.
The twin Van Allen Probes (here also referred to as RBSP-A and RBSP-B) were launched on 30 August 2012 into nearly-equatorial orbits with 618 km perigee and 30,414 km apogee, providing two passes through the outer radiation belts every roughly 9 h. Each spacecraft carries a comprehensive suite of instrumentation to study particles and plasma waves throughout the inner magnetosphere (Mauk et al., 2013). In this study, we use data from the EMFISIS (Electric and Magnetic Field Instrument Suite and Integrated Science) (Kletzing et al., 2013), and MagEIS (Magnetic Electron Ion Spectrometer) instruments (Blake et al., 2013).
The EMFISIS waves instrument uses a tri-axial search coil magnetometer and electric field measurements from the EFW (Electric Field/Waves) instrument. A 6-channel waveform receiver (WFR) provides electric and magnetic field power from 10 Hz to 12 kHz. A single channel high frequency receiver (HFR) covers 10–500 kHz. For this study, we use Level 4 CDF files for cold plasma density, and the Level 2 WFR Spectral matrix product CDF files for wave observations, obtained from https://emfisis.physics.uiowa.edu/data/index/. The analysis used to determine the wave properties is described in more detail in Section 2.2 below. For more information about EMFISIS, see Kletzing et al. (2013).
The MagEIS instrument consists of four magnetic spectrometers, one low-energy unit (20–240 keV), two medium-energy units (80–1200 keV), and a high-energy unit (800–4800 keV). For this study, we use Level 3 CDF files from: https://www.rbsp-ect.lanl.gov/data_pub/rbspa/mageis/level3/which combine low, medium and high data into pitch-angle resolved electron flux. For more information about the MagEIS instrument design see Blake et al. (2013).
BARREL 3 A began to detect an increase in the 3–145 keV x-ray count rate (obtained by summing the FPSC 1a, 1b, and 1c energy channels) at 1505 UT (Figure 1, blue trace) just after the balloon reached a float altitude of 37 km. The energy of the precipitating electrons producing the x-rays was primarily below 145 keV as can be seen by the lack of count rate increase in the FSPC2 (145–456 keV) channel (Figure 1, orange trace). Precipitation was observed for about 3 h. Note that precipitation may have begun prior to 1505 UT while the balloon was ascending and thus not sensitive to these low energy x-rays. At the onset of the observed precipitation, BARREL 3 A was located at L ∼6, MLT ∼1740 (T89 magnetic field model with Kp = 2), just east of the RBSP-B magnetic footpoint. BARREL is nearly fixed geographically and thus moves in MLT as earth rotates.
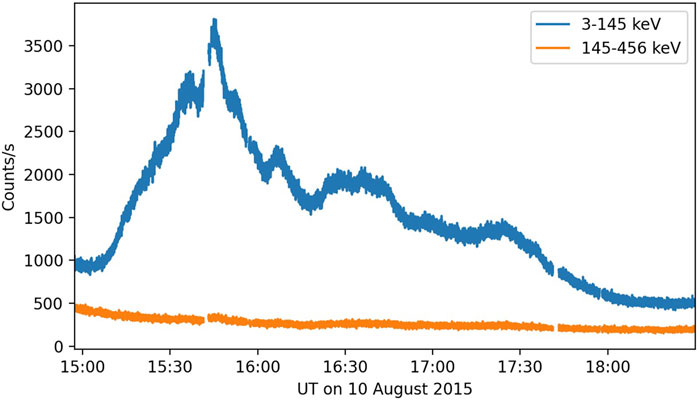
FIGURE 1. BARREL Payload 3 A x-ray count rate versus time in two energy ranges: 3–145 keV (blue) and 145–456 keV (orange), observed on August 10, 2015. The 50 ms FSPC data have been summed to a 1 s cadence.
Figure 2 shows EMFISIS data for just over two RBSP orbits on 10 August 2015. The two spacecraft were in similar orbits with RBSP-B (bottom panel) leading RBSP-A (top panel) by about 45 min. The white trace shows plasma density derived from the upper hybrid frequency (Kurth et al., 2015). At 1150 UT, RBSP-B exits the plasmasphere, as indicated by a steep decrease in plasma density. At 1445 UT, it encounters a localized region of increased density (∼80 cm−3). About 40 min later, at 1525 UT, RBSP-A encounters a similar localized increase in density. Both spacecraft encountered the high density region near apogee (L = 5.9) and in the same magnetic local time range (∼16–17 MLT), indicating that the density increase was a stable spatial structure which we identify as a plasmaspheric plume or detached plasma region. The high density region was also present on the previous orbit but with more spatial variation (Figure 2).
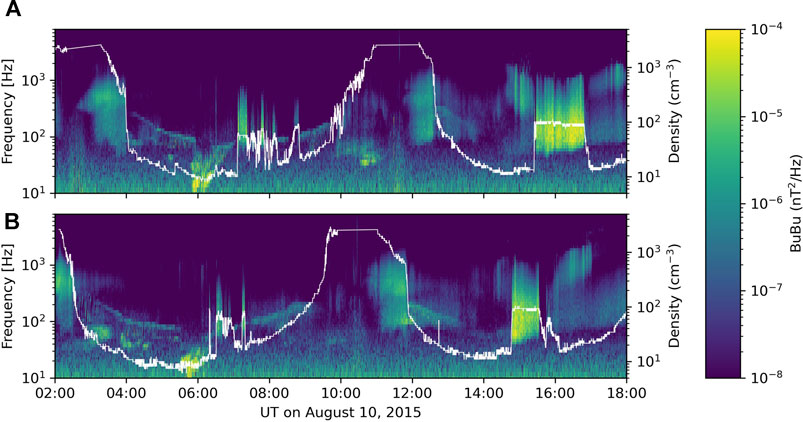
FIGURE 2. RBSP-A (A) and RBSP-B (B) EMFISIS data on 10 August 2015. The spectrogram shows the WFR cross spectrum diagonal matrix element, BuBu (spacecraft spin plane component of magnetic field), between 10 Hz and 8 kHz. Plasma density derived from the upper hybrid frequency is shown with the white trace.
Both RBSP spacecraft detected wave power between roughly 50 Hz-1 kHz, identified as whistler-mode hiss waves, throughout the high density plume region (Figure 2, color spectrogram). There was substantial variability of the observed wave amplitude, with values ranging from ∼50–200 pT. For comparison, mean hiss amplitudes are between 10 and 30 pT depending on geomagnetic conditions (e.g., (Malaspina et al., 2018)). Large amplitude whistler waves similar to those shown here are also reported in the statistics of Shi et al. (2019). The wave analysis and properties are discussed in more detail in Section 2.2 below.
We also examined electron data from the RBSP MagEIS instrument (Figure 3). A small substorm injection between 54–132 keV was observed starting at 1430 UT, just before RBSP-B entered the plume region. The injection shows some energy dispersion at both RBSP spacecraft. Data from the LANL geosynchronous spacecraft also show evidence of a substorm injection, with the spacecraft closer to midnight (e.g., LANL-02 A) observing a dispersionless injection at around 1330 UT (not shown). This is consistent with the RBSP observations of a dispersed injection a bit later, since the RBSP spacecraft were in the afternoon sector. Figure 4 shows example MagEIS pitch angle and energy distributions with superposed fits that are used in the modeling analysis described below.
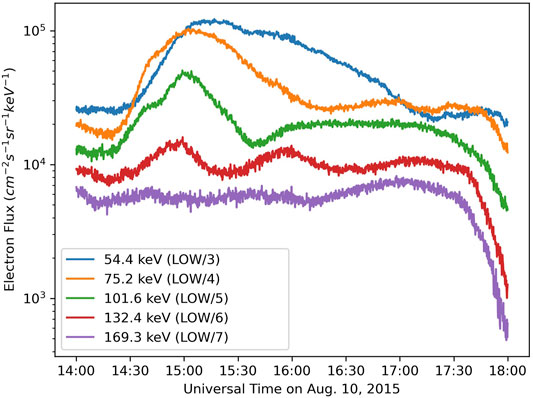
FIGURE 3. Electron intensity near the loss cone (α = 24.5°) in five energy channels as measured by the RBSP-B MagEIS instrument.
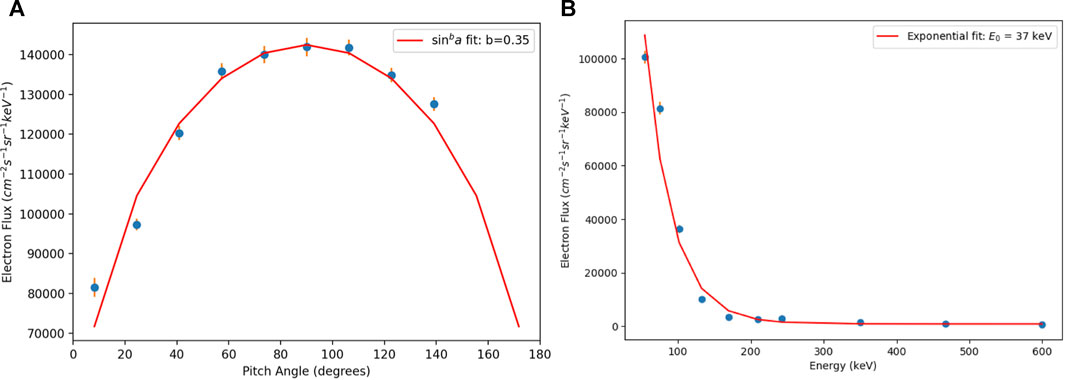
FIGURE 4. Example pitch angle (A) and energy (B) distributions from the RBSP-B MagEIS instrument with superposed fits. The pitch angle distribution is shown for ∼75 keV electrons and the energy distribution is shown near the loss cone at α ∼ 8°.
To investigate whether the observed plume hiss waves are the cause of the precipitation observed by BARREL, we use an event-driven quasi-linear diffusion model. Wave properties (mean frequency, frequency cut-offs, wave normal angle, and wave amplitude) over the time interval 1440–1700 UT on 10 August were generated from the EMFISIS data. We first compute the characteristic magnetic field amplitudes of whistler-mode waves using the trace of the magnetic-field power-spectral matrix calculated onboard RBSP-A from 3D measurements of the EMFISIS search coil antennas. The data were further processed into the Level 4 WNA data set (Kletzing et al., 2013) which serves as a basis for our analysis and additionally provides wave-normal angles. We select waves which propagate in the whistler mode and are right-hand polarized with ellipticity above 0.2 (Santolík and Gurnett, 2002). We restrict the analysis to a frequency range typical for plasmaspheric hiss from 50 Hz to 2 kHz (Santolík et al., 2001; Li W. et al., 2013; Thorne et al., 1973). The total power spectral density is therefore integrated over this frequency band. Mean frequency, mean frequency width, and wave normal angle are defined by equations (2)-(4) in (Ripoll et al., 2017) (not repeated here for brevity).
The average wave properties are shown in Table 1 for RBSP-A and RBSP-B. Although we use only RBSP-A values for the quasi-linear computations described below, the wave properties measured by RBSP-B are also shown in Table 1 to illustrate the stability and small variations of the wave system within the high density plume as measured by both spacecraft. We note that the waves have relatively small wave normal angles (last column in Table 1) in accordance with the statistical behavior found by Shi et al. (2019). The median frequency is also quite low, in agreement with observations of low frequency hiss (Malaspina et al., 2017), which favors interactions with higher energy electrons. Cold plasma density, derived from the upper hybrid frequency as measured by EMFISIS (Kurth et al., 2015), is reported in Table 2, along with the normalized wave parameters.

TABLE 1. Average wave parameters obtained from both Van Allen Probe spacecraft during the event interval. θ is the wave normal angle.

TABLE 2. Average plasma and normalized wave parameters during the event interval. ωmed is the median wave angular frequency calculated using fmedian from Table 1.
Diffusion coefficients are computed with the CEVA code originally developed by Réveillé et al. (2001). In this code, bounce averaged diffusion coefficients were computed following the method and equations of Lyons et al. (1972), which account for a sum over all harmonics (-n…, 0, …, n), a wave normal integration, and bounce averaging between the mirror points. Equations 2 to 8 of Lyons et al. (1972) define the diffusion coefficients. The limit of low frequency (ωmed/ωce < 1) and high-density (
Diffusion coefficients were calculated using the average wave and plasma parameters from RBSP-A. They are based on the observed size of the high density region (∼1 h MLT) and there is no MLT-averaging (e.g., Spasojevic et al. (2015)) that accounts for the wave variations throughout the drift path (cf. more comments below). The inclusion of the available ambient measurements produces so-called event-driven diffusion coefficients which are today the most sophisticated method for reproducing radiation belt observations (see also Thorne et al. (2013); Tu et al. (2014); Ripoll et al. (2020b); Pierrard et al. (2021)). In doing so, we attempt to quantify the accuracy of this type of modeling. The calculated diffusion coefficients are discussed in Section 3 below.
We also investigate the evolution of the electron phase space density (PSD) using the calculated diffusion coefficients in a pitch angle diffusion based Fokker-Planck equation (e.g. Ripoll et al. (2017)). The initial electron distribution was taken to be dependent on pitch angle following the RBSP-B observations. A convolution with the energy spectrum can be performed after the computation is made (in the absence of energy diffusion). For each MagEIS energy channel, the pitch angle distribution was fit with a sinb(α) function with a power b(E) depending on energy (example shown for 75 keV in left panel of Figure 4). We find b(E) = [0.15, 0.35, 0.52, 0.8, 0.6] for E = [54, 75, 102, 132, 169] keV. The initial condition is regularized in a continuous manner within the loss cone using the expression f(t = 0, E) = sinb(E)(α) − sinb(E)(αlc) (Li Z. et al. (2013)).
Figure 5 shows the bounce averaged diffusion coefficients calculated using the input parameters described above. At large L-shell (e.g., in the outer belt or in plasmaspheric plumes, L ∼ 6), hiss waves will predominantly act on low energy electrons. Here, the diffusion coefficient for small pitch angle particles is largest between ∼10–150 keV, consistent with the energy of x-rays observed by BARREL. As mentioned previously, the diffusion coefficient is not drift-averaged and is representative of the wave particle interactions only within the plume. The waves were observed only within the plume region, extending ∼1 h of MLT, thus drift-bounce-averaged diffusion coefficients would be a factor 1/24 lower in amplitude. Here, due to the intense wave amplitude and the absence of MLT-averaging, diffusion coefficients reach very high rates with Dαα ∼10−2 s−1. Since BARREL was located in the northern hemisphere, it observed predominantly local precipitation. This local bounce loss comes from the immediate and intense (low pitch angle) precipitation within the plume (thus proportional to the local wave amplitude squared) and is not the result of wave particle interactions all along the drift path (that would be proportional to the MLT-averaged squared amplitude, a factor 1/24 lower in this case).
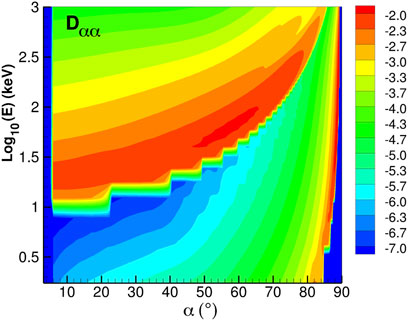
FIGURE 5. Bounce averaged diffusion coefficient (1/s, log10 scale) with respect to energy (E) and equatorial pitch angle (α) at L = 5.9 for the plume conditions observed by RBSP-A on 10 August, 2015 1500–1700 (cf. Tables 1, 2.).
Figure 6 shows the evolution of the phase space density for electrons as a function of energy, E, and equatorial pitch angle, α, from t = 0 to t = 100 min of interaction with hiss waves in the high-density region. The initial condition (top left panel) is f(t = 0, E) = sinb(E)(α) − sinb(E)(αlc). Sudden loss of 10–30 keV electrons occurs almost immediately, within the first 5 min, in the vicinity of the loss cone (Figure 6, top middle). Loss of 100 keV electrons by one order of magnitude takes 25 min of interaction. After 100 min (Figure 6, bottom right), the phase space density has vanished by ∼2 (resp. 1) orders of magnitude for all pitch angles below 70° for E in [20, 70] keV (resp [70, 200] keV). Note that electrons, particularly of higher energy, may interact with the plume multiple times as they gradient-curvature drift around Earth in order to reach a total of 100 min of interaction. 10 keV electrons with small pitch angle take ∼40 min to drift across the plume, thus the rapid loss of low energy electrons within the first 5 min occurs upon their first encounter with the plume. The predicted range of energies of the main loss are also in agreement with the range of energy found by Shi et al. (2019). Some loss of high energy electrons up to 1 MeV within the vicinity of the loss cone are also computed.
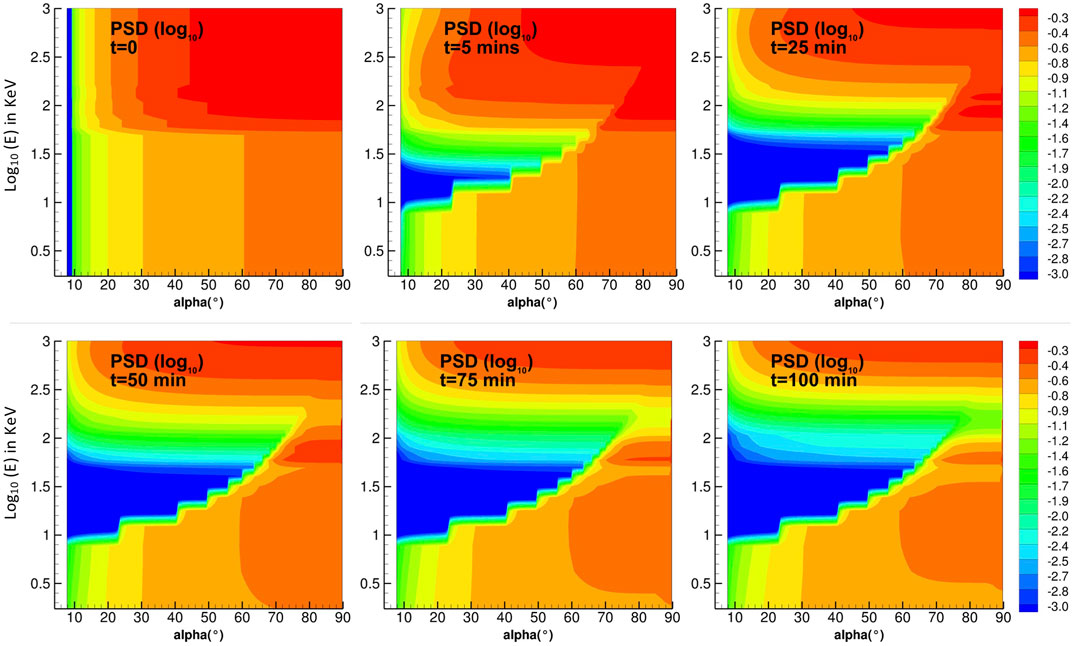
FIGURE 6. Phase space density versus energy (log10 in keV) and equatorial pitch angle (degrees) plotted at t = 0, 5, 25, 50, 75, 100 min. This PSD is the solution of the Fokker-Planck pitch angle diffusion equation.
We also study the influence of the initial conditions on the loss and on the dynamics at early times, when pitch angle diffusion has not yet reached an equilibrium state. Figure 7 shows the evolution of the PSD in the vicinity of the loss cone (at α = 7.95°, rounded to 7° in the figure’s label) during the first 100 min of interaction with hiss waves. Comparing the top and bottom rows of Figure 7 illustrates the important role of the loss cone regularization. Comparing lines within each figure allows to see the influence of the b(E) power index, with two limits bounding the variations. The low limit b(E) → 0 (i.e. b = 0.01) is equivalent to the widely used and standard f(t = 0, α) = 1 initial condition, either dropping abruptly from one for α ≠ αlc to 0 for α = αlc if there is no regularization (top row) or going continuously from one to 0 if regularized (bottom row). The second limit of b(E) → 1 is a PSD approaching sin(α) and with significant gradient at intermediate pitch angle. Figure 7 provides interesting new insight into the dynamics and how they are modeled. First, as expected, the larger the gradient at the loss cone, the more intense will be the loss in the vicinity of the loss cone and at the earliest times (generally below 1 min for our case, depending on energy). The regularization, which can be seen as a continuous process to fill out the loss cone, limits the gradient and thus the intensity of the earliest loss. In turn, large b(E) power index leads to intermediate pitch angle diffusion that will make the overall loss-gain budget at fixed pitch angle to lean in favor of a temporary growth of the PSD level during the earliest times. This is better seen in the presence of the regularization (since loss is even milder). On the contrary, without regularization the loss can dominate for certain low energy and b(E), and temporary growth can no longer exist. Most past parameter studies in the literature have been done with f(t = 0, α) = 1 and f(t = 0, αlc) = 0 (e.g., Shprits et al. (2008)) so that PSD growth could not be seen. This is because the infinite gradient at the loss cone creates intense sudden loss, and the absence of other gradients with respect to pitch angle make the appearance of temporary PSD growth impossible. This explains why this particular behavior has not been discussed in the past (to the authors’ knowledge).
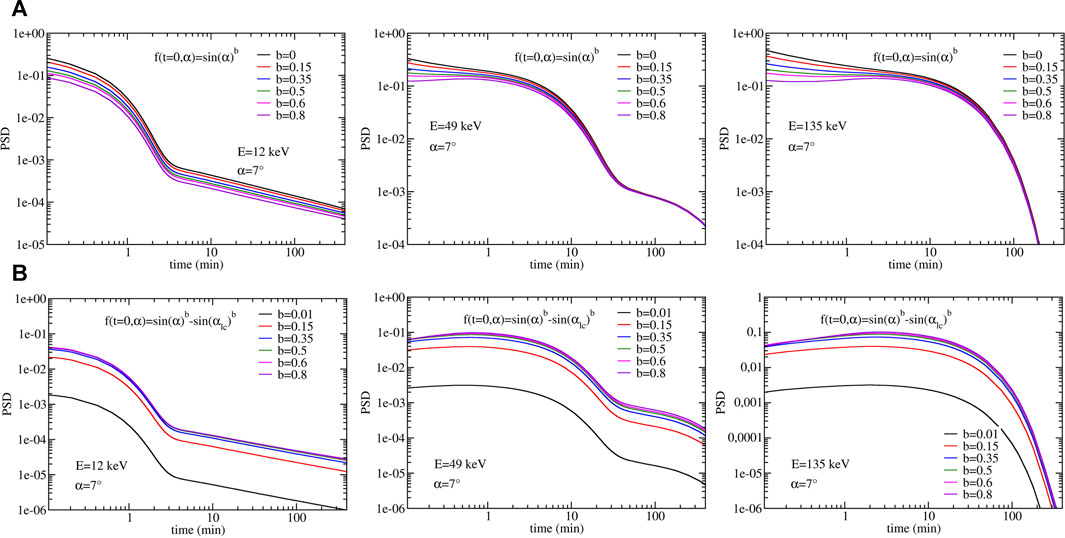
FIGURE 7. Phase space density versus time for different initial conditions. Initial conditions without (A) and with (B) regularization at the loss cone for E = 12, 49, and 135 keV. Within each plot, the initial pitch angle distribution varies with a power b ranging from b ∼ 0 (for which it tends toward f(t = 0) = 1) to b ∼ 1 for which f(t = 0) = sin(α). For certain energies and b(E) power, the initial condition induces a growth of the PSD prior to a decaying phase. The decay itself presents various phases with different slopes. Changes of slope indicate the steady state has not been reached.
The temporary growth of the PSD can be best analyzed and understood looking at Figure 8 in which we see a temporary growth happening for times below 5 min at 135 keV for equatorial pitch angle between ∼12 and ∼40°. The growth is due to the diffusion coefficient whose maximum (first cyclotron resonance) is located above 40° for 135 keV (cf. Figure 5). That diffusion turns out to be faster than the diffusion of the lower pitch angles below 40°and outside the loss cone vicinity region. High pitch angle electrons (40°–75°) thus diffuse faster and fill out lower pitch angles (∼12°–40°) causing the flux at low pitch angles to rise progressively during the first 3–5 min. That type of diffusion explains the various growths of PSD we see happening in time in Figure 7. Comparison of Figure 8 with Figure 7 also shows that the growth cannot happen at ∼7° for this energy and initial condition for which the absence of regularization in this example increases the gradient at the loss cone and favors the loss.
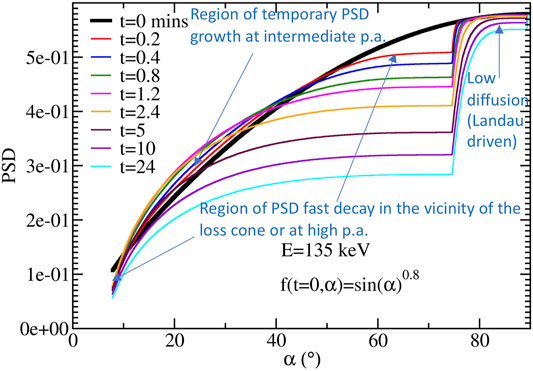
FIGURE 8. Phase space density of 135 keV electrons versus pitch angle for different times (in min) with four pitch angle regions of different dynamics that are indicated with arrows.
Figure 9 shows the evolution of the PSD using the specific energy-dependent b(E) observed by RBSP-B. In addition, we plot in Figure 10 the respective instantaneous growth (τ > 0) and loss rates (τ < 0), previously discussed. We define these rates as 1/τ = |Δf(t)/Δt| in units of hours. The considerable variation of τ with time (including a change of sign) shows that steady state, which defines the general electron lifetime (Lyons et al., 1972), is not reached within the first 100 min for most of the energies below 200 keV. At 74 keV, we see, for instance, a fast loss rate of ∼12 min persisting during ∼30 min, which signifies that the flux decreases by a factor e1 every 12 min during 30 min, i.e. a factor of e(30/12) = 12 after 30 min. The constant loss rate during that time is controlled by the largest gradients, which flatten as diffusion occurs. After 30 min, the loss rate of 74 keV starts to increase and reaches a plateau value at ∼80 min, which is the steady state value. This is in agreement with the theoretical lifetime from direct steady state computation for 74 keV electron that is 90 min for this problem. Therefore, during the first 30 min that followed the growth phase, the loss is 7.5 times faster than the lifetime would predict. After 100 min, the 49 and 74 keV electron flux are reduced by two orders of magnitude and the 100–200 keV electron flux is reduced by ∼1 order of magnitude. The initial electron energy distribution observed by RBSP is exponential and also strongly weighted towards lower energies (Figure 4), thus the precipitation observed by BARREL was also dominated by these energies.
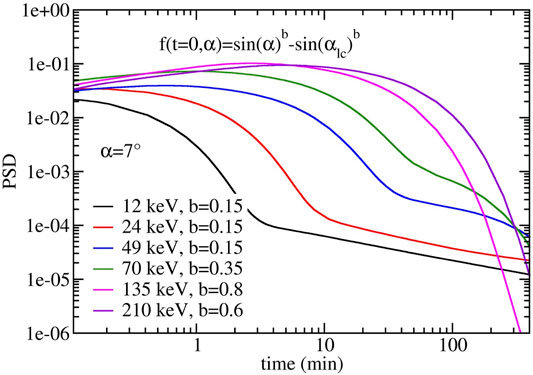
FIGURE 9. Predicted phase-space density at the loss cone edge (α = 7.95°) for a range of energies (E = 12, 24, 49, 70, 135, 210 keV). PSD growth can occur during the first ∼10 min after which the PSD starts decaying abruptly.
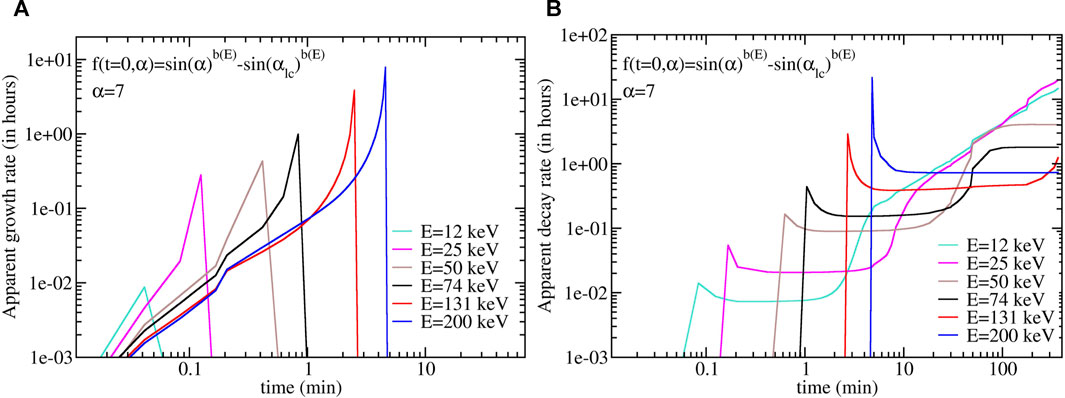
FIGURE 10. Evolution of the instantaneous growth (τ > 0) (A) and decay (τ < 0) (B) timescales, defined as 1/τ(t) = − Δf(t)/Δt, for pitch angle in the vicinity of the loss cone. The growth exists during the five first minutes and is entirely due to the initial condition, favored by the absence of an abrupt gradient at the loss cone, which allows the low pitch angle population to be populated from higher pitch angle electrons diffusing toward the loss cone.
An event-based study was conducted to investigate wave-particle interactions in the radiation belts. A fortuitous magnetic conjunction between the RBSP spacecraft and BARREL balloon payload 3 A provided a rare opportunity to study pitch-angle scattering by plume whistler-mode hiss waves. A quasi-linear pitch angle diffusion model was developed using wave and plasma parameters observed by RBSP as they passed through a stable region of dense cold plasma (n ∼80 cm−3) near L = 6. The model results show that interaction with the plume hiss waves leads to rapid loss of electrons over the same energy range observed by BARREL. Moreover, a significant decrease in the trapped electron flux can occur within 2 h for electrons of pitch angle up to 70° for E in [50, 100] keV.
We also examined the effects of the initial pitch-angle distribution that is assumed when evolving the phase space density. Many previous studies assume a completely empty initial loss cone distribution which leads to an artificially rapid loss rate due to the very steep gradient at the loss cone. Regularization of the loss cone distribution reduces this effect and also reveals how diffusion from larger pitch angles can actually cause an initial increase in flux near the loss cone. This effect is very sensitive to the initial pitch angle distribution assumed for a given energy. These results illustrate the importance of modeling the dynamic evolution of the PSD; the assumption of steady-state loss lifetimes is not accurate for event-based studies such as this one, since the event duration is comparable to the time to reach a steady state. We incorporated the observed pitch angle distribution into the dynamic model of PSD. The present study did not include the effects of the energy-dependent drift time for electrons, rather examined the evolution of the PSD as a function of total interaction time with the waves. The lowest energy (∼10 keV) electrons spend ∼ 40 min within the wave region (the plume) while higher energy (∼100 keV) electrons drift across the plume more quickly and may encounter the plume several times as they drift around Earth. In order to more accurately model the energy spectrum observed by BARREL, these effects must be included. The development of the model presented here will allow for such future work.
Recent work from the Van Allen Probes mission has revealed the prevalence of whistler-mode hiss waves in plasmaspheric plumes, and several studies have suggested that plume hiss waves could lead to strong loss of electrons. The event examined here occurred during a substorm injection of electrons into the radiation belts as observed by the RBSP MagEIS instruments. Thus it was not possible to separate the effects of acceleration and loss in order to quantify the overall impact of this plume on the radiation belts. However, the loss rate indicated by this study suggests that scattering by plume whistler-mode hiss waves, which is currently not included in radiation belt models, could be an important loss mechanism, particularly for radiation belt seed electrons. In particular, the plume investigated in this study was stable and persisted for several RBSP orbits. Electrons gradient-curvature drift around the earth many times per day and thus experience multiple encounters with such high-density plumes and the hiss waves they support. Future work should investigate the overall impact of plumes as a loss mechanism for radiation belt electrons and the seed particles that generate them.
Publicly available datasets were analyzed in this study. This data can be found here: https://cdaweb.gsfc.nasa.gov/pub/data/barrel/, https://emfisis.physics.uiowa.edu/Flight/, and https://rbsp-ect.newmexicoconsortium.org/science/DataDirectories.php.
RM and J-FR together developed the study concept. RM carried out the basic data analysis and produced figures from BARREL and Van Allen Probes to characterize the observations. OS provided further analysis of the Van Allen Probes wave data to obtain wave parameters used in the modeling. WK processed EMFISIS data to provide cold plasma density. J-FR developed the quasi-linear diffusion model and produced the model result figures. RM and J-FR together wrote the first draft of the manuscript. All authors contributed to manuscript revision, read, and approved the submitted version.
RM is supported by Dartmouth College through the Margaret Anne and Edward Leede ’49 Distinguished Professorship. OS acknowledges support from the LTAUSA17070 Inter-Excellence project and from the European Union’s Horizon 2020 research and innovation programme under grant agreement No 870437. WK receives funding from JHU/APL contract 921647 under NASA prime contract NAS5-0107.
The authors declare that the research was conducted in the absence of any commercial or financial relationships that could be construed as a potential conflict of interest.
All claims expressed in this article are solely those of the authors and do not necessarily represent those of their affiliated organizations, or those of the publisher, the editors and the reviewers. Any product that may be evaluated in this article, or claim that may be made by its manufacturer, is not guaranteed or endorsed by the publisher.
The authors thank the International Space Sciences Institute (ISSI) and the participants in a 2020 ISSI workshop for the project “Radiation belts physics”. We acknowledge the BARREL, and RBSP EMFISIS and ECT teams for use of their data.
Albert, J. M. (2008). Efficient Approximations of Quasi-Linear Diffusion Coefficients in the Radiation Belts. J. Geophy. Res., 113, A06208. doi:10.1029/2007ja012936
Albert, J. M. (2005). Evaluation of Quasi-Linear Diffusion Coefficients for Whistler Mode Waves in a Plasma with Arbitrary Density Ratio. J. Geophy. Res. 110, A03218. doi:10.1029/2004ja010844
Albert, J. M. (1994). Quasi-linear Pitch Angle Diffusion Coefficients. Retaining high harmonics 99, 23741. doi:10.1029/94ja02345
Blake, J. B., Carranza, P. A., Claudepierre, S. G., Clemmons, J. H., Crain, W. R., Dotan, Y., et al. (2013). The Magnetic Electron Ion Spectrometer (Mageis) Instruments Aboard the Radiation belt Storm Probes (Rbsp) Spacecraft. Space Sci. Rev. 179, 383–421. doi:10.1007/s11214-013-9991-8
Goldstein, J. (2004). Simultaneous Remote Sensing and In Situ Observations of Plasmaspheric Drainage Plumes. J. Geophys. Res. 109. doi:10.1029/2003ja010281
Grebowsky, J. M. (1970). Model Study of Plasmapause Motion. J. Geophys. Res. 75, 4329–4333. doi:10.1029/ja075i022p04329
Kletzing, C. A., Kurth, W. S., Acuna, M., MacDowall, R. J., Torbert, R. B., Averkamp, T., et al. (2013). The Electric and Magnetic Field Instrument Suite and Integrated Science (Emfisis) on Rbsp. Space Sci. Rev. 179, 127–181. doi:10.1007/s11214-013-9993-6
Kurth, W. S., Pascuale, S. D., Faden, J. B., Kletzing, C. A., Hospodarsky, G. B., Thaller, S., et al. (2015). Electron Densities Inferred from Plasma Wave Spectra Obtained by the Waves Instrument on Van allen Probes. J. Geophys. Res. Space Phys. 120, 904–914. doi:10.1002/2014ja020857
Lemaire, J. (2000). The Formation Plasmaspheric Tails. Phys. Chem. Earth, C: Solar, Terrestrial Planet. Sci. 25, 9–17. doi:10.1016/s1464-1917(99)00026-4
Li, W., Shen, X.-C., Ma, Q., Capannolo, L., Shi, R., Redmon, R. J., et al. (2019). Quantification of Energetic Electron Precipitation Driven by Plume Whistler Mode Waves, Plasmaspheric Hiss, and Exohiss. Geophys. Res. Lett. 46, 3615–3624. doi:10.1029/2019gl082095
Li, W., Thorne, R. M., Bortnik, J., Reeves, G. D., Kletzing, C. A., Kurth, W. S., et al. (2013a). An Unusual Enhancement of Low-Frequency Plasmaspheric Hiss in the Outer Plasmasphere Associated with Substorm-Injected Electrons. Geophys. Res. Lett. 40, 3798–3803. doi:10.1002/grl.50787
Li, Z., Millan, R. M., and Hudson, M. K. (2013b). Simulation of the Energy Distribution of Relativistic Electron Precipitation Caused by Quasi-Linear Interactions with Emic Waves. J. Geophys. Res. Space Phys. 118, 7576–7583. doi:10.1002/2013JA019163
Loridan, V., Ripoll, J.-F., Tu, W., and Cunningham, G. S. (2019). On the Use of Different Magnetic Field Models for Simulating the Dynamics of the Outer Radiation belt Electrons during the October 1990. storm 124, 6453–6486. doi:10.1029/2018ja026392
Lyons, L. R., and Thorne, R. M. (1973). Equilibrium Structure of Radiation belt Electrons. J. Geophys. Res. 78, 2142–2149. doi:10.1029/ja078i013p02142
Lyons, L. R., Thorne, R. M., and Kennel, C. F. (1972). Pitch-angle Diffusion of Radiation belt Electrons within the Plasmasphere. J. Geophys. Res. 77, 3455–3474. doi:10.1029/JA077i019p03455
Malaspina, D. M., Jaynes, A. N., Boulé, C., Bortnik, J., Thaller, S. A., Ergun, R. E., et al. (2016). The Distribution of Plasmaspheric Hiss Wave Power with Respect to Plasmapause Location. Geophys. Res. Lett. 43, 7878–7886. doi:10.1002/2016GL069982
Malaspina, D. M., Jaynes, A. N., Hospodarsky, G., Bortnik, J., Ergun, R. E., and Wygant, J. (2017). Statistical Properties of Low-Frequency Plasmaspheric Hiss. J. Geophys. Res. Space Phys. 122, 8340–8352. doi:10.1002/2017JA024328
Malaspina, D. M., Ripoll, J.-F., Chu, X., Hospodarsky, G., and Wygant, J. (2018). Variation in Plasmaspheric Hiss Wave Power with Plasma Density. Geophys. Res. Lett. 45, 9417–9426. doi:10.1029/2018GL078564
Mauk, B. H., Fox, N. J., Kanekal, S. G., Kessel, R. L., Sibeck, D. G., and Ukhorskiy, A. (2013). Science Objectives and Rationale for the Radiation belt Storm Probes mission. Space Sci. Rev. 179, 3–27. doi:10.1007/s11214-012-9908-y
Meredith, N. P., Horne, R. B., Glauert, S. A., and Anderson, R. R. (2007). Slot Region Electron Loss Timescales Due to Plasmaspheric Hiss and Lightning-Generated Whistlers, 112. doi:10.1029/2007ja012413
Millan, R. M., McCarthy, M. P., Sample, J. G., Smith, D., Thompson, L. D., McGaw, D. G., et al. (2013). The Balloon Array for Rbsp Relativistic Electron Losses (Barrel). Space Sci. Rev 179, 503–530. doi:10.1007/s11214-013-9971-z
Millan, R. M., and Thorne, R. M. (2007). Review of Radiation belt Relativistic Electron Losses. J. Atmos. Solar-Terrestrial Phys. 69, 362–377. doi:10.1016/j.jastp.2006.06.019
Pierrard, V., Ripoll, J.-F., Cunningham, G., Botek, E., Santolik, O., Thaller, S., et al. (2021). Observations and Simulations of Dropout Events and Flux Decays in October 2013: Comparing Meo Equatorial with leo Polar Orbit. J. Geophys. Res. Space Phys. 126, e2020JA028850. doi:10.1029/2020JA028850
Réveillé, T., Bertrand, P., Ghizzo, A., Simonet, F., and Baussart, N. (200118894). Dynamic Evolution of Relativistic Electrons in the Radiation Belts, 106, 18883. doi:10.1029/2000ja900177
Ripoll, J.-F., Claudepierre, S. G., Ukhorskiy, A. Y., Colpitts, C., Li, X., Fennell, J. F., et al. (2020a). Particle Dynamics in the Earth’s Radiation Belts: Review of Current Research and Open Questions. J. Geophys. Res. Space Phys. 125, e2019JA026735. doi:10.1029/2019JA026735
Ripoll, J.-F., Denton, M., Hartley, D., Reeves, G., Malaspina, D., Cunningham, G., et al. (2020b). Scattering by Whistler-Mode Waves during a Quiet Period Perturbed by Substorm Activity. J. Atmos. Solar-Terrestrial Phys. 215, 105471. doi:10.1016/j.jastp.2020.105471
Ripoll, J.-F., Denton, M., Loridan, V., Santolík, O., Malaspina, D., Hartley, D. P., et al. (2020c). How Whistler Mode Hiss Waves and the Plasmasphere Drive the Quiet Decay of Radiation Belts Electrons Following a Geomagnetic Storm, 1623. doi:10.1088/1742-6596/1623/1/012005
Ripoll, J.-F., Loridan, V., Denton, M. H., Cunningham, G., Reeves, G., Santolik, O., et al. (2019). Observations and Fokker-Planck Simulations of the L-Shell, Energy, and Pitch Angle Structure of Earth’s Electron Radiation Belts during Quiet Times. J. Geophys. Res. Space Phys. 124, 1125–1142. doi:10.1029/2018JA026111
Ripoll, J.-F., and Mourenas, D. (2013). “High-energy Electron Diffusion by Resonant Interactions with Whistler Mode Hiss,” in Dynamics of the Earth’s Radiation Belts and Inner Magnetosphere (American Geophysical Union), 281–290. doi:10.1029/2012gm001309
Ripoll, J.-F., Reeves, G. D., Cunningham, G. S., Loridan, V., Denton, M., Santolik, O., et al. (2016). Reproducing the Observed Energy-dependent Structure of Earth’s Electron Radiation Belts during Storm Recovery with an Event-specific Diffusion Model. Geophys. Res. Lett. 43, 5616–5625. doi:10.1002/2016GL068869
Ripoll, J.-F., Santolik, o., Reeves, G., Kurth, W. S., Denton, M. H., Loridan, V., et al. (2017). Effects of Whistler Mode Hiss Waves in March 2013. J. Geophys. Res. Space Phys. 122, 7433—–7462. doi:10.1002/2017JA024139
Sample, J. G., Millan, R. M., and Woodger, L. A. (2020). “Nanosat and Balloon-Based Studies of Radiation belt Loss: Low-Cost Access to Space,” in The Dynamic Loss of Earth’s Radiation Belts (Elsevier), 121–144.
Sandel, B. R., King, R. A., Forrester, W. T., Gallagher, D. L., Broadfoot, A. L., and Curtis, C. C. (2001). Initial Results from the IMAGE Extreme Ultraviolet Imager. Geophys. Res. Lett. 28, 1439–1442. doi:10.1029/2001gl012885
Santolík, O., and Gurnett, D. A. (2002). Propagation of Auroral Hiss at High Altitudes. Geophys. Res. Lett. 29, 119–121. doi:10.1029/2001gl013666
Santolík, O., Parrot, M., Storey, L. R. O., Pickett, J. S., and Gurnett, D. A. (2001). Propagation Analysis of Plasmaspheric Hiss Using Polar PWI Measurements. Geophys. Res. Lett. 28, 1127–1130. doi:10.1029/2000gl012239
Shi, R., Li, W., Ma, Q., Green, A., Kletzing, C. A., Kurth, W. S., et al. (2019). Properties of Whistler Mode Waves in Earth’s Plasmasphere and Plumes. J. Geophys. Res. Space Phys. 124, 1035–1051. doi:10.1029/2018JA026041
Shprits, Y. Y., Subbotin, D. A., Meredith, N. P., and Elkington, S. R. (2008). Review of Modeling of Losses and Sources of Relativistic Electrons in the Outer Radiation belt Ii: Local Acceleration and Loss. J. Atmos. Solar-Terrestrial Phys. 70, 1694–1713. doi:10.1016/j.jastp.2008.06.014
Spasojevic, M., Shprits, Y. Y., and Orlova, K. (2015). Global Empirical Models of Plasmaspheric Hiss Using Van allen Probes. J. Geophys. Res. Space Phys. 120 (10370–10), 383. doi:10.1002/2015JA021803
Thorne, R. M., Li, W., Ni, B., Ma, Q., Bortnik, J., Chen, L., et al. (2013). Rapid Local Acceleration of Relativistic Radiation-belt Electrons by Magnetospheric Chorus. Nature 504, 411–414. doi:10.1038/nature12889
Thorne, R. M. (2010). Radiation belt Dynamics: The Importance of Wave-Particle Interactions. Geophys. Res. Lett. 37, 22107.
Thorne, R. M., Smith, E. J., Burton, R. K., and Holzer, R. E. (1973). Plasmaspheric Hiss. J. Geophys. Res. 78, 1581–1596. doi:10.1029/ja078i010p01581
Tu, W., Cunningham, G. S., Chen, Y., Morley, S. K., Reeves, G. D., Blake, J. B., et al. (2014). Event-specific Chorus Wave and Electron Seed Population Models in Dream3d Using the Van allen Probes. Geophys. Res. Lett. 41, 1359–1366. doi:10.1002/2013GL058819
Woodger, L. A., Halford, A. J., Millan, R. M., McCarthy, M. P., Smith, D. M., Bowers, G. S., et al. (2015). A Summary of the Barrel Campaigns: Technique for Studying Electron Precipitation. J. Geophys. Res. Space Phys. 120, 4922–4935. doi:10.1002/2014JA020874
Zhang, W., Fu, S., Gu, X., Ni, B., Xiang, Z., Summers, D., et al. (2018). Electron Scattering by Plasmaspheric Hiss in a Nightside Plume. Geophys. Res. Lett. 45, 4618–4627. doi:10.1029/2018GL077212
Keywords: radiation belt, wave-particle interaction, electron precipitation, plasmaspheric plume, whistler-mode hiss/chorus, quasi-linear diffusion
Citation: Millan RM, Ripoll J-F, Santolík O and Kurth WS (2021) Early-Time Non-Equilibrium Pitch Angle Diffusion of Electrons by Whistler-Mode Hiss in a Plasmaspheric Plume Associated with BARREL Precipitation. Front. Astron. Space Sci. 8:776992. doi: 10.3389/fspas.2021.776992
Received: 14 September 2021; Accepted: 28 October 2021;
Published: 02 December 2021.
Edited by:
Olga V. Khabarova, Institute of Terrestrial Magnetism Ionosphere and Radio Wave Propagation (RAS), RussiaReviewed by:
Kyung-Chan Kim, Chungbuk National University, South KoreaCopyright © 2021 Millan, Ripoll, Santolík and Kurth. This is an open-access article distributed under the terms of the Creative Commons Attribution License (CC BY). The use, distribution or reproduction in other forums is permitted, provided the original author(s) and the copyright owner(s) are credited and that the original publication in this journal is cited, in accordance with accepted academic practice. No use, distribution or reproduction is permitted which does not comply with these terms.
*Correspondence: R. M. Millan , Um9ieW4uTWlsbGFuQGRhcnRtb3V0aC5lZHU=
Disclaimer: All claims expressed in this article are solely those of the authors and do not necessarily represent those of their affiliated organizations, or those of the publisher, the editors and the reviewers. Any product that may be evaluated in this article or claim that may be made by its manufacturer is not guaranteed or endorsed by the publisher.
Research integrity at Frontiers

Learn more about the work of our research integrity team to safeguard the quality of each article we publish.