 Stefan Eriksson
 Xuanye Ma
 James L. Burch
 Antonius Otto4
 Scot Elkington
 Peter A. Delamere
- 1Laboratory for Atmospheric and Space Physics, University of Colorado, Boulder, CO, United States
- 2Department of Physical Sciences, Embry-Riddle Aeronautical University, Daytona Beach, FL, United States
- 3Department of Physics and Astronomy, University of Texas, San Antonio, TX, United States
- 4Department of Physics, Geophysical Institute, University of Alaska, Fairbanks, AK, United States
The MMS satellites encountered a Kelvin-Helmholtz instability (KHI) period in the early non-linear phase at the post-noon flank magnetopause on 8 Sep 2015. The adjacent magnetosheath was characterized by a pre-dominantly northward Bz > 0 magnetic field with weakly positive in-plane components in a GSM coordinate system. Ion velocity distribution functions indicate at least 17 KH vortex intervals with two typically D-shaped ion beam distributions, commonly associated with reconnection exhausts, that stream in both directions along a mostly northward magnetic field at 350–775 km/s with a median 525 km/s ion beam speed. The counter-streaming ion beams are superposed on a core population of slowly drifting magnetosheath ions with a field-aligned 50–200 km/s speed. Each interval lasted no more than 5.25 s with a median duration of 1.95 s corresponding to in-plane spatial scales 3 < ΔS < 22 di assuming a constant 1 di = 61 km ion inertial scale and a tailward VKH∼258 km/s KH vortex propagation speed along the MMS trajectory. The counter-streaming ions are predominantly observed in the warm KH vortex region between the cold magnetosheath proper and the hot isotropic ion temperature of a low-latitude boundary layer as the MMS constellation traverses a KH vortex. The in-plane spatial scales and the locations of the observed counter-streaming ion beams generally agree with the predictions of twice-reconnected magnetic fields at two mid-latitude reconnection (MLR) regions in a two-fluid three-dimensional numerical simulation previously reported for this KH event. MMS typically recorded a higher phase space density of the fast parallel ion beam that we associate with a tailward reconnection exhaust from the southern MLR (SMLR) and a lower phase space density of the fast anti-parallel ion beam that we associate with a tailward reconnection exhaust from the northern MLR (NMLR) of similar speed. This is either consistent with MMS being closer to the SMLR region than the NMLR region, or that the KHI conditions may have favored reconnection in the SMLR region for the observed in-plane magnetosheath magnetic field as predicted by a two-fluid three-dimensional numerical simulation.
Introduction
A fast magnetosheath flow around the Earth’s magnetosphere can trigger a Kelvin-Helmholtz (KH) instability (Chandrasekhar, 1961; Miura and Pritchett, 1982) when the stabilizing interplanetary magnetic field (IMF) is mostly perpendicular to the shear flow across the magnetopause surface (Kokubun et al., 1994). The most KH unstable regions thus tend to occur in the equatorial plane of the flank magnetopause (Farrugia et al., 1998; Foullon et al., 2008; Vernisse et al., 2020) during northward IMF conditions that typically results in well-developed KH waves of the magnetopause surface as observed by in-situ spacecraft [e.g., (Chen and Kivelson, 1993; Fairfield et al., 2000; Hasegawa et al., 2004; Hasegawa et al., 2006; Nykyri et al., 2006; Nishino et al., 2007; Eriksson et al., 2016a)]. The KH wave amplitude grows as the shear-flow disturbance propagates from a dayside source region along the flank magnetopause in a general magnetosheath flow direction. This wave amplitude growth eventually causes the magnetopause KH wave to roll up on itself in a non-linear phase of the KH evolution that typically occurs near the dawn-dusk terminator and beyond (Otto and Fairfield, 2000; Nakamura et al., 2013).
Developing KH waves support the formation of thin current sheets as the magnetic field on the two sides of the magnetopause evolves with the KH plasma vortex motion. Two-dimensional numerical simulations (Otto and Fairfield, 2000; Nykyri and Otto, 2001; Nakamura et al., 2008) suggest that magnetic field reconnection (Sonnerup, 1979; Schindler et al., 1988; Birn et al., 2001) may proceed at such current sheets inside KH vortices, involving a small in-plane component of a predominantly northward directed magnetic field in the magnetosheath that folds up on itself. Low-shear magnetic reconnection may also proceed along the equatorial spine region of the compressed magnetopause current sheet (CS) that connects a pair of KH vortices (Pu et al., 1990; Knoll and Chacón, 2002; Hasegawa et al., 2009; Nakamura et al., 2013; Eriksson et al., 2016a; Eriksson et al., 2016b; Vernisse et al., 2016). Reconnection in the spine region creates new open magnetic fields as it merges a small in-plane component of the magnetic field in the magnetosheath with an anti-parallel component of the in-plane magnetic field in the magnetosphere consistent with electron observations (Vernisse et al., 2016).
Otto (2008) first proposed that a KH vortex motion of the equatorial plane magnetic field will support magnetic reconnection off the equator to relax twisted magnetic fields in a northern mid-latitude region and a southern mid-latitude region of the three-dimensional KH vortex. The mid-latitude reconnection (MLR) concept was further refined in Faganello and Califano (2017) to suggest that it typically involves a shearing of KH-vortex associated magnetic fields along the direction of KH propagation at the two off-equator magnetopause locations rather than a well-developed vortex motion also in the mid-latitude region. The mid-latitude shearing results from a closed magnetic field earthward of the magnetopause being pulled tailward in the equatorial plane by the KH vortices and an open magnetic field in the adjacent magnetosheath being slowed down in the equatorial plane as it gets entrained in a KH vortex flow pattern. Faganello et al. (2014) explored the proposed off-equatorial reconnection process in a three-dimensional (3-D) Hall-MHD numerical model and suggested that reconnection proceeds nearly simultaneously off the equator in the northern and southern mid-latitude regions of the KH vortex to form new, closed field lines consisting of high-latitude magnetosphere field-line segments off the equator (north and south) and an embedded magnetosheath field-line segment between the two MLR regions. Faganello et al. (2014) also reported a short-duration interval of 100–500 eV counter-streaming electrons as observed by the THEMIS-C satellite at 0916:20 UT on 15 April 2008 in the equatorial low-latitude boundary layer (LLBL) region (Mitchell et al., 1987) of a KH wave, and beyond the dusk flank terminator at (x,y,z)GSM = (−7.1, 18.0, −1.9) RE. Faganello et al. (2014) argued that the short-duration, counter-streaming electrons may be interpreted as accelerated magnetosheath electrons along recently closed field lines at two MLR regions.
Ma et al. (2017) analyzed a 3-D MHD simulation of the KH instability (KHI) for northward IMF conditions to demonstrate that non-linear, rolled-up KH waves may result in a significant amount of double-reconnected closed magnetic flux and a highly efficient plasma transport mechanism across the flank magnetopause. However, Ma et al. (2017) also predicted that a finite in-plane component of the magnetic field along the XYGSM-shear flow direction should cause an important north-south asymmetry with a lower probability of forming newly closed magnetic flux in the KH vortex due to double mid-latitude reconnection (DMLR). In other words, an in-plane magnetic field component is more likely to favor an off-equator magnetic reconnection process in only one mid-latitude region (north or south) to form new, open magnetic flux within the KH vortex. Fadanelli et al. (2018) and Sisti et al. (2019) explored this asymmetric MLR concept that we associate with KH vortices numerically using a two-fluid 3-D simulation, and discussed the importance of “once-reconnected” open field lines and “twice-reconnected” closed field lines due to MLR, and the predicted location of the more active MLR region relative the most KH-unstable location on the flank magnetopause. Sisti et al. (2019) simulated the 8 Sept 2015 KH event observed by MMS to predict a more active MLR region in the southern hemisphere. Indirect evidence of this single MLR process, as acquired by a satellite in the equatorial region, would consist of accelerated electrons and ions in only one direction along the magnetic field, and a loss of particles streaming in the opposite direction of this open magnetic field. Vernisse et al. (2016) confirmed this signature in the electron observations obtained by MMS on 8 Sept 2015.
There are some early reports of beams in ion velocity distribution functions (VDFs) as obtained by the Cluster and the Geotail satellites in a non-linear phase of the KHI near the flank magnetopause terminator and beyond. Geotail recorded 12-s cadence ion observations during a KH period in a non-linear phase (Nishino et al., 2007) well beyond the dusk flank at (x,y,z)GSM = (−14.9, 19.2, 2.9) RE in close proximity to CSs characterized by changes in the magnetic field direction. It was concluded (Nishino et al., 2007) that the ion beams were in agreement with vortex-induced magnetic reconnection (VIR) in the equatorial plane (Otto and Fairfield, 2000; Nakamura et al., 2006; Nakamura et al., 2013) inside a KH-vortical structure rather than associated with a source at one or two MLR regions.
The Cluster satellites recorded a dawnside KH event at (x,y,z)GSM = (−9.1, −16.5, 4.3) RE on 3 Jul 2001 (Nykyri et al., 2006) including a well-resolved single ion beam with an anti-parallel VB = −500 km/s speed in a northward Bz > 0 magnetic field with a sunward Bx > 0 component. The anti-parallel ion beam was superposed on a magnetosheath ion population in an ion VDF that the Cluster-1 satellite observed at 0547:55 UT as it transitioned from a cold and high-density magnetosheath into a warm KH-vortex region. That single anti-parallel ion beam could be associated with one northern MLR region considering the Cluster-1 location at ZGSM = 4.3 RE and the direction of the local magnetic field rather than direct evidence of magnetic reconnection associated with KH-induced CSs in the equatorial plane of the KH vortex.
“Multiple field-aligned ion populations” were reported in 4-s cadence Cluster satellite observations (Bavassano Cattaneo et al., 2010) throughout the rolled-up vortex regions of a non-linear KHI on 25 Nov 2001 near the dusk terminator at (x,y,z)GSM = (−4.5, 16.8, 3.8) RE including an apparent single anti-parallel ion beam at 0223:11 UT. In the absence of local magnetic reconnection exhausts in the equatorial plane of the Cluster satellites, and a presence of field-aligned electrons streaming in both directions along the northward magnetic field, Bavassano Cattaneo et al. (2010) proposed a source near a southern cusp, high-latitude reconnection (HLR) region. However, it is possible that the ion VDF collected by the Cluster satellite at 0223:11 UT, and the discussion in Bavassano Cattaneo et al. (2010), may support a presence of an anti-parallel ion beam associated with a “once-reconnected” MLR process to the north of Cluster in this northward-directed magnetic field rather than a single, southern hemisphere HLR region.
Here we report a signature of two typically D-shaped (Cowley, 1982) counter-streaming ion beams as recorded at the fast 150-ms cadence of the MMS ion observations (Burch et al., 2015; Burch et al., 2016; Pollock et al., 2016) in a well-documented KHI event on the post-noon flank magnetopause on 8 Sept 2015 [e.g., (Eriksson et al., 2016a; Eriksson et al., 2016b; Li et al., 2016; Stawarz et al., 2016; Vernisse et al., 2016; Wilder et al., 2016; Nakamura et al., 2017; Sorriso-Valvo et al., 2019; Vernisse et al., 2020)] as MMS moved from (x,y,z)GSM = (5.1, 7.2, −4.4) RE at 1007:30 UT to (x,y,z)GSM = (4.8, 8.1, −5.1) RE at 1123:30 UT. The phase space density (PSD) of the two ion beams is typically two orders of magnitude lower than the PSD of a slowly drifting ion core distribution of magnetosheath ions measured along the same magnetic field. The well-resolved counter-streaming ion beams are not observed throughout the KH vortex region. They are rather observed in short <6 s bursts in the warm leading edge of the post-noon KH vortices, and typically by all four MMS satellites, far from the intense CSs at the trailing edges of the KH waves associated with vortex-induced reconnection of the spine region (Eriksson et al., 2016a; Eriksson et al., 2016b).
The paper is organized as follows. Section 2 presents an overview of the KH wave observations by MMS in GSM coordinates. Section 3 presents detailed ion observations from the Fast Plasma Instrument (FPI) instrument (Pollock et al., 2016) for a few example periods as ion pitch-angle (PA) information in the 2–3 keV energy range, 2-D ion VDFs in VB-VBxV space, and as 1-D cuts of the ion VDFs along the field-aligned VB direction. Section 4 provides a discussion of the MMS observations and their comparison with numerical simulation predictions during the KHI evolution. Finally, section 5 provides a summary and conclusions on the proposed origin of the two counter-streaming ion beams that MMS observed within the warm leading edges of this KHI period in its early non-linear stage (Nakamura et al., 2017).
MMS Overview Observations of Kelvin-Helmholtz Waves on 8 Sept 2015
NASA launched the four identical MMS satellites into a 12 RE apogee elliptical orbit near the equatorial plane on 12 Mar 2015. In this study, we examine the MMS burst mode observations of the KHI waves on 8 Sept 2015 as recorded 10.1 RE from Earth in the 15.7 magnetic local time sector with a particular focus on the 150-ms ion measurements of the Dual Ion Spectrometer (DIS) top hat electrostatic analyzer (ESA) and the 30-ms electron measurements of the Dual Electron Spectrometer (DES) of the FPI suite of instruments (Pollock et al., 2016). We also take advantage of magnetic field observations of the fluxgate magnetometer instrument (Russell et al., 2016) at 7.8 ms cadence, and parallel electric field observations measured at 8192 Hz cadence by the Axial Double Probe (ADP) instrument (Ergun et al., 2016).
Figure 1 shows an overview of the MMS measurements, sampled in fast survey mode from 0910 UT to 1150 UT with FPI plasma observations recorded at 4.5 s. The continuous interval of burst mode data is indicated by the green horizontal bar above the top panel at 1007:04–1127:34 UT. The omni-directional ion energy-time spectrogram (Figure 1A) and the omni-directional electron energy-time spectrogram (Figure 1B) show how MMS traversed this post-noon magnetopause region from the low-density (N∼2 cm−3, Figure 1C) and high-temperature (TiAVG∼10 keV, Figure 1D) outer magnetosphere, as observed prior to ∼0920 UT, to the high-density and low-temperature magnetosheath that MMS sampled after ∼1128 UT. During the intervening period, MMS recorded an interval with much more variable observations in all the measured quantities as shown in Figure 1. The periodic behavior, which is particularly clear during the burst mode interval, is consistent with a KH instability with a maximum sustained KHI wave growth on the order γ/k > 131 km/s (Eriksson et al., 2016a) between a pre-existing inner LLBL region and the adjacent magnetosheath. A global MHD analysis was performed (Vernisse et al., 2020) to suggest that MMS was very close to a region of maximum KHI wave growth in latitude with similar KHI growth rates as that reported by Eriksson et al. (2016a). The MMS measurements were further proposed to satisfy an early non-linear phase of the KHI (Nakamura et al., 2017; Sisti et al., 2019). The initial period between ∼0920 UT and 1007 UT reflect periodic KH waves of the inner LLBL region, while the 1 h 20 min of MMS burst mode observations rather reflect KH waves of the outer LLBL region with MMS sampling the periodic magnetopause KH surface waves between the outermost LLBL and the adjacent magnetosheath.
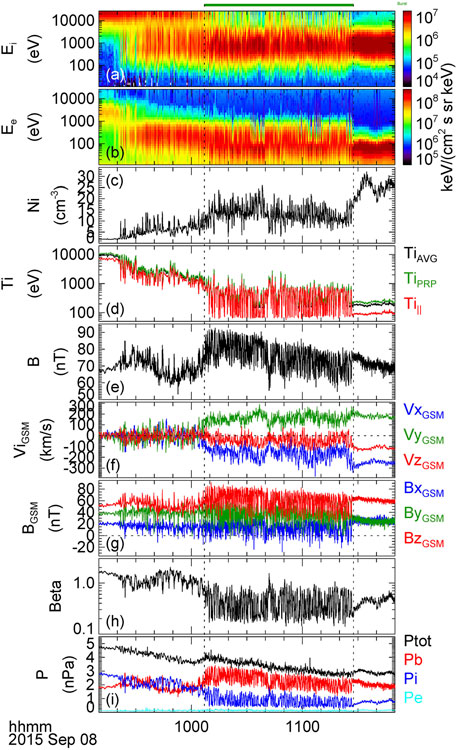
FIGURE 1. MMS-1 observations in fast survey mode from 0910 UT to 1150 UT on 8 Sept 2015: (A) ion omni-directional energy-time spectrogram; (B) electron omni-directional energy-time spectrogram; (C) ion plasma number density; (D) ion temperature; (E) magnetic field strength; (F) ion velocity in the GSM coordinate system; (G) magnetic field GSM components; (H) plasma β; (I) magnetic field pressure (red), ion plasma pressure (blue), electron plasma pressure (cyan) and their sum (black).
MMS Kinetic Observations
We performed a thorough survey of burst-mode ion velocity distribution functions (VDFs) that the MMS satellites obtained on 8 Sept 2015 for distinct evidence of sustained periods of two counter-streaming ion beams during an early non-linear phase of the KH waves on the dusk flank magnetopause (Nakamura et al., 2017) and relatively close in latitude to a region of maximum KHI growth (Vernisse et al., 2020). The study was directly motivated following some tantalizing new evidence of two ion beams in a time averaged ion velocity distribution centered at 1044:54.164 UT as first reported by Vernisse et al. (2016) that we discuss in more detail in section 4, and to explore whether DMLR may actually be active this early in the KH vortex evolution as predicted by Sisti et al. (2019) for this KH event by using a two-fluid 3D numerical simulation.
Ion Beam Observations
Figure 2 displays MMS-1 burst mode observations at 1028:29–1030:34 UT when the MMS satellites were located at (x,y,z)GSM = (5.0, 7.5, −4.6) RE. These data cover two complete KH wave periods consisting of three short intervals in a cold magnetosheath plasma and two longer intervals in a KH vortex region, where MMS typically measured a more isotropic ion temperature (Figure 2F). The magnetosheath plasma is characterized by a very low energy flux of electrons in the 250–500 eV energy range (Figures 2A,B) that corresponds to anti-parallel strahl electrons from the Sun (Feldman et al., 1975; Vernisse et al., 2016). The higher-density (Figure 2E) magnetosheath periods are also characterized by a high ion energy flux below 2 keV with a core ion distribution at 90–110o pitch-angle (Figures 2C,D) and Tiperp > Ti|| (Figure 2F) in agreement with a tailward magnetosheath flow deflected along the dusk flank magnetopause, Vx < 0 and Vy > 0 (Figure 2G), with the ions gyrating about a pre-dominantly northward (Bz > 0) magnetic field with weaker in-plane components generally displaying Bx > 0 and By > 0 (Figure 2H). The trailing edges of the two KH vortex regions are associated with more intense CSs, characterized by significant rotations of the By component. Figure 2I displays the magnitude of the GSM current density vector J = Ne(Vi-Ve), measured by the FPI ion and electron instruments. Here, N is the plasma number density, Vi the ion velocity and Ve the electron velocity. The trailing KH regions support some of the strongest CSs of this ∼2-min interval with J∼1 μA/m2. In fact, one such CS encountered just before 1029:30 UT also supports a local, vortex-induced “type-I” reconnection exhaust (Nakamura et al., 2013) with a measured Vy∼100 km/s flow enhancement in the positive YGSM direction relative the Vy∼200 km/s external flow (Eriksson et al., 2016a; Li et al., 2016; Vernisse et al., 2016). The adjacent magnetosheath does not support many intense CSs, where MMS typically measured J < 0.4 μA/m2. The two KH vortex regions support localized CSs with typical magnitudes 0.5 < J < 1 μA/m2.
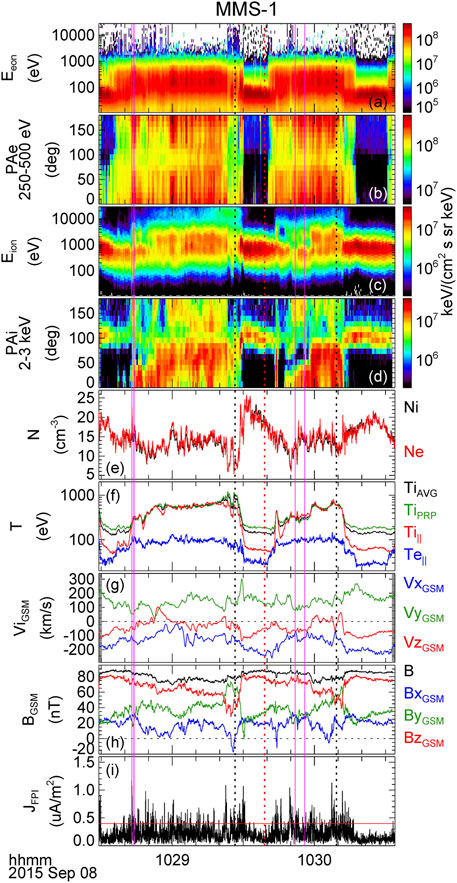
FIGURE 2. MMS-1 observations in burst mode from 1028:29 UT to 1030:34 UT on 8 Sept 2015: (A) electron omni-directional energy-time spectrogram; (B) electron pitch-angle distribution in the 250–500 eV energy range; (C) ion omni-directional energy-time spectrogram; (D) ion pitch-angle distribution in the 2–3 keV energy range; (E) plasma number density for electrons (red) and ions (black); (F) electron parallel temperature (Te||, blue), ion parallel temperature (Ti||, red), ion perpendicular temperature (Tiperp, green), and the ion average temperature TiAVG=(Ti||+2Tiperp)/3; (G) ion velocity in the GSM coordinate system; (H) magnetic field GSM components and their magnitude (black); (I) magnitude of the current density GSM vector as measured by the FPI instruments. Three dotted vertical lines mark the times of 150-ms ion VDFs sampled at 1029:26.500 UT (black), 1029:39.000 UT (red), and 1030:09.299 UT (black). Four solid vertical lines in pink color mark two sustained periods of distinct counter-streaming ion beams in the ion VDFs at 1028:42.950–1028:43.849 UT and 1029:51.849–1029:55.900 UT.
Figure 3 displays three ion VDFs in a plane that consists of a vertical axis along one of the two ion velocity components perpendicular to the magnetic field (VBxV) and a horizontal axis that shows the ion velocity along the magnetic field (VB). MMS-1 sampled the 150-ms ion VDF of Figure 3A in the magnetosheath-proper at 1029:39.084–1029:39.234 UT, which is marked as a red, vertical dotted line between the two KH vortex intervals of Figure 2. The core magnetosheath population shows up as a slow, mostly negative 50–200 km/s drift in a direction opposite the magnetic field direction. The ion VDF thus reflects the fast tailward (Vx < 0) ion flow with a southward (Vz < 0) flow deflection (Figure 2G) in a magnetic field with a positive Bx > 0 component and a stronger Bz > 0 component (Figure 2H) that MMS measured in a southern hemisphere location at ZGSM = −4.6 RE. Figure 3 compares this ion VDF of the magnetosheath proper with two ion VDFs measured by MMS-1 in two LLBL regions, which are marked as the black vertical dotted lines in Figure 2. MMS-1 measured the two ion VDFs just Earthward of the two intense trailing edge CSs of the two tailward-propagating KH vortices with Figure 3B showing the 150-ms ion VDF at 1029:26.599 UT, and Figure 3C showing the ion VDF at 1030:09.450 UT. This side-by-side comparison shows how the LLBL ion velocity distributions are hot and more isotropic as compared with a cold anisotropic magnetosheath ion VDF, which is also reflected in the corresponding 1-D cuts taken along the magnetic field VB direction at VBxV = 0 km/s and shown in Figures 3D–F.
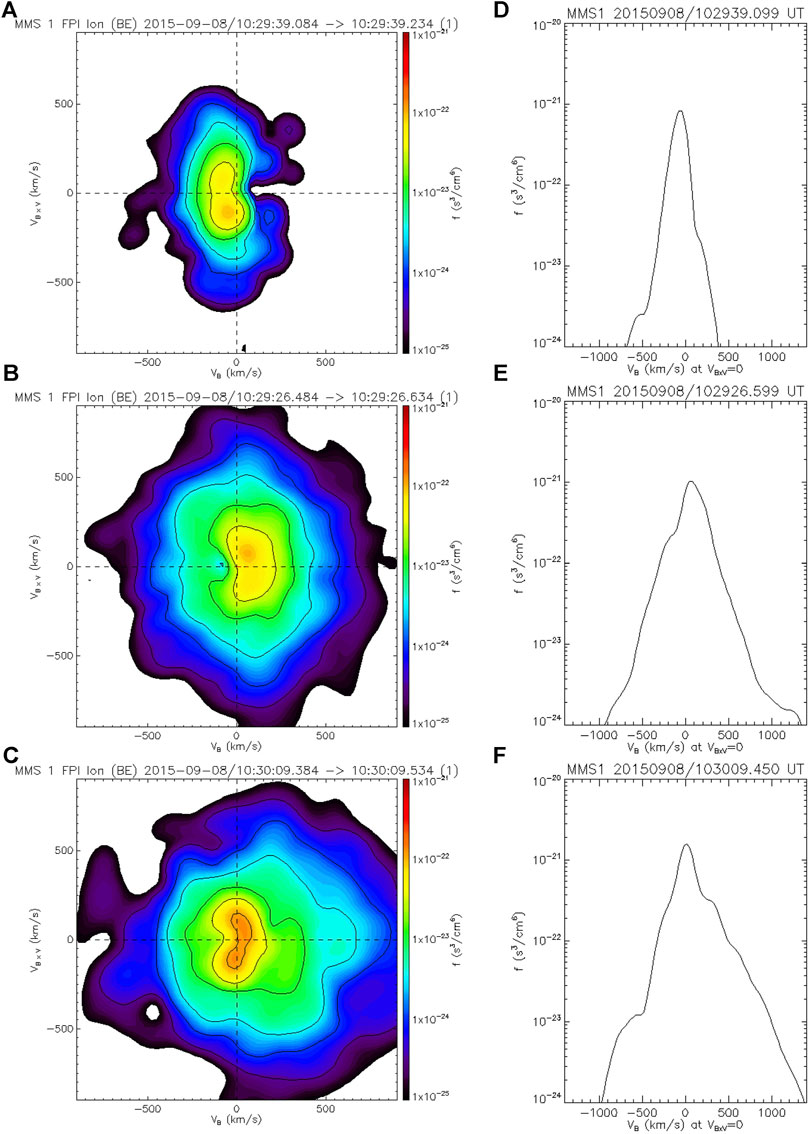
FIGURE 3. (A) MMS-1 ion VDF at 1029:39.099 UT; (B) MMS-1 ion VDF at 1029:26.599 UT; (C) MMS-1 ion VDF at 1030:09.450 UT; (D) 1-D cut of the MMS-1 ion VDF at 1029:39.099 UT; (E) 1-D cut of the MMS-1 ion VDF at 1029:26.599 UT; (F) 1-D cut of the MMS-1 ion VDF at 1030:09.450 UT. The 2-D ion phase space density of the VDFs (A–C) are shown in VBxV vs VB space. The 1-D cuts along VB are taken along VBxV = 0 km/s.
The left-side column of Figure 4 presents the 2-D plane ion VDFs as observed by all four MMS satellites at approximately the same time with MMS-1 recording the ion VDF at 1029:55.284–1029:55.434 UT. This time is embedded within a 4.1-s long interval as displayed in Figure 2 between the two, pink vertical lines at 1029:51.849 UT and 1029:55.900 UT. The corresponding 1-D field-aligned cuts at VBxV = 0 km/s are shown in the right-side column of Figure 4. There are two very distinct ion beams that propagate both parallel and anti-parallel to the local magnetic field at this time. The MMS-1 satellite (Figures 4A,E) measured a parallel D-shaped ion beam with a PSD peak around VB = 550 km/s and a roughly D-shaped anti-parallel ion beam with a PSD peak near VB = −525 km/s. The kinetic energy WK = mpVB2/2 corresponding to protons traveling southward at this fast field-aligned VB speed is WK∼1.4 keV for the anti-parallel ions, and WK∼1.6 keV for the parallel ions traveling northward. The PSD of the two parallel beams is similar, and roughly two orders of magnitude lower than the PSD of the slowly drifting ion core distribution. The MMS-2 satellite (Figures 4B,F) observed two very similar counter-propagating ion beams as MMS-1 along this local magnetic field with a similar PSD and VB magnitude, but obtained in a more southward location with a separation (ΔX,ΔY,ΔZ)GSM=(−43,−85,−119) km from the MMS-1 satellite. The MMS-4 satellite (Figures 4D,H) also observed the two counter-propagating ion beams of similar PSD as MMS-1 and MMS-2, despite a more tailward separation (ΔX,ΔY,ΔZ)GSM = (−178,−24,−42) km from MMS-1. However, MMS-4 measured a positive ion beam with a faster VB = 600 km/s speed (WK∼1.9 keV) and a negative ion beam that peaked at a slower VB = −500 km/s speed (WK∼1.3 keV) as compared with the MMS-1 ion observation. Finally, the MMS-3 satellite (Figures 4C,G) observed a strikingly different ion VDF as compared with the other MMS satellites with a much diminished PSD in velocity phase space, where the other satellites had recorded a distinct anti-parallel ion beam. Moreover, the parallel ion beam displayed the lowest PSD and the fastest VB = 700 km/s (WK∼2.6 keV) at MMS-3 as compared with the other locations in the MMS tetrahedron at this same time. Interestingly, this MMS-3 observation was obtained in a much more northward location (ΔX,ΔY,ΔZ)GSM = (−17,−78,164) km relative MMS-2, and in a more earthward location (ΔX,ΔY,ΔZ)GSM = (−60,−162,45) km from MMS-1.
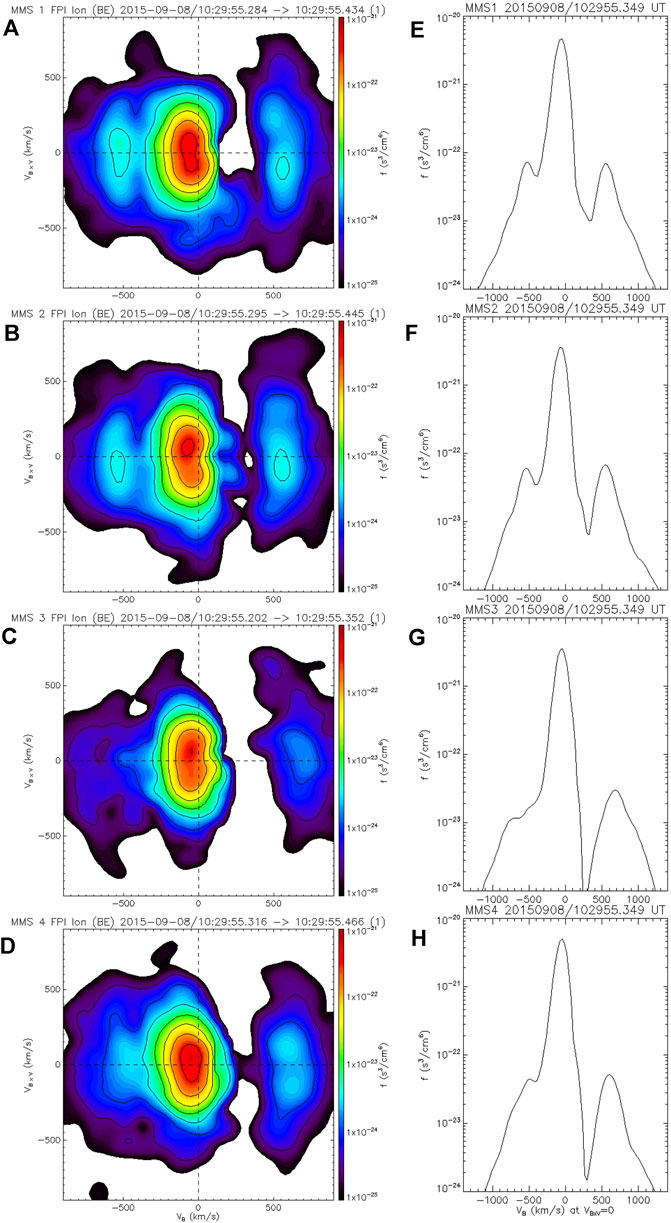
FIGURE 4. Ion velocity distribution functions at 1029:55.349 UT: (A) 2-D ion phase space density at MMS-1; (B) 2-D ion phase space density at MMS-2; (C) 2-D ion phase space density at MMS-3; (D) 2-D ion phase space density at MMS-4; (E) 1-D cut at MMS-1; (F) 1-D cut at MMS-2; (G) 1-D cut at MMS-3; (H) 1-D cut at MMS-4.
The 4.1-s long interval marked in Figure 2 consists of 27 separate MMS-1 ion VDFs that displayed structurally very similar ion distributions as the ones illustrated in Figure 4A with two ion beams streaming up and down the local magnetic field, and superposed on a third, slowly drifting core population typically opposite the magnetic field. Figure 2 shows that the ion VDFs of Figure 4 were sampled well inside the leading edge of one KH vortex as MMS moved from the cold magnetosheath proper into a warmer section of the KH vortex, but before the satellites entered the hot, isotropic ion temperature region of the KH vortex that we associate with the LLBL-proper (Figures 3C,F). A closer examination of the ion VDF observations across the entire MMS tetrahedron through this particular KH vortex shows how MMS-2 measured two counter-propagating ion beams during a continuous ∼4.4 s period at 1029:51.299–1029:55.650 UT, while the MMS-4 satellite observed the two ion beams in two separate intervals; first as a short 0.70 s “burst” (1029:51.900–1029:52.599 UT) and then again as a longer ∼3.6 s period (1029:52.950–1029:56.500 UT). In contrast to the other satellites, the most earthward MMS-3 satellite recorded the two clearly resolved ion beams in three separate “bursts” with durations 0.30 s (1029:51.099–1029:51.400 UT), 0.95 s (1029:52.150–1029:53.099 UT), and 0.80 s (1029:54.099–1029:54.900 UT).
Figure 5 shows all four MMS satellite observations of parallel ion temperature and ion velocity through this KH-vortex encounter with Figure 5A showing the MMS-1 omni-directional ion energy-time spectrogram for reference. A cold Ti||<100 eV ion temperature (Figure 5B) clearly displays a faster tailward Vix<0 (Figure 5C) and a fast southward Viz<0 (Figure 5E) magnetosheath flow before and after the KH vortex encounter, while a Ti||>400 eV plasma corresponds with an LLBL domain characterized by slower Viz > −20 km/s. The two vertical, dotted lines again mark the 4.1 s interval when MMS-1 recorded the two ion beams. Interestingly, the MMS satellites remained within a Viz < −40 km/s magnetosheath-like flow regime at this time of interest with an intermediate Ti|| between that of a cold magnetosheath proper and the subsequent hotter LLBL plasma.
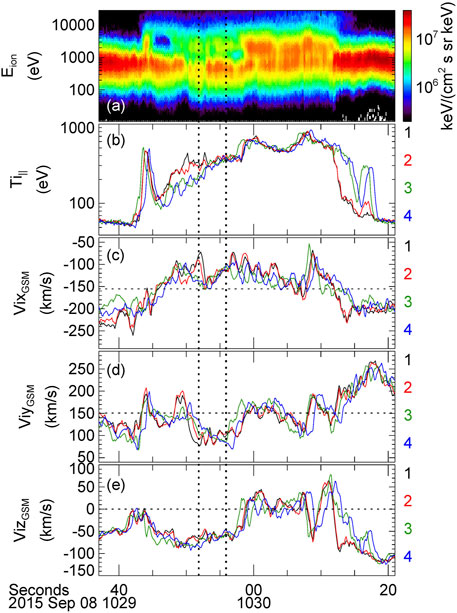
FIGURE 5. MMS observations in burst mode from 1029:37 UT to 1030:21 UT on 8 Sept 2015: (A) MMS-1 ion omni-directional energy-time spectrogram; (B) ion parallel temperature; (C–E) ion velocity components in the GSM coordinate system. Panels (B–E) display MMS-1 observations in black, MMS-2 observations in red, MMS-3 observations in green, and MMS-4 observations in blue color. The two vertical dotted lines mark a time period 1029:51.849–1029:55.900 UT with two counter-propagating ion beams in MMS-1 ion VDFs. The horizontal dotted lines mark the average VxGSM = −155.37 km/s (panel C) and the average VyGSM = 150.68 km/s (panel D).
We can display the time intervals of the two ion beams by converting the temporal information of Figure 5 into four MMS trajectories along a MGSM = [0.717852, −0.696196, 0.0] in-plane direction that we define as MGSM = −ViGSM/|ViGSM|. Here, ViGSM = [−155.37, 150.68, 0.0] is the average in-plane ion velocity that MMS-1 measured during the entire 1029:37–1030:21 UT KH-vortex time interval of Figure 5 with a magnitude VKH = |ViGSM| = 216.4 km/s. The two components of the average in-plane speed (Vx = −155.4 km/s, Vy = 150.7 km/s) are shown as the dotted, horizontal lines of Figures 5C,D, respectively. The estimated propagation velocity of this KH vortex (VKH = ViGSM) is corroborated using a timing boundary normal analysis (Schwartz, 1998), since there are measurable time delays of a sudden increase of Ti|| at the 1029:43.5 UT beginning of this KH vortex encounter at the three MMS satellites (Δt2 = −0.01 s, Δt3 = 0.29 s, Δt4 = −0.53 s) relative the MMS-1 satellite. These time delays and the other MMS satellite positions relative MMS-1 at this time, with MMS-2 at R2 = [−43.05, −84.85, −118.73] km, MMS-3 at R3 = [−59.55, −162.51, 45.28] km, and MMS-4 at R4 = [−177.65, −24.35, −42.05] km, resulted in a V = 219 km/s boundary normal speed along a boundary normal direction UGSM = [−0.654991, 0.748380, −0.104472]. This local UGSM direction is only separated 7.6o from −MGSM with a comparable speed. This means that −MGSM and VKH∼216 km/s represent a realistic, single KH vortex propagation direction and speed for the data displayed in Figure 5. The local VKH∼216 km/s KH vortex speed is only somewhat slower than the mean VKH∼258 km/s KH propagation speed of the many vortices that MMS traversed during the entire KH event (Eriksson et al., 2016a).
Figure 6 illustrates the four MMS satellite observations of the XYGSM-plane ion velocity as shown in Figure 5 in the KH vortex co-moving frame of reference. Each MMS trajectory is aligned with the sunward-directed MGSM satellite propagation direction through this tailward-moving KH vortex with the horizontal MGSM-projections of the ion velocity vectors showing ΔVM = VM+216 km/s. The vertical axis displays the projection of the measured ion velocity along NGSM = LGSM × MGSM = [0.696196, 0.717852, 0.0], where LGSM≡[0,0,1]. The horizontal axis of Figure 6 also shows the distance, M = VKH·t, that each satellite travelled along the MGSM direction in time (t) from their start positions relative MMS-1, R1 = [0,0], at 1029:37 UT (t = 0) using VKH∼216 km/s. At time t = 0, MMS-2 started at [M,N] = [28.13, −90.86] km, MMS-3 started at [M,N] = [70.40, −158.12] km and MMS-4 started at [M,N] = [-110.57, −141.19] km. The MN-plane ion velocity vectors are also color-coded using the individually measured Ti|| (see Figure 5B) with a deep red color corresponding to a maximum Ti||∼800 eV and a deep blue color corresponding to a minimum Ti||∼52 eV. Figure 6 shows that all satellites recorded an earthward VN<0 flow in the cold magnetosheath (M < 1250 km) prior to entering the warmer mixing region of the KH vortex. Figure 6 also confirms that all satellites measured an accelerated, counter-clockwise ion flow around the downstream KH vortex after M > 8250 km and until 1030:21 UT.
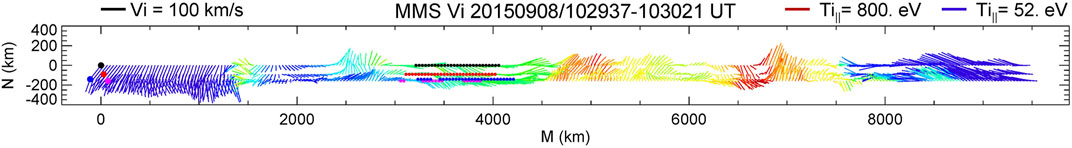
FIGURE 6. XYGSM-plane ion velocity vectors (150 ms cadence) are displayed along the four MMS satellite propagation directions MGSM = [0.717852, −0.696196, 0.0] with NGSM = [0.696196, 0.717852, 0.0] as a direction orthogonal to the MMS tetrahedron trajectory. Time (t) is converted into distance M = |VKH|·t for the time period 1029:37–1030:21 UT and VKH = −216.4·MGSM km/s. The vectors are color-coded using a linear color scale that corresponds to the measured parallel ion temperature at each satellite with Ti||∼800 eV (red) and Ti||∼52 eV (blue). The M-component of the ion GSM velocity is shown in a tailward KH-vortex moving system with ΔVM = VM−(−216.4) km/s. The [0,0] coordinate defines the t = 0 start position of the MMS-1 satellite (black dot) in this MN-plane at 1029:37 UT with the start positions of MMS-2 (red), MMS-3 (pink) and MMS-4 (blue) shown with their tetrahedron positions relative MMS-1 (see text for detailed positions). The colored, smaller dots near 3000 < M < 4250 km mark the spatial coordinates where the four MMS satellites recorded two counter-streaming ion beams (see text for detailed times).
Figure 6 marks the individual times of two counter-streaming ion beams that we listed above as colored dots along each separate MMS trajectory. MMS-1 (black dots) observed the two ion beams at 3214 < M < 4091 km and MMS-2 (red dots) observed the same beams at 3095 < M < 4037 km. MMS-4 (blue dots) encountered the first instance of two ion beams at 3225 < M < 3376 km, and then again at 3452 < M < 4221 km. The most earthward MMS-3 satellite (pink dots) first came across the two ion beams at M = 3052 km, and it exited a more “filamentary” region of two ion beams at M = 3874 km. Note that MMS-2 was located at a distance Rz = −119 km from MMS-1 at 1029:37 UT, with MMS-3 at Rz = 45 km and MMS-4 at Rz = −42 km from MMS-1. However, despite the individual ZGSM separations from MMS-1, it appears that all four satellites came across a region of similar dimension and location when two ion beams were present. Moreover, although the KH-vortex region mostly reflected an outward VN>0 flow deflection from M∼2500 km to M∼7500 km, as typically expected in a KH co-moving frame of reference, it appears that the region of the two opposite ion beams displayed a more VM-aligned ion flow direction with occasional earthward deflections (VN<0).
Figure 2 marks another, 0.9-s period of similar counter-streaming ion beams at the very leading ion edge of the preceding KH vortex, which is marked between the two, pink vertical lines at 1028:42.950 UT and 1028:43.849 UT. An ion VDF example of the counter-streaming ion beam nature in this shorter time period is shown in Figures 7A,D with a clear D-shaped ion beam streaming in a parallel direction, while the anti-parallel beam appears as a shoulder in a 1-D cut of the 2-D ion VDF at a similar PSD and peak |VB|∼500 km/s velocity as the parallel beam.
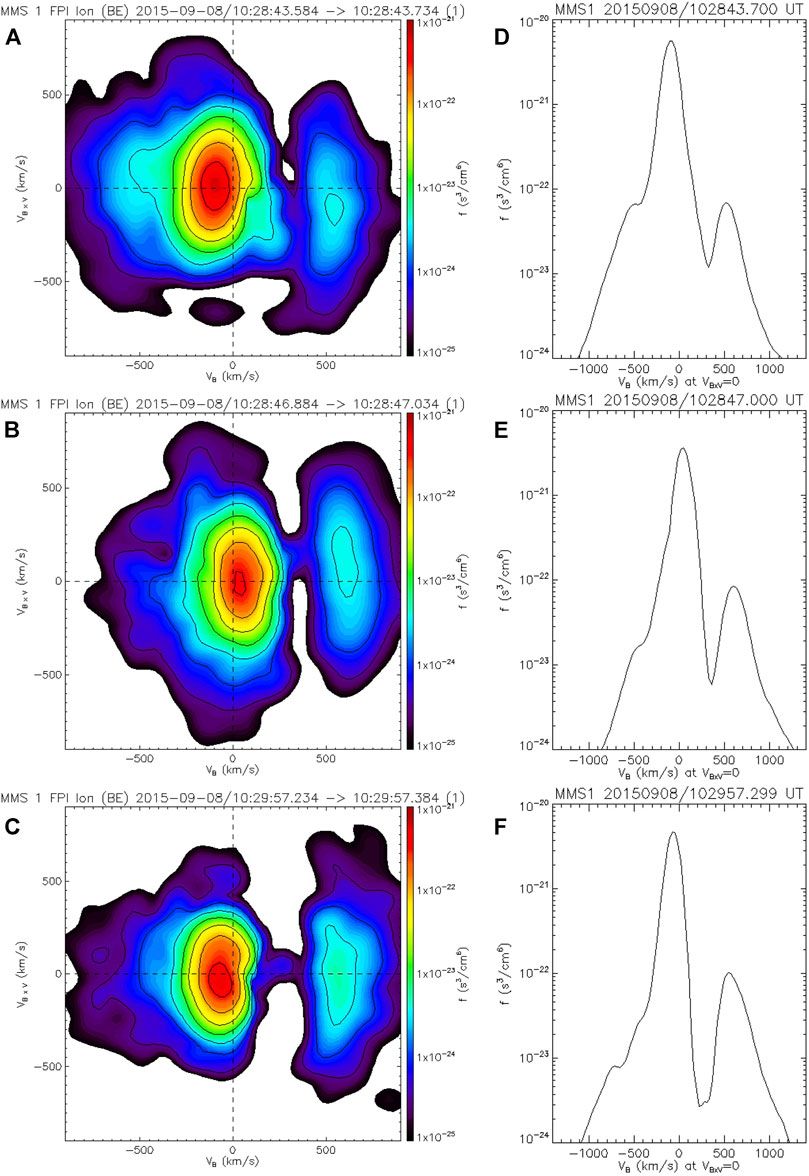
FIGURE 7. MMS-1 ion velocity distributions: (A) Ion VDF at 1028:43.700 UT; (B) ion VDF at 1028:47.000 UT; (C) ion VDF at 1029:57.299 UT; (D) 1-D cut of ion VDF in panel (A); (E) 1-D cut of ion VDF in panel (B); (F) 1-D cut of ion VDF in panel (C). The 2-D ion phase space density of the VDFs (A–C) are shown in VBxV vs VB space. The 1-D cuts along VB are taken along VBxV = 0 km/s.
The two intervals of sustained, counter-streaming ion beams that we highlighted in the MMS-1 observations of Figure 2 also coincide with bi-directional electrons in the 250–500 eV energy range as shown in Figure 2B. However, it is clear from this electron measurement that such bi-directional electrons are prevalent in most of the two KH-vortex regions. In order to appreciate these ion DIS and electron DES measurements, for both intervals of distinctly counter-streaming ion beams inside the leading edges of the two KH vortices, we now compare the field-aligned energy fluxes of electrons in the 250–500 eV energy range at pitch-angles 0–10o and 170–180o with the pitch-angle observations of 2–3 keV ion energy fluxes in the immediate surroundings of the two intervals of distinctly counter-streaming ion beams.
Figure 8 displays the 16-s interval of observations in a region surrounding the first interval of counter-streaming ion beams at the very leading ion edge of the first KH vortex. We note how MMS-1 observed a sudden increase of the electron energy fluxes in both directions along the magnetic field at ∼1028:43 UT (see Figure 8E), near the onset time of the two ion beams. The DES instrument then recorded a second energy flux enhancement of electrons at the end of the period of the two ion beams at ∼1028:44 UT. The electron energy fluxes were essentially balanced in both directions along the magnetic field. In contrast, MMS-1 recorded a starkly different electron signature after the counter-streaming ion period between ∼1028:46.0 UT and ∼1028:47.5 UT when the anti-parallel electron energy flux suddenly decreased, while the parallel streaming electrons essentially maintained a similar energy flux level until decreasing as well toward the end of this ∼1.5-s period. In comparison, Figure 8D shows how the pitch-angle of the 2–3 keV ion energy flux displayed a dominant parallel component at ∼1028:44.5–1028:47.5 UT that overlaps with the 1.5-s period of unbalanced electron energy flux. Figure 7B shows an ion VDF example from this overlapping period at 1028:47.000 UT, which is characterized by a single D-shaped parallel ion beam with a peak VB = 600 km/s velocity (WK∼1.9 keV) along the magnetic field, superposed on a slowly drifting ion core population and a much reduced PSD of ions propagating opposite the magnetic field at speeds VB < −350 km/s.
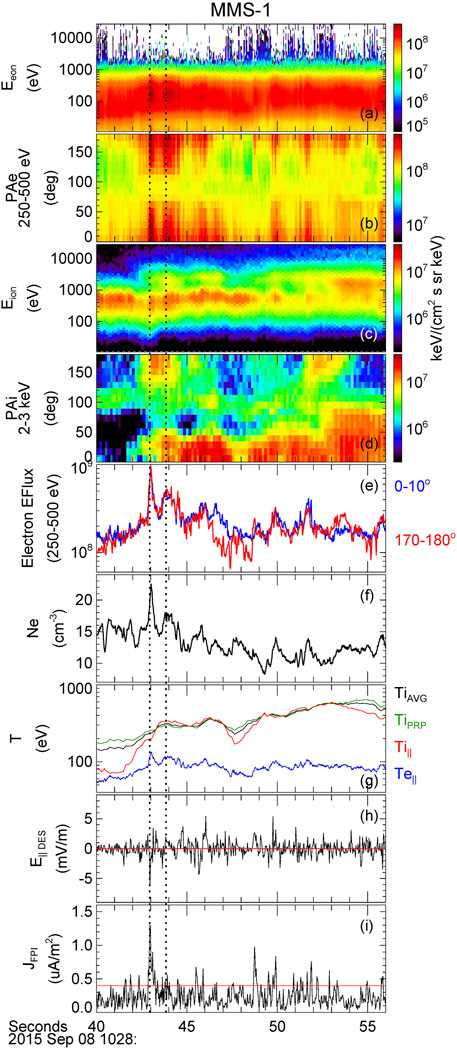
FIGURE 8. MMS-1 burst observations from 1028:40 UT to 1028:56 UT. Panels display (A) electron omni-directional energy-time spectrogram; (B) electron pitch-angle distribution in the 250–500 eV energy range; (C) ion omni-directional energy-time spectrogram; (D) ion pitch-angle distribution in the 2–3 keV energy range; (E) electron energy flux for 250–500 eV energy range parallel to the magnetic field (0–10o, blue) and anti-parallel to the magnetic field (170–180o, red); (F) electron plasma number density; (G) electron parallel temperature (Te||, blue), ion parallel temperature (Ti||, red), ion perpendicular temperature (Tiperp, green), and the ion average temperature TiAVG=(Ti||+2Tiperp)/3; (H) Parallel electric field from the ADP instrument interpolated to the 30-ms DES instrument cadence; (I) magnitude of the current density GSM vector as measured by the FPI instruments. Vertical dotted lines mark the time period 1028:42.950–1028:43.849 UT associated with counter-streaming ions.
Figure 8D indicates another period of apparently counter-streaming ion beams in the pitch-angle distribution of the 2–3 keV ion energy flux at ∼1028:52–1028:53 UT deep inside this first KH vortex. This period coincides with a presence of weak energy fluxes of high-energy 3–10 keV electrons as shown in Figure 8A, indicating that MMS-1 sampled magnetic fields deeper in the magnetosphere at this time. The 2-D ion VDFs and the 1-D cuts along VBxV = 0 km/s at this time do not display a distinct counter-streaming ion beam distribution of the nature displayed in Figure 4. The ion VDFs (not shown) rather suggest a heated magnetosphere-like ion population in a direction opposite the magnetic field, similar to that displayed along the magnetic field in Figure 3C, and a potentially diffuse ion beam propagating along the magnetic field.
Figure 9 displays a 19-s period of observations in a region surrounding the second interval of counter-streaming ion beams well inside the warm leading edge (Figure 9G) of the subsequent KH vortex. Figure 9E shows how the energy flux (Ef) of 250–500 eV electrons gradually increased by 85% in both directions along the magnetic field across the period of counter-streaming ion beams from <Ef>∼2.0·108 keV/(cm2·s·sr·keV) at 1029:47–1029:49 UT to <Ef>∼3.7·108 keV/(cm2·s·sr·keV) at 1029:55–1029:56 UT. The MMS-1 DES instrument also recorded three periods of localized Ef depletions in the immediate vicinity of the ion beam interval. The first period, centered near 1029:50 UT, is associated with substantial Ef depletions in both directions along the magnetic field. The second Ef depletion, centered near 1029:52.5 UT, is embedded with the counter-streaming ion beams. A third Ef depletion is observed again at ∼1029:56–1029:58 UT. In the first and second Ef depletions, Figure 9F shows how the electron plasma density (Ne) also decreased substantially at these times and relative the average Ne = 13.5 cm−3 of this 19-s period, with localized minima of Ne = 6.2 cm−3 (54% reduction) and Ne = 8.2 cm−3 (39% reduction), respectively. In fact, Ne correlates very well with the energy flux of bi-directional 250–500 eV electrons across most of the 19-s period. Figure 9A indicates a presence of 3–10 keV high-energy electrons centered at both Ef depletions. These observations suggest how the first two depletions of the bi-directional electron energy flux may be associated with a temporary region of embedded closed magnetic fields that connect much deeper into a low-density magnetosphere, where the 250–500 eV electron population is less prominent (Figure 1B). The third depletion of the 250–500 eV electron energy flux at ∼1029:57 UT is different in several aspects with a parallel electron energy flux that dropped to <Ef>=2.6·108 keV/(cm2·s·sr·keV) and an anti-parallel electron energy flux that dropped to <Ef>=2.3·108 keV/(cm2·s·sr·keV) relative the preceding 1029:54.849–1029:55.929 UT period of a balanced <Ef>=3.6·108 keV/(cm2·s·sr·keV). First, there are no high-energy electrons in the 3–10 keV energy range. Second, the plasma density Ne∼12 cm−3 remained close to the mean value with no significant density reduction as compared with the first two Ef depletions. Finally, the 2–3 keV ion energy flux displayed a significant drop in the anti-parallel direction, with a dominant ion component streaming parallel to the magnetic field at 1029:56–1029:58 UT (Figure 9D). Figures 7C,F demonstrate how the anti-parallel ion beam that MMS-1 measured with a speed VB < −350 km/s at 1029:55.349 UT (Figures 4A,E) had essentially disappeared by this time, as shown in an example ion VDF at 1029:57.299 UT, which rather consists of a single D-shaped parallel ion beam with a PSD peak at VB = 550 km/s (WK∼1.6 keV) and a slowly drifting ion core population.
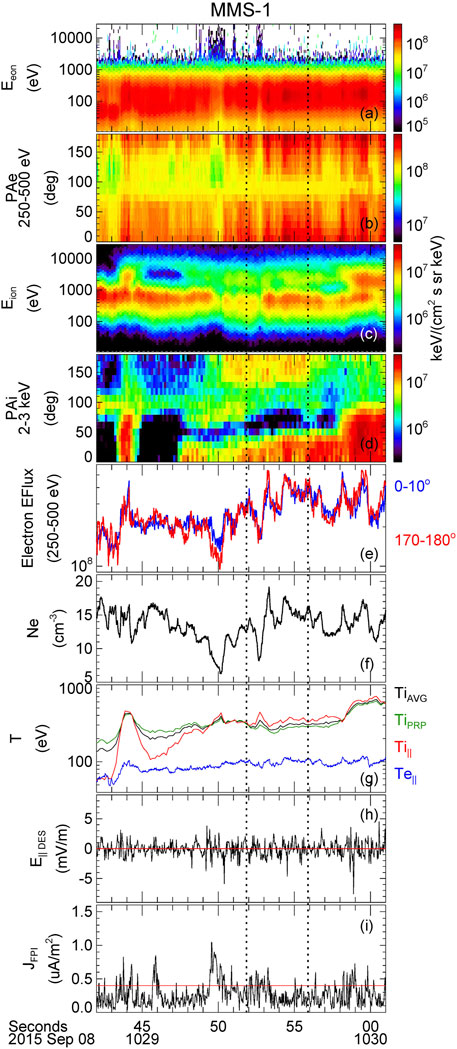
FIGURE 9. MMS-1 burst observations from 1029:42 UT to 1030:01 UT. Panels show the same parameters as in Figure 8. The vertical dotted lines mark the time period from 1029:51.849 UT to 1029:55.900 UT associated with counter-streaming ions.
Parallel Electric Field Observations
Figure 8H shows the parallel electric field measurement by the ADP electric field instrument, but interpolated from 8192 Hz to the 30-ms cadence of the DES electron observations during the 16-s interval associated with a leading edge region of the KH vortex at 1028:40–1028:56 UT. MMS-1 observed a large E|| = −6 mV/m at this 30-ms cadence near the onset-time of the counter-streaming ion beams at 1028:43 UT. It should accelerate electrons northward along the Bz > 0 magnetic field, and it could accelerate some ions in a southward direction. This E||<0 is nearly 50% the surprisingly large E|| = −14 mV/m that MMS-3 recorded inside a confirmed electron diffusion region (Eriksson et al., 2016b) associated with an intense J|| = −2 μA/m2 trailing-edge CS in this same KH event. However, whereas the DES instrument measured a large energy flux increase of the parallel 0–10o electrons in the 250–500 eV energy range at this time (Figure 8E), it also recorded an immediate and equal energy flux response in the 170–180o anti-parallel direction at the same time. Figure 8D shows how the ion energy flux first increased in a southward, anti-parallel direction at the time of the E||<0 as might be expected from a local E|| acceleration. However, the subsequent increase of the parallel ion energy flux toward the end of this 0.9-s interval of counter-streaming ion beams is not associated with a positive E|| of any significant magnitude.
Figure 9H displays a variable E|| with a magnitude below 2 mV/m throughout the 1029:51.8–1029:55.9 UT period of counter-streaming ion beams inside the warm leading edge of a subsequent KH vortex. However, there is no obvious correlation between the locally measured E|| and the field-aligned energy flux of 250–500 eV electrons in this region, or between E|| and the field-aligned ion energy flux in the 2–3 keV range.
Current Density Observations
Figure 8I indicates a very intense current density layer with a maximum J∼1.3 μA/m2 at the time of the E||<0 observation at 1028:43 UT. This intense current layer, which is primarily associated with a very localized decrease of the in-plane magnetic field from By = 40 nT to By = 15 nT (Figure 2H) and a JzGSM = −1.1 μA/m2 component of the FPI current density (not shown), cannot be supported by the enhancement of bi-directional electrons in the 250–500 eV range alone, due to the well-balanced nature of the energy flux in both directions along this magnetic field at this time. The 250–500 eV electrons have a different source than the Jz < 0 current itself. Moreover, the intriguing ∼1.5-s period of parallel electrons and ions at 1028:46.0–1028:47.5 UT is not associated with any significant current density or E||, despite a significant decrease of the anti-parallel electron energy flux and the disappearance of the anti-parallel ion beam. The current density measured across the leading edge of the subsequent KH vortex period, as shown in Figure 9I, is rather benign and mostly weaker than ∼0.5 μA/m2 when the two distinct ion beams are observed streaming in opposite directions along the magnetic field.
Statistical Properties
The detailed energy flux descriptions of ions at 2–3 keV and electrons at 250–500 eV as observed inside the warm leading edges of two adjacent KH vortex regions are not unique to this pair of KH vortices at 1028:29–1030:34 UT on 8 Sept 2015. The signature of fast counter-streaming ions along the magnetic field, although not clearly present in the ion VDFs of all the KH vortices, have been confirmed using the ion VDF observations for 17 such KH vortex regions of this post-noon event. Each KH vortex may also be associated with several individual bursts of sustained counter-streaming ion beam signatures in an uninterrupted series of 150-ms ion VDFs, as seen along the MMS-3 and MMS-4 example trajectories of Figure 6, as the MMS satellites travel across the initial, warm ion temperature region of any given KH vortex. Table 1 lists a total of 26 such MMS-1 periods distributed across the 17 KH vortices, with durations ranging from Δt = 0.75-s to Δt = 5.25-s (column 3, Table 1) and a median Δt = 1.95-s. The focused bursts of two ion beams are almost exclusively present in a warm Ti||∼490 eV, intermediate density Ne ∼ 12 cm−3 (Table 1 median values) leading edge of the KH vortex region of this post-noon event, and before MMS moved into the high-temperature LLBL section of the KH vortex, which is mostly characterized by isotropic ion temperatures (Figures 2C,F). In contrast, the 26 intervals of two ion beams analyzed here typically reflect very anisotropic ion temperatures due to a presence of these field-aligned beams with an average TR = Ti||/Tiperp that ranges from 0.94 to 1.62 with a median TR = 1.24 value (Table 1). In using the ion VDF observations recorded by the MMS-1 and MMS-2 satellites, which are essentially aligned along the northward-pointing magnetic field, it is clear that the maximum PSD of the parallel ion beam is higher than the maximum PSD of the anti-parallel ion beam in 16 of the 26 intervals. These intervals are indicated using a “+” symbol in the last column of Table 1. There were only four periods when MMS-1 and MMS-2 indicated a higher PSD in the anti-parallel ion beam than in the PSD of the parallel ion beam (c.f. “−” symbol in last column of Table 1), and in six intervals (no symbols in last column of Table 1), the PSDs were essentially of equal magnitude in the two ion beams. The energy flux of bi-directional electrons often display a clear enhancement in the 250–500 eV energy range when the ion VDFs display the two counter-streaming ion beams. Moreover, when one of the two ion beams, with observed speeds in a range 350 < VB < 775 km/s (Table 2), is absent or displaying a highly suppressed PSD before or after the times listed in Table 1, resulting in one single ion beam, then so too does the energy flux of the bi-directional electron signature tend to change, and often in such a way that more electron energy flux will be observed in the same direction along the magnetic field as the remaining field-aligned ion beam.
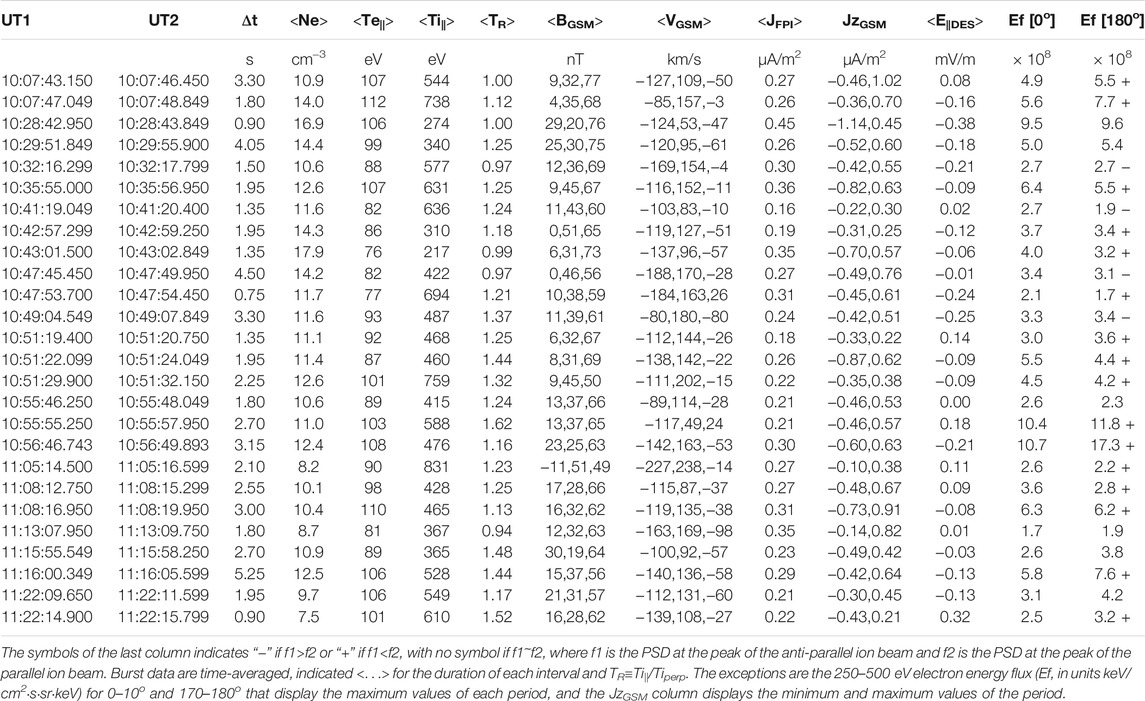
TABLE 1. Time periods when MMS-1 observed two distinct, counter-streaming ion beams in a continuous series of DIS measurements of ion VDFs, superposed on a slowly drifting core of cold magnetosheath ions.
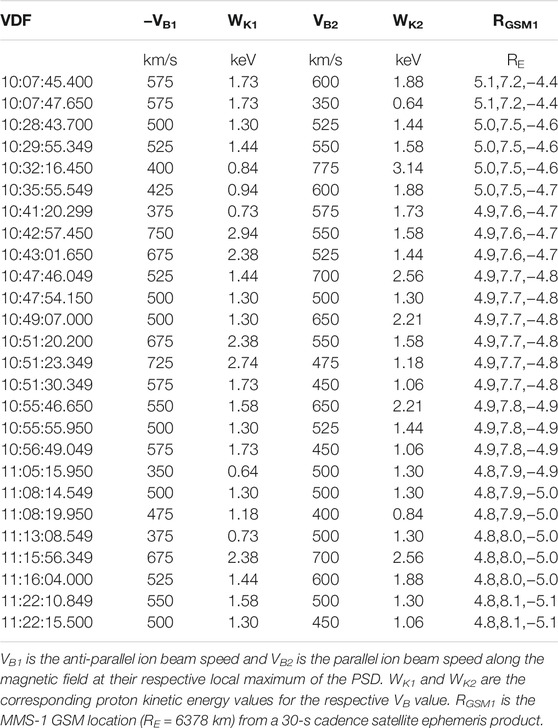
TABLE 2. Times of individual ion VDFs as recorded by MMS-1 that displayed two distinct counter-streaming ion beams and superposed on a slowly drifting magnetosheath ion core population.
Discussion
In comparing the slow, dense ion population of Figure 4 with the ion VDFs of Figure 3, it can be argued that it corresponds to a magnetosheath ion population (Figure 3A) captured onto closed magnetic fields inside the KH vortex, in general agreement with a presence of bi-directional electrons in the 250–500 eV energy range (Figure 2) to support a closed magnetic field topology (Faganello et al., 2014; Vernisse et al., 2016). The observation of a dense core population of magnetosheath ions with a slow drift along a closed magnetic field suggests that a magnetic reconnection process likely occurred at two locations along this northward pointing magnetic field that MMS sampled in an equatorial KH vortex region. However, in a general absence of intense CSs associated with a local reconnection exhaust, or any significant parallel electric fields in the plane of the MMS satellites near ZGSM = −4.6 RE in this warm leading edge of the KH vortex regions (Figures 8, 9; Table 1), it appears that the two reconnection regions were present at some distance to the north and to the south of the MMS satellites. The simultaneous observation of two typically D-shaped ion beams, streaming in both directions along this same magnetic field that captured ∼1 keV magnetosheath ions, but with a much lower PSD and a faster field-aligned speed than this ion core population, also support a presence of two reconnection regions along this northward magnetic field as we shall discuss in more detail below.
The isotropic LLBL ion distributions of Figure 3 are very different from the ion VDFs of Figure 4. In fact, Figures 2C,D demonstrate a clear difference of the ion burst measurements during the period of counter-streaming ion beams in a warm leading region of the second KH vortex, as compared with a subsequent period of much hotter and isotropic ion temperatures at 1029:57–1030:12 UT (c.f. Figures 2D,F) when a representative LLBL ion VDF (Figures 3C,F) was recorded without distinct ion beams. This hot, parallel LLBL ion temperature is also reflected as a wide 0–90o pitch-angle ion distribution as compared with the 0–30o field-aligned ion beams, which makes it difficult to identify similar ion beam features in the LLBL. Considering the simultaneous presence of a slow magnetosheath source-population, and the general absence of high-energy electrons from the magnetosphere proper, it is unlikely that the two beams of ions streaming in both directions along this northward magnetic field with a fast (median) 525 km/s speed and a corresponding field-aligned kinetic energy 0.6 < WK < 3.1 keV (Table 2) with a median WK = 1.4 keV may be associated with a source in the plasma sheet or the isotropic outer LLBL plasma domain. A more straightforward explanation, in the absence of local reconnection exhausts, is that the two ion beams, which typically displayed a D-shaped ion beam velocity distribution (Cowley, 1982; Smith and Rodgers, 1991; Fuselier et al., 2014), are associated with an ExB-acceleration of a cold ∼1 keV magnetosheath ion source population into the magnetosphere at a more remote location from MMS to parallel speeds 350 < VB < 775 km/s (Table 2). The parallel component of the captured magnetosheath ion population at the location of MMS, in contrast, is typically centered between VB ∼ −200 km/s and VB∼75 km/s along the magnetic field (Figures 3A, 4A).
On the Remote Ion Beam Source Regions: High-Latitude Versus Mid-Latitude
A pair of two off-equatorial magnetic reconnection regions, which may capture a significant volume of magnetosheath plasma onto newly closed magnetic fields [e.g., (Faganello and Califano, 2017; Ma et al., 2017; Ma et al., 2021)], may also be associated with accelerated field-aligned ions and accelerated bi-directional electrons [e.g., (Nykyri et al., 2006; Nishino et al., 2007; Bavassano Cattaneo et al., 2010; Faganello et al., 2014; Vernisse et al., 2016)]. The two numerically predicated magnetopause reconnection regions have either been proposed to be located very far from the KH wave observations near the equatorial plane, such as a high-latitude lobe region tailward of the cusp (Bavassano Cattaneo et al., 2010), or located in a relatively closer mid-latitude region to the KH vortices from a reported presence of field-aligned electron observations [e.g., (Faganello et al., 2014; Vernisse et al., 2016)].
Let us first assume a presence of two mid-latitude reconnection (MLR) regions following some recent numerical advances (Faganello and Califano, 2017; Ma et al., 2017; Fadanelli et al., 2018; Sisti et al., 2019). The two MLR regions may be expected at a minimum λKH-distance from the region of maximum KHI growth (Ma et al., 2014). In the KHI case of 8 Sept 2015, Eriksson et al. (2016a) estimated λKH∼2.6 RE and Vernisse et al. (2020) obtained a maximum KHI growth region near the GSM latitude location of the MMS satellites. We, therefore, assume two symmetrically located MLR regions at an equal distance L = λKH to the south of MMS, and L = λKH to the north of MMS at (x,y,z)GSM = (5.0, 7.5, −4.6) RE. This MMS location corresponds to a polar θ = −24.4o angle at radius RGSM = 10.1 RE, while the distance L = λKH along an assumed circular field-line segment translates to a polar angle separation of only θ = 14.7o from MMS. The two assumed MLR regions would then be located at polar angles θN = −9.7o and θS = −39.2o corresponding to ZGSM = −1.7 RE for the NMLR region and ZGSM = −6.4 RE for the SMLR region. An ion moving at a field-aligned speed VB = 525 km/s, which corresponds to the median of the observed distribution (Table 2), would cover this L = λKH distance in ∼32 s. This corresponds to 0.50TKH, where TKH = 63.3 s is the estimated KH time period (Eriksson et al., 2016a). A very fast field-aligned ion travelling at the maximum VB = 775 km/s speed observed at a peak PSD in any of these ion beams, would cover that same distance in only ∼21 s or 0.33TKH. The slowest VB = 350 km/s field-aligned ions observed here would reach MMS in ∼47 s or 0.75TKH.
A similar exercise for a northern HLR region, assumed to be present in a cusp region [e.g., (Song and Russell, 1992; Fuselier et al., 2014)] at θ = 80o on the same post-noon side as MMS (Luhmann et al., 1984), and consistent with the observed IMF By > 0 and IMF Bz > 0 (Nakamura et al., 2017), would result in a polar angle θ = 104o separation from MMS. This separation translates into an 18.4 RE field-aligned distance from MMS if we assume a circular magnetic field line through the location of the MMS satellites. In comparison, one would obtain a ∼20.2 RE distance to the surface of the Earth from the MMS satellite along an unperturbed dipole magnetic field line (Schulz and Lanzerotti, 1974) assumed to exist in this KH region. A more realistic field-aligned distance of the perturbed closed field line through the KH region could be longer still, since it is also associated with a stressed, tailward-extended geomagnetic field, as shown in Figure 10. If we assume a northern HLR region ∼2 RE off the surface of the Earth along this dipole field, we obtain a ∼18.2 RE distance in general agreement with the simplistic, circular field line. A field-aligned ion travelling at VB = 525 km/s would cover a 18.4 RE circular field-line distance in 3.5TKH, assuming that it will not pitch-angle scatter off that field line before reaching MMS. The fast VB = 775 km/s ions would reduce that travel time to 2.4TKH. We note that an assumed HLR in the southern cusp region is expected in a pre-noon sector for the observed IMF conditions (Luhmann et al., 1984), thus requiring more involved modeling analysis to estimate rough ion travel times from a southern HLR region to MMS.
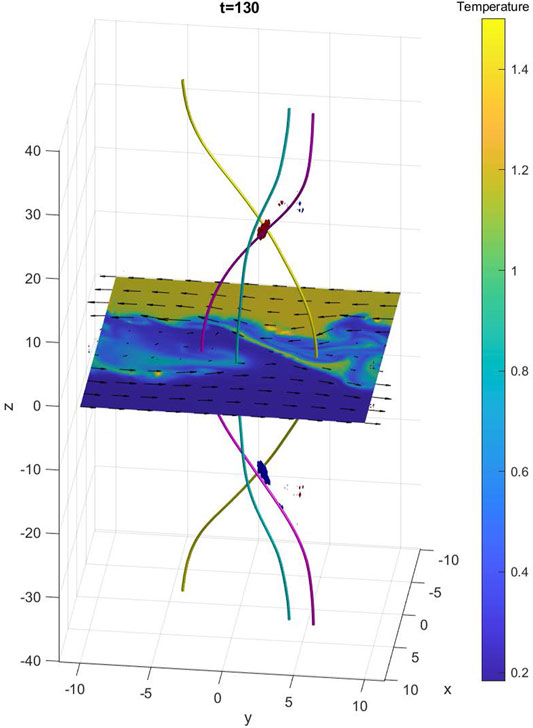
FIGURE 10. A 3-D MHD simulation rendering for the conditions at time t = 130 in a nonlinear stage of the KHI corresponding to MMS observations on 8 Sept 2015 (Ma et al., 2021). A red patch marks a volume of positive field-aligned current density J|| > 0.56 U, where 1 U = 0.087 uA/m2. A blue patch marks a volume of negative J|| < −0.56 U. The magnitudes of the most intense J|| ∼ 1.5 U in each patch at this time. A yellow-colored field line is a closed field line traced from (Xs, Ys, Zs) = (−0.9, 1.5, 19.0) corresponding to the magnetosphere (MSP) side of current layer. A magenta colored field line is an open field line traced from (Xs, Ys, Zs) = (0.9, 1.5, 19.0) corresponding to the magnetosheath (MSH) side of current layer. A cyan-colored field line is a newly closed field-line traced from (Xs, Ys, Zs) = (2.0, 0.0, 0.0) such that it crosses the plane at the leading edge of the in-plane KH vortex region. A background color index represents the plasma temperature in simulation units. Black arrows show the bulk flow velocity on the equatorial plane. Here, the coordinate system is such that Y is positive along the cold MSH tailward flow direction, Z is positive northward, and X is positive along the non-perturbed magnetopause CS normal direction.
The probability appears to be low for a double HLR process to explain why two mostly D-shaped ion beams would be measured almost exclusively in a warm leading region of the KH vortex as suggested from Table 1. The typical, much longer travel times T > 3TKH expected from a northern HLR as compared with T < TKH from two symmetric MLR regions clearly suggest that two counter-streaming ion beams associated with two HLR regions, even if they remain well-collimated along the field, would be more distributed throughout the closed field region of the entire KH vortex. One would also expect a more banana-shaped ion velocity distribution about VBxV = 0 for ions measured by MMS this far from a HLR entry region due to a conservation of the first adiabatic moment of ions, if we also assume that the ions entered the magnetosphere in a region of lower magnetic field strength near the two cusps compared with a higher magnetic field strength measured in an equatorial region (Fuselier et al., 2014). A double HLR process, which is independent from a KHI process near the equator, does not appear to explain the presence of the two counter-streaming ion beams with a mostly D-shaped distribution in a warm leading region of the KH vortices.
Concerning Enhanced Electron Energy Fluxes and Electron Bounce Times
Direct ion-beam evidence in support of one or two KH-related MLR regions has not commonly been discussed in the literature, which is rather focused on electron observations at different energies to deduce the magnetic field topologies that may be present across the dynamic KH vortex region in its various phases of temporal evolution [e.g., (Faganello et al., 2014; Vernisse et al., 2016)]. However, ion observations may be less challenging to utilize in understanding the immediate domain around the KH vortices due to the lower speed of accelerated ions along the magnetic field as compared with accelerated 250–500 eV electrons. A 250 eV electron would travel between a magnetic mirror point at RM = 1.1 RE in the northern ionosphere at 72.92o latitude to the mirror point in the southern ionosphere along a closed dipole magnetic field through the MMS location at (x,y,z)GSM = (5.0, 7.5, −4.6) RE in only TB/2 = 7.25 s (Schulz and Lanzerotti, 1974). Here, TB is the full bounce period of that electron on a closed field line for an estimated L = 12.75 drift-shell MMS location. A fast 500 eV electron would travel that distance in TB/2 = 5.25 s. A one-way travel time from one HLR region to the MMS location would be shorter still for 250–500 eV electrons. This means that 250–500 eV electrons could sample several important geomagnetic domains as compared with 2–3 keV ions along the magnetic field in the same time, including two double HLR regions. In assuming that the two D-shaped ion beams are associated with accelerated magnetosheath ions in two MLR ion exhaust regions, then it is also likely that the enhanced energy flux of 250–500 eV electrons, as often recorded by MMS in the same time periods, correspond to accelerated magnetosheath electrons from the same MLR regions. However, due to their fast speed, it is possible that the background of bi-directional 250–500 eV electrons, existing nearly throughout the KH vortex regions on 8 Sept 2015 (Figure 2B) may have a different source farther from the MLR regions, such as magnetosheath electrons entering onto new closed field lines formed by two HLR regions.
Comparing MMS Ion Beam Observations and Two-Fluid Numerical Simulation Results
Sisti et al. (2019) performed a two-fluid 3-D numerical simulation for the observed MMS conditions of the 8 Sept 2015 event to suggest (their Figure 3) how the warm leading KH vortex region and the associated vortex “arm” are both expected to support once-reconnected field-lines (open field topology) and twice-reconnected field-lines (newly closed field topology) in very limited regions of the KH vortex in the early nonlinear phase of the KH evolution encountered by MMS. The results in Sisti et al. (2019) with spatially limited regions of twice-reconnected fields in the warm leading edge of the KH vortex support a MLR process closer to the KH vortex rather than double-reconnected magnetic fields associated with HLR near the cusps. However, we note that the predictions by Sisti et al. (2019) should be viewed as the expected locations of field-lines associated with one or two active reconnection regions in close proximity to the 3-D KH vortex due to the absence of any HLR regions in their fluid simulation that we understand to be present in a real system for similar conditions of a northward interplanetary magnetic field [e.g., (Gosling et al., 1991; Song and Russell, 1992; Øieroset et al., 2005; Fuselier et al., 2014)].
The time durations of the counter-streaming ion beams of Table 1 may be used together with an average tailward VKH∼258 km/s velocity of the KH vortices (Eriksson et al., 2016a) to estimate a range of in-plane spatial scales (ΔS) that we associate with twice-reconnected magnetic fields connecting two MLR regions. The statistical widths for the 26 events of Table 1 would correspond to a range of spatial scales 3<ΔS<22 di along the trajectory of MMS with an in-plane median 8 di dimension, if we assume a constant di = 61 km ion inertial scale for the average plasma density N∼14 cm−3 that MMS-1 measured at the time of the two periods of counter-streaming ion beams in Figure 2. This spatial dimension compares well with the narrow regions that Sisti et al. (2019) predicted for this MMS KH event. A straight path through a simulated KH vortex, taken along the y-axis of their Figure 3 (right) and consistent with a tailward KH vortex propagation, also suggests that a region of twice-reconnected MLR fields should be narrower at the very first ion leading edge of the warm KH vortex region as compared with a thicker such region along the vortex arm that stretches in toward the KH vortex center at the boundary between a pre-existing LLBL of hot, isotropic ion temperature and the inner-most region of the warm plasma domain of the KH-mixing region. This is also consistent with the two examples of counter-streaming ion beams measured by MMS and shown in Figures 2, 8, 9 with a narrow ΔS∼4 di layer present at the very leading ion edge of the first KH vortex, starting at 1028:42.950 UT (Table 1), and a thicker ΔS∼17 di layer of counter-streaming ion beams starting at 1029:51.849 UT near the inner edge with the isotropic LLBL. In this second, warm inner region event of the subsequent KH vortex, MMS actually observed a short-duration layer with a single D-shaped parallel ion beam (see Figure 7C and Figures 9C,D) sandwiched between this region of twice-reconnected fields and the LLBL-proper. In contrast, Sisti et al. (2019) predicts that such once-reconnected open magnetic fields (their Figure 3, right) associated with just one MLR region to the south of MMS should be present before the twice-reconnected fields, suggesting that KH events may be more complicated. The presence of two or three individual bursts of sustained counter-streaming ion beam signatures in a given warm KH-vortex region (Table 1) also suggests a more layered structure of magnetic field topologies with “twice-reconnected” (DMLR) regions occurring not just at the very leading edge and at the subsequent inner vortex arm as predicted by Sisti et al. (2019). However, this does not change the overall agreement between these MMS observations and the Sisti et al. (2019) predictions of expected widths and locations of “twice-reconnected” magnetic fields that we associate with two active MLR regions to generate new closed fields in a KH vortex.
On a Possible Mid-Latitude Magnetosheath Ion Entry Mechanism
Eriksson et al. (2020) reported similar ion VDFs observed by the THEMIS satellites that also consisted of two counter-propagating magnetosheath ion populations, but in a region between two converging dayside magnetopause reconnection exhausts in the early flux rope formation stage. Eriksson et al. (2020) also performed a two-dimensional particle-in-cell numerical simulation for the THEMIS conditions to show how the ion particles of the two ion beams originated as colder upstream particles in the adjacent magnetosheath that drifted toward the magnetopause, where they were picked-up by the magnetic fields and accelerated up to the ExB drift of the reconnection exhausts near the two reconnection X-lines. This well-known entry mechanism of magnetosheath ions associated with magnetic reconnection at the magnetopause was first predicted by Cowley (1982), whereby a parallel cutoff-velocity forms below which no magnetosheath ions may enter onto the open magnetic fields earthward of the magnetopause. This cutoff velocity is clearly present in the D-shaped ion VDFs of Figure 4. A similar ion entry process likely accelerated a cold magnetosheath ion population, as observed by MMS on the same field-lines as the two counter-streaming ions, in two mid-latitude regions to the north and south of MMS. A difference between the 8 Sept 2015 KH-case and the sub-solar observations reported by Eriksson et al. (2020) is the magnetic topology with the latter case displaying BzGSM < 0 in the adjacent dayside magnetosheath and a north-south directed pair of VzGSM jets. The KH-case, however, displayed a significant BzGSM > 0 guide magnetic field and weaker BxGSM > 0 and ByGSM > 0 components of the magnetic field (Table 1) when the two ion beams were observed. A similar BGSM was also observed in the magnetosheath-proper after 1130 UT. Indeed, Figure 1G demonstrates how MMS observed a generally positive ByGSM > 0 at nearly twice the magnitude of a mostly positive BxGSM > 0 throughout this KHI period, including in the tenuous and hot magnetosphere before 0920 UT. In considering two MLR regions roughly 15o north and south of MMS, it would seem plausible that similar ByGSM > BxGSM > 0 conditions may have existed adjacent the two MLR regions. However, a KH-dynamic shearing-motion of magnetic fields associated with a tailward propagation of the KH vortex against the stress of the geomagnetic field is likely more important to sustain a MLR process (Faganello and Califano, 2017) than the in-plane components of a magnetic field direction in a nearby magnetosheath. This shearing-process of magnetic fields in the magnetosphere and in the adjacent magnetosheath is clearly illustrated in Figure 10 for a dedicated 3-D MHD simulation that we performed for this MMS KH event (Ma et al., 2021). The simulated NMLR CS is directed northward (Jz > 0) and the SMLR CS is directed southward (Jz < 0) as a result of this KH-shearing action on the magnetic fields. Figure 10 implies that two mostly in-plane (XYGSM) ion exhaust regions will form in the vicinity of both MLR regions, with the ion jets directed typically sunward and tailward from each X-line reconnection region.
The mostly in-plane ion ExB reconnection exhausts thus predicted by numerical simulations to be present near the two remote mid-latitude regions will be dominated by their in-plane VxGSM and VyGSM components of the ion outflow, and perpendicular to a dominant BzGSM > 0 guide magnetic field. However, in considering individual gyrating ion particles, one must consider the total magnetic field, including this dominant BzGSM > 0 guide magnetic field observed on 8 Sept 2015. A cold magnetosheath proton above some cutoff velocity (Cowley, 1982) may enter the locally opened magnetic field (either MLR, north or south) and, in the case of a plasma density asymmetry with a higher density in the adjacent magnetosheath and a lower density earthward of the MLR magnetopause, the cold magnetosheath ions will most likely cross the mid-plane of the Jz CS onto the geomagnetic field (Cassak and Shay, 2007; Birn et al., 2008; Pritchett, 2008). That is, we assume that most of the ion reconnection outflow supports a significant velocity component along the geomagnetic field direction on the earthward side of the remote MLR magnetopause regions, as we suggest in the Figure 11 schematic with a few ion trajectories from a high-density magnetosheath into a low-density magnetosphere with thin lines and associated arrows displaying the directions of the in-plane components of the KH-sheared magnetic field in agreement with Figure 10. MMS measured a magnetic field strength B2∼85 nT and plasma density N2∼20 cm−3 in the adjacent magnetosheath (Figures 2E,H). The dynamic equatorial LLBL region supported a similar field strength B∼75 nT and a density N∼12 cm−3 (Figure 2), while MMS sampled an outer magnetosphere plasma sheet before ∼0920 UT characterized by a field strength B1∼70 nT and a density N1∼2 cm−3 (Figure 1). If we assume that similar plasma sheet conditions existed earthward of the two MLR regions at a small 15o separation to the north and south of MMS, and with similar conditions expected in an adjacent remote magnetosheath as those measured at MMS, we may estimate a magnetic field ratio B1/B2∼0.8 and a plasma density ratio N2/N1∼10 across the remote MLR regions. A similar case (B1/B2 = 0.7 and N2/N1 = 10) was simulated by Birn et al. (2008) with a region 2 corresponding to our magnetosheath and a region 1 corresponding to our magnetosphere. This case predicts a bulk exhaust outflow on a magnetosphere-side with higher Alfvén speed, in basic agreement with the Figure 11 schematic, with this outflow primarily aligned with the magnetic field direction earthward of the magnetopause.
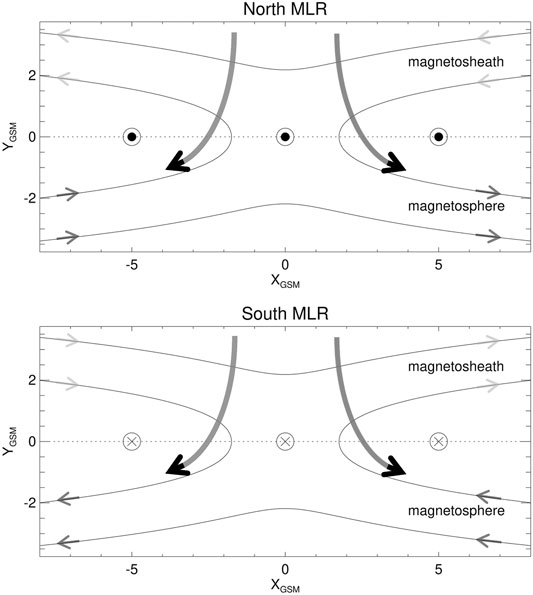
FIGURE 11. Schematic ion entry from the magnetosheath into the magnetosphere of cold magnetosheath ions associated with KH-sheared magnetic fields in the adjacent magnetosphere and magnetosheath. Thin solid lines and associated arrows mark the direction of the in-plane component of the magnetic field around the ion diffusion regions of a northern MLR region (top) and a southern MLR (bottom) region consistent with a presence of a JzGSM > 0 current (encircled dots at YGSM = 0) in the north and JzGSM < 0 current (encircled crosses at YGSM = 0) in the south. A few proposed ion trajectories are shown.
The Figure 11 schematic ion entry process is viewed from above the NMLR region, and from above the SMLR region, with a dominant BzGSM > 0 pointing outward and the symbols at YGSM = 0 indicating the direction of the JzGSM CSs, again consistent with Figure 10. We also note that the two X-lines of the schematic may be associated with a tailward deHoffmann-Teller drift along this flank magnetopause location. This means that the bulk of the adjacent magnetosheath ion velocity population, which supports a finite field-aligned drift centered near VB ∼ −75 km/s (Figure 3A), may experience a shift toward VB∼0 km/s in the assumed tailward moving frame of reference of the schematic with magnetosheath ions expected to move in both directions of the magnetic field in Figure 11.
There are four cases to consider for a possible explanation of the two counter-streaming, accelerated magnetosheath ion beams along the magnetic field that we propose that MMS observed on 8 Sept 2015. In Case 1 (NMLR sunward jet), a cold magnetosheath ion is assumed to enter the magnetosphere along the open magnetic field onto a sunward-directed in-plane component of a KH-sheared magnetic field on the earthward side of the JzGSM > 0 CS. However, we note that the locally open magnetic field earthward of the MLR magnetopause is directed mostly northward (Bz > 0 dominant guide-field) with a smaller sunward tilt. The guiding-center of this cold gyrating ion is accelerated by the drift of the reconnected field lines, and it will be measured along that magnetic field as a faster parallel ion beam, but only in a region to the north of the NMLR jet. In Case 2 (NMLR tailward jet), a cold magnetosheath ion enters the magnetosphere and it obtains a fast exhaust speed directed along the geomagnetic field, but this time opposite the open magnetic field onto a sunward-directed (KH tilted) in-plane component of the magnetic field earthward of the JzGSM > 0 CS. The cold gyrating ion is accelerated tailward by the reconnected field lines, and it will be measured as a faster anti-parallel ion beam along this mostly northward magnetic field line with a sunward tilt, but only in a region to the south of this tailward NMLR jet. In Case 3 (SMLR sunward jet), a cold magnetosheath ion enters the magnetosphere opposite the open magnetic field onto a tailward-directed (KH-tilted) in-plane component of the magnetic field earthward of the JzGSM < 0 CS. The guiding-center of this cold gyrating ion is accelerated sunward by the reconnected field lines, and it will be measured along that mostly northward-directed magnetic field line as a fast anti-parallel ion beam, but only in a region to the south of the SMLR jet. Finally, in Case 4 (SMLR tailward jet), a cold magnetosheath ion enters the magnetosphere along the open magnetic field onto a tailward-directed (KH tilted) in-plane component of the field earthward of the JzGSM < 0 CS. As before, the locally open magnetic field is directed mostly northward with a tailward tilt. The guiding-center of the cold ion is accelerated tailward by the reconnected field lines, and it will be measured along that geomagnetic field line as a faster parallel ion beam as compared with its initial magnetosheath speed, but only in a region to the north of the SMLR jet.
The proposed incoming magnetosheath ion particles on 8 Sept 2015 will only be guided toward the equatorial plane of the KH-vortex from the tailward exhaust of the SMLR region, and from the tailward exhaust of the NMLR region, by the dominant BzGSM > 0 magnetic field upon entering the locally open magnetopause. We emphasize the expected importance of a higher Alfvén speed on the earthward side of the MLR regions (Birn et al., 2008) to align the ion exhaust with the geomagnetic field. If the conditions of a given KH case are such that the higher Alfvén speed shifts to the magnetosheath-side of the MLR CSs, then the primary difference should be two counter-streaming magnetosheath ion beams associated with two sunward exhausts in the tailward moving MLR X-line frame of reference, assuming a northward BzGSM > 0 guide-field on the magnetosheath-side and a DMLR process that captures magnetosheath plasma onto newly closed magnetic field lines. A rotation of the in-plane exhausts about the BzGSM > 0 guide-field of the X-line by local KH-vortex action will not affect this simple scenario. What matters is the direction of the normal magnetic field across the magnetopause in the vicinity of the X-line, and that the geomagnetic field is stretched tailward (sunward) near the SMLR (NMLR) X-line, while the KH-entrained mostly northward-directed magnetosheath magnetic field is tilted sunward (tailward) near the SMLR (NMLR) X-line in agreement with Figure 10. We should note that individual ion particles upon entering the two MLR exhaust regions will also experience a small reconnection electric field Er = −VxB as, e.g., associated with a guiding-center outflow motion on the order of |V|∼100 km/s in an in-plane (normal) magnetic field on the order of |B|∼5 nT that would correspond to an electric field Er∼0.5 mV/m. This Er electric field is directed away from the equatorial plane at both MLR regions with Ez < 0 at the SMLR X-line and exhaust, and Ez > 0 at the NMLR X-line and exhaust, such that J·E > 0 associated with the strong Jz currents of Figure 10. However, the two poleward diverging Ez electric fields will unlikely affect the bulk population of the incoming magnetosheath ion particles in their attempt to reach the guiding-center ion exhaust speed before they exit the tailward exhaust regions along the dominant BzGSM > 0 guide magnetic field near the two MLRs and travel toward the equator.
Revisiting Initial Ion Beam MMS Observations
Vernisse et al. (2016) presented a statistical study focused on MMS observations of field-aligned, heated electrons in the magnetosheath adjacent to the trailing magnetopause CSs of the KH spine region that we associate with “type-I” vortex-induced magnetic reconnection ion exhaust signatures on 8 Sept 2015 (Eriksson et al., 2016a). However, Vernisse et al. (2016) also displayed one important MMS-1 ion velocity distribution averaged over a 1.5-s period at 1044:53.500–1044:55.000 UT near the leading edge of one KH vortex that appears to show two weak ion beams. They concluded that “additional electron and ion populations are shown to be present in the magnetosheath, and those are suggested to come from mid-latitude reconnection driven by the twisting of the field lines away from the KH waves in the northern and southern hemispheres.” In the next several paragraphs, we review the MMS observations in and around this single ion VDF measurement using the same format that we employed in Figures 4, 8, 9 to further our understanding of these important ion observations in the immediate 3-D spatial domain of the KH vortex region.
Figure 12 shows a 21-s period around this leading edge region. The 2.6-s interval at 1044:54.000–1044:56.600 UT (two dotted vertical lines) marks the time that Vernisse et al. (2016) associated with a presence of two counter-streaming ion beams in MMS-1 observations, and possibly due to a remote presence of two MLR regions. They referred to this region as an ion boundary layer (IBL) (Gosling et al., 1990; Onsager et al., 2001) in an “interval where the spacecraft is in the magnetosheath.”
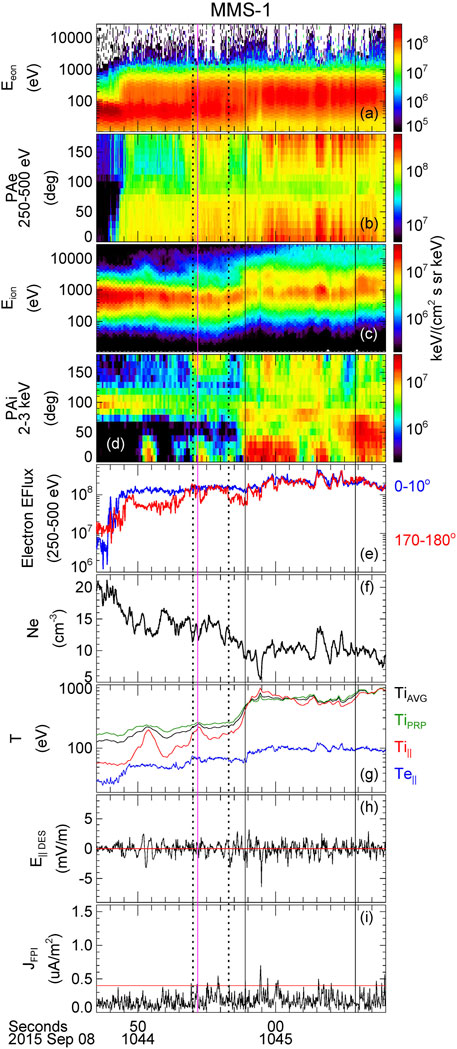
FIGURE 12. MMS-1 burst observations from 1044:47 UT to 1045:08 UT. Same panel format as described in Figure 8. Two vertical dotted lines mark the time period from 1044:54.000 UT to 1044:56.600 UT when (Vernisse et al., 2016) indicated a presence of two counter-streaming ion beams. A pink solid vertical line marks the time 1044:54.349 UT of the MMS-1 ion VDF displayed in Figures 13A,D. The two black solid vertical lines at 1044:57.800 UT and 1045:05.800 UT marks an interval with a characteristic warm ion temperature 450 eV < TiAVG < 800 eV.
Figure 13 displays the 150-ms ion VDFs as recorded by MMS-1, MMS-2 and MMS-3 around the same time at 1044:54.349 UT and in the same 2-D plane format as shown in Figure 4. We marked this time in Figure 12 as a pink, solid vertical line inside the 2.6-s interval. The chosen time is close to a local maximum of the parallel ion temperature (Ti||). The corresponding 1-D ion cuts at VBxV = 0 in Figure 13 appear to show two ion beams, but with a significantly lower PSD than the ion beams shown in Figure 4. The average <Ti||> = 164 eV during this 2.6-s interval within the IBL region is correspondingly lower as compared with the values listed in Table 1. The Ti||/Tiperp ratio only reached a 0.84 maximum with an average <Ti||/Tiperp> = 0.67 ratio in this same period. These ion temperature signatures, together with an average <Ne> = 13.5 cm−3 electron plasma density, are consistent with a magnetosheath-like domain adjacent to the ion leading edge of the KH vortex. In comparing the MMS-1 ion observations of Figures 12C,D with the corresponding ion observations of the two events of counter-streaming ion beams shown in Figures 8, 9, it is clear that MMS-1 recorded these weaker ion beam signatures in a magnetosheath-like region farther from the warm ion temperature domain of the KH vortex region itself as shown between two solid vertical lines at 1044:57.8–1045:05.8 UT in Figure 12.
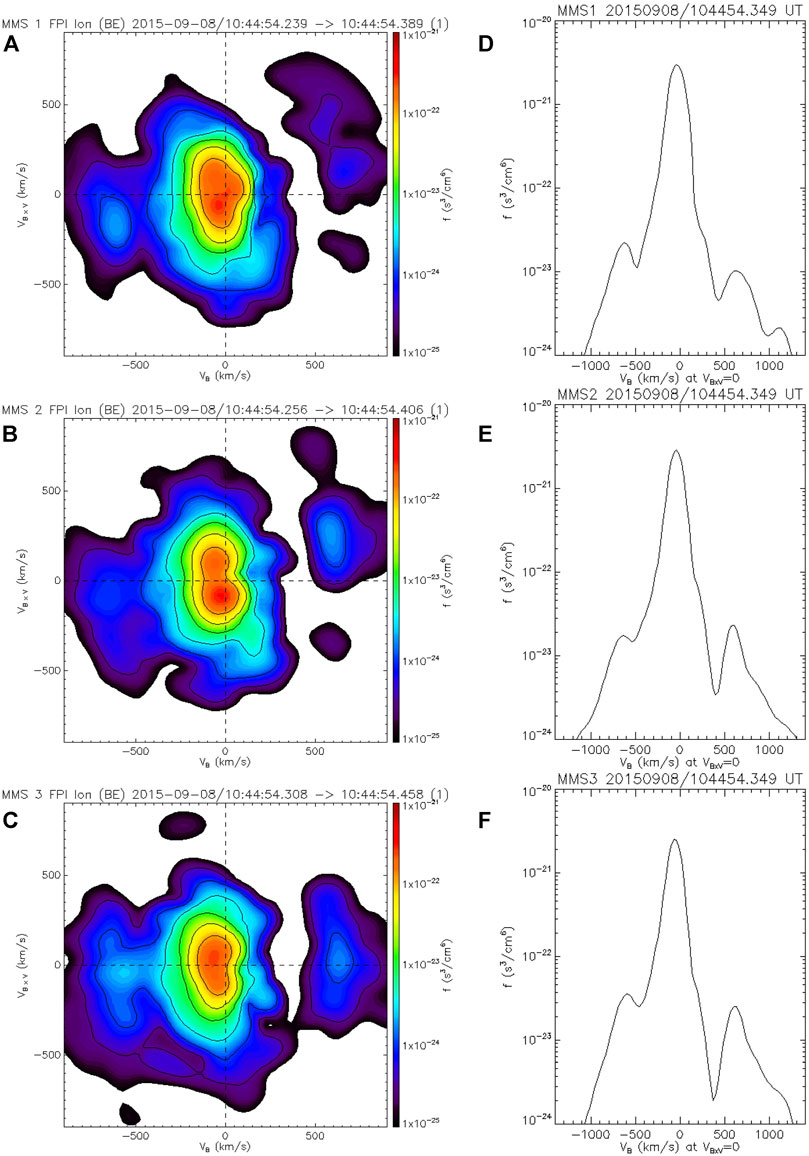
FIGURE 13. Ion velocity distribution functions at 1044:54.349 UT: (A) 2-D ion phase space density at MMS-1; (B) 2-D ion phase space density at MMS-2; (C) 2-D ion phase space density at MMS-3; (D) 1-D cut at MMS-1; (E) 1-D cut at MMS-2; (F) 1-D cut at MMS-3.
We note how both MMS-1 and MMS-2, which were located nearly along the same magnetic flux tubes, did not display a D-shaped ion beam distribution in either a parallel or anti-parallel direction. The two MMS satellites rather measured fast parallel and anti-parallel ions with a significant drift in one perpendicular BxV-direction as compared with the ion VDFs of Figure 4. This finite VBxV drift of the beam ions may reflect a magnetosheath-like domain of the ions, or ion entry potentially farther from the MMS satellites, whereby some parallel motion at the entry location may have changed into perpendicular motion at the satellite due to a conservation of the first adiabatic invariant (Fuselier et al., 2014). Hardly any of the 17 individual ion VDFs that MMS-1 sampled at 150-ms cadence at 1044:54.000–1044:56.600 UT displayed a D-shape distribution of the parallel and anti-parallel streaming ions in contrast with the ion VDFs of Figure 4 and most of the individual counter-streaming ion beam events listed in Table 1. However, Figures 13C,F show that MMS-3, with an earthward ΔYGSM ∼ −156 km displacement from MMS-1 and with only a small earthward ΔYGSM ∼ −71 km separation from MMS-2, in fact recorded a mostly D-shaped parallel ion beam and an anti-parallel ion beam with a much smaller VBxV drift at the same time as the two ion VDFs at MMS-1 and MMS-2. MMS-3 measured very similar D-shaped distributions of the parallel ion beam mostly throughout this 2.6-s period inside a variable IBL region adjacent to the KH vortex (not shown). This more earthward MMS-3 location was also associated with relatively warmer ion temperatures during this same 2.6-s period with a higher average <Ti||> = 208 eV and a higher Ti||/Tiperp ratio that peaked at 0.97 with an average <Ti||/Tiperp> = 0.78 ratio.
The presence of two D-shaped ion beams with very weak PSD as observed by MMS-3 in a magnetosheath-like IBL region, and just before it entered a KH vortex region, could indicate a reflection of earthward-drifting magnetosheath ions (Onsager et al., 2001) along the open magnetic field near two MLR regions to the south and to the north of the satellite, and on the magnetosheath-side of the two MLR CSs (Figure 11). Another possibility is a leakage of magnetosphere ions, and electrons, from two MLR regions as suggested in Vernisse et al. (2016). The simultaneous presence of a dominant magnetosheath ion core population and a general absence of hot LLBL ions (Figures 3, 13C,F) would seem to support a magnetosheath ion reflection scenario. The D-shaped nature of the ion beam distributions at MMS-3 also supports a more local MLR region and an open magnetopause as, e.g., compared with more banana-shaped ion distributions associated with a more distant ion entry location relative the satellite (Fuselier et al., 2014).
An Ion Velocity Filter Effect?
Figure 4 shows how MMS-3 recorded a faster parallel ion beam speed VB for a lower PSD as compared with the VB speed and PSD of the parallel ion beams measured by the other MMS satellites at the same time. This appears to be a typical trend in terms of the field-aligned ion speed at the maximum PSD when these ion beams are observed on 8 Sept 2015, whereby a lower PSD of the ion beam is often reflected in a faster ion speed along the magnetic field (Table 2). That is, fewer and fewer ions are measured the faster the ions are observed to move. This observation suggests the presence of a velocity filter effect for the DMLR process that may be explained in terms of the actual distance to the proposed MLR ion exhaust source region (Eriksson et al., 2020) with only the very fastest ions being able to cover a longer distance as compared with slower ions of a similar ion velocity distribution.
Let us assume as a baseline scenario that two symmetric MLR locations exist at nearly equal latitude distances from a region of maximum KHI growth, which is not far from the predicted locations of the MMS satellites on 8 Sept 2015 (Vernisse et al., 2020). The observation of a typically higher PSD associated with the parallel ion beam of the Table 1 events, as compared with a lower PSD in the anti-parallel ion beam, would then indicate a more active or steady reconnection process near the SMLR region, perhaps accelerating more ions in a parallel direction than a less-active NMLR region producing fewer ions in the anti-parallel direction. This appears to be consistent with the north-south asymmetry prediction in Sisti et al. (2019) for the observed in-plane magnetic fields of this KH event whereby the number of SMLR regions tends to dominate over the number of NMLR regions. The alternative scenario of two asymmetrically located MLR regions of similar reconnection activity relative a region of maximum KH growth would suggest that MMS could have been closer to the SMLR region than the NMLR region to explain the larger number of ions collected from that direction. Either scenario appears to explain the observed PSD differences with 62% of the 26 cases in Table 1 typically favoring a higher PSD in the parallel direction than the anti-parallel direction of the two ion beams, with the opposite PSD observation seen in only 15% of the 26 cases.
The Warm KH Vortex Region
MMS mostly observed the counter-streaming ion beams in the warm, intermediate ion temperature region (Tiw) of the KH vortex, which is defined as the KH-mixing region where TiMSH < Tiw < TiMSP. Here, TiMSP corresponds to the high-temperature region of the pre-existing LLBL-proper and TiMSH is the cold ion temperature of the adjacent magnetosheath. Sisti et al. (2019) reproduced these three regions in their Figure 3 on the basis of the plasma density, where TiMSP corresponds to the highest-density LLBL region of their simulated KH vortex. However, there is not much of a difference in the observed plasma density of the two KH vortex regions (Figure 2) that we associate with Tiw and TiMSP. Moreover, the regions of two distinct counter-streaming ion beams in individual ion VDFs typically correspond to Ti||>Tiprp. This is very rarely, if ever, observed in the LLBL-proper, where the characteristic ion temperature is mostly isotropic Ti||∼Tiprp.
On KH Plasma Turbulence and Mid-Latitude Reconnection
Sorriso-Valvo et al. (2019) explored the MMS observations of the 8 Sept 2015 KH event and reported a presence of bi-directional ion beams with an ion VDF example presented at 1007:45.820 UT. This ion VDF is part of a longer 3.3-s period of 22 individual 150-ms cadence ion burst measurements with sustained counter-streaming ion beams (Table 1). The pair of two coherent ion beams presented in Sorriso-Valvo et al. (2019) was proposed to be a result of the observed plasma turbulence first reported in Stawarz et al. (2016) of this same KH vortex region. However, it remains unclear how an extended region of plasma turbulence in the KH vortex region of this event would result in such organized and focused periods of counter-streaming ion beams, and only toward the warm leading edge of the KH vortices. One would expect much more extended intervals of such bi-directional ion beams throughout the KH vortex region, as also expected from a double HLR source discussed earlier, if they were a direct result of plasma turbulence. Indeed, it appears that the two-fluid 3-D numerical simulation (Sisti et al., 2019), which is able to reproduce the observed loci and dimensions of two distinct counter-streaming ion beams reported here, provides a more straightforward explanation of the origin of the two ion beams in terms of twice-reconnected MLR magnetic field lines to the north and south of MMS during the early non-linear phase of the KH instability at the Earth’s flank magnetopause.
Finally, we should mention that is not impossible that MMS may have sampled a Jz < 0 CS region of one SMLR region at 1028:43 UT when it observed the intense J∼1.3 μA/m2 current layer with a dominant JzGSM = −1.1 μA/m2 component and E|| = −6 mV/m at the start of the 0.90-s interval of counter-streaming ions (Figure 8) that we associate with “twice-reconnected” fields and a presence of two MLRs to the south and north of the region of maximum KHI growth. However, the equal energy flux of bi-directional 250–500 eV electrons did not support this current per se. It is very likely that the ∼1.5-s period of parallel 250–500 eV electrons and parallel 2–3 keV ions at 1028:46.0–1028:47.5 UT inside the warm region of this first KH vortex (Figure 8) may be explained as magnetosheath particles still entering a tailward reconnection exhaust from one active MLR to the south of MMS, while the decrease of the anti-parallel flux of said electrons and ions at this time suggests that MMS was no longer connected to a northern MLR. Either it ceased to be active, or MMS simply moved away from it onto fields with a different topology.
Summary and Conclusions
The KH event recorded by MMS on 8 Sept 2015 in an early non-linear phase of the KHI evolution is examined for a presence of counter-streaming ion beams along the magnetic field as recorded in individual ion VDFs. The commonly observed D-shaped nature of the two ion beams (Cowley, 1982), which are superposed on a slowly drifting magnetosheath population and typically without a hot LLBL population, suggests that the beams are associated with magnetosheath ion particle transmission at a more distant magnetopause reconnection region from the MMS satellites along the magnetic field due to the absence of local reconnection exhausts.
The typical T < TKH ion travel times for a field-aligned VB = 525 km/s (median) ion speed and a field-aligned distance L∼λKH from an assumed nearby MLR region, as compared with T > 3TKH for ions at this same speed between a northern high-latitude region and MMS at a ∼18 RE field-aligned distance, suggest that the two D-shaped ion beams observed by MMS are probably associated with two nearby MLR magnetopause reconnection regions, or else MMS would have likely measured a more common banana-shaped counter-streaming ion beam distribution (Fuselier et al., 2014) associated with the closed magnetic fields of a double HLR region, and across most of the closed field regions of the entire KH vortex.
The in-plane spatial dimensions of the sustained periods of two counter-streaming ion beams show a very good agreement with the similar dimensions of twice-reconnected magnetic field lines reported for this same KH event in a two-fluid, 3-D numerical simulation domain (Sisti et al., 2019) that surrounds the immediate 3-D KH vortex. A proposed plasma turbulence-generated ion beam explanation (Sorriso-Valvo et al., 2019) does not appear to be consistent with the localized MMS observations of counter-streaming ion beams in the warm temperature region of the KH vortex leading edge as reproduced by Sisti et al. (2019).
Vernisse et al. (2016) presented a possible ion leakage-scenario associated with two distant magnetopause reconnection regions to explain the presence of an ion boundary layer with two counter-streaming ion beams with very low PSD in a magnetosheath-like region adjacent to a KH vortex as observed by MMS on 8 Sept 2015. It is possible that the very low PSD of these ion beams may be explained in terms of a magnetosheath ion reflection mechanism (Smith and Rodgers, 1991; Onsager et al., 2001) at the locally open MLR magnetopause. In contrast, we reported new counter-streaming ion beam MMS observations on 8 Sept 2015 with a mostly D-shaped distribution and a much higher PSD inside the warm leading-edge KH vortex region. We propose a magnetosheath ion injection hypothesis in the presence of a plasma density gradient at the mid-latitude magnetopause to explain these remote observations, whereby cold magnetosheath ions are accelerated tailward by a transverse ExB drift near two MLR regions, with this ExB outflow becoming mostly aligned with the magnetic field on that side of the local MLR magnetopause which is also associated with a higher Alfvén speed (Birn et al., 2008). The accelerated, mostly field-aligned exhaust ions are subsequently guided along a dominant BzGSM > 0 magnetic field toward the equator and the MMS satellites in a direction away from the magnetosheath in general agreement with the mostly D-shaped ion beam observations [e.g., (Cowley, 1982), (Fuselier et al., 2014), (Eriksson et al., 2020)].
MMS frequently observed in-plane reconnection exhausts at the trailing, intense CSs of this same KH event associated with “type-I” vortex-induced reconnection of the magnetopause spine region [e.g., (Eriksson et al., 2016a), (Vernisse et al., 2016)] that connects two neighboring KH vortices. In contrast, the occurrence frequency of “type-II” reconnection exhaust observations appear to be very rare indeed inside this KH-vortex region on 8 Sept 2015. We conclude, therefore, that the observation of two counter-streaming ion beams inside the warm leading layers of the KH vortex, far removed from the trailing CSs, is most likely associated with magnetosheath ion injection in the tailward exhaust regions at two nearby MLR regions, above and below the MMS satellites, as first proposed by Otto (2008) to exist in a 3-D KH vortex regime.
Data Availability Statement
The datasets presented in this study can be found in online repositories. The names of the repository/repositories and accession number(s) can be found below: https://lasp.colorado.edu/mms/sdc/public/.
Author Contributions
SE analyzed MMS data and interpreted the observations including generating a schematic of the proposed ion entry process from the magnetosheath in the vicinity of two mid-latitude reconnection regions associated with KHI. XM provided MHD simulation results of field-line topology for the KHI event. JB provided IDL codes to analyze the electron energy flux for a given pitch-angle and energy range of DES observations. AO provided detailed insights on mid-latitude reconnection dynamics. SE analyzed dipole field-line lengths and bounce times of electrons at selected electron energy. PD provided expertise on KHI dynamics.
Conflict of Interest
The authors declare that the research was conducted in the absence of any commercial or financial relationships that could be construed as a potential conflict of interest.
Publisher’s Note
All claims expressed in this article are solely those of the authors and do not necessarily represent those of their affiliated organizations, or those of the publisher, the editors and the reviewers. Any product that may be evaluated in this article, or claim that may be made by its manufacturer, is not guaranteed or endorsed by the publisher.
Acknowledgments
SE acknowledges primary support from NASA grant award 80NSSC18K1108 to the Embry-Riddle Aeronautical University, Florida and the Laboratory for Atmospheric and Space Physics (LASP) with the University of Colorado Boulder. XM acknowledges support from NASA grants 80NSSC18K1108 and 80NSSC18K1381. MMS observations are publically available via NASA CDAWeb resources and the Science Data Center at University of Colorado/LASP. The MMS data analysis performed here employed the SPEDAS V3.1 as described in (Angelopoulos et al., 2019). We thank the entire MMS team for their accomplishments that made this data set available to the entire Heliophysics community.
References
Angelopoulos, V., Cruce, P., Drozdov, A., Grimes, E. W., Hatzigeorgiu, N., King, D. A., et al. (2019). The Space Physics Environment Data Analysis System (SPEDAS). Space Sci. Rev. 215, 9. doi:10.1007/s11214-018-0576-4
Bavassano Cattaneo, M. B., Marcucci, M. F., Bogdanova, Y. V., Rème, H., Dandouras, I., Kistler, L. M., et al. (2010). Global Reconnection Topology as Inferred from Plasma Observations Inside Kelvin-Helmholtz Vortices. Ann. Geophys. 28, 893–906. doi:10.5194/angeo-28-893-2010
Birn, J., Borovsky, J. E., and Hesse, M. (2008). Properties of Asymmetric Magnetic Reconnection. Phys. Plasmas 15, 032101. doi:10.1063/1.2888491
Birn, J., Drake, J. F., Shay, M. A., Rogers, B. N., Denton, R. E., Hesse, M., et al. (2001). Geospace Environmental Modeling (GEM) Magnetic Reconnection Challenge. J. Geophys. Res. 106, 3715–3719. doi:10.1029/1999JA900449
Burch, J. L., Moore, T. E., Torbert, R. B., and Giles, B. L. (2015). Magnetospheric Multiscale Overview and Science Objectives. Space Sci. Rev. 199, 5–21. doi:10.1007/s11214-015-0164-9
Burch, J. L., Torbert, R. B., Phan, T. D., Chen, L.-J., Moore, T. E., Ergun, R. E., et al. (2016). Electron-scale Measurements of Magnetic Reconnection in Space. Science 352, aaf2939. doi:10.1126/science.aaf2939
Cassak, P. A., and Shay, M. A. (2007). Scaling of Asymmetric Magnetic Reconnection: General Theory and Collisional Simulations. Phys. Plasmas 14, 102114. doi:10.1063/1.2795630
Chandrasekhar, S. (1961). Hydrodynamic and Hydromagnetic Stability. New York, NY: Oxford Univ. Press.
Chen, S.-H., and Kivelson, M. G. (1993). On Nonsinusoidal Waves at the Earth’s Magnetopause. Geophys. Res. Lett. 20, 2699–2702. doi:10.1029/93GL02622
Cowley, S. W. H. (1982). The Causes of Convection in the Earth's Magnetosphere: A Review of Developments during the IMS. Rev. Geophys. 20, 531–565. doi:10.1029/rg020i003p00531
Ergun, R. E., Tucker, S., Westfall, J., Goodrich, K. A., Malaspina, D. M., Summers, D., et al. (2016). The Axial Double Probe and Fields Signal Processing for the MMS Mission. Space Sci. Rev. 199, 167–188. doi:10.1007/s11214-014-0115-x
Eriksson, S., Lavraud, B., Wilder, F. D., Stawarz, J. E., Giles, B. L., Burch, J. L., et al. (2016a). Magnetospheric Multiscale Observations of Magnetic Reconnection Associated with Kelvin-Helmholtz Waves. Geophys. Res. Lett. 43, 5606–5615. doi:10.1002/2016GL068783
Eriksson, S., Wilder, F. D., Ergun, R. E., Schwartz, S. J., Cassak, P. A., Burch, J. L., et al. (2016b). Magnetospheric Multiscale Observations of the Electron Diffusion Region of Large Guide Field Magnetic Reconnection. Phys. Rev. Lett. 117, 015001. doi:10.1103/PhysRevLett.117.015001
Eriksson, S., Souza, V. M., Cassak, P. A., and Hoilijoki, S. (2020). Nascent Flux Rope Observations at Earth's Dayside Magnetopause. J. Geophys. Res. Space Phys. 125, e2020JA027919. doi:10.1029/2020JA027919
Fadanelli, S., Faganello, M., Califano, F., Cerri, S. S., Pegoraro, F., and Lavraud, B. (2018). North‐South Asymmetric Kelvin‐Helmholtz Instability and Induced Reconnection at the Earth's Magnetospheric Flanks. J. Geophys. Res. Space Phys. 123, 9340–9356. doi:10.1029/2018JA025626
Faganello, M., and Califano, F. (2017). Magnetized Kelvin-Helmholtz Instability: Theory and Simulations in the Earth's Magnetosphere Context. J. Plasma Phys. 83, 535830601. doi:10.1017/S0022377817000770
Faganello, M., Califano, F., Pegoraro, F., and Retinò, A. (2014). Kelvin-Helmholtz Vortices and Double Mid-latitude Reconnection at the Earth's Magnetopause: Comparison Between Observations and Simulations. Epl 107, 19001. doi:10.1209/0295-5075/107/19001
Fairfield, D. H., Otto, A., Mukai, T., Kokubun, S., Lepping, R. P., Steinberg, J. T., et al. (2000). Geotail Observations of the Kelvin-Helmholtz Instability at the Equatorial Magnetotail Boundary for Parallel Northward Fields. J. Geophys. Res. 105, 21159–21173. doi:10.1029/1999JA000316
Farrugia, C. J., Gratton, F. T., Bender, L., Biernat, H. K., Erkaev, N. V., Quinn, J. M., et al. (1998). Charts of Joint Kelvin-Helmholtz and Rayleigh-Taylor Instabilites at the Dayside Magnetopause for Strongly Northward Interplanetary Magnetic Field. J. Geophys. Res. 103, 6703–6727. doi:10.1029/97JA03248
Feldman, W. C., Asbridge, J. R., Bame, S. J., Montgomery, M. D., and Gary, S. P. (1975). Solar Wind Electrons. J. Geophys. Res. 80, 4181–4196. doi:10.1029/JA080i031p04181
Foullon, C., Farrugia, C. J., Fazakerley, A. N., Owen, C. J., Gratton, F. T., and Torbert, R. B. (2008). Evolution of Kelvin-Helmholtz Activity on the Dusk Flank Magnetopause. J. Geophys. Res. 113, A11203. doi:10.1029/2008JA013175
Fuselier, S. A., Petrinec, S. M., Trattner, K. J., and Lavraud, B. (2014). Magnetic Field Topology for Northward IMF Reconnection: Ion Observations. J. Geophys. Res. Space Phys. 119, 9051–9071. doi:10.1002/2014JA020351
Gosling, J. T., Thomsen, M. F., Bame, S. J., Elphic, R. C., and Russell, C. T. (1990). Cold Ion Beams in the Low Latitude Boundary Layer During Accelerated Flow Events. Geophys. Res. Lett. 17, 2245–2248. doi:10.1029/GL017i012p02245
Gosling, J. T., Thomsen, M. F., Bame, S. J., Elphic, R. C., and Russell, C. T. (1991). Observations of Reconnection of Interplanetary and Lobe Magnetic Field Lines at the High-Latitude Magnetopause. J. Geophys. Res. 96, 14097–14106. doi:10.1029/91JA01139
Hasegawa, H., Fujimoto, M., Phan, T.-D., Rème, H., Balogh, A., Dunlop, M. W., et al. (2004). Transport of Solar Wind into Earth's Magnetosphere Through Rolled-Up Kelvin-Helmholtz Vortices. Nature 430, 755–758. doi:10.1038/nature02799
Hasegawa, H., Fujimoto, M., Takagi, K., Saito, Y., Mukai, T., and Rème, H. (2006). Single-spacecraft Detection of Rolled-Up Kelvin-Helmholtz Vortices at the Flank Magnetopause. J. Geophys. Res. 111, A09203. doi:10.1029/2006JA011728
Hasegawa, H., Retinò, A., Vaivads, A., Khotyaintsev, Y., André, M., Nakamura, T. K. M., et al. (2009). Kelvin-Helmholtz Waves at the Earth's Magnetopause: Multiscale Development and Associated Reconnection. J. Geophys. Res. 114, A12207. doi:10.1029/2009JA014042
Knoll, D. A., and Chacón, L. (2002). Magnetic Reconnection in the Two-Dimensional Kelvin-Helmholtz Instability. Phys. Rev. Lett. 88 (21), 215003. doi:10.1103/physrevlett.88.215003
Kokubun, S., Kawano, H., Nakamura, M., Yamamoto, T., Tsuruda, K., Hayakawa, H., et al. (1994). Quasi-periodic Oscillations of the Magnetopause During Northward Sheath Magnetic Field. Geophys. Res. Lett. 21 (25), 2883–2886. doi:10.1029/94GL02103
Li, W., André, M., Khotyaintsev, Y. V., Vaivads, A., Graham, D. B., Toledo‐Redondo, S., et al. (2016). Kinetic Evidence of Magnetic Reconnection Due to Kelvin‐Helmholtz Waves. Geophys. Res. Lett. 43, 5635–5643. doi:10.1002/2016GL069192
Luhmann, J. G., Walker, R. J., Russell, C. T., Crooker, N. U., Spreiter, J. R., and Stahara, S. S. (1984). Patterns of Potential Magnetic Field Merging Sites on the Dayside Magnetopause. J. Geophys. Res. 89, 1739–1742. doi:10.1029/JA089iA03p01739
Ma, X., Otto, A., and Delamere, P. A. (2014). Interaction of Magnetic Reconnection and Kelvin-Helmholtz Modes for Large Magnetic Shear: 1. Kelvin-Helmholtz Trigger. J. Geophys. Res. Space Phys. 119, 781–797. doi:10.1002/2013JA019224
Ma, X., Delamere, P., Otto, A., and Burkholder, B. (2017). Plasma Transport Driven by the Three‐Dimensional Kelvin‐Helmholtz Instability. J. Geophys. Res. Space Phys. 122 (10), 10382–10395. doi:10.1002/2017JA024394
Ma, X., Delamere, P., Nykyri, K., Burkholder, B., Eriksson, S., and Liou, Y.-L. (2021). Ion Dynamics in the Meso-scale 3-D Kelvin–Helmholtz Instability: Perspectives From Test Particle Simulations. Front. Astron. Space Sci. 8, 758442. doi:10.3389/fspas.2021.758442
Mitchell, D. G., Kutchko, F., Williams, D. J., Eastman, T. E., Frank, L. A., and Russell, C. T. (1987). An Extended Study of the Low-Latitude Boundary Layer on the Dawn and Dusk Flanks of the Magnetosphere. J. Geophys. Res. 92, 7394–7404. doi:10.1029/JA092iA07p07394
Miura, A., and Pritchett, P. L. (1982). Nonlocal Stability Analysis of the MHD Kelvin-Helmholtz Instability in a Compressible Plasma. J. Geophys. Res. 87, 7431–7444. doi:10.1029/JA087iA09p07431
Nakamura, T. K. M., Fujimoto, M., and Otto, A. (2006). Magnetic Reconnection Induced by Weak Kelvin-Helmholtz Instability and the Formation of the Low-Latitude Boundary Layer. Geophys. Res. Lett. 33, L14106. doi:10.1029/2006GL026318
Nakamura, T. K. M., Fujimoto, M., and Otto, A. (2008). Structure of an MHD-Scale Kelvin-Helmholtz Vortex: Two-Dimensional Two-Fluid Simulations Including Finite Electron Inertial Effects. J. Geophys. Res. 113, A09204. doi:10.1029/2007JA012803
Nakamura, T. K. M., Daughton, W., Karimabadi, H., and Eriksson, S. (2013). Three-dimensional Dynamics of Vortex-Induced Reconnection and Comparison with THEMIS Observations. J. Geophys. Res. Space Phys. 118, 5742–5757. doi:10.1002/jgra.50547
Nakamura, T. K. M., Eriksson, S., Hasegawa, H., Zenitani, S., Li, W. Y., Genestreti, K. J., et al. (2017). Mass and Energy Transfer across the Earth's Magnetopause Caused by Vortex‐Induced Reconnection. J. Geophys. Res. Space Phys. 122, 11505–11522. doi:10.1002/2017JA024346
Nishino, M. N., Fujimoto, M., Ueno, G., Mukai, T., and Saito, Y. (2007). Origin of Temperature Anisotropies in the Cold Plasma Sheet: Geotail Observations Around the Kelvin-Helmholtz Vortices. Ann. Geophys. 25, 2069–2086. doi:10.5194/angeo-25-2069-2007
Nykyri, K., and Otto, A. (2001). Plasma Transport at the Magnetospheric Boundary Due to Reconnection in Kelvin-Helmholtz Vortices. Geophys. Res. Lett. 28, 3565–3568. doi:10.1029/2001GL013239
Nykyri, K., Otto, A., Lavraud, B., Mouikis, C., Kistler, L. M., Balogh, A., et al. (2006). Cluster Observations of Reconnection Due to the Kelvin-Helmholtz Instability at the Dawnside Magnetospheric Flank. Ann. Geophys. 24, 2619–2643. doi:10.5194/angeo-24-2619-2006
Øieroset, M., Raeder, J., Phan, T. D., Wing, S., McFadden, J. P., Li, W., et al. (2005). Global Cooling and Densification of the Plasma Sheet During an Extended Period of Purely Northward IMF on October 22-24, 2003. Geophys. Res. Lett. 32, L12S07. doi:10.1029/2004GL021523
Onsager, T. G., Scudder, J. D., Lockwood, M., and Russell, C. T. (2001). Reconnection at the High-Latitude Magnetopause during Northward Interplanetary Magnetic Field Conditions. J. Geophys. Res. 106 (25), 25467–25488. doi:10.1029/2000JA000444
Otto, A., and Fairfield, D. H. (2000). Kelvin-Helmholtz Instability at the Magnetotail Boundary: MHD Simulation and Comparison with Geotail Observations. J. Geophys. Res. 105, 21175–21190. doi:10.1029/1999JA000312
Otto, A. (2008). Three-dimensional Simulation of Kelvin-Helmholtz Modes at the Magnetospheric Boundary. Eos Trans. AGU 89 (23).
Pollock, C., Moore, T., Jacques, A., Burch, J., Gliese, U., Saito, Y., et al. (2016). Fast Plasma Investigation for Magnetospheric Multiscale. Space Sci. Rev. 199, 331–406. doi:10.1007/s11214-016-0245-4
Pritchett, P. L. (2008). Collisionless Magnetic Reconnection in an Asymmetric Current Sheet. J. Geophys. Res. 113, A06210. doi:10.1029/2007JA012930
Pu, Z. Y., Yei, M., and Liu, Z. X. (1990). Generation of Vortex-Induced Tearing Mode Instability at the Magnetopause. J. Geophys. Res. 95, 10559–10566. doi:10.1029/JA095iA07p10559
Russell, C. T., Anderson, B. J., Baumjohann, W., Bromund, K. R., Dearborn, D., Fischer, D., et al. (2016). The Magnetospheric Multiscale Magnetometers. Space Sci. Rev. 199 (1-4), 189–256. doi:10.1007/s11214-014-0057-3
Schindler, K., Hesse, M., and Birn, J. (1988). General Magnetic Reconnection, Parallel Electric fields, and Helicity. J. Geophys. Res. 93 (A6), 5547–5557. doi:10.1029/JA093iA06p05547
Schulz, M., and Lanzerotti, L. J. (1974). “Particle Diffusion in the Radiation Belts,” in Physics and Chemistry in Space. Editors J. G. Roederer (New York, NY: Springer), 215. doi:10.1007/978-3-642-65675-0
Schwartz, S. J. (1998). “Shock and Discontinuity Normals, Mach Numbers, and Related Parameters,” in Analysis Methods for Multi-Spacecraft Data. Editors G. Paschmann, and P. W. Daly (ISSI Scientific Reports Series, ESA/ISSI), Vol. 1, 249–270. Available at: https://ui.adsabs.harvard.edu/abs/1998ISSIR...1..249S/abstract.
Sisti, M., Faganello, M., Califano, F., and Lavraud, B. (2019). Satellite Data‐Based 3‐D Simulation of Kelvin‐Helmholtz Instability and Induced Magnetic Reconnection at the Earth's Magnetopause. Geophys. Res. Lett. 46, 11597–11605. doi:10.1029/2019GL083282
Smith, M. F., and Rodgers, D. J. (1991). Ion Distributions at the Dayside Magnetopause. J. Geophys. Res. 96, 11617–11624. doi:10.1029/91JA00676
Song, P., and Russell, C. T. (1992). Model of the Formation of the Low-Latitude Boundary Layer for Strongly Northward Interplanetary Magnetic Field. J. Geophys. Res. 97, 1411–1420. doi:10.1029/91JA02377
Sonnerup, B. U. Ö. (1979). “Magnetic Field Reconnection,” in Solar System Plasma Physics. Editors C. F. Kennel, L. J. Lanzerotti, and E. N. Parker (Amsterdam: North-Holland Pub.), Vol. 3, 45–108.
Sorriso-Valvo, L., Catapano, F., Retinò, A., Le Contel, O., Perrone, D., Roberts, O. W., et al. (2019). Turbulence-driven Ion Beams in the Magnetospheric Kelvin-Helmholtz Instability. Phys. Rev. Lett. 122, 035102. doi:10.1103/PhysRevLett.122.035102
Stawarz, J. E., Eriksson, S., Wilder, F. D., Ergun, R. E., Schwartz, S. J., Pouquet, A., et al. (2016). Observations of Turbulence in a Kelvin-Helmholtz Event on 8 September 2015 by the Magnetospheric Multiscale Mission. J. Geophys. Res. Space Phys. 121, 11021–11034. doi:10.1002/2016JA023458
Vernisse, Y., Lavraud, B., Eriksson, S., Gershman, D. J., Dorelli, J., Pollock, C., et al. (2016). Signatures of Complex Magnetic Topologies from Multiple Reconnection Sites Induced by Kelvin‐Helmholtz Instability. J. Geophys. Res. Space Phys. 121, 9926–9939. doi:10.1002/2016JA023051
Vernisse, Y., Lavraud, B., Faganello, M., Fadanelli, S., Sisti, M., Califano, F., et al. (2020). Latitudinal Dependence of the Kelvin‐Helmholtz Instability and Beta Dependence of Vortex‐Induced High‐Guide Field Magnetic Reconnection. J. Geophys. Res. Space Phys. 125, e2019JA027333. doi:10.1029/2019JA027333
Wilder, F. D., Ergun, R. E., Schwartz, S. J., Newman, D. L., Eriksson, S., Stawarz, J. E., et al. (2016). Observations of Large-Amplitude, Parallel, Electrostatic Waves Associated with the Kelvin-Helmholtz Instability by the Magnetospheric Multiscale Mission. Geophys. Res. Lett. 43, 8859–8866. doi:10.1002/2016GL070404
Keywords: KHI, mid-latitude reconnection, ion beams, MMS satellite observations, flank magnetopause
Citation: Eriksson S, Ma X, Burch JL, Otto A, Elkington S and Delamere PA (2021) MMS Observations of Double Mid-Latitude Reconnection Ion Beams in the Early Non-Linear Phase of the Kelvin-Helmholtz Instability. Front. Astron. Space Sci. 8:760885. doi: 10.3389/fspas.2021.760885
Received: 19 August 2021; Accepted: 08 October 2021;
Published: 04 November 2021.
Edited by:
Takuma Nakamura, Austrian Academy of Sciences (OeAW), AustriaReviewed by:
Julia E. Stawarz, Imperial College London, United KingdomRungployphan Om Kieokaew, UMR5277 Institut de recherche en astrophysique et planétologie (IRAP), France
Copyright © 2021 Eriksson, Ma, Burch, Otto, Elkington and Delamere. This is an open-access article distributed under the terms of the Creative Commons Attribution License (CC BY). The use, distribution or reproduction in other forums is permitted, provided the original author(s) and the copyright owner(s) are credited and that the original publication in this journal is cited, in accordance with accepted academic practice. No use, distribution or reproduction is permitted which does not comply with these terms.
*Correspondence: Stefan Eriksson, ZXJpa3Nzb25AbGFzcC5jb2xvcmFkby5lZHU=