- 1Space and Atmospheric Physics Group, Blackett Laboratory, Imperial College London, London, United Kingdom
- 2Plasma Physics Group, Blackett Laboratory, Imperial College London, London, United Kingdom
Dayside magnetic reconnection between the interplanetary magnetic field and the Earth’s magnetic field is the primary mechanism enabling mass and energy entry into the magnetosphere. During favorable solar wind conditions, multiple reconnection X-lines can form on the dayside magnetopause, potentially forming flux ropes. These flux ropes move tailward, but their evolution and fate in the tail is not fully understood. Whilst flux ropes may constitute a class of flux transfer events, the extent to which they add flux to the tail depends on their topology, which can only be measured in situ by satellites providing local observations. Global simulations allow the entire magnetospheric system to be captured at an instant in time, and thus reveal the interconnection between different plasma regions and dynamics on large scales. Using the Gorgon MHD code, we analyze the formation and evolution of flux ropes on the dayside magnetopause during a simulation of a real solar wind event. With a relatively strong solar wind dynamic pressure and southward interplanetary magnetic field, the dayside region becomes very dynamic with evidence of multiple reconnection events. The resulting flux ropes transit around the flank of the magnetosphere before eventually dissipating due to non-local reconnection. This shows that non-local effects may be important in controlling the topology of flux ropes and is a complicating factor in attempts to establish the overall contribution that flux ropes make in the general circulation of magnetic flux through the magnetosphere.
Introduction
Magnetic reconnection is an important process in driving the dynamics of the Earth’s magnetosphere (e.g. Eastwood et al., 2017 and references therein). When the interplanetary magnetic field (IMF) is southward (IMF
FTEs are identified in spacecraft observations by their characteristic bipolar signature in magnetic field data, typically in the component normal to the magnetopause surface (Farrugia et al., 2016; Russell & Elphic, 1978). This signature may be indicative of rotational magnetic field structures called flux ropes. While flux ropes exist in a variety of locations, such as on the solar surface or within coronal mass ejections, FTEs are specifically flux ropes generated on at the Earth’s magnetopause, and range from
With the majority of FTEs observed on the dayside, little is known about their transition around the magnetosphere. The prevailing theory is that once reconnection forms an FTE, it is accelerated along the magnetopause surface towards the cusps by the
One of the main difficulties in understanding FTEs and their impact is due to the relative sparseness of spacecraft observations. Multi-spacecraft missions such as the Magnetospheric Multiscale Mission (MMS), Time History of Events and Macro-scale Interactions during Substorms (THEMIS), and Cluster have improved our understanding of FTE size and motion (Farrugia et al., 2016; Fear et al., 2005, Fear et al., 2008). In an FTE observed by MMS, it was found that there were two distinct electron populations within the FTE: one characteristic of originating from the magnetosphere, and the other from the magnetosheath, suggesting a single FTE can have a complex magnetic topology (Kacem et al., 2018). Whilst auroral signatures of FTEs have been observed, they are rarely accompanied with a spacecraft in the correct position to observe the FTE structure. Hence, global simulations of the magnetosphere, which capture the magnetosphere as a whole, can be very useful in understanding a number of FTE features, giving insights into their formation, evolution, topology and impact on the magnetosphere.
A number of papers have used global simulations to study FTEs and flux ropes. Though it is known that MHD cannot capture the full physics required for reconnection, it has been shown that global simulations do capture the location of reconnection at the dayside magnetopause relatively well (Komar et al., 2015). Raeder (2006) used OpenGGCM to investigate the effect of dipole tilt on the generation of FTEs. Under a strongly southward IMF, the FTEs were formed by multiple x-line reconnection, and was modulated by the dipole tilt. Cardoso et al. (2013)’s simulation of a steady, strong South- and duskward IMF, found elbow-shaped flux tubes. Other flux tubes were found to be interlinked with field lines of different topology. Perez et al. (2018) further reported a study showing a number of flux ropes spontaneously forming under constant solar wind parameters.
The majority of simulations studying this problem have used idealized solar wind events, with inflow parameters usually kept constant. In this article, the Gorgon code (Ciardi et al., 2007; Mejnertsen et al., 2016, 2018) is used to simulate flux ropes that are formed in response to a real interval of strongly southward IMF solar wind as observed by ACE and Cluster on March 31, 2001 (Maksimovic et al., 2003). By using a global simulation approach, the full three-dimensional structure of different flux ropes are found as a function of time. This allows their properties to be established, and their generation, transport and fate to be studied. Furthermore, their magnetic topology can be calculated, from which the amount of flux transferred into the magnetosphere can be inferred. The manuscript is organized as follows. In Methodology, we discuss the methodology, including the Gorgon MHD code and the properties of the solar wind on the day of interest. Overview of the Event Simulation provides an overview of the Simulation, and Identification of Flux Ropes Through Field Line Tracing and Topology Mapping describes in detail the methodology used to identify and study flux ropes at the magnetopause. Results presents the results of the flux rope analysis, and conclusions are summarized in Conclusion.
Methodology
The Gorgon MHD Code
In this work, we simulate the magnetosphere using the Gorgon 3D magnetohydrodynamic code. Gorgon was initially developed for studying high energy, collisional plasma interactions such as Z-pinches (Chittenden et al., 2004; Jennings, 2006; Jennings et al., 2010), laser-plasma interactions (Smith et al., 2007) and magnetic tower jets (Ciardi et al., 2007), but has recently been adapted to simulate planetary magnetospheres and their interaction with the solar wind (Desai et al., 2021; Eggington et al., 2020; Mejnertsen et al., 2016, 2018).
Gorgon uses a fully explicit, Eulerian formulation of the resistive MHD equations for a fully ionized hydrogen plasma, as given by Equations 1 to 6:
These equations describe the conservation of mass (1), momentum (2), proton energy (3), electron energy (4), the magnetic induction equation (5) and Ohms law (6), where
Because of its roots in high energy plasma physics, the MHD formulation in Gorgon is atypical. Firstly, it treats the electron and proton energy equations separately (Equations 3, 4), allowing them to be out of thermodynamic equilibrium. These equations include terms for Ohmic heating
Secondly, the magnetic field solver uses the vector potential representation of the magnetic field, on a staggered grid (Yee, 1966). This allows the magnetic divergence condition to be satisfied automatically to machine accuracy, without using divergence cleaning algorithms. It also allows the electromagnetic fields to propagate through a vacuum. In the code, a vacuum is defined by a threshold density, below which plasma properties forces are set to zero. Here, the fields propagate as vacuum solutions to Maxwell’s Equations.
Space plasmas are in general collisionless, meaning they have a very small resistivity and a broad applicability of the “frozen-in” flux theorem. Under ideal MHD, a process such as reconnection should not occur, as the fields cannot disassociate from the plasma. In numerical simulations, there is a numerical resistivity which allows the magnetic field to reconnect. This is dependent on the size of the grid. Whilst Gorgon is a resistive MHD code, this resistivity has been set to the Spitzer resistivity, which is lower than the numerical resistivity. A common approach in reconnection studies in global MHD simulations is to apply an anomalous resistivity (Komar et al., 2015), and has been found necessary when simulating substorms (Raeder et al., 2001). However, numerous simulations (Raeder, 2006; Cardoso et al., 2013; Perez et al., 2018) have shown that flux ropes can form with numerical resistivity, and anomalous resistivity has no impact on dayside reconnection (Raeder, 2006).
In this work, we use the same simulation as in Mejnertsen et al. (2018). We simulate a region spanning
March 31, 2001
The work in this article also uses the same solar wind parameters as in Mejnertsen et al. (2018), from March 31, 2001 17:14:00 – 19:34:00 UT. This interval was the subject of a case study by Maksimovic et al. (2003), who used four spacecraft Cluster observations to characterize the motion of the bow shock in response to variation in the solar wind inflow. Whereas Mejnertsen et al. (2018) focused on the motion of the outer boundaries over the whole 2 hour period, but reduced to the ecliptic and noon-midnight plane, in this chapter the focus is on the formation of FTEs over a shorter 20 min timeframe. For this, the full three-dimensional state of the simulation is sampled at 10 s intervals.
The full solar wind input to the simulation is shown in Figure 1. However, now the focus is on the analysis interval from
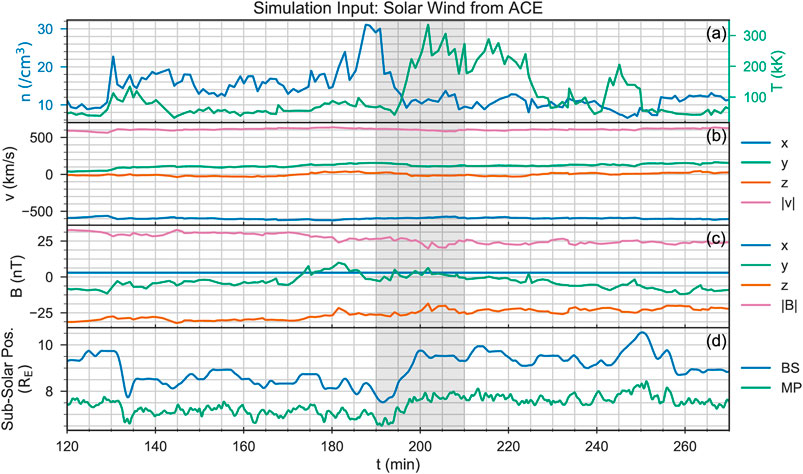
FIGURE 1. The solar wind input to the simulation, and the position of the bow shock and magnetopause in response. The shaded region denotes the region of interest during this chapter.
Overview of the Event Simulation
We first discuss the overall dynamics of the magnetopause during the 20 min interval of interest. The plasma number density in the ecliptic plane is shown in Figure 2 at 1.5 min intervals from
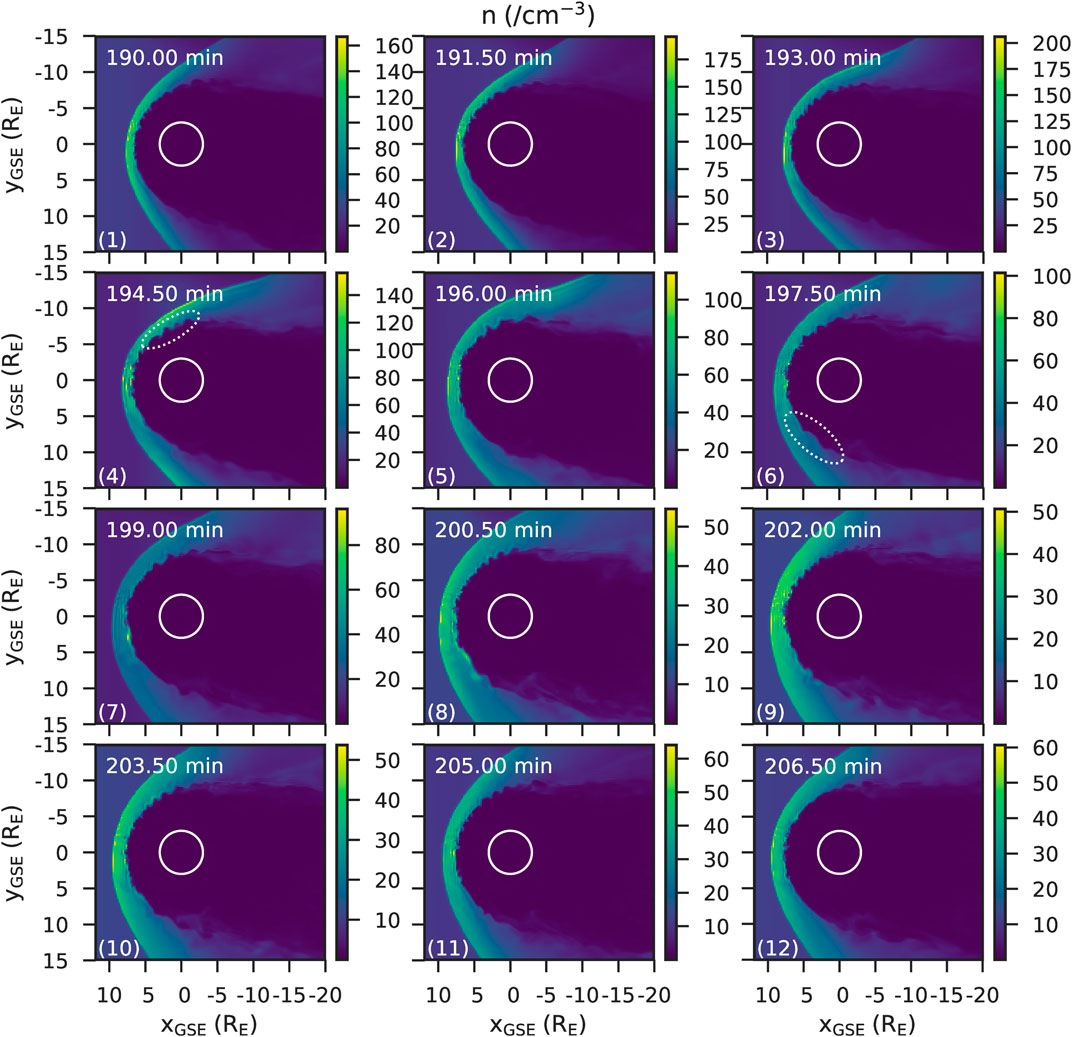
FIGURE 2. The number density in the ecliptic plane every 1.5 min from
This same variability in the structure of the magnetosphere can also be seen in the current density magnitude, as shown in Figure 3. The magnetopause current density magnitude is largest in the sub-solar region, and decreases down the flanks. Many of the structures seen in the number density (Figure 2) are also visible here. On the dawn side, the same oscillatory feature can be seen (indicated by the white dotted circle on Figure 3), as well as the bulges moving down the dusk-side flank. More structure can also be seen on the sub-solar magnetopause. For example, at
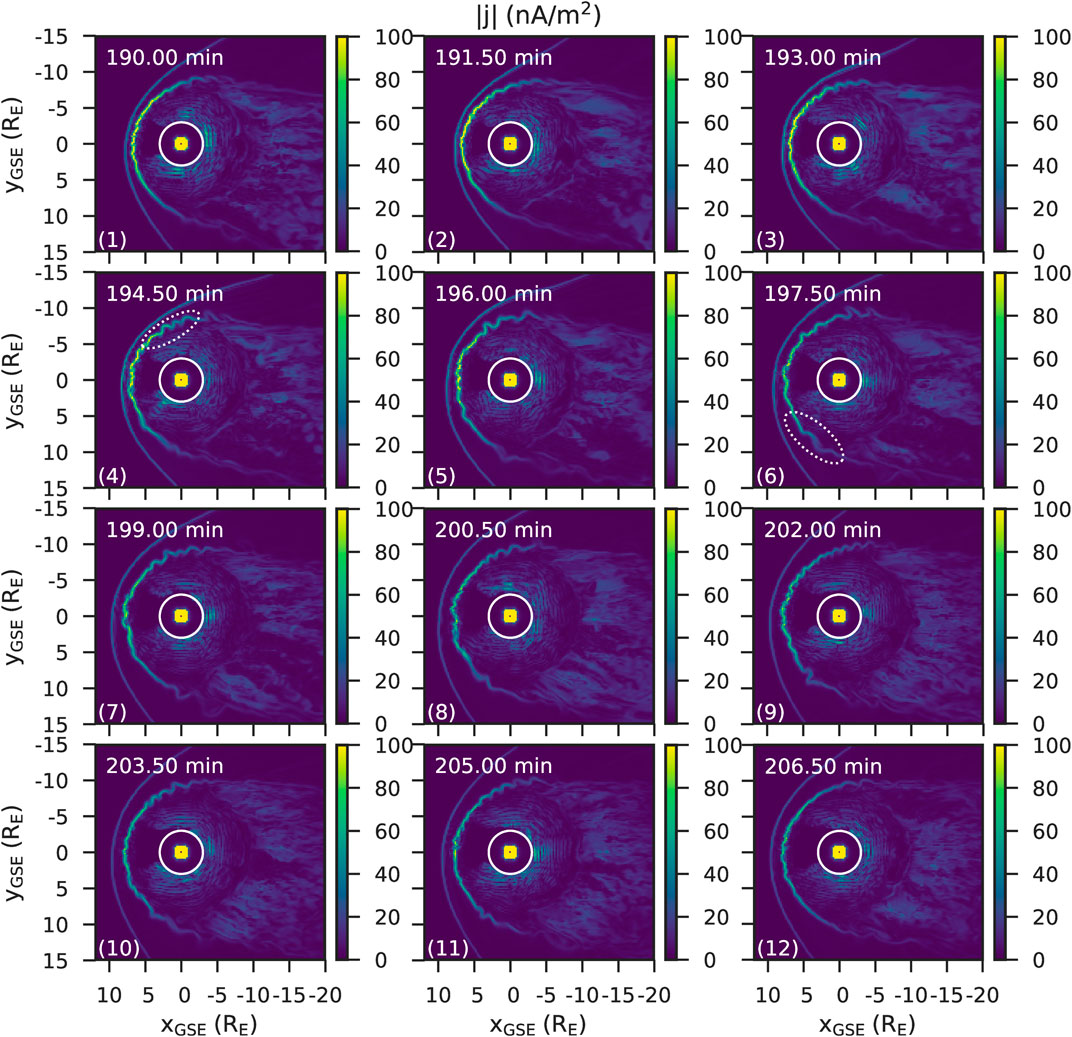
FIGURE 3. The magnitude of the current density in the ecliptic plane every 1.5 min from
Figure 2 and Figure 3 show that there are dynamic processes occurring on the magnetopause surface, which propagate down the flanks of the magnetosphere. We now discuss these features in more detail, finding that they are in fact caused by flux ropes associated with magnetic reconnection on the dayside magnetopause. We now describe the methodology used to identify flux ropes in the simulation before examining their properties in more detail.
Identification of Flux Ropes Through Field Line Tracing and Topology Mapping
In order to visualize magnetic field lines and understand the features of the magnetopause, in particular to identify flux ropes, streamlines are calculated from the magnetic field vector field. This is performed for two reasons. The first is to establish the existence of flux ropes based on identifying twisted field line structures, and the second is to examine flux rope topology. Flux ropes may be open (connected at one end to the ionosphere with the other end in the solar wind), closed (connected at both ends to either the ionosphere), or entirely contained within the solar wind.
The quality of stream-tracing is heavily dependent on its starting (seed) point. By under-sampling the magnetic field, visualizations can miss vital structure and dynamics. Ideally, there would be multiple seed points for every grid cell to ensure that every flux rope of interest is captured. In typical simulation grid sizes, this is computationally prohibitive. To render stream-tracing feasible, it is only performed in regions of interest, such as on the dayside or the nightside flank, as is shown in Figure 4.
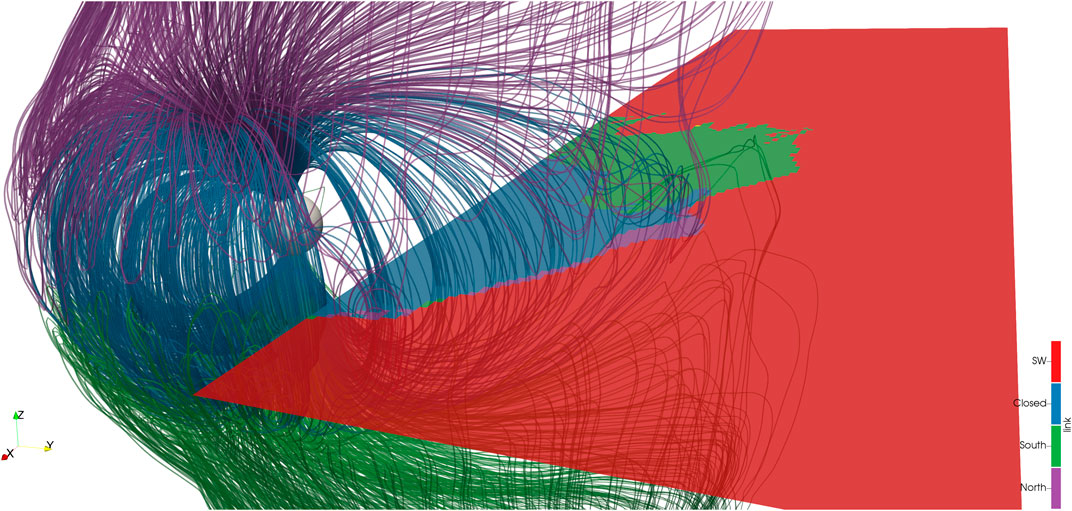
FIGURE4. An example of field line tracing and topology mapping. The magnetic field lines are colored by their topology: red for solar wind, blue for closed, green for open field lines connected to the South pole (magnetic North) and purple for open field lines connected to the North pole (magnetic South). The solar wind (red) field lines, which would dominate the view, have been filtered out. The slice shows the magnetic topology of cells along the ecliptic plane (
Since global simulations provide the full three-dimensional path of field lines, their topology can be found by categorizing the field line according to their end point location. In cases where both ends of the field line reaches the outer boundary, the field line is said to be part of the IMF, and is colored red. When both ends of the field line touch the inner boundary, it is said to be closed, and is colored blue. Open field lines occur when one end connects to the inner boundary, and the other to the outer boundary. Open field lines are further classified by which pole they reach: North (magnetic South) is purple, and South (magnetic North) is green. The final type of field line identified by the algorithm are so-called incomplete field lines, where one or both ends do not reach a simulation boundary. Computationally, the stream-tracer assign a finite number of steps to the streamline, so when the field line has not reached a boundary, it has likely run out of steps.
In order to filter out flux ropes from background magnetic field lines, the amount a field line twists or rotates is also computed. This measure of twist provides a way to isolate the twisted flux rope fields. The total rotation,
where
We note that the computation time can be decreased even further by removing the need to store every point in the field line and saving only the large-scale properties of each field line. This is used in topology mapping, where, for every seed point of interest, the field line is calculated to determine where it is connected to. An example of this is shown by the slice shown in Figure 4: a streamline is calculated from every position on that slice, and its topology is saved. This is then visualized on the slice.
By combining the topology mapping algorithm with calculations of the total rotation,
An illustration of the method is shown in Figure 5. In panel a, the field lines are drawn using seeds spread on a uniform spherical grid. Whilst it does show some structure - for example, the magnetic separator can be inferred by the region separating the South (green) from the North (purple) field lines, it is difficult to see flux ropes, and the IMF has been filtered out as otherwise it would obscure the view of the magnetopause. In contrast, panel b shows the field lines filtered by the rotation method. Flux ropes can more easily be seen, and since the IMF field is not filtered out, examples of all four field topologies is visible.
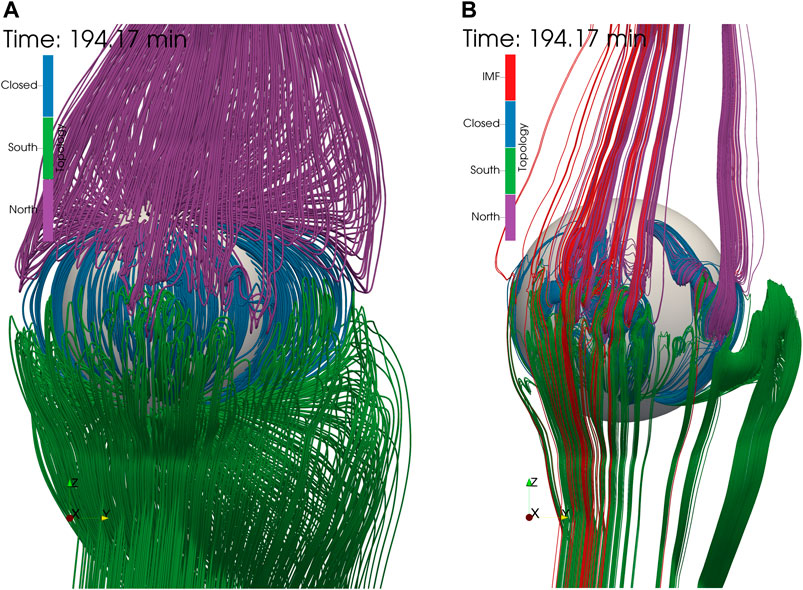
FIGURE 5. By filtering field lines by rotation, flux rope structure can more easily be seen. Panel (A) shows field lines drawn from a regular spherical grid. Panel (B) shows field lines drawn from positions on the simulation grid with a high enough rotation,
Results
Generation of Flux Ropes on the Dayside Magnetopause
Using the flux rope identification method described previously, Figure 6 shows the existence of flux ropes on the dayside magnetopause during the interval of interest. As in Identification of Flux Ropes Through Field Line Tracing and Topology Mapping, magnetic field lines are colored by their topology: red for IMF, blue for closed, purple for open and connected to the North pole, and green for open and connected to the South pole. The reconnection region, approximately denoted by the orange ellipse in Figure 6, shows a complex entanglement of open, closed and IMF field lines, which can vary significantly over the 10 s time period. Out of the tangled reconnection region, distinct flux ropes propagate out along the magnetopause surface, predominantly along the dawn and dusk directions. They are generated with the flux rope axis parallel to the azimuthal direction, as is expected. These flux ropes start off relatively small, approximately
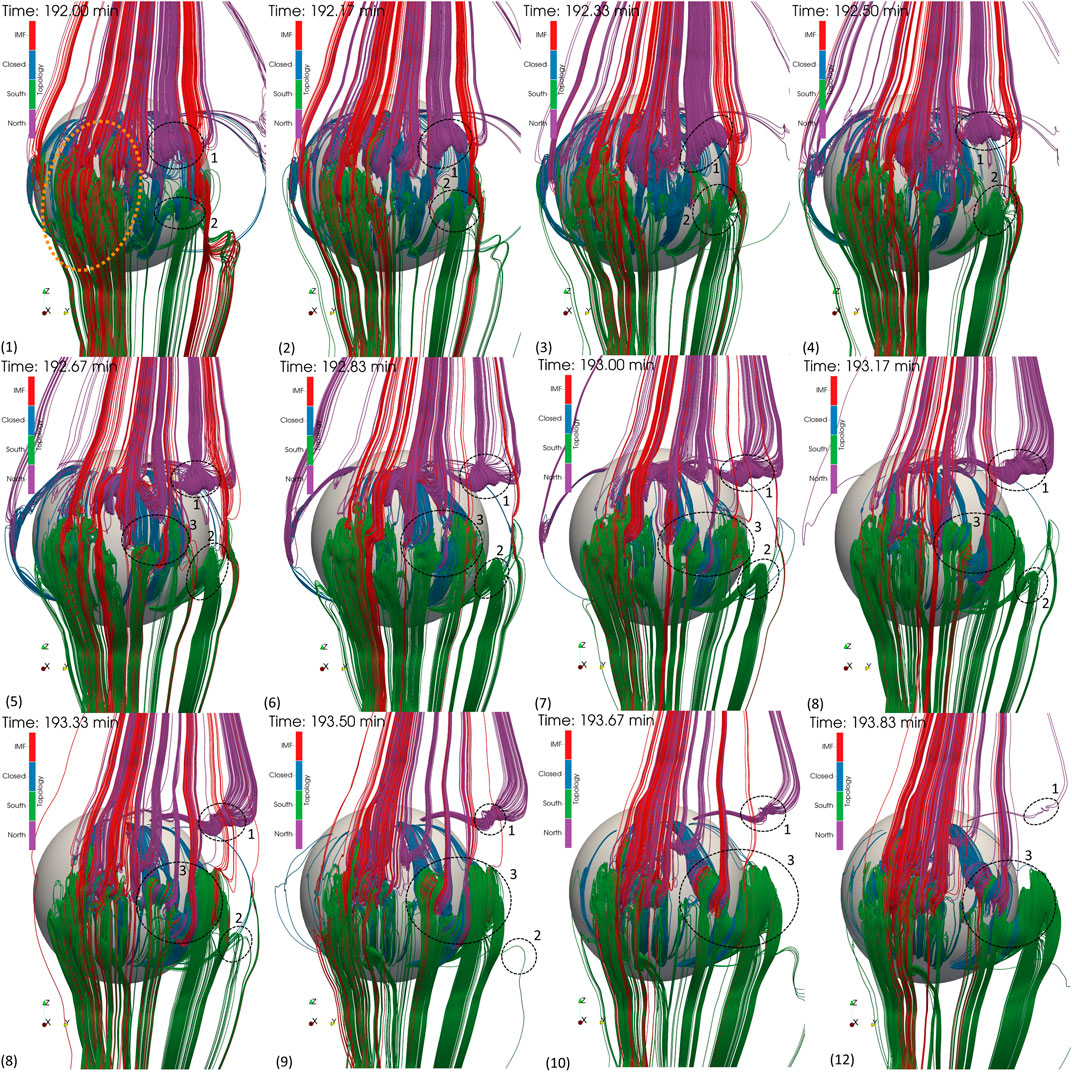
FIGURE 6. Flux Ropes generated on the dayside magnetopause. With each panel, time increases by 10 s field lines are filtered by their total rotation, showing only flux rope like structures on the magnetopause surface. Behind the flux ropes is a
From the first timestep at
At a later time
To make sense of the magnetopause reconnection region, the magnetopause surface is plotted in Figure 7. In panel (a), a three-dimensional iso-contour at

FIGURE 7. A view of the magnetopause from the magnetosheath, showing its magnetic field properties and plasma motion, and potential regions of reconnection and plasma. The left panel (A) shows the
Flux Rope Evolution
Figure 8 shows a three-dimensional view of the dusk flank of the magnetopause. Two flux ropes are tracked, flux ropes 3 and 4, which due to their differing topology evolve differently as they travel down the flanks.
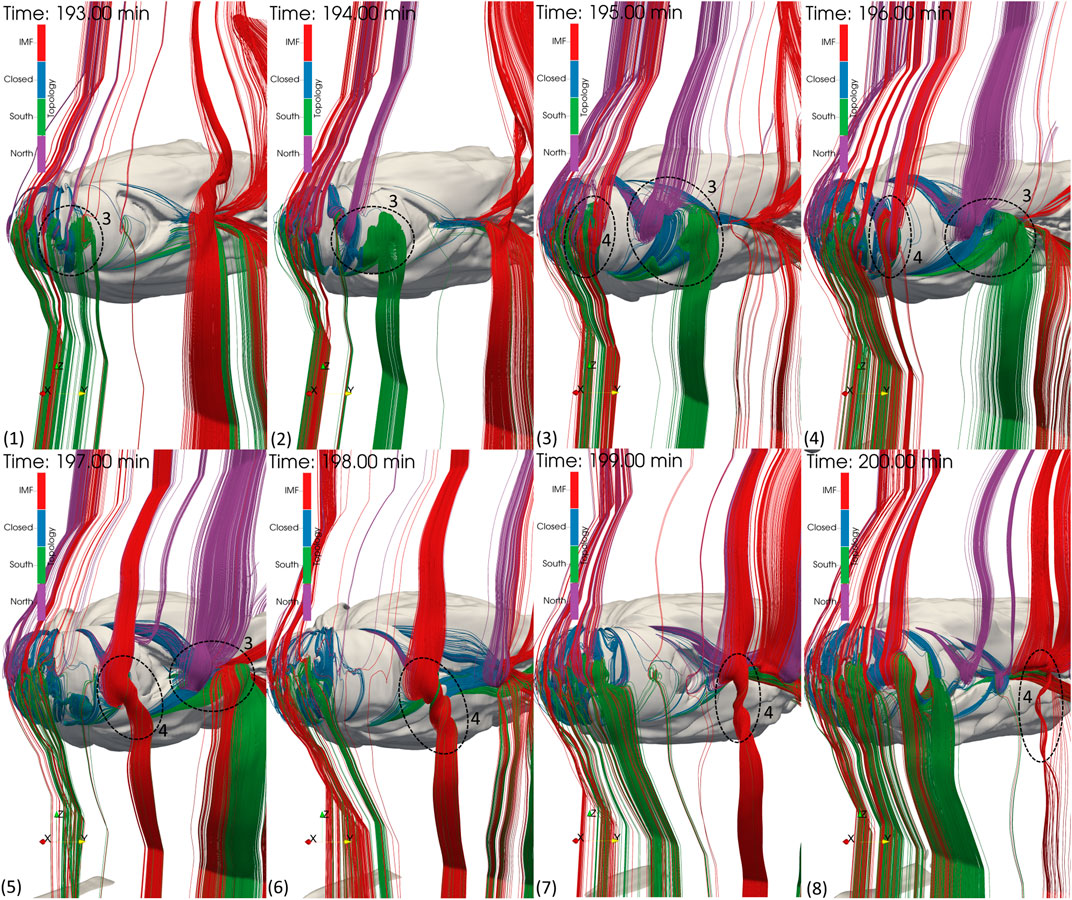
FIGURE 8. Flux ropes travelling down the dusk flank. With each panel, time increases by 1 min. Magnetic field lines are filtered by their total rotation, showing only flux rope like structures on the magnetopause surface. To filter out the inner magnetosphere, a number density contour of
Flux rope 3, first seen in Figure 6, moves down the flank for approximately 6 min until it begins to dissipate at
Flux rope four can be seen being generated in Figure 8, and contains a mix of all types of topology: closed, IMF, North- and South-open. Unlike flux rope 3, the two regions of opposite open topology do not separate, but remain as one flux rope. As flux rope four travels down the flank, its axis rotates from being in the ecliptic plane, to parallel to the
Both flux ropes three and four behave differently as they travel down the flank due to their differing magnetic topology. However, both flux ropes dissipate shortly after reaching the nightside reconnection region. This can be seen in Figure 9, which shows slices of the simulation in the ecliptic plane as flux ropes three and four reach the tail reconnection region, with each row increasing in time by 30 s. The first column 1) shows current density magnitude, the middle 2) shows the total rotation of the magnetic field, and the right 3) shows the magnetic topology of the slice. In the topology plots (column c), the closed field line region can be seen by the blue region. The green region, connected to the South pole, essentially shows the tail reconnection region. The flank magnetopause is the region duskward of the blue and green regions, which coincides with the current sheet shown in column (a). Flux ropes three and four are shown as islands of purple, North connected, magnetic field lines, marked with circles.
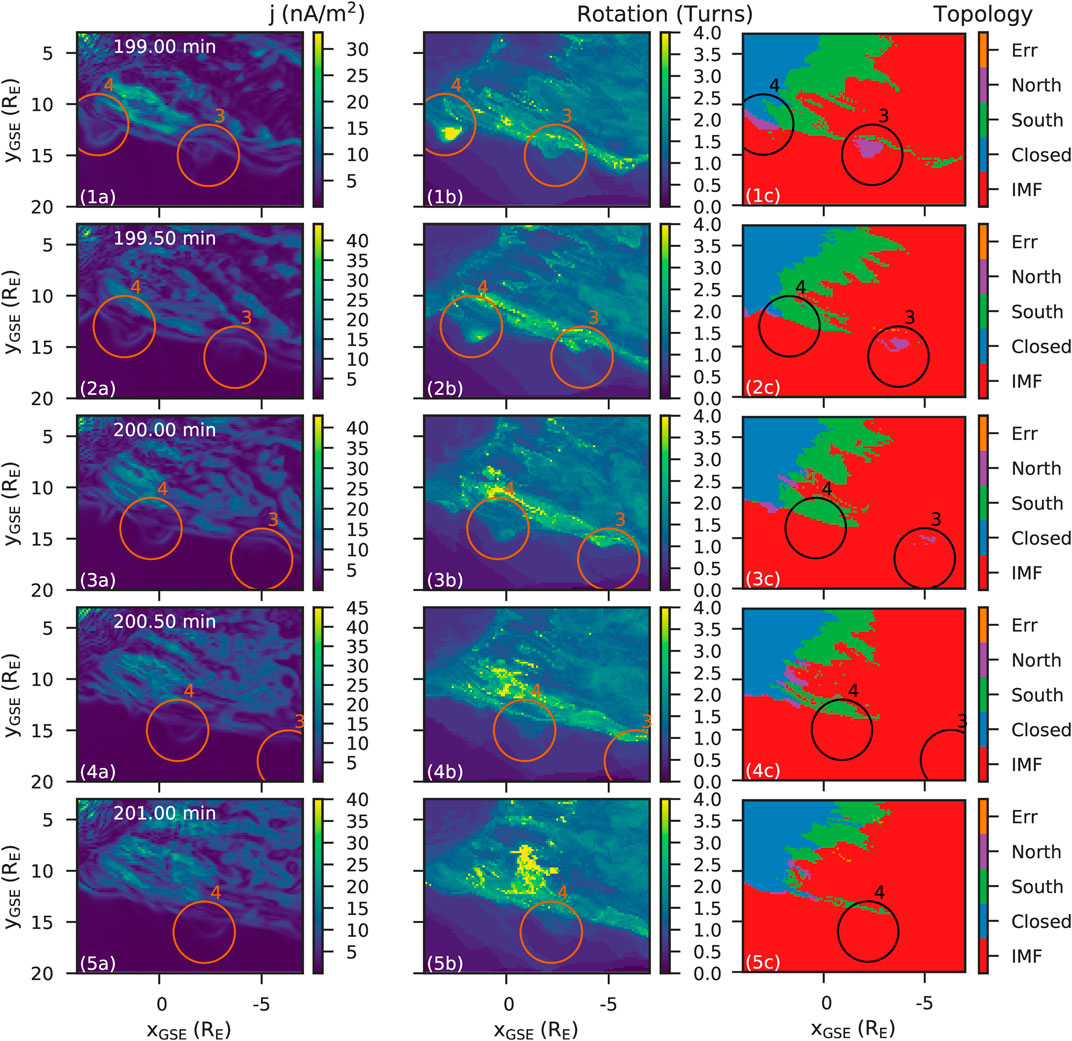
FIGURE 9. The dissipation of flux ropes past the nightside reconnection region. Each panel shows a slice in the ecliptic plane
Row 1 shows flux rope four just approaching the tail reconnection region, where blue meets green (panel 1c). 30 s later, in row 2, the purple region has disappeared replaced by red. However, the flux rope is still there, as seen by the structure in the current (2a), as the high amount of rotation (2b). As time increases (rows three–5), flux rope four remains connected to the IMF, but continues to be twisted, as shown in column b be its enhanced total rotation. Its total rotation does decrease with time, suggesting the flux rope is unravelling.
A similar process occurs with flux rope 3, except that the open field line region persists long after the reconnection region. In the first timestep shown in Figure 9, the purple, open field region has already passed the reconnection region. In subsequent time-steps, the purple region appears to dissipate, converting to red (IMF). This is due to the same reason as flux rope 4: reconnection occurs in the tail reconnection region, upstream of the flux rope rather than at the flux rope.
This process is shown in Figure 10. Viewing the dusk magnetotail from the
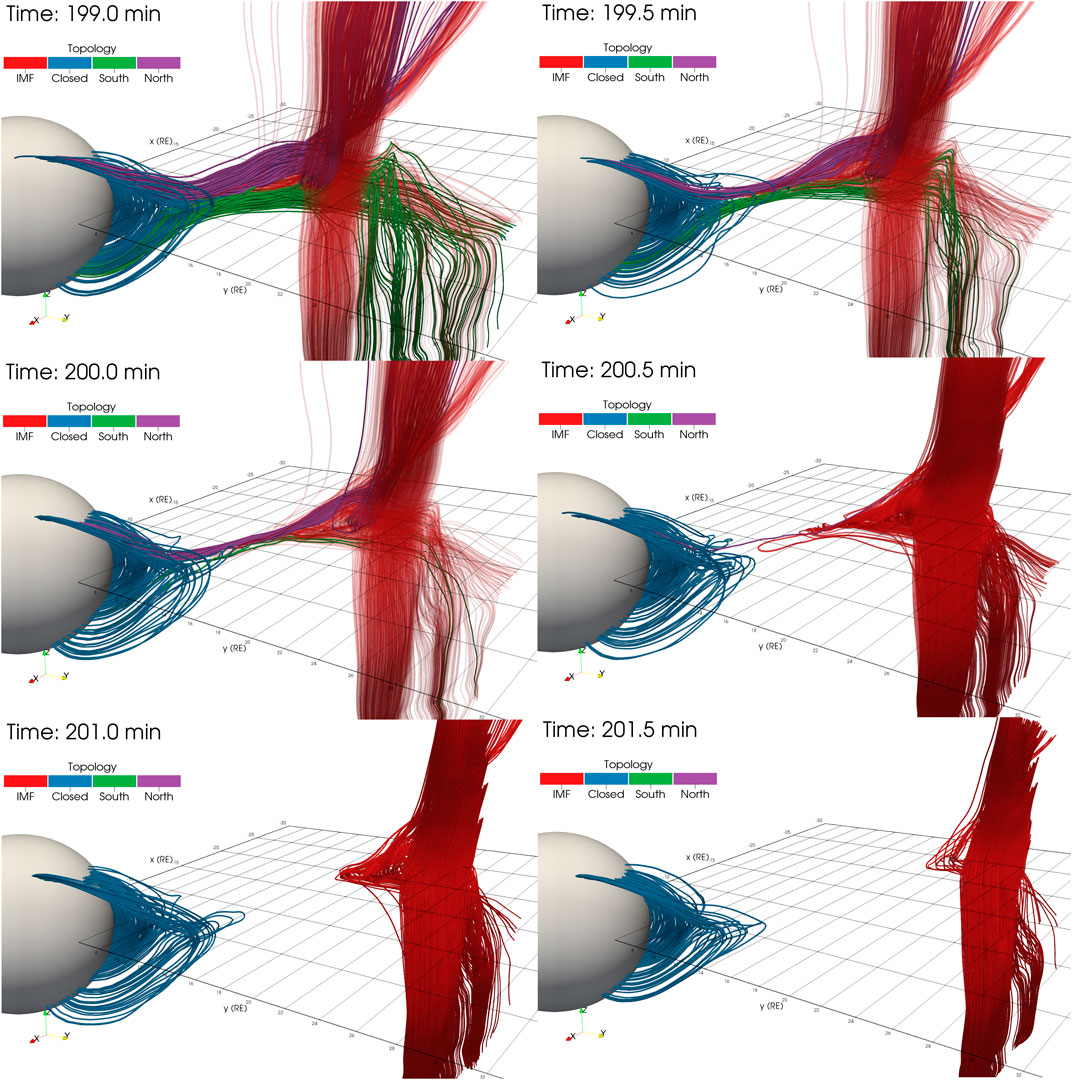
FIGURE 10. The evolution of flux rope three past the nightside reconnection region. The field lines have been drawn so only flux rope three is seen, along with the associated closed field line region. Each panel shows a grid in the ecliptic plane
In Figure 10, two main field line regions are shown: the flux rope and the closed field line region. In between there are elongated field lines with a large
Figure 11 shows the same field lines and sphere as Figure 10, except that they are colored by the plasma
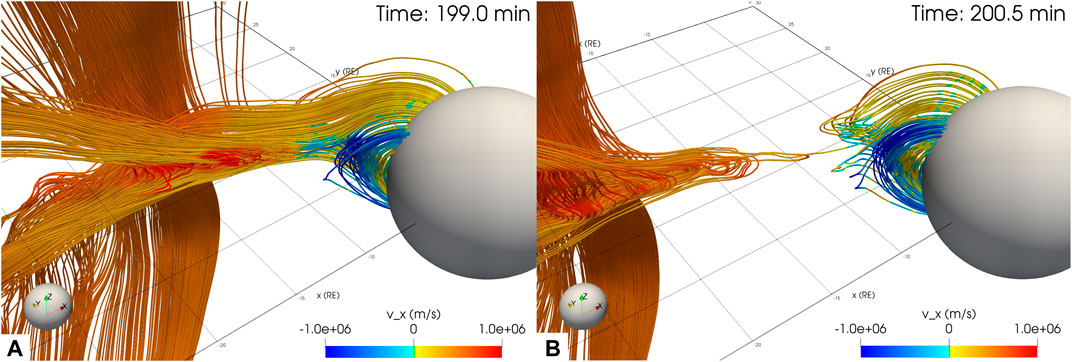
FIGURE 11. The dissipation of flux ropes past the nightside reconnection region. Each panel is 1.5 min apart, and shows a view onto the dusk magnetotail of flux rope three.
Conclusion
In this work, we have studied the evolution of flux ropes generated by a real solar wind event using the Gorgon global MHD simulation. The event, observed by Cluster on 2001-03-31, creates several flux ropes on the dayside, which propagate along magnetopause flanks. These flux ropes were identified using a novel magnetic field line filtering method based on computing their total rotation. While the method allowed for effective identification of tightly wound flux ropes, it may miss smaller flux ropes.
The flux ropes are formed on the dayside magnetopause surface, where the strongly southward IMF reconnects with the magnetospheric field. Overlapping the highly warped magnetopause current layer, there exists a complex interlaced set of field lines whose topologies vary from closed to open to completely IMF. This is due to time-dependent reconnection along multiple x-lines on the magnetopause. Out of this complex interwoven dayside field region emerge stand-alone flux ropes which propagate along the magnetopause surface. However, the latitude of their path is dependent on their topology. Flux ropes which are completely open - they are solely connected to a single pole (North/purple or South/green) - tend to move along the magnetopause at high latitudes. These flux ropes would be the equivalent to the classic flux rope evolution picture where they move towards the cusps. No flux ropes were observed to go directly over the cusps.
Flux ropes containing both closed and open field lines connected to both the North and South poles were also generated on the dayside and remain along the ecliptic plane at low latitudes throughout their evolution. In the classic cusp flux rope picture, the
This behavior is interesting because it shows that flux rope topology can change during its lifetime as a consequence of reconnection at locations far from the flux rope itself. It may also suggest that flux ropes on the flanks of the magnetopause may be more likely to be topologically disconnected from the ionosphere, (although this is tensioned against a possibly shorter lifetime). FTEs have previously been shown to create ionospheric signatures (e.g. Sandholt et al. (1986); Milan et al. (1999); Wild et al. (2001); Fear et al. (2009)), and so these ionospheric signatures may only partially represent the magnetopause dynamics, particularly away from the dayside. This behavior has further implications for the amount of flux that flux ropes transfer into the magnetosphere. Further work is required to establish how common these changes in topology are for different solar wind conditions, so as to better constrain the extent to which flux rope topologies observed on the dayside correspond to those subsequently found on the nightside.
In the simulated event, no flux ropes were found to transit along the dawnward flank. One potential reason for this is that the flux ropes on the dawnside magnetopause exhibit a total rotation of less than the threshold 8π, and were filtered out. The other reason could be due to the specific solar wind conditions, whose combination of solar wind and IMF parameters could predispose the flux ropes to transit along the duskward flanks. To fully determine the impact of solar wind and IMF parameters on the direction of transit, a thorough study of different solar wind conditions should be performed.Resistivity is an important aspect in simulating reconnection events and flux rope dynamics. In the Gorgon code, a low resistivity is inherent in the simulation due to numerical resistivity caused by the grid resolution. Previous studies of reconnection in Global MHD simulations have found that enhanced resistivity, either through coarse grid resolutions or an artificial resistivity, prevents the formation of FTEs and causes them to diffuse away rapidly (Komar et al., 2013; Raeder, 2006). With the introduction of an artificial resistivity in the Gorgon code, we would expect similar results with fewer flux ropes generated. Those that do generate are likely to dissipate due to resistive diffusion: this is likely unphysical due to the collisionless nature of magnetospheric plasmas.
One potentially fruitful avenue for future work may be to focus on comparing multi-spacecraft observations of flux ropes (e.g. MMS, THEMIS and Cluster) with global simulations using the same solar wind input, particularly where the local topology can be measured. This would allow the evolution of flux rope topology to be explored experimentally. These results may also be relevant for the SMILE mission, where imaging of the dayside magnetopause is expected to shed new light on the role of flux ropes and FTEs in global magnetospheric dynamics.
Data Availability Statement
The raw data supporting the conclusions of this article will be made available by the authors, without undue reservation.
Author Contributions
LM generated the data using the simulation code and analysed the data to produce the results presented. JE provided valuable insight into the direction of the work and its impact. JC is one of the authors of the Gorgon simulation code and provided valuable insight into the validity of the results within the context of the simulation.
Funding
The authors acknowledge support from UKRI Natural Environment Research Council (NERC) Grants NE/P017142/1 (SWIGS) and NE/P017347/1 (Rad-Sat). LM also acknowledges the support of UKRI Science and Technology Facilities Council (STFC) Studentship ST/M503538/1.
Conflict of Interest
The authors declare that the research was conducted in the absence of any commercial or financial relationships that could be construed as a potential conflict of interest.
Publisher’s Note
All claims expressed in this article are solely those of the authors and do not necessarily represent those of their affiliated organizations, or those of the publisher, the editors and the reviewers. Any product that may be evaluated in this article, or claim that may be made by its manufacturer, is not guaranteed or endorsed by the publisher.
Acknowledgments
This work used the Imperial College London High Performance Computing Service (doi: 10.14469/hpc/2232).
References
Cardoso, F. R., Gonzalez, W. D., Sibeck, D. G., Kuznetsova, M., and Koga, D. (2013). Magnetopause Reconnection and Interlinked Flux Tubes. Ann. Geophys. 31 (10), 1853–1866. doi:10.5194/angeo-31-1853-2013
Chittenden, J. P., Lebedev, S. V., Jennings, C. A., Bland, S. N., and Ciardi, A. (2004). X-ray Generation Mechanisms in Three-Dimensional Simulations of Wire Array Z-Pinches. Plasma Phys. Control Fusion 46 (12B), B457–B476. doi:10.1088/0741-3335/46/12B/039
Ciardi, A., Lebedev, S. V., Frank, A., Blackman, E. G., Chittenden, J. P., Jennings, C. J., et al. (2007). The Evolution of Magnetic tower Jets in the Laboratory. Phys. Plasmas 14 (5), 056501. doi:10.1063/1.2436479
Desai, R. T., Freeman, M. P., Eastwood, J. P., Eggington, J. W. B., Archer, M. O., Shprits, Y. Y., et al. (2021). Interplanetary Shock‐Induced Magnetopause Motion: Comparison between Theory and Global Magnetohydrodynamic Simulations. Geophys. Res. Lett. 48. doi:10.1029/2021GL092554
Dungey, J. W. (1961). Interplanetary Magnetic Field and the Auroral Zones. Phys. Rev. Lett. 6 (2), 47–48. doi:10.1103/PhysRevLett.6.47
Eastwood, J. P., Nakamura, R., Turc, L., Mejnertsen, L., and Hesse, M. (2017). The Scientific Foundations of Forecasting Magnetospheric Space Weather. Space Sci. Rev. 212 (3–4), 1221–1252. doi:10.1007/s11214-017-0399-8
Eastwood, J. P., Phan, T. D., Fear, R. C., Sibeck, D. G., Angelopoulos, V., Øieroset, M., et al. (2012). Survival of Flux Transfer Event (FTE) Flux Ropes Far along the Tail Magnetopause. J. Geophys. Res. 117 (A8), a–n. doi:10.1029/2012JA017722
Eggington, J. W. B., Eastwood, J. P., Mejnertsen, L., Desai, R. T., and Chittenden, J. P. (2020). Dipole Tilt Effect on Magnetopause Reconnection and the Steady‐State Magnetosphere‐Ionosphere System: Global MHD Simulations. J. Geophys. Res. Space Phys. 125 (7). doi:10.1029/2019JA027510
Farinas Perez, G., Cardoso, F. R., Sibeck, D., Gonzalez, W. D., Facskó, G., Coxon, J. C., et al. (2018). Generation Mechanism for Interlinked Flux Tubes on the Magnetopause. J. Geophys. Res. Space Phys. 123 (2), 1337–1355. doi:10.1002/2017JA024664
Farrugia, C. J., Lavraud, B., Torbert, R. B., Argall, M., Kacem, I., Yu, W., et al. (2016). Magnetospheric Multiscale Mission Observations and Non-force Free Modeling of a Flux Transfer Event Immersed in a Super-alfvénic Flow. Geophys. Res. Lett. 43 (12), 6070–6077. doi:10.1002/2016GL068758
Fear, R. C., Fazakerley, A. N., Owen, C. J., and Lucek, E. A. (2005). A Survey of Flux Transfer Events Observed by Cluster during Strongly Northward IMF. Geophys. Res. Lett. 32 (18), a–n. doi:10.1029/2005GL023811
Fear, R. C., Milan, S. E., Fazakerley, A. N., Fornaçon, K.-H., Carr, C. M., and Dandouras, I. (2009). Simultaneous Observations of Flux Transfer Events by THEMIS, Cluster, Double Star, and SuperDARN: Acceleration of FTEs. J. Geophys. Res. 114 (10), a–n. doi:10.1029/2009JA014310
Fear, R. C., Milan, S. E., Fazakerley, A. N., Lucek, E. A., Cowley, S. W. H., and Dandouras, I. (2008). The Azimuthal Extent of Three Flux Transfer Events. Ann. Geophys. 26 (8), 2353–2369. doi:10.5194/angeo-26-2353-2008
Fear, R. C., Milan, S. E., Fazakerley, A. N., Owen, C. J., Asikainen, T., Taylor, M. G. G. T., et al. (2007). Motion of Flux Transfer Events: a Test of the Cooling Model. Ann. Geophys. 25 (7), 1669–1690. doi:10.5194/angeo-25-1669-2007
Fedder, J. A., Slinker, S. P., Lyon, J. G., and Russell, C. T. (2002). Flux Transfer Events in Global Numerical Simulations of the Magnetosphere. J. Geophys. Res. 107 (A5), 1–11. doi:10.1029/2001JA000025
Fu, H. S., Vaivads, A., Khotyaintsev, Y. V., Olshevsky, V., André, M., Cao, J. B., et al. (2015). How to Find Magnetic Nulls and Reconstruct Field Topology with MMS Data?. J. Geophys. Res. Space Phys. 120 (5), 3758–3782. doi:10.1002/2015JA021082
Jennings, C. A., Cuneo, M. E., Waisman, E. M., Sinars, D. B., Ampleford, D. J., Bennett, G. R., et al. (2010). Simulations of the Implosion and Stagnation of Compact Wire Arrays. Phys. Plasmas 17 (9), 092703. doi:10.1063/1.3474947
Jennings, C. A. (2006). Radiation Transport Effects in Wire Array Z Pinches and Magneto-Hydrodynamic Modelling Techniques. Doctoral dissertation. Imperial College London.
Kacem, I., Jacquey, C., Génot, V., Lavraud, B., Vernisse, Y., Marchaudon, A., et al. (2018). Magnetic Reconnection at a Thin Current Sheet Separating Two Interlaced Flux Tubes at the Earth's Magnetopause. J. Geophys. Res. Space Phys., 1–15. doi:10.1002/2017JA024537
Kane Yee, K. (1966). Numerical Solution of Initial Boundary Value Problems Involving maxwell's Equations in Isotropic media. IEEE Trans. Antennas Propagat. 14 (3), 302–307. doi:10.1109/TAP.1966.1138693
Komar, C. M., Cassak, P. A., Dorelli, J. C., Glocer, A., and Kuznetsova, M. M. (2013). Tracing Magnetic Separators and Their Dependence on IMF Clock Angle in Global Magnetospheric Simulations. J. Geophys. Res. Space Phys. 118 (8), 4998–5007. doi:10.1002/jgra.50479
Komar, C. M., Fermo, R. L., and Cassak, P. A. (2015). Comparative Analysis of Dayside Magnetic Reconnection Models in Global Magnetosphere Simulations. J. Geophys. Res. Space Phys. 120 (1), 276–294. doi:10.1002/2014JA020587
Maksimovic, M., Bale, S. D., Horbury, T. S., and André, M. (2003). Bow Shock Motions Observed with CLUSTER. Geophys. Res. Lett. 30 (7), 41–46. doi:10.1029/2002GL016761
Mejnertsen, L., Eastwood, J. P., Chittenden, J. P., and Masters, A. (2016). Global MHD Simulations of Neptune's Magnetosphere. J. Geophys. Res. Space Phys. 121 (8), 7497–7513. doi:10.1002/2015JA022272
Mejnertsen, L., Eastwood, J. P., Hietala, H., Schwartz, S. J., and Chittenden, J. P. (2018). Global MHD Simulations of the Earth's Bow Shock Shape and Motion under Variable Solar Wind Conditions. J. Geophys. Res. Space Phys. 123 (1), 259–271. doi:10.1002/2017JA024690
Milan, S. E., Lester, M., Greenwald, R. A., and Sofko, G. (1999). The Ionospheric Signature of Transient Dayside Reconnection and the Associated Pulsed Convection Return Flow. Ann. Geophys. 17 (9), 1166–1171. doi:10.1007/s00585-999-1166-2
Paschmann, G., Haerendel, G., Papamastorakis, I., Sckopke, N., Bame, S. J., Gosling, J. T., et al. (1982). Plasma and Magnetic Field Characteristics of Magnetic Flux Transfer Events. J. Geophys. Res. 87 (A4), 2159. doi:10.1029/JA087iA04p02159
Raeder, J. (2006). Flux Transfer Events: 1. Generation Mechanism for strong Southward IMF. Ann. Geophys. 24 (1), 381–392. doi:10.5194/angeo-24-381-2006
Raeder, J., Wang, Y. L., Fuller-Rowell, T. J., and Singer, H. J. (2001). Global Simulation of Magnetospheric Space Weather Effects of the Bastille Day Storm. Solar Phys. 204 (1/2), 323–337. doi:10.1023/A:1014228230714
Russell, C. T., and Elphic, R. C. (1978). Initial ISEE Magnetometer Results: Magnetopause Observations. Space Sci. Rev. 22 (6), 681–715. doi:10.1007/BF00212619
Sandholt, P. E., Deehr, C. S., Egeland, A., Lybekk, B., Viereck, R., and Romick, G. J. (1986). Signatures in the Dayside aurora of Plasma Transfer from the Magnetosheath. J. Geophys. Res. 91 (A9), 10063. doi:10.1029/JA091iA09p10063
Smith, R. A., Lazarus, J., Hohenberger, M., Marocchino, A., Robinson, J. S., Chittenden, J. P., et al. (2007). High Resolution Imaging of Colliding Blast Waves in Cluster media. Plasma Phys. Control Fusion 49 (12B), B117–B124. doi:10.1088/0741-3335/49/12B/S11
Wang, Z., Fu, H. S., Vaivads, A., Burch, J. L., Yu, Y., and Cao, J. B. (2020). Monitoring the Spatio-Temporal Evolution of a Reconnection X-Line in Space. ApJ 899 (2), L34. doi:10.3847/2041-8213/abad2c
Wild, J. A., Cowley, S. W. H., Davies, J. A., Khan, H., Lester, M., Milan, S. E., et al. (2001). First Simultaneous Observations of Flux Transfer Events at the High-Latitude Magnetopause by the Cluster Spacecraft and Pulsed Radar Signatures in the Conjugate Ionosphere by the CUTLASS and EISCAT Radars. Ann. Geophys. 19 (10/12), 1491–1508. doi:10.5194/angeo-19-1491-2001
Keywords: flux rope, reconnection, flux transfer events, magnetosphere (magnetospheric configuration and dynamics), global modelling
Citation: Mejnertsen L, Eastwood JP and Chittenden JP (2021) Control of Magnetopause Flux Rope Topology by Non-local Reconnection. Front. Astron. Space Sci. 8:758312. doi: 10.3389/fspas.2021.758312
Received: 13 August 2021; Accepted: 04 October 2021;
Published: 05 November 2021.
Edited by:
Xochitl Blanco-Cano, National Autonomous University of Mexico, MexicoReviewed by:
Huishan Fu, Beihang University, ChinaTieyan Wang, Rutherford Appleton Laboratory, United Kingdom
Copyright © 2021 Mejnertsen, Eastwood and Chittenden. This is an open-access article distributed under the terms of the Creative Commons Attribution License (CC BY). The use, distribution or reproduction in other forums is permitted, provided the original author(s) and the copyright owner(s) are credited and that the original publication in this journal is cited, in accordance with accepted academic practice. No use, distribution or reproduction is permitted which does not comply with these terms.
*Correspondence: Lars Mejnertsen, bGFycy5tZWpuZXJ0c2VuMTBAaW1wZXJpYWwuYWMudWs=
 Lars Mejnertsen
 Jonathan P. Eastwood
 Jeremy P. Chittenden2