
95% of researchers rate our articles as excellent or good
Learn more about the work of our research integrity team to safeguard the quality of each article we publish.
Find out more
REVIEW article
Front. Astron. Space Sci. , 02 August 2021
Sec. Space Physics
Volume 8 - 2021 | https://doi.org/10.3389/fspas.2021.721350
This article is part of the Research Topic Advances in Space Plasma Turbulence: Theory and Observations View all 7 articles
If MHD turbulence is a dominant process acting in the solar wind between the Sun and 1 AU, then the destruction and regeneration of structure in the solar-wind plasma is expected. Six types of solar-wind structure at 1 AU that are not destroyed by turbulence are examined: 1) corotating-interaction-region stream interfaces, 2) periodic density structures, 3) magnetic structure anisotropy, 4) ion-composition boundaries and their co-located current sheets, 5) strahl-intensity boundaries and their co-located current sheets, and 6) non-evolving Alfvénic magnetic structure. Implications for the solar wind and for turbulence in the solar wind are highlighted and a call for critical future solar-wind measurements is given.
Turbulence in the solar wind should have multiple impacts on the plasma and magnetic structure between the Sun and 1 AU: heating of the particle populations, mixing (chunk-size evolution followed by homogenization), flux-tube shredding, destruction of structure from the Sun, and a constant annihilation and recreation of its own structures.
The quasi-two-dimensional component of MHD turbulence is eddy like in its fluid motion and it is anticipated that this will give rise to eddy transport in the plasma (Matthaeus et al., 1995; Pucci et al., 2016). Much of the action of turbulence should occur on a nonlinear or eddy-turnover timescale τeddy and much of the action is manifested by eddy diffusion or eddy viscosity with coefficients Deddy. Simple estimates using the rms velocity-fluctuation amplitude δv of the solar wind and the fluctuation correlation length Lcorr (Matthaeus et al., 1994; Borovsky, 2006) yield (for δv ∼10 km/s and Lcorr ∼1 × 10⁶ km at 1 AU) τeddy = Lcorr/δv ∼30 h and Deddy = Lcorrδv ∼1 × 10⁷ km2/s. If the magnetic-fluctuation energy is also accounted for (e.g. Yoshizawa and Yokoi, 1996; Yokoi and Hamba, 2007; Yokoi et al., 2008), then faster nonlinear timescales and stronger eddy diffusion are estimated. In the highly Alfvénic regions of the solar wind more-proper estimates replace δv with the rms amplitude of inward-Elsasser fluctuations δZin (Dobrowolny et al., 1980).
There have been a few indications that the action of turbulence in the solar wind is not as robust as expected. 1) Mixing is a universal process in turbulence (Liepmann, 1979; Ottino, 1990; Paul et al., 2003; Dimotakis, 2005) involving first the stretching and folding of structure (mesomixing) and then the homogenization of the medium (micromixing). By statistically comparing the plasma “chunk” sizes near 0.3 AU with the plasma chunk sizes near 1 AU, an analysis (Borovsky, 2012a) to quantify the amount of mixing of the solar wind plasma under the action of stretching and folding found no evidence for mixing by stretching and folding. (“Stretching and folding” is the evolution of passive structures in an irregular turbulent flow field that is the stretching of the structure by the action of the strain field and the folding of the structure by gradients in the vorticity field (Ottino, 1990; Muzzio et al., 1991; Buch and Dahm, 1996); cf. Figure 9 of Corrsin (1959)) The same study found no evidence for homogenization of the solar-wind plasma by turbulence. Hence, no evidence for the action of mixing by turbulence. 2) Numerical investigations into MHD turbulence find concentrated dissipation of energy occurring at intermittent current-sheet structures in the turbulent plasma (Servidio et al., 2011; Karimabadi et al., 2013). Searches for proton heating at solar-wind current sheets (Borovsky and Denton, 2011) and at solar-wind velocity shears (Borovsky and Steinberg, 2014), as measured by an increase in the proton specific entropy, found no evidence for localized heating. (Note that this result is contradicted by studies using the proton temperature instead of entropy as an indication for localized heating (Osman et al., 2011, 2012; Wang et al., 2013)) 3) For an MHD-turbulence energy cascade to occur, the presence of both inward and outward propagating Alfvén waves must be present (Verdini et al., 2009; Perez and Boldyrev, 2010; Stawarz et al., 2010), with the amplitudes of the inward waves characterized by the inward Elsasser variable Zin. The solar-wind data analysis of Wang et al. (2018) finds that two dominant sources of Zin in solar-wind measurements are 1) measurement noise and 2) non-propagating convective structures in the plasma. The implications of these three findings are collected into Table 1.

TABLE 1. Implications for solar-wind turbulence raised by the findings of the non-destruction of solar-wind structures.
If turbulence is the dominant physical process occurring in the solar wind, then one should expect to find a generalized destruction of solar-origin structure between the Sun and 1 AU and a constant destruction and regeneration of turbulence-origin structure. In this report examples will be given of six types of structures in the solar wind that are not destroyed by turbulence. These structures are 1) CIR stream interfaces, 2) periodic density structures, 3) compression- and rarefaction-driven magnetic-structure anisotropies, 4) alpha-to-proton ion-composition boundaries and their current sheets, 5) electron-strahl-intensity boundaries and their current sheets, and 6) non-evolving Alfvénic magnetic structure. The survival of these various types of structures should raise questions about turbulence in the solar wind and about the impact of turbulence on the evolution of the solar wind.
In the next section six types of structure that are not destroyed by turbulence are examined and in the final section questions about the nature of the solar wind are raised and a call is made for critical solar-wind measurements.
Six types of structures that survive to 1 AU are examined using measurements from the 3DP (Lin et al., 1995), SWE (Ogilvie et al., 1995), and MFI (Lepping et al., 1995) instruments on the WIND spacecraft and the SWEPAM (McComas et al., 1998) and MAG (Smith et al., 1998) instruments on the ACE spacecraft. Structure beyond 1 AU is examined using the VHM (Vector Helium Magnetometer) (Balogh et al., 1992) instrument on the Ulysses spacecraft. The implications of these structures surviving to 1 AU are summarized in Table 1.
At the edge of a coronal hole or coronal hole extension, there is a boundary at the Sun between fast coronal-hole-origin plasma and slower streamer-belt-origin plasma (Crooker and Gosling, 1999; Gosling and Pizzo, 1999; Krista et al., 2011). This is a vorticity boundary. Away from the Sun, on the leading edge of the coronal hole the faster solar wind moving radially outward from the coronal hole overtakes the slower solar wind from the streamer belt and forms a region of plasma compression: a corotating interaction region (CIR). At 1 AU the duration of the CIR compression as it advects past a spacecraft is about 1 day. In a CIR at 1 AU there is typically a well-known sharp boundary making the transition from streamer-belt-origin plasma to coronal-hole-origin plasma known as the CIR stream interface, and this boundary is typically co-located with an abrupt vorticity layer. In time-series solar-wind measurements, the locations of stream interfaces can be identified by various signatures: the reversal of the East-West compressional flow deflection of the solar wind (McPherron and Weygand, 2006), the peak of the total (particle plus magnetic field) pressure (Jian et al., 2006), a sudden increase in the proton specific entropy (Siscoe and Intriligator, 1993; Lazarus et al., 2003), a sudden change in the heavy-ion charge-state composition (Wimmer-Schweingruber et al., 1997; Crooker and McPherron, 2012), or the peak in the plasma vorticity (velocity shear) (Borovsky and Denton, 2010). Note that some CIRs have more than one abrupt step in velocity: for example the CIR shown in Figure 1 of Borovsky (2006) has two large abrupt steps in velocity rather than a single step. The single, double, or multiple shear cases might be owed to the morphology of the boundary on the Sun between the fast-wind coronal hole and the solar region producing slower wind. In the discussion of this subsection, only CIRs with a single step are considered.
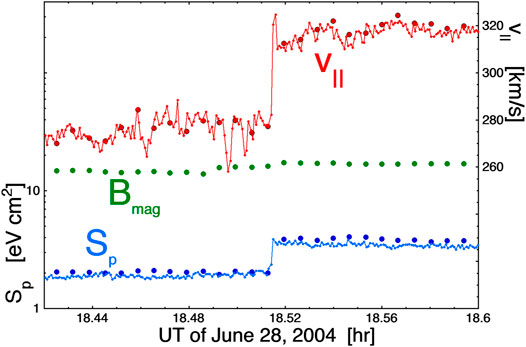
FIGURE 1. An example of a very thin stream interface on June 28, 2004 at 1 AU. Using 3-s resolution (small points) and 15-s resolution (large points) measurements from the WIND spacecraft, the proton specific entropy Sp and the magnetic-field strength Bmag [nT] are logarithmically plotted with the left axis and the component of the solar-wind flow velocity v|| parallel to the local Parker-spiral direction is plotted linearly on the right axis. Each 3-s point is separated by ∼700 km in the direction perpendicular to the Parker-spiral orientation.
Rotating into the local Parker-spiral coordinate system (Borovsky, 2006) which, at 1 AU, is at an angle θ = arctan((405 km/s)/vr) with respect to the radial direction, the vorticity component of interest is ω = dv||/dx⊥, where v|| is the flow component along the Parker-spiral direction and x⊥ is the distance perpendicular to the Parker-spiral direction. At 1 AU the CIR vorticity layer is often less than 1 min thick as seen by a spacecraft, and sometime much thinner. The age of that shear layer at 1 AU is about (1.5 × 10⁸ km)/(400 km/s) = 104 h, with the plasma in the slow-wind side of the shear being older than 104 h and the plasma on the fast-wind side of the shear being younger than 104 h. An example of a very thin stream-interaction vorticity layer at 1 AU observed by the WIND spacecraft is shown in Figure 2. The small points are 3-s resolution measurements and the large points are 24-s measurements from the WIND 3DP instrument and the WIND MFI instrument. Plotted in blue (logarithmically, left axis) is the proton specific entropy Sp = Tp/np2/3 of the solar wind. At 18.514 UT (18:31 UT) an abrupt jump in Sp is seen. Simultaneously an abrupt increase in the proton flow velocity v|| along the Parker-spiral direction is seen (red, right axis). The widths of the shear layer and entropy boundary are about 1000 km in the direction perpendicular to the Parker spiral. Note that the magnetic field strength (green, left axis) does not change across this velocity shear.
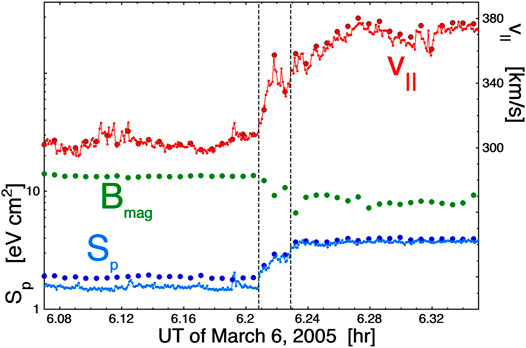
FIGURE 2. A stream interface on March 6, 2005 at 1 AU is marked with two vertical dashed lines. Using 3-s resolution (small points) and 15-s resolution (large points) measurements from the WIND spacecraft, the proton specific entropy Sp and the magnetic-field strength Bmag [nT] are logarithmically plotted with the left axis and the component of the solar-wind flow velocity v|| parallel to the local Parker-spiral direction is plotted linearly on the right axis. The separation between the vertical dashed lines is ∼20000 km perpendicular to Parker-spiral orientation.
In Figure 3 a less-abrupt stream interface is examined, again with 3-s and 24-s measurements from the WIND spacecraft. The black vertical dashed lines demark the width of the stream interface, as measured by the transition of the proton specific entropy between the plasmas. Here the stream-interface width is about 2 × 10⁴ km perpendicular to the Parker-spiral direction.
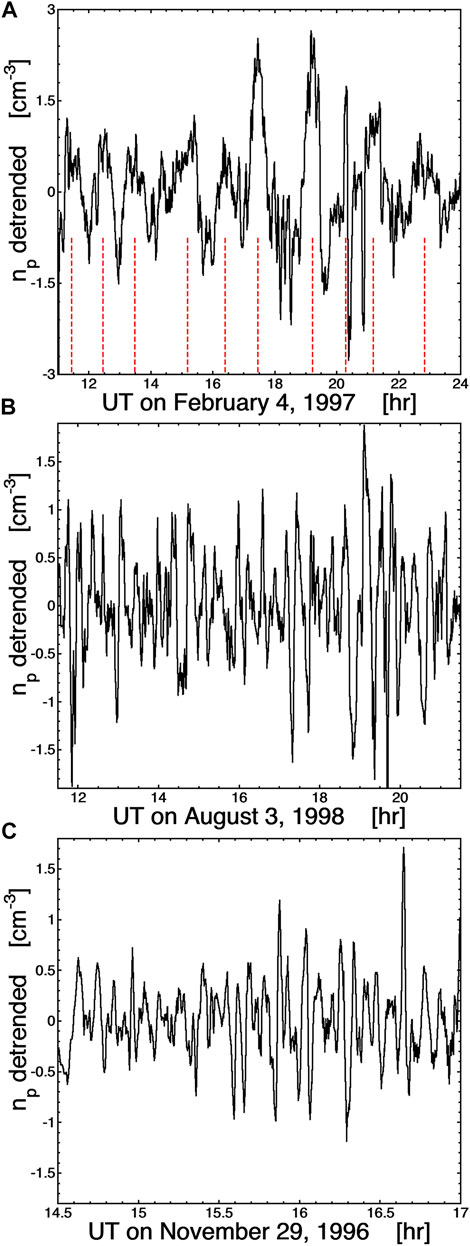
FIGURE 3. The detrended number density of the solar wind at 1 AU is plotted as a function of time on three different days when periodic density structures are seen by the WIND spacecraft. The periodicities are approximately 70 min in panel (A), 18 min in panel (B), and 7 min in panel (C).
In Figures 2, 3, the vorticity layers that are thought to originate at the Sun as the fast-slow wind boundary are intact at 1 AU, with no substantial spreading, and with no evidence of Sp being transported from one side of the velocity shear to the other.
Borovsky (2006) in examining the minute-or-so thickness of stream-interface shear layers noted that thicknesses of ∼104 km are consistent with Bohm diffusion acting over the ∼100-h lifetime of the solar-wind plasma. Arguments presented in Borovsky (2006) for MHD eddy viscosity (using the full fluctuation amplitude of the solar wind velocity and magnetic field and the typical correlation timescales) would produce spreading of the shear layers that are several orders of magnitude larger than 104 km in the 100-h lifetime of the solar wind. Similarly, Borovsky and Denton (2010) estimated the eddy-diffusion spreading width W⊥ in CIRs corresponding to the age of the solar wind at 1 AU and found that spreading width to be W⊥ ∼ 2 × 10⁶ km (about 2 h in duration in the solar-wind time series), which is two orders of magnitude wider than the ∼1-min-thick vorticity layers.
Borovsky and Denton (2010) in examining the statistical properties of the solar-wind fluctuations across CIRs found that there was no systematic enhancement in the fluctuation amplitude within CIRs as might be expected if large-scale velocity shear was driving solar-wind turbulence. Rather, they found a quasi-monotonic transition of the fluctuation properties (amplitude, spectral indices, Alfvénicity, inward and outward Zin and Zout Elsasser properties, etc.) across CIRs from the characteristic properties of slow wind to the characteristic properties of the coronal-hole-origin fast wind. They concluded that there was not evidence for the driving of solar-wind turbulence in CIRs. Note that Borovsky and Denton (2010) only examined CIRs with a single prominent velocity shear so that they had no ambiguity in choosing a vorticity signature for the zero epoch of their superposed epoch analysis. In contrast to the Borovsky and Denton (2010) findings of no turbulence driving, Smith et al. (2011), based on an analysis of a quasi-equal balance of Zin and Zout inside of a CIR in comparison with the dominance of Zout outside of the CIR, concluded that there is driving of turbulence within CIRs. (For MHD turbulence to be occurring both inward Zin and outward Zout Alfven waves must be present (e.g. Kraichnan, 1965; Dobrowolny et al., 1980): normally in the solar wind the amplitude of inward Alfven waves are weak, even in the noise of the measurements (e.g. Wang et al., 2018), and so an equal balance of inward and outward Alfven waves would indicate robust turbulence.) (See also Bavassano and Bruno (1992) on Zin in CIRs.) Borovsky and Denton (2010) (Fig. 16) also examined the Zin and Zout amplitudes across CIRs and, in contrast, found smooth transitions in the amplitudes across the CIRs from the systematic values in slow wind to the systematic values in fast wind; they found no enhancement of Zin within the CIRs.
A question to consider is: If solar-wind turbulence id driven by large-scale shears in the solar wind (Bavassano and Bruno, 1989; Roberts et al., 1992; Goldstein et al., 1995) then why do these classic prominent shears survive to 1 AU? Note that an argument the shear is thinning because of compression is probably invalid since 1) it will be shown later in this Section that the CIR volume compression is only about a factor of 2 and 2) the net expansion of the solar wind still overpowers the CIR compression of the solar-wind plasma (cf. Figure 4 of Hundhausen (1973)).
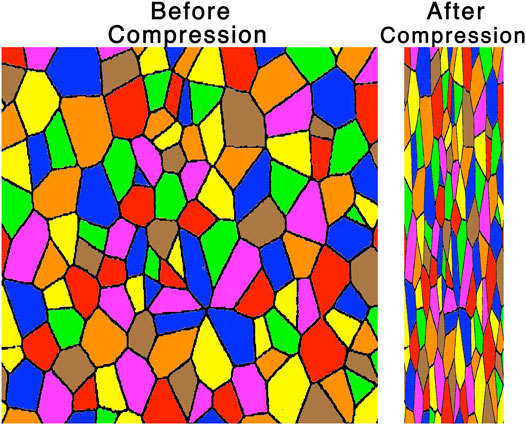
FIGURE 4. A sketch of the pattern of current sheets (black lines) forming the walls of magnetic flux tubes as viewed looking along the Parker-spiral direction. In the left panel the pattern is viewed in uncompressed solar wind and in the right panel the plasma has been compressed (horizontally) by a factor of 4.
Periodic solar-wind structures with wavelengths in the “inertial subrange” of spatial structures survive to 1 AU without being destroyed by turbulence (Kepko et al., 2002; Kepko and Spence, 2003; Viall et al., 2009a; Di Matteo et al., 2019; Kepko and Viall, 2019; Birch and Hargreaves, 2020a,b).
These periodic solar-wind structures were first identified by examining the solar wind at Earth when spacecraft in the magnetosphere indicated that the magnetosphere was undergoing periodic compressions (Kepko et al., 2002); the solar-wind periodic structures are also responsible for periodic variations of the total electron content of the Earth’s ionosphere (Birch and Hargreaves, 2020a). Periodic density oscillations are found typically in slow solar wind with periods in the range of 4–140 min, corresponding to radial wavelengths of 8 × 10⁴–3 × 10⁶ km (Viall et al., 2008; Kepko et al., 2020), which are in the inertial range of scalesizes. Viall et al. (2009b) reports a periodic-structure interval wherein the alpha-to-proton number-density ratio α/p oscillates with the proton number density: the ion composition α/p variation is a firm indication that the number-density oscillation has its origin at the Sun. Indeed, the emission from the Sun of periodic density structures has been white-light imaged above the corona and out into the inner heliosphere (Viall et al., 2010; Viall and Vourlidas, 2015; DeForest et al., 2018). Proton number-density periodic structures are seen to persist in the solar wind well past 1 AU (Birch and Hargreaves, 2020b).
Three examples of periodic density structures in the solar wind at 1 AU (from the collection of events in Kepko and Spence (2003)) are plotted in Figure 4. In each panel the detrended proton number density np as measured by the 3DP instrument on the WIND spacecraft is plotted, with detrending preformed by subtracting off a running average from the time series np(t). The detrending gives the density oscillation a zero mean makes the plotted periodicity and amplitude easier to see. The three events are from three different days. In Figure 4A a low-frequency periodic structure with a period of ∼70 min is seen (13 h plotted and density peaks marked with vertical red dashed lines), in Figure 4B a higher-frequency periodic structure with a period of ∼18 min is seen (11 h plotted), and in Figure 4C an even higher-frequency periodic structure with a period of ∼7 min is seen (2.5 h plotted). For each of the three panels of Figure 4 the observed periods were also identified by Kepko and Spence (2003) as localized peaks in the temporal Fourier transform of the non-detrended time series np(t).
Viall et al. (2021) review observations of periodic density structure moving outward from the corona into the inner heliosphere and review ideas about the solar origin of the periodic structure. They argue that various periodic (in space and in time) reconnection processes in the corona could be responsible for the creation of the density structures with various temporal periods: e.g. tearing instabilities (Reville et al., 2020), coronal acoustic oscillations driving reconnection (Pylaev et al., 2017), and growth-instability-release cycles for helmet streamers (Allread and MacNeice, 2015).
Examination has found that when the solar-wind plasma is unidirectionally compressed or rarefied the magnetic structure takes on an anisotropy and that anisotropy does not appear to evolve back to isotropy as it should if turbulence was destroying and re-creating the magnetic structure. This is seen by analyzing the current-sheet orientations in the magnetic structure.
Figure 5 depicts the compression of the magnetic structure of the solar wind, with a Voronoi tessellation (Okabe et al., 2000) representing a cut through the spaghetti of magnetic flux tubes in the solar wind plasma. On the left is the Voronoi pattern representing the magnetic structure before the plasma is compressed, with the various flux-tube interiors shaded in different colors and with the current-sheet walls of the flux tubes denoted in black. The right panel of Figure 5 depicts the Voronoi pattern after it is compressed in the horizontal direction by a factor of 4. Note the systematic flattening of the flux tubes by the compression and the systematic change in the orientations of the current sheets.
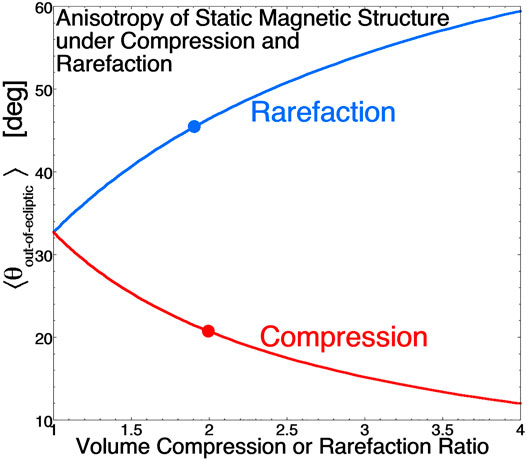
FIGURE 5. For purely cylindrical (circular) flux tubes in the solar wind, the mean angle between the flux-tube-wall normal and the ecliptic plane is plotted as a function of the volume compression ratio (red curve) and as a function of the volume rarefaction ratio (blue curve).
When a spacecraft crosses a current sheet in the solar wind, the time series of magnetic-field measurements can be used to determine the orientation of the sheet using the cross-product method (Burlaga and Ness, 1969; Knetter et al., 2004; Borovsky, 2008). At 1 AU the orientations of the normals to the strong current sheets of the solar wind are approximately isotropic perpendicular to the Parker-spiral direction (Borovsky, 2008). (Here, “strong” means that the magnetic-field rotation angle across the current sheet is about 30° or larger (cf. Borovsky, 2008)). This is consistent with cylindrical-shaped magnetic flux tubes that are approximately aligned with the Parker-spiral direction (Borovsky, 2010), although the flux-tube cross sections should look more like a Voronoi cell rather than being circular. In compressed or rarefacted solar wind at 1 AU, the current-sheet orientations are no longer consistent with cylinders, but show a flattening of the flux-tube cross sections. Using a cylindrical-tube model, Figure 6 shows the expected anisotropy of the current sheets as a function of the amount of compression or rarefaction. If in the absence of compression or rarefaction the flux tubes are cylindrical (round), then a spacecraft going through these tubes would find that the mean angle between the current-sheet normals and the ecliptic plane would be 32.7° (cf. Fig. A1 of Borovsky and Denton, 2016). This value is plotted in Figure 6 for the volume compression or volume rarefaction factor being 1. The red curve in Figure 6 for compression shows that as the amount of compression increases the mean angle of the current-sheet normals from the ecliptic plane for squashed cylinders becomes less as the flux tubes flatten. The blue curve in Figure 6 for rarefaction shows that the greater the amount of rarefaction the greater the mean angle is from the ecliptic plane as the cross sections of the flux tubes are stretched.
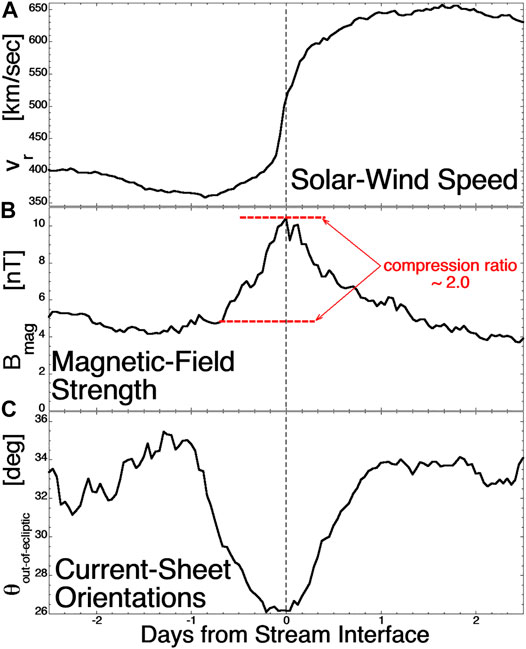
FIGURE 6. Superposed epoch averages of ACE measurements of 27 corotating interaction regions at 1 AU. Panel (A) plots the solar-wind speed, panel (B) plots the magnetic-field strength, and panel (C) plots the mean value of the angle between the normals of observed current sheets in the plasma and the ecliptic plane.
Figures 7, 8 demonstrate this effect for compressions and rarefactions of the solar wind. Figure 7 plots superposed-epoch averages for 27 corotaing interaction regions as measured by the SWEPAM and MAG instruments on the ACE spacecraft. The zero epoch (vertical dashed line) in Figure 7 is the time that the CIR stream interface (located by the peak in the vorticity) passes ACE. The CIR spans the time from about −1 day to about +1 day. Figure 7A plots the radial flow velocity of the solar wind: a transition is made from slow solar wind on the left to fast (coronal hole) solar wind on the right. Figure 7B plots the superposed average of the magnetic-field strength Bmag. Bmag can be used as a measure of the compression normal to the Parker-spiral direction in the CIR. Comparing Bmag in the uncompressed slow solar wind about 1 day before the passage of the stream interface (lower red dashed curve) to the peak value of Bmag in the CIR (upper red dashed curve) yields an amplification of Bmag by a factor of 2.0, which corresponds to a volume compression factor of 2.0. This value is marked in Figure 6 by a large red point, which corresponds to a predicted mean angle of current-sheet normals of 20.7°. In Figure 7C the superposed average of the measured current-sheet orientations in the solar wind is plotted. Before the CIR compression and after the CIR compression the mean angle is in the ballpark of 32°, as expected for isotropic orientations of the current sheets. At the center of the CIR where the plasma has been compressed by a volume compression factor of about 2.0, the mean angle has decreased from about 32° to about 26°.
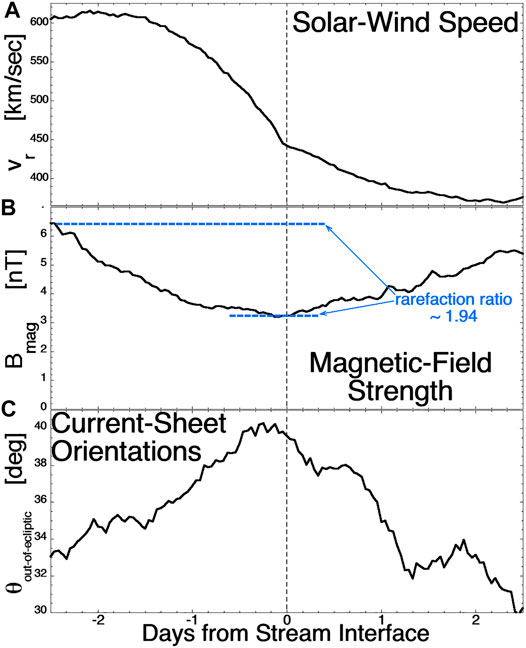
FIGURE 7. Superposed epoch averages of ACE measurements of 54 trailing-edge rarefaction regions following high-speed streams at 1 AU. Panel (A) plots the solar-wind speed, panel (B) plots the magnetic-field strength, and panel (C) plots the mean value of the angle between the normals of observed current sheets in the plasma and the ecliptic plane.

FIGURE 8. Panel (A): the shape of a flux tube in expanding solar wind is indicated at three distances from the Sun (as viewed along the local Parker-spiral direction). Panel (B): the orientations of the normals to 40351 current sheets in the solar wind at 1 AU as viewed along the nominal Parker-spiral direction. Panel (C): the orientations of the normals of 4019 current sheets in the solar wind at ∼5 AU as viewed along the nominal Parker-spiral direction. Panel (D): the distribution of discontinuity normal directions away from the solar-equatorial plane is plotted at 1 AU (green) and ∼5 AU (blue).
Figure 8 plots superposed-epoch averages for 54 high-speed-stream trailing-edge rarefaction regions as measured by the SWEPAM and MAG instruments on the ACE spacecraft. The zero epoch (vertical dashed line) in Figure 7 is the time that the trailing-edge stream interface (located by the inflection point in the solar-wind speed) passes ACE. The trailing-edge rarefaction spans the time from about −2 day to +2 day. Figure 8A plots the radial flow velocity of the solar wind: the infection point of the velocity curve at time = 0 marks the actual boundary between coronal-hole-origin plasma before the inflection point and streamer-belt-origin plasma after the inflection point (Borovsky and Denton, 2016). Figure 8B plots the superposed average of the magnetic-field strength Bmag. Comparing Bmag in the unrarefacted fast solar wind about 2 days before the passage of the stream interface (upper blue dashed curve) to the minimum value of Bmag in the rarefaction (lower blue dashed curve) yields an reduction of Bmag by a factor of 1.9, which corresponds to a volume rarefaction factor of 1.9. This is marked in Figure 6 by a large blue point, which corresponds to a predicted mean angle of current-sheet normals of 45°. In Figure 8C the superposed average of the measured current-sheet orientations in the solar wind is plotted. Before the rarefaction and after the rarefaction the mean angle is in the ballpark of 32°, as expected for isotropic orientations of the current sheets. At the center of the rarefaction where the plasma has been rarefied by a volume rarefaction factor of about 1.9, the mean angle has increased from about 32° to about 40°.
In Figures 7, 8 the change in the mean current-sheet-normal angle from the ecliptic plane was not as much as predicted for the estimated amount of compression or rarefaction: for compression the mean angle change was 32°→26° while the prediction was 32°→21° and for the rarefaction the mean change was 32°→40° while the prediction was 32°→45°. But the predictions were for compressions and rarefactions in the ecliptic plane without north-south components, whereas typical CIRs have tilted fronts with strong north-south components to the compression (e.g. Pizzo, 1991; Gosling and Pizzo, 1999). Thus the predicted changes in the mean angle from the ecliptic plane are too strong.
Another generator of anisotropy of the magnetic structure occurs as the Parker-spiral becomes strongly wound past ∼1 AU and the solar-wind expansion is anisotropic with respect to the Parker-spiral direction. The steady-speed solar-wind plasma expands poloidally and toroidally but not radially. Near the Sun the plasma expands in both directions that are perpendicular to the near-radial Parker-spiral direction (poloidal and toroidal), but beyond 1 AU the Parker-spiral direction is nearly toroidal and there is expansion in one perpendicular direction (poloidal) but not the other (radial). The resulting flux-tube cross-section evolution (for passive flux tubes in the equatorial plane) is sketched in Figure 9A for a flux tube that has a circular cross section near the Sun. In Figure 9B the vector tips of the unit normals of current sheets observed at 1 AU by ACE MAG are plotted on the unit sphere viewed along the nominal Parker-spiral direction. A quasi-isotropic distribution perpendicular to the Parker-spiral direction is seen. In Figure 9C the unit normals of current sheets observed at 5.2–5.4 AU (but within 5° of latitude of the solar equator) by Ulysses VHM are plotted on the unit sphere viewed along the nominal Parker-spiral direction, showing the evolution from quasi-isotropy at 1 AU to strong anisotropy at 5 AU, as predicted in the top panel for the mapping of passive magnetic structure in the solar-wind expansion. Figure 9D plots the normalized occurrence distribution of the angles between each current-sheet normal and the solar equatorial plane: the concentration of normals parallel to the equatorial plane at 5 AU is clearly seen. If the ubiquitous current sheets of the solar wind beyond 1 AU were created by the action of MHD turbulence, then the current-sheet normals should be distributed isotropically about the mean-field direction (i.e. about the Parker-spiral direction).
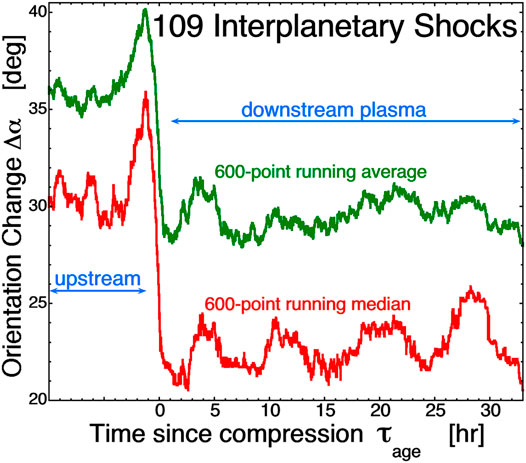
FIGURE 9. For 109 interplanetary shocks, the change in angle of the normals between one current-sheet crossing and the next are plotted. The green curve is the 600-point running average of all values and the red curve is the 600-point running median of all of the values.
Finally, a similar persisting anisotropy is measured when interplanetary shocks compress the solar-wind plasma (Borovsky, 2020a). The systematic anisotropy is difficult to measure using the average orientation of the current sheets because the direction of the compression is difficult to determine for the interplanetary shocks. Instead, flux-tube flattening can be quantified by looking at the change in direction of the current sheet normal from one current-sheet crossing to the next current-sheet crossing. If flux tubes become flattened, then the two normals will be similarly aligned. The angular change Δα from one unit normal n1 to the next unit normal n2 is given by the dot product between the two normals: Δα = arccos(n1•n2). In Figure 1 the statistical trends for the Δα values upstream and downstream of 109 interplanetary shocks are examined as a function of the time since the plasma was shocked τage. The green curve is a 600 point running average of the Δα values for all of the collected current-sheet pairs and the red curve is a 600-point running median of the Δα values for all of the collected pairs. As can be seen, the mean and median values of Δα make transitions to lower values going from the upstream (uncompressed) plasma to the downstream (compressed) plasma. Note that with time in the downstream plasma the Δα values do not return to the upstream values. I.e. the anisotropy of the magnetic structure produced by shock compression does not return toward isotropy in the 10’s of hours after the plasma gets its compression. These times are much longer than the few-hour estimate of the lifetime of solar-wind-turbulence-produced current sheets (Yang et al., 2017), which would show an isotropy after a few hours.
Borovsky (2020b) examined 637 boundaries of the alpha-to-proton number-density ratio α/p at 1 AU using the SWEPAM and MAG instruments on ACE and the SWE and MFI instruments on WIND, with a α/p boundary defined as a distinct (well above the measurement noise level) temporal step in the α/p time series. In the two panels of Figure 10 the superposed epoch average of the angular change Δθ of the magnetic-field direction is plotted with the zero epoch (vertical dashed line) being the crossing of the α/p ion-composition boundary. Figure 10A plots the superposed average of the 315 boundary crossings measured by ACE in green and the 322 boundary crossings measured by WIND in red. For both sets of ion-composition boundaries, the temporal change in the field direction Δθ is much greater at the time of the boundary crossing than it is away from the boundary crossing. This indicates the statistical co-location of strong current sheets in the solar wind at the locations of the ion-composition boundaries. This is explored in Figure 11, where the distribution of magnetic-field angular-change values Δθ at the locations of the α/p boundaries is plotted in red and the distribution of Δθ values two data points before the α/p boundaries and two data points after is plotted in blue. The red curves in Figure 11 represent a population of strong (large-angular-change) current sheets and the curves in blue represent random locations in the solar wind, where occasionally there can be a strong current sheet (cf. Figure 3 of Borovsky (2008) or Figure 4 of Borovsky (2020b)). In Figure 10B the superposed epoch average of Δθ is plotted for the ACE α/p boundary crossings separated into the type of solar-wind plasma in which each boundary was found using the Xu and Borovsky (2015) solar-wind categorization scheme. The superposed average for the boundaries in coronal-hole-origin plasma are plotted in blue, boundaries in streamer-belt-origin plasma are plotted in red, and boundaries in sector-reversal-region plasma are plotted in purple. All three plasmas show that α/p ion-composition boundaries are statistically co-located with strong current sheets in the solar wind.
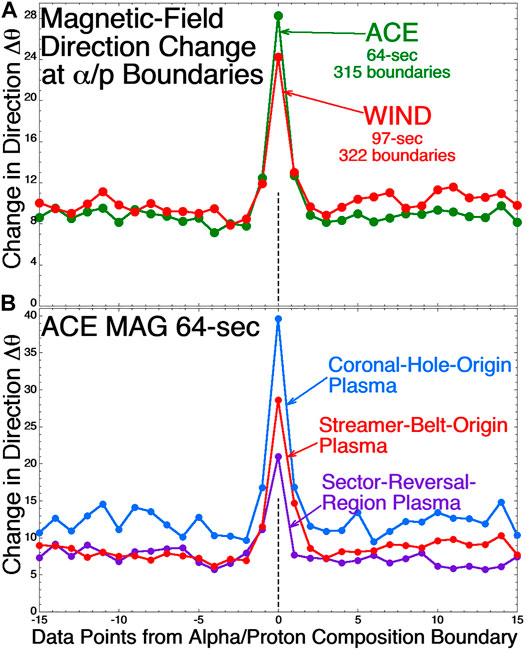
FIGURE 10. Panel (A) plots the superposed epoch average of the temporal change in the magnetic-field direction for 315 α/p boundary crossings by ACE (green curve) and for 322 α/p boundary crossings by WIND (red curve). In panel (B) the 315 ACE crossings are separated into the type of solar-wind plasma that each boundary was in.
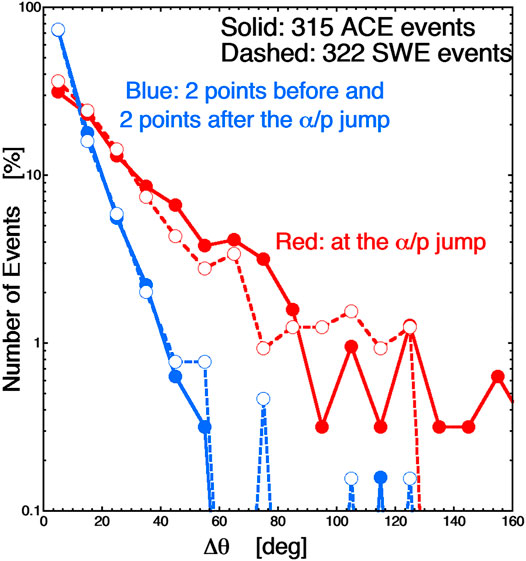
FIGURE 11. The distribution of magnetic-field-direction change Δθ values from one data point to the next. The red curves are for times when α/p boundaries are crossed and the blue curves are for two data points before and after the crossing of the α/p boundaries. The solid curves are for the ACE α/p boundaries and the dashed curves are for the WIND boundaries.
Each alpha-to-proton composition boundary comes from the corona: such ion-composition boundaries cannot be formed in the solar wind away from the Sun. The ion-composition boundaries seen at 1 AU are co-located with strong current sheets (flux-tube walls). Unless there is a mechanism to form current sheets on ion-composition boundaries, those co-located current sheets seen at 1 AU also came from the corona. The ion-composition boundary and current sheet could be subject to stretching and folding by turbulence in the solar wind, but not in a manner that would destroy the current sheet. Note however, a study to specifically quantify the amount of stretching and folding that occurs between 0.3 and 1 AU (Borovsky, 2012a) found no evidence for any stretching and folding.
Borovsky (2020b) examined 351 boundaries in the intensity of the electron strahl at 1 AU using the SWE and MFI instruments on WIND, with a strahl boundary defined as a distinct (well above the measurement noise level) temporal step in the logarithm of the flux of the electron strahl measured at 203 eV. In Figure 12 the superposed epoch average of the angular change Δθ in the magnetic-field direction is plotted for the 351 strahl-intensity boundaries, with the zero epoch (vertical dashed line) being the crossing of the strahl boundary. The temporal change in the field direction Δθ is much greater at the time of the strahl boundary crossing than it is away from the boundary crossing. This indicates the statistical co-location of strong current sheets in the solar wind at the positions of the strahl-intensity boundaries. A figure revealing the strong-current-sheet population seen at the strahl-intensity boundaries (equivalent to Figure 11 for the α/p boundaries) can be seen in Figure 7 of Borovsky (2020b).
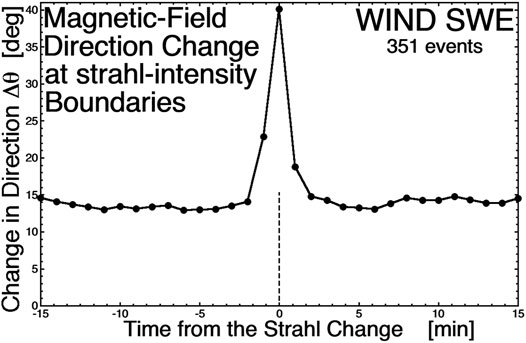
FIGURE 12. The superposed epoch average of the temporal change in the magnetic-field direction is plotted for 351 strahl-intensity boundary crossings measured by WIND at 1 AU.
If the change in strahl intensity at 1 AU is caused by a change in the magnetic connection location back into the corona, then the observation of current sheets co-located with the strahl change is consistent with the current sheet at 1 AU being coherent (intact) all the way back to the Sun.
If the change in strahl intensity at 1 AU is caused by a change in the amount of scattering of the strahl electrons between the Sun and 1 AU (cf. Borovsky, 2021), and the current sheet seen at 1 AU is not coherent back to the Sun, then a mechanism is needed that would cause a current sheet to form at the location of the strahl-intensity change.
In the fast and slow Alfvénic solar wind, it is observed that the magnetic structure moves en masse relative to the proton plasma at a speed of about 0.7 vA, where vA is the measured Alfvén speed. In the Alfvénic regions, one can analyze an hour or so of measurements at 1 AU and find a single reference frame for that hour or so of solar wind that has the proton flow vector everywhere parallel to the local magnetic field vector (Borovsky, 2020c; Nemecek et al., 2020). This is the reference frame moving with the magnetic structure. In the reference frame of the magnetic structure, to within measurement error all proton flows v are parallel to the local magnetic-field direction B. With v⊥ = 0 there is (to within measurement error) no time evolution of the structure. Seeing v⊥ = 0, when riding in the reference frame of outward-propagating Alfvénic structure also means that no inward-propagating Alfvén waves are seen, consistent with Zin = 0 (e.g. Wang et al., 2018), where Zin is the amplitude of the inward Elsasser variable.
A 2-h-long example is shown in Figure 13 where 3-s-resolution velocity measurements from WIND 3DP are shifted into the reference frame of the magnetic structure, which for this time interval was found to move at the constant velocity vmag = (708.27,−19.54,−10.78) km/s (in RTN coordinates) with respect to the frame of the Sun. In Figure 13A the RTN velocity of the proton flow v* is plotted for the 2 h in the reference frame of the magnetic structure, where v*(t) = v(t)-vmag with v(t) being the measurements from WIND 3DP. Using 3-s-averaged magnetic-field measurements B(t) from WIND MFI, a 3-s time-resolution unit vector of the magnetic field direction b(t) = B(t)/Bmag(t) is created. In Figure 13B the proton flow velocity parallel and perpendicular to the local magnetic-field direction is plotted, where v||(t) = v*(t)•b(t) and v⊥(t) = v*(t)-v||(t)b(t). For this 2-h interval, the mean value of v|| is 54.6 km/s and the mean value of v⊥ = |v⊥| is 4.7 km/s. The parallel-to-B flow is everywhere Sunward in the reference frame of the magnetic structure. (Note in magnetic switchbacks in the Alfvénic structure that this Sunward flow is maintained, where “Sunward” means “in the direction along the magnetic field that leads to the Sun” (cf. Figure 7 of Borovsky, 2020d)).
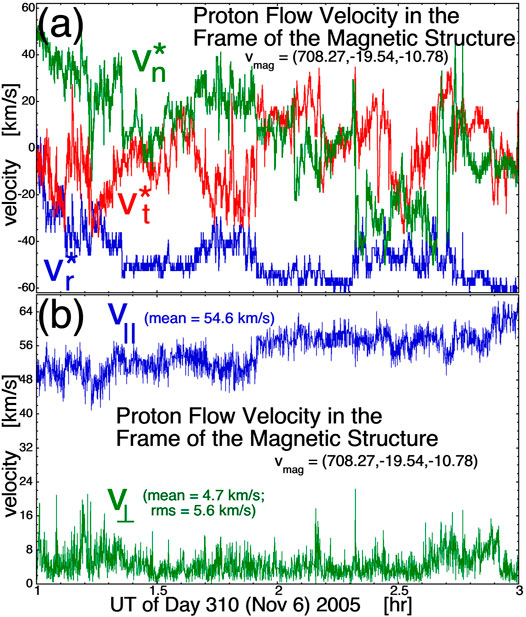
FIGURE 13. A 2-h interval of Alfvénic coronal-hole-origin plasma seen at 1 AU using 3-s measurements from WIND. The measurements for the 2 h are shifted into the reference frame of the magnetic structure by subtracting off (708.27, −19.54, −10.78) km/s. Panel (A) plots the RTN components of the proton flow in the frame of the magnetic structure and Panel (B) the 3-s flow measurements are decomposed in parallel-to-B and perpendicular-to-B components using 3-s measurements of the magnetic-field direction.
In Figure 13B a large source of the v⊥ measured in the reference frame of the magnetic structure comes from the fact that the magnetic-field direction varies during the 3-s 3DP measurement of the flow vector confusing parallel and perpendicular with respect to B. If the actual flow was strictly parallel to B, the measurements of the flow will pick up a perpendicular component owing to the error in knowing the direction of B through the 3-s particle measurement interval. For the 2-h interval of Figure 13B the rms value of the 3-s angular change in the magnetic-field direction is Δθ3-s = 5.9°: taking the v⊥ error to be v||sin(Δθ3-s) with Δθ3-s = 5.9° and with v|| = 54.6 km/s yields 5.6 km/s as an estimate of the amount of v⊥ coming from a projection of v|| attributable to the motion of the field direction during the collection of the proton distribution function to obtain a velocity measurement. This is comparable to the rms value of v⊥ plotted in Figure 13B.
Note that the error estimate for a large actual v|| going into a false v⊥, plus an error estimate for the accuracy of the proton flow vector measurements, may be a method to determine the errors in the measured values of the inward Elsasser variable Zin of the solar wind (cf. Wang et al., 2018).
The analyses of Borovsky (2020c) and Nemecek et al. (2020) find that a large-spatial-scale region of the Alfvénic solar wind has a magnetic structure that propagates at a single vector velocity without evolution. Hence, the magnetic structure in the Alfvénic solar wind is an example of the Chadrasekhar dynamic equilibrium (CDE) (cf. Fig. 7.1 of Parker (1979)) where a nonlinear tangle of magnetic field will propagate en masse without evolution provided that the flow is everywhere parallel to the local field (See also Birn (1991) and Tenerani et al. (2020)). In the case of the solar wind the nonlinear tangle of field is a spaghetti flux-tube magnetic structure with current sheets. The large abrupt velocity shears that are ubiquitous in the Alfvénic solar wind (Borovsky, 2012a) are parallel-to-B flows in a magnetic structure with sudden changes in the field direction from tube to tube.
Note that the alpha particles (and probably the heavy ions) in the solar wind are approximately at rest in the reference frame of the magnetic structure (Nemecek et al., 2020) that moves at a speed of less than vA through the proton plasma.
Questions are raised about the nature of the solar wind in the inner heliosphere and a call is made for future solar-wind measurements.
There are many indications that the v and B fluctuations observed in the solar wind are manifestations of turbulence: notably the observed Fourier spectra (Tu and Marsch, 1995; Podesta, 2010), the fact that the fluctuations have extremely high Reynolds numbers (Neugebauer and Snyder, 1966; Borovsky and Gary, 2009), the results of third-order-moment analysis (Smith et al., 2009; Hadid et al., 2017), and evolution with distance of the low-frequency Fourier breakpoint (Feynman et al., 1996; Bruno et al., 2005; Bruno and Carbone, 2013). Table 1 summarizes various types of structures in the solar wind that are not destroyed by turbulence: the implications of the survival of structure are that turbulence is not always the dominant mechanism operating in the solar wind between the Sun and 1 AU. Some questions are raised. Why is turbulence not destroying and regenerating structure? What is the nature of the solar-wind fluctuations and why do they look like turbulence? A possibility is that the fluctuations seen at 1 AU are fossils of turbulence from near the Sun that has relaxed (Dobrowolny et al., 1980; Matthaeus et al., 2008, 2012; Servidio et al., 2014; Telloni et al., 2016) either to a non-Alfvénic state that is advecting with the solar-wind plasma or to a v↔B aligned Alfvénic state that is propagating outward from the Sun. Another possibility (cf. Sect. 7.2 of Parker, 1979) is that there is a region near the Sun where turbulence is being driven and some of the outward-Alfvénic components of the turbulence are radiating out from the driving region to escape into the solar wind, carrying statistical properties of the driven near-Sun turbulence.
Borovsky et al. (2021) found that the core-electron temperature of the solar wind is structured with the magnetic structure of the solar wind for all major types of solar-wind plasma. Thus it is seen that differing magnetic flux tubes have differing core-electron temperatures, with temperature jumps from tube to tube. A common interpretation of the core-electron temperature is that it is a direct measure of the local interplanetary electric potential (Feldman et al., 1975; Boldyrev et al., 2020; Moncuquet et al., 2020). This being the case along with the electron-temperature differences, individual flux tubes would have independent exospheric models operating inside of them driving solar-wind acceleration. If a plasma system is defined as multiple subsystems of interacting particle populations (such as the Earth’s magnetosphere (Borovsky and Valdivia, 2018)), then each solar-wind flux tube seen at 1 AU is an independent system and the measured parameters from flux tube to flux tube are independent realizations of system evolution.
Many features (e.g. Table 1) in the solar wind time series are inconsistent with turbulence. Hence, there might be some caution in taking a statistical description of the solar-wind time series (i.e. a Fourier power spectral density, an autocorrelation function, third-order moments, etc.) and interpreting the entirety of the statistical description as a measures of the properties of turbulence. (Cf. Figure 8 of Viall and Borovsky (2020).) At the least, the effects of the “definitely-not-turbulence” features in the time series on the statistical picture should be understood and not interpreted as turbulence.
Another solar-wind feature that can be examined with existing data sets are proton-number-density boundaries and their co-located strong current sheets (Riazantseva et al., 2005; Safrankova et al., 2013a; Zastenker et al., 2014). A statistical examination of their thickness versus distance from the Sun in comparison with the expected action of Bohm and gyro-Bohm diffusion (Perkins et al., 1993; Hannum et al., 2001; Borovsky, 2006) can yield indications of their age compared with the age of the solar-wind plasma.
A major impediment to identifying at 1 AU structure that has it origin in the corona is a lack of accuracy of solar-wind measurements. It is critical to be able to unambiguously detect subtle changes in the particle populations (protons, heavy ions, electrons) across solar-wind current sheets. In this manner every current sheet can be assessed as to it possible origins. As it is now, only current sheets with strong changes (above the instrument noise) in the particle populations can be identified as solar origin. Future progress on understanding the nature of the structure of the solar wind calls for the deployment of low-noise, high-accuracy, high-time resolution particle measurements on a single spacecraft in the solar wind. Coordinating plasma, ion-composition, and electron boundaries with the magnetic structure of the solar wind is at present difficult owing to counting-statistics noise in the existing particle measurements. In the available solar-wind data sets only the most-robust particle boundaries can be identified, the majority of boundaries are lost in the noise of the measurements. Improved instruments with large geometric factors are needed to obtain sufficient counting statistics to make low-noise measurements in short measuring times. Breakthroughs in the observation of the structure of the solar wind will be possible with such precision measurements of the α/p ion composition, the heavy-ion charge-state composition, and the electron strahl intensity.
Similarly, large-geometric-factor proton measurements would enable faster resolution of proton velocity vectors with less movement of the magnetic-field vector during a measurement sequence, resulting in proton flow vectors that are sufficiently accurate to determine whether inward Elsasser variables represent inward Alfvén waves versus noise. In the standard model of solar-wind turbulence (e.g. Matthaeus et al., 1994, 2020; Goldstein et al., 1995; Horbury et al., 1996; Bruno et al., 2005; Petrosyan et al., 2010) large-scale static (non-evolving) structures in the energy-containing scales of the solar wind transfer energy across the low-frequency Fourier breakpoint to dynamic (interacting, evolving) structures in the inertial range of the solar wind. An outstanding question asks whether the structures in the inertial range are dynamic (evolving) or static (non-evolving), and under what conditions? Much needed accurate measurements of the inward-Elsasser amplitudes could answer this. For the proton measurements, multi-instrument techniques such as the Spektr-R BMSW instrument (Safrankova et al., 2013b; Zastenker et al., 2013) that reduce energy sweep time may be a path forward.
The solar wind is a scientifically invaluable astrophysical plasma. A main difficulty is that it the plasma passes a spacecraft at an extremely high velocity making measurements of the detailed structure challenging. The scientific community needs to focus on fast accurate measurements to take advantage of this unique opportunity.
JB initiated this project, performed the analysis, and wrote the manuscript.
The author declares that the research was conducted in the absence of any commercial or financial relationships that could be construed as a potential conflict of interest.
All claims expressed in this article are solely those of the authors and do not necessarily represent those of their affiliated organizations, or those of the publisher, the editors and the reviewers. Any product that may be evaluated in this article, or claim that may be made by its manufacturer, is not guaranteed or endorsed by the publisher.
This work was supported at the Space Science Institute by the NSF SHINE program via grant AGS-1723416, by the NASA Heliophysics Guest Investigator Program via award NNX17AB71G, by the NSF GEM Program via grant AGS-2027569, and by the NASA Heliophysics LWS program via award NNX16AB75G. The authors thank Joachim Birn, Melvyn Goldstein, Ben Maruca, and Daniel Verscharen for helpful conversations.
Allread, J. C., and MacNeice, P. J. (2015). An MHD Code for the Study of Magnetic Structures in the Solar Wind. Comput. Sci. Discov. 8, 015002. doi:10.1088/1749-4699/8/1/015002
Balogh, A., Beek, T. J., Forsyth, R. J., Hedgecock, P. C., Marquedant, R. J., Smith, E. J., et al. (1992). The Magnetic Field Investigation on the Ulysses Mission: Instrumentation and Preliminary Scientific Results. Astron. Astrophys. Suppl. Ser. 92, 221.
Bavassano, B., and Bruno, R. (1989). Evidence of Local Generation of Alfvénic Turbulence in the Solar Wind. J. Geophys. Res. 94, 11977.
Bavassano, B., and Bruno, R. (1992). On the Role of Interplanetary Sources in the Evolution of Low-Frequency Alfvénic Turbulence in the Solar Wind. J. Geophys. Res. 97, 19129. doi:10.1029/92ja01510
Birch, M. J., and Hargreaves, J. K. (2020a). Quasi-periodic Ripples in High-Latitude Electron Content, the Geomagnetic Field, and the Solar Wind. Nat. Scientific Rep 10, 1313. doi:10.1038/s41598-019-57201-4
Birch, M. J., and Hargreaves, J. K. (2020b). Quasi-periodic Ripples in the Heliosphere from 1 to 40 AU. Adv. Space Res. 67, 678. doi:10.1016/j.asr.2020.08.030
Birn, J. (1991). Stretched Three‐dimensional Plasma Equilibria with Field‐aligned Flow. Phys. Fluids B: Plasma Phys. 3, 479–484. doi:10.1063/1.859891
Boldyrev, S., Forest, C., and Egedal, J. (2020). Electron Temperature of the Solar Wind. Proc. Natl. Acad. Sci. USA 117, 9232–9240. doi:10.1073/pnas.1917905117
Borovsky, J. E. (2020a). Compression of the Heliospheric Magnetic Structure by Interplanetary Shocks: Is the Structure at 1 AU a Manifestation of Solar-Wind Turbulence or Is it Fossil Structure from the Sun?. Front. Astron. Space Sci. 7, 582546. doi:10.3389/fspas.2020.582564
Borovsky, J. E., and Denton, M. H. (2011). No Evidence for Heating of the Solar Wind at Strong Current Sheets. Phys. Rev. Lett. 739, L61. doi:10.1088/2041-8205/739/2/l61
Borovsky, J. E., and Denton, M. H. (2010). Solar Wind Turbulence and Shear: A Superposed-Epoch Analysis of Corotating Interaction Regions at 1 AU. J. Geophys. Res. 115, A10101. doi:10.1029/2009ja014966
Borovsky, J. E., and Denton, M. H. (2016). The Trailing Edges of High-Speed Streams at 1 AU. J. Geophys. Res. Space Phys. 121, 6107–6140. doi:10.1002/2016ja022863
Borovsky, J. E. (2021). Exploring the Properties of the Electron Strahl at 1 AU as an Indicator of the Quality of the Magnetic Connection Between the Earth and the Sun. Front. Astron. Space Sci. 8, 646443. doi:10.3389/fspas.2021.646443
Borovsky, J. E. (2008). Flux Tube Texture of the Solar Wind: Strands of the Magnetic Carpet at 1 AU?. J. Geophys. Res. 113, A08110. doi:10.1029/2007ja012684
Borovsky, J. E., and Gary, S. P. (2009). On Viscosity and the Reynolds Number of MHD Turbulence in Collisionless Plasmas: Coulomb Collisions, Landau Damping, and Bohm Diffusion. Phys. Plasmas 16, 082307. doi:10.1063/1.3155134
Borovsky, J. E., Halekas, J. S., and Whittlesey, P. L. (2021). The Electron Structure of the Solar Wind. Front. Astron. Space Sci. 8, 69005. doi:10.3389/fspas.2021.690005
Borovsky, J. E. (2012a). Looking for Evidence of Mixing in the Solar Wind from 0.31 to 0.98 AU. J. Geophys. Res. 117, A06107. doi:10.1029/2012ja017525
Borovsky, J. E. (2020c). On the Motion of the Heliospheric Magnetic Structure through the Solar Wind Plasma. J. Geophys. Res. 125, e2019JA027377. doi:10.1029/2019ja027377
Borovsky, J. E. (2010). On the Variations of the Solar Wind Magnetic Field about the Parker Spiral Direction. J. Geophys. Res. 115, A09101. doi:10.1029/2009ja015040
Borovsky, J. E. (2020d). Plasma and Magnetic-Field Structure of the Solar Wind at Inertial-Range Scale Sizes Discerned from Statistical Examinations of the Time-Series Measurements. Front. Astron. Space Sci. 7, 20. doi:10.3389/fspas.2020.00020
Borovsky, J. E., and Steinberg, J. T. (2014). No Evidence for the Localized Heating of Solar Wind Protons at Intense Velocity Shear Zones. J. Geophys. Res. Space Phys. 119, 1455–1462. doi:10.1002/2013ja019746
Borovsky, J. E. (2006). The Eddy Viscosity and Flow Properties of the Solar Wind: CIRs, CME Sheaths, and Solar-Wind/magnetosphere Coupling. Phys. Plasmas 13, 056505. doi:10.1063/1.2200308
Borovsky, J. E. (2012a). The Effect of Sudden Wind Shear on the Earth's Magnetosphere: Statistics of Wind Shear Events and CCMC Simulations of Magnetotail Disconnections. J. Geophys. Res. 117, A06224. doi:10.1029/2012ja017623
Borovsky, J. E. (2020b). The Magnetic Structure of the Solar Wind: Ionic Composition and the Electron Strahl. Geophys. Res. Lett. 47, e2019GL084586. doi:10.1029/2019gl084586
Borovsky, J. E., and Valdivia, J. A. (2018). The Earth's Magnetosphere: A Systems Science Overview and Assessment. Surv. Geophys. 39, 817–859. doi:10.1007/s10712-018-9487-x
Bruno, R., Carbone, V., Bavassano, B., and Sorriso-Valvo, L. (2005). Observations of Magnetohydrodynamic Turbulence in the 3D Heliosphere. Adv. Space Res. 35, 939–950. doi:10.1016/j.asr.2005.01.106
Bruno, R., and Carbone, V. (2013). The Solar Wind as a Turbulence Laboratory. Living Rev. Solar Phys. 10, 2. doi:10.12942/lrsp-2013-2
Buch, K. A., and Dahm, W. J. A. (1996). Experimental Study of the fine-scale Structure of Conserved Scalar Mixing in Turbulent Shear Flows. Part 1. Sc [Gt ] 1. J. Fluid Mech. 317, 21–71. doi:10.1017/s0022112096000651
Burlaga, L. F., and Ness, N. F. (1969). Tangential Discontinuities in the Solar Wind. Sol. Phys. 9, 467–477. doi:10.1007/bf02391672
Corrsin, S. (1959). Outline of Some Topics in Homogeneous Turbulent Flow. J. Geophys. Res. 64, 2134–2150. doi:10.1029/jz064i012p02134
Crooker, N. U., Gosling, J. T., Bothmer, V., Forsyth, R. J., Gazis, P. R., Hewish, A., et al. (1999). CIR Morphology, Turbulence, Discontinuities, and Energetic Particles. Space Sci. Rev. 89, 179–220. doi:10.1007/978-94-017-1179-1_12
Crooker, N. U., and McPherron, R. L. (2012). Coincidence of Composition and Speed Boundaries of the Slow Solar Wind. J. Geophys. Res. 117, A09104. doi:10.1029/2012ja017837
DeForest, C. E., Howard, R. A., Velli, M., Viall, N., and Vourlidas, A. (2018). The Highly Structured Outer Solar Corona. Astrophys. J. 862, 18. doi:10.3847/1538-4357/aac8e3
Di Matteo, S., Viall, N. M., Kepko, L., Wallace, S., Arge, C. N., and MacNeice, P. (2019). Helios Observations of Quasiperiodic Density Structures in the Slow Solar Wind at 0.3, 0.4, and 0.6 AU. J. Geophys. Res. Space Phys. 124, 837–860. doi:10.1029/2018ja026182
Dimotakis, P. E. (2005). Turbulent Mixing. Annu. Rev. Fluid Mech. 37, 329–356. doi:10.1146/annurev.fluid.36.050802.122015
Dobrowolny, M., Mangeney, A., and Veltri, P. (1980). Fully Developed Anisotropic Hydromagnetic Turbulence in Interplanetary Space. Phys. Rev. Lett. 45, 144–147. doi:10.1103/physrevlett.45.144
Feldman, W. C., Asbridge, J. R., Bame, S. J., Montgomery, M. D., and Gary, S. P. (1975). Solar Wind Electrons. J. Geophys. Res. 80, 4181–4196. doi:10.1029/ja080i031p04181
Feynman, J., Ruzmaikin, A., and Smith, E. J. (1996). Radial Evolution of the High/low Frequency Breakpoint in Magnetic Field Spectra. AIP Conf. Proc. 382, 347. doi:10.1063/1.51409
Goldstein, M. L., Roberts, D. A., and Matthaeus, W. H. (1995). Magnetohydrodynamic Turbulence in the Solar Wind. Annu. Rev. Astron. Astrophys. 33, 283–325. doi:10.1146/annurev.aa.33.090195.001435
Gosling, J. T., and Pizzo, V. J. (1999). Formation and Evolution of Corotating Interaction Regions and Their Three Dimensional Structure. Space Sci. Rev. 89, 21–52. doi:10.1007/978-94-017-1179-1_3
Hadid, L. Z., Sahraoui, F., and Galtier, S. (2017). Energy Cascade Rate in Compressible Fast and Slow Solar Wind Turbulence. Astrophys. J. 838, 9. doi:10.3847/1538-4357/aa603f
Hannum, D., Bateman, G., Kinsey, J., Kritz, A. H., Onjun, T., and Pankin, A. (2001). Comparison of High-Mode Predictive Simulations Using Mixed Bohm/Gyro-Bohm and Multi-Mode (MMM95) Transport Models. Phys. Plasmas 8, 964–974. doi:10.1063/1.1338534
Horbury, T. S., Balogh, A., Forsyth, R. J., and Smith, E. J. (1996). The Rate of Evolution Over the Sun’s Poles. Astron. Astrophys. 316, 333.
Hundhausen, A. J. (1973). Nonlinear Model of High-Speed Solar Wind Streams. J. Geophys. Res. 78, 1528–1542. doi:10.1029/ja078i010p01528
Jian, L., Russell, C. T., Luhmann, J. G., and Skoug, R. M. (2006). Properties of Stream Interactions at One AU During 1995 - 2004. Sol. Phys. 239, 337–392. doi:10.1007/s11207-006-0132-3
Karimabadi, H., Roytershteyn, V., Wan, M., Matthaeus, W. H., Daughton, W., Wu, P., et al. (2013). Coherent Structures, Intermittent Turbulence, and Dissipation in High-Temperature Plasmas. Phys. Plasmas 20, 012303. doi:10.1063/1.4773205
Kepko, L., and Spence, H. E. (2003). Observations of Discrete, Global Magnetospheric Oscillations Directly Driven by Solar Wind Density Variations. J. Geophys. Res. 108, 1257. doi:10.1029/2002ja009676
Kepko, L., Spence, H. E., and Singer, H. J. (2002). ULF Waves in the Solar Wind as Direct Drivers of Magnetospheric Pulsations. Geophys. Res. Lett. 29, 1197. doi:10.1029/2001gl014405
Kepko, L., and Viall, N. M. (2019). The Source, Significance, and Magnetospheric Impact of Periodic Density Structures Within Stream Interaction Regions. J. Geophys. Res. 124, 2019JA026962. doi:10.1029/2019ja026962
Kepko, L., Viall, N. M., and Wolfinger, K. (2020). Inherent Length Scales of Periodic Mesoscale Density Structures in the Solar Wind Over Two Solar Cycles. J. Geophys. Res. 125, e2020JA028037. doi:10.1029/2020ja028037
Knetter, T., Neubauer, F. M., Horbury, T., and Balogh, A. (2004). Four-point Discontinuity Observations Using Cluster Magnetic Field Data: A Statistical Survey. J. Geophys. Res. 109, A06102. doi:10.1029/2003ja010099
Kraichnan, R. H. (1965). Inertial-range Spectrum of Hydromagnetic Turbulence. Phys. Fluids 8, 1385. doi:10.1063/1.1761412
Krista, L. D., Gallagher, P. T., and Bloomfield, D. S. (2011). Short-term Evolution of Coronal Hole Boundaries. Astrophys. J. Lett. 731, L26. doi:10.1088/2041-8205/731/2/l26
Lazarus, A., Kasper, J. A., Szabo, A., and Ogilvie, K. (2003). “Solar Wind Streams and Their Origins. AIP Conf. Proc. 679, 187
Lepping, R. P., Acũna, M. H., Burlaga, L. F., Farrell, W. M., Slavin, J. A., Schatten, K. H., et al. (1995). The WIND Magnetic Field Investigation. Space Sci. Rev. 71, 207–229. doi:10.1007/bf00751330
Lin, R. P., Anderson, K. A., Ashford, S., Carlson, C., Curtis, D., Ergun, R., et al. (1995). A Three-Dimensional Plasma and Energetic Particle Investigation for the WIND Spacecraft. Space Sci. Rev. 71, 125–153. doi:10.1007/bf00751328
Matthaeus, W. H., Gray, P. C., Pontius, Jr., D. H., and Bieber, J. W. (1995). Spatial Structure and Field-Line Diffusion in Transverse Magnetic Turbulence. Phys. Rev. Lett. 75, 2136–2139. doi:10.1103/physrevlett.75.2136
Matthaeus, W. H., Montgomery, D. C., Wan, M., and Servidio, S. (2012). A Review of Relaxation and Structure in Some Turbulent Plasmas: Magnetohydrodynamic and Related Models. J. Turb. 37, 1. doi:10.1080/14685248.2012.704378
Matthaeus, W. H., Oughton, S., Pontius, D. H., and Zhou, Y. (1994). Evolution of Energy-Containing Turbulent Eddies in the Solar Wind. J. Geophys. Res. 99, 19267. doi:10.1029/94ja01233
Matthaeus, W. H., Pouquet, A., Mininni, P. D., Dmitruk, P., and Breech, B. (2008). Rapid Alignment of Velocity and Magnetic Field in Magnetohydrodynamic Turbulence. Phys. Rev. Lett. 100, 085003. doi:10.1103/physrevlett.100.085003
Matthaeus, W. H., Yang, Y., Wan, M., Parashar, T. N., Bandyopadhyay, R., Chasapis, A., et al. (2020). Pathways to Dissipation in Weakly Collisional Plasmas. Astrophys. J. 891, 101. doi:10.3847/1538-4357/ab6d6a
McComas, D. J., Bame, S. J., Barker, P., Feldman, W. C., Phillips, J. L., Riley, P., et al. (1998). Solar Wind Electron Proton Alpha Monitor (SWEPAM) for the Advanced Composition Explorer. Space Sci. Rev. 86, 563–612. doi:10.1007/978-94-011-4762-0_20
McPherron, R. L., and Weygand, J. J. (2006). The Solar Wind and Geomagnetic Activity as a Function of Time Relative to Corotating Interaction Regions. Geophys. Monog. Ser. 167, 125–137. doi:10.1029/167gm12
Moncuquet, M., Meyer-Vernet, N., Issautier, K., Pulupa, M., Bonnell, J. W., Bale, S. D., et al. (2020). First In Situ Measurements of Electron Density and Temperature from Quasi-thermal Noise Spectroscopy with Parker Solar Probe/FIELDS. Astrophys. J. Suppl. 246, 44. doi:10.3847/1538-4365/ab5a84
Muzzio, F. J., Swanson, P. D., and Ottino, J. M. (1991). The Statistics of Stretching and Stirring in Chaotic Flows. Phys. Fluids A: Fluid Dyn. 3, 822–834. doi:10.1063/1.858013
Nemecek, Z., Durovcova, T., Safrankova, J., Nemec, F., Matteini, L., StansbyJantizek, D. N., et al. (2020). What is the Solar Wind Frame of Reference? Astrophys. J. 889, 163. doi:10.3847/1538-4357/ab65f7
Neugebauer, M., and Snyder, C. W. (1966). Mariner 2 Observations of the Solar Wind: 1. Average Properties. J. Geophys. Res. 71, 4469–4484. doi:10.1029/jz071i019p04469
Ogilvie, K. W., Chornay, D. J., Fritzenreiter, R. J., Hunsaker, F., Keller, J., Lobell, J., et al. (1995). SWE, A Comprehensive Plasma Instrument for the WIND Spacecraft. Space Sci. Rev. 71, 55–77. doi:10.1007/bf00751326
Okabe, A., Boots, B., Sugihara, K., and Chiu, S. N. (2000). Spatial Tessellations: Concepts and Applications of Voronoi Diagrams. Chichester, UK: John Wiley & Sons.
Osman, K. T., Matthaeus, W. H., Greco, A., and Servidio, S. (2011). Evidence for Inhomogeneous Heating in the Solar Wind. Astrophys. J. Lett. 727, L11. doi:10.1088/2041-8205/727/1/l11
Osman, K. T., Matthaeus, W. H., Hnat, B., and Chapman, S. C. (2012). Kinetic Signatures and Intermittent Turbulence in the Solar Wind Plasma. Phys. Rev. Lett. 108, 261103. doi:10.1103/physrevlett.108.261103
Ottino, J. M. (1990). Mixing, Chaotic Advection, and Turbulence. Annu. Rev. Fluid Mech. 22, 207–254. doi:10.1146/annurev.fl.22.010190.001231
Paul, E. L., Atiemo-Obeng, V. A., and Kresta, S. M. (2003). Handbook of Industrial Mixing. Hoboken, NJ: Wiley-Interscience.
Perez, J. C., and Boldyrev, S. (2010). Numerical Simulations of Imbalanced Strong Magnetohydrodynamic Turbulence. Astrophys. J. Lett. 710, L63–L66. doi:10.1088/2041-8205/710/1/l63
Perkins, F. W., Barnes, C. W., Johnson, D. W., Scott, S. D., Zarnstorff, M. C., Bell, M. G., et al. (1993). Nondimensional Transport Scaling in the Tokamak Fusion Test Reactor: Is Tokamak Transport Bohm or gyro‐Bohm?. Phys. Fluids B: Plasma Phys. 5, 477–498. doi:10.1063/1.860534
Petrosyan, A., Balogh, A., Goldstein, M. L., Léorat, J., Marsch, E., Petrovay, K., et al. (2010). Turbulence in the Solar Atmosphere and Solar Wind. Space Sci. Rev. 156, 135–238. doi:10.1007/s11214-010-9694-3
Pizzo, V. J. (1991). The Evolution of Corotating Stream Fronts Near the Ecliptic Plane in the Inner Solar System: 2. Three-Dimensional Tilted-Dipole Fronts. J. Geophys. Res. 96, 5405. doi:10.1029/91ja00155
Podesta, J. J. (2010). Solar Wind Turbulence: Advances in Observations and Theory. Proc. IAU 6, 295–301. doi:10.1017/s1743921311007162
Pucci, F., Malara, F., Perri, S., Zimbardo, G., Sorriso-Valvo, L., and Valentini, F. (2016). Energetic Particle Transport in the Presence of Magnetic Turbulence: Influence of Spectral Extension and Intermittency. Mon. Not. R. Astron. Soc. 459, 3395–3406. doi:10.1093/mnras/stw877
Pylaev, O. S., Zaqarashvili, T. V., Brazhenko, A. I., Melnik, V. N., Hanslmeier, A., and Panchenko, M. (2017). Oscillation of Solar Radio Emission at Coronal Acoustic Cut-Off Frequency. Astron. Astrophys. 601, A42. doi:10.1051/0004-6361/201629218
Reville, V., Velli, M., Rouillard, A. P., Lavraud, B., Tenerani, A., Shi, C., et al. (2020). Tearing Instability and Periodic Density Perturbations in the Slow Solar Wind. Astrophys. J. Lett. 895, L20. doi:10.3847/2041-8213/ab911d
Riazantseva, M. O., Khabarova, O. V., Zastenker, G. N., and Richardson, J. D. (2005). Sharp Boundaries of Solar Wind Plasma Structures and an Analysis of Their Pressure Balance. Cosmic Res. 43, 157–164. doi:10.1007/s10604-005-0030-8
Roberts, D. A., Goldstein, M. L., Matthaeus, W. H., and Ghosh, S. (1992). Velocity Shear Generation of Solar Wind Turbulence. J. Geophys. Res. 97, 17115. doi:10.1029/92ja01144
Safrankova, J., Memecek, Z., Cagas, P., Pavlu, J., Zastenker, G. N., Riazantseva, M. O., et al. (2013a). Short-Scale Variations of the Solar Wind Helium Abundance. Astrophys. J. 778, 25. doi:10.1088/0004-637X/778/1/25
Safrankova, J., Nemecek, Z., Prech, L., and Zastenker, G. N. (2013b). Ion Kinetic Scale in Solar Wind Observed. Phys. Rev. Lett. 110, 025004. doi:10.1103/PhysRevLett.110.025004
Servidio, S., Greco, A., Matthaeus, W. H., Osman, K. T., and Dmitruk, P. (2011). Statistical Association of Discontinuities and Reconnection in Magnetohydrodynamic Turbulence. J. Geophys. Res. 116, A09102. doi:10.1029/2011ja016569
Servidio, S., Gurgiolo, C., Carbone, V., and Goldstein, M. L. (2014). Relaxation Processes in Solar Wind Turbulence. Astrophys. J. Lett. 789, L44. doi:10.1088/2041-8205/789/2/l44
Siscoe, G., and Intriligator, D. (1993). Three Views of Two Giant Streams: Aligned Observations at 1 AU, 4.6 AU, and 5.9 AU. Geophys. Res. Lett. 20, 2267–2270. doi:10.1029/93gl02488
Smith, C. W., Acuna, M. H., Burlaga, L. F., L’Heureux, J., Ness, N. F., and Scheifele, J. (1998). The ACE Magnetic Fields Experiment. Space Sci. Rev. 86, 611. doi:10.1023/a:1005092216668
Smith, C. W., Stawarz, J. E., and Vasquez, B. J. (2009). Turbulent Cascade at 1 AU in High Cross-Helicity Flows. Phys. Rev. Lett. 103, 201101. doi:10.1103/physrevlett.103.201101
Smith, C. W., Tessein, J. A., VasquezSkoug, B. J. R. M., and Skoug, R. M. (2011). Turbulence Associated with Corotating Interaction Regions at 1AU: Inertial Range Cross-Helicity Spectra. J. Geophys. Res. 116, A10103. doi:10.1029/2011ja016645
Stawarz, J. E., Smith, C. W., Vasquez, B. J., Forman, M. A., and MacBride, B. T. (2010). The Turbulent Cascade for High Cross-Helicity States at 1 Au. Astrophys. J. 713, 920–934. doi:10.1088/0004-637x/713/2/920
Telloni, D., Perri, S., Carbone, V., and Bruno, R. (2016). Selective Decay and Dynamic Alignment in the MHD Turbulence: The Role of the Rugged Invariants. AIP Conf. Proc. 1720, 040015. doi:10.1063/1.4943826
Tenerani, A., Velli, M., Matteini, L., Reville, V., Shi, C., Bale, S. D., et al. (2020). Magnetic Field Kinks and Folds in the Solar Wind. Astrophys. J. Suppl. Ser. 246, 3. doi:10.3847/1538-4365/ab53e1
Tu, C.-Y., and Marsch, E. (1995). MHD Structures, Waves and Turbulence in the Solar Wind: Observations and Theories. Space Sci. Rev. 73, 1–210. doi:10.1007/bf00748891
Verdini, A., Velli, M., and Buchlin, E. (2009). Turbulence in the Sub-Alfvénic Solar Wind Driven by Reflection of Low-Frequency Alfvén Waves. Astrophys. J. 700, L39–L42. doi:10.1088/0004-637x/700/1/l39
Viall, N. M., and Borovsky, J. E. (2020). Nine Outstanding Questions of Solar Wind Physics. J. Geophys. Res. 125, e2018JA026005. doi:10.1029/2018ja026005
Viall, N. M., DeForest, C. E., and Kepko, L. (2021). Mesoscale Structure in the Solar Wind. Submitted to Fron. Astron. Space Phys. 8, 735034. doi:10.3389/fspas.2021.735034
Viall, N. M., Kepko, L., and Spence, H. E. (2008). Inherent Length-Scales of Periodic Solar Wind Number Density Structures. J. Geophys. Res. 113, A07101. doi:10.1029/2007ja012881
Viall, N. M., Kepko, L., and Spence, H. E. (2009a). Relative Occurrence Rates and Connection of Discrete Frequency Oscillations in the Solar Wind Density and Dayside Magnetosphere. J. Geophys. Res. 114, A01201. doi:10.1029/2008ja013334
Viall, N. M., Spence, H. E., and Kasper, J. (2009b). Are Periodic Solar Wind Number Density Structures Formed in the Solar Corona?. Geophys. Res. Lett. 36, L23102. doi:10.1029/2009gl041191
Viall, N. M., Spence, H. E., Vourlidas, A., and Howard, R. (2010). Examining Periodic Solar-Wind Density Structures Observed in the SECCHI Heliospheric Imagers. Sol. Phys. 267, 175–202. doi:10.1007/s11207-010-9633-1
Viall, N. M., and Vourlidas, A. (2015). Periodic Density Structures and the Origin of the Slow Solar Wind. Astrophys. J. 807, 176. doi:10.1088/0004-637x/807/2/176
Wang, X., Tu, C., He, J., Marsch, E., and Wang, L. (2013). On Intermittent Turbulence Heating of the Solar Wind: Differences Between Tangential and Rotational Discontinuities. Astrophys. J. Lett. 772, L14. doi:10.1088/2041-8205/772/2/l14
Wang, X., Tu, C. Y., He, J. S., Wang, L. H., Yao, S., and Zhang, L. (2018). Possible Noise Nature of Elsässer Variable Z − in Highly Alfvénic Solar Wind Fluctuations. J. Geophys. Res. Space Phys. 123, 57–67. doi:10.1002/2017ja024743
Wimmer-Schweingruber, R. F., von Steiger, R., and Paerli, R. (1997). Solar Wind Stream Interfaces in Corotating Interaction Regions: SWICS/Ulysses Results. J. Geophys. Res. 102, 17407–17417. doi:10.1029/97ja00951
Xu, F., and Borovsky, J. E. (2015). A New Four-Plasma Categorization Scheme for the Solar Wind. J. Geophys. Res. Space Phys. 120, 70–100. doi:10.1002/2014ja020412
Yang, L., Zhang, L., He, J., Tu, C., Li, S., Wang, X., et al. (2017). Formation and Properties of Tangential Discontinuities in Three-Dimensional Compressive MHD Turbulence. Astrophys. J. 851, 121. doi:10.3847/1538-4357/aa9993
Yokoi, N., and Hamba, F. (2007). An Application of the Turbulent Magnetohydrodynamic Residual-Energy Equation Model to the Solar Wind. Phys. Plasmas 14, 112904. doi:10.1063/1.2792337
Yokoi, N., Rubinstein, R., and Yashizawa, A. (2008). “Eddy Viscosity in Magnetohydrodynamic Turbulence,” in IUTAM Symposium on Computational Physics and New Perspectives in Turbulence. Editor Y. Kaneda (New York, NY: Springer), 279–284.
Yoshizawa, A., and Yokoi, N. (1996). Stationary Large‐scale Magnetic fields Generated by Turbulent Motion in a Spherical Region. Phys. Plasmas 3, 3604–3613. doi:10.1063/1.871952
Zastenker, G. N., Koloskova, I. V., Riazantseva, M. O., Yurasov, A. S., Safrankova, J., Nemecek, Z., et al. (2014). Observation of Fast Variations of the Helium-Ion Abundance in the Solar Wind. Cosmic Res. 52, 25–36. doi:10.1134/s0010952514010109
Keywords: solar wind, turbulence, current sheets, discontinuities, magnetic structure
Citation: Borovsky JE (2021) Solar-Wind Structures That Are Not Destroyed by the Action of Solar-Wind Turbulence. Front. Astron. Space Sci. 8:721350. doi: 10.3389/fspas.2021.721350
Received: 06 June 2021; Accepted: 22 July 2021;
Published: 02 August 2021.
Edited by:
Luca Sorriso-Valvo, Institute for Space Physics (Uppsala), SwedenReviewed by:
Zoltan Voros, Austrian Academy of Sciences, AustriaCopyright © 2021 Borovsky. This is an open-access article distributed under the terms of the Creative Commons Attribution License (CC BY). The use, distribution or reproduction in other forums is permitted, provided the original author(s) and the copyright owner(s) are credited and that the original publication in this journal is cited, in accordance with accepted academic practice. No use, distribution or reproduction is permitted which does not comply with these terms.
*Correspondence: Joseph E. Borovsky, amJvcm92c2t5QHNwYWNlc2NpZW5jZS5vcmc=
Disclaimer: All claims expressed in this article are solely those of the authors and do not necessarily represent those of their affiliated organizations, or those of the publisher, the editors and the reviewers. Any product that may be evaluated in this article or claim that may be made by its manufacturer is not guaranteed or endorsed by the publisher.
Research integrity at Frontiers

Learn more about the work of our research integrity team to safeguard the quality of each article we publish.