- 1NASA Ames Research Center, Moffett Field, CA, United States
- 2Gemini Observatory/NSF’s NOIRLab, Hilo, HI, United States
- 3Gemini Observatory/NSF’s NOIRLab, La Serena, Chile
- 4United States Naval Observatory, Washington, DC, United States
- 5NASA Exoplanet Science Institute, Caltech IPAC, Pasadena, CA, United States
- 6Department of Physics, Southern Connecticut State University, New Haven, CT, United States
- 7National Optical Astronomy Observatory, Tucson, AZ, United States
Two new imaging instruments, ‘Alopeke and Zorro, were designed, built, and commissioned at the Gemini-North and Gemini-South telescopes in 2018 and 2019, respectively. Here we describe them and present the results from over a year of operation. The two identical instruments are based on the legacy of the DSSI (Differential Speckle Survey Instrument) instrument, successfully used for years at the WIYN and the Gemini telescopes in Hawaii and Chile. ‘Alopeke and Zorro are dual-channel imagers having both speckle (6.7″) and “wide-field” (∼1 arcminute) field-of-view options. They were built to primarily perform speckle interferometry providing diffraction-limited imagery at optical wavebands, yielding pixel scale uncertainties of ±0.21 mas, position angle uncertainties of ±0.7◦, and photometric uncertainties of Δm ± 0.02–0.04 magnitudes (for the blue and red channels, respectively) when run through the standard data reduction pipeline. One of their main scientific roles is the validation and characterization of exoplanets and their host stars as discovered by transit surveys such as the NASA Kepler, K2, and TESS missions. The limiting magnitude for speckle observations at Gemini can be quite faint (r ∼18 in good observing conditions) but typically the observed targets are brighter. The instruments can also function as conventional CCD imagers providing a 1 arc-minute field of view and allowing simultaneous two-color, high-speed time-series operation. These resident visitor instruments are remotely operable and are available for use by the community via the peer-reviewed proposal process.
1 Introduction
Outside of the Earth’s atmosphere, a telescope achieves its theoretical best performance by reaching an angular resolution that is limited only by the diffraction of light as determined by the light’s wavelength and the telescope’s aperture diameter. Within the atmosphere, the incoming light wavefront is distorted by the turbulent movements of air, degrading performance. While increasing the telescope diameter to more than the typical isoplanatic cell diameter of 5–20 cm will improve signal-to-noise, it will do little to improve the angular resolving power. To achieve the diffraction limited resolution of a large diameter telescope the corrupting influence of the atmosphere must be addressed.
Infrared observations made with ground-based telescopes have long benefited from the use of adaptive optic systems in which deformable mirrors rapidly correct the incoming wave-fronts (Hayward et al., 2001; Hodapp et al., 2003; Ramey et al., 2020). These systems are very complex, costly, require a natural or laser guide star, and additional setup time for each target observed.
Speckle interferometric imaging and Fourier reconstruction techniques allow ground-based telescopes to produce diffraction limited images (Labeyrie, 1970). Speckle instruments use cameras capable of reading out at a rate faster than the coherence time of the atmospheric cells, effectively “freezing out” wavefront distortions. The images obtained produce speckle interferograms that are then correlated in the Fourier domain yielding reconstructed images that have angular resolution at, or even below, the diffraction limit of the telescope (Horch et al., 2006; Horch et al., 2011b). In recent years, speckle interferometry has gathered renewed interest due to significant advances in digital camera technology that allow operation that is both sensitive and fast (Scott, 2018). Furthermore, the use of speckle techniques on large telescopes such as Gemini have enabled angular resolutions well suited for exoplanet candidate follow-up observations.
Following the construction and installation of the NASA-NSF Exoplanet Observational Research (NN-EXPLORE) Exoplanet Stellar Speckle Imager (NESSI) at the WIYN telescope (Scott et al., 2018), our research group built two additional speckle imagers for the twin Gemini-North and Gemini-South telescopes located in Hawaii and Chile, respectively. The two instruments are identical and named ‘Alopeke and Zorro, words meaning “fox” in the local languages.1 ‘Alopeke was commissioned in March/April 2018 and Zorro was commissioned in March/May 2019.
Like NESSI, these new instruments are generally based on the Differential Speckle Survey Instrument (DSSI, Horch et al. (2009, 2012b)) but contain larger format, faster EMCCD cameras, dual filter wheels, an easy to use observer GUI, and are fully functional through remote operation. The new instruments also take advantage of the sophisticated speckle image reconstruction software for point sources that is largely based on the work of one of us (E.P.H.) and has been incrementally improved by the team over the last few years.
Gemini Observatory consists of the Gemini South telescope on Cerro Pachon in Chile and the Frederick C. Gillett Gemini North telescope on Maunakea, Hawaii. The 8.1 m diameter primary mirrors are supported by 120 actuators that maintain the optimal shape, and the 1 m diameter secondary provide rapid tip-tilt correction. At any given time each telescope has ∼4 instruments mounted at the Cassegrain focus (including ‘Alopeke at Gemini North and Zorro at Gemini South) and the tertiary mirror can quickly direct the light to the requested instrument. Instrumentation2 includes imagers and spectrographs that span the optical to near-infrared and includes facility adaptive optics systems at each site that provide near diffraction-limited image quality in the infrared.
Speckle images at Gemini have integration times of 60 ms, thousands of which are obtained for each single target observed. A comparison of a single short exposure speckle frame to the equivalent integration of a 1 minute exposure (1000 speckle frames) is given in Figure 1. This figure also shows the Fourier power spectrum (fringes) and the final reconstructed diffraction limited image of a representative binary star.
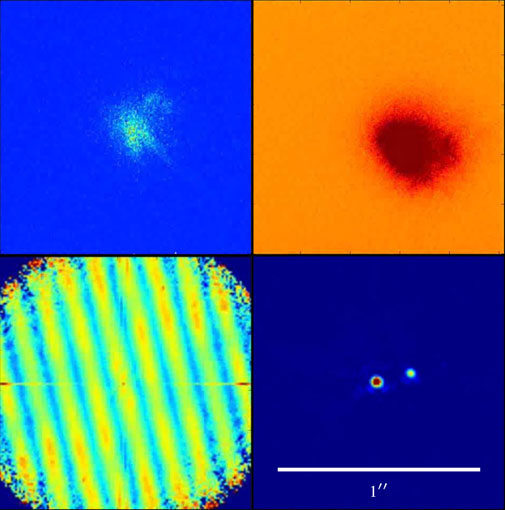
FIGURE 1. An individual 60 ms exposure speckle frame (top left); during observations data cubes of thousands of such images are collected and individually processed. A stacked image of 1,000 speckle frames shown for comparison (top right). This is what a typical 1 minute exposure would look like in these conditions. The important difference between these two images is that the short integration captures interferometric combinations without blurring them out as the atmosphere shifts. In the data reduction process, each speckle frame is combined in Fourier space producing a Fourier power spectrum (bottom left). From this, a reconstructed diffraction-limited image (bottom right) can be produced [Figure adapted from Scott (2018)].
The primary use of the speckle instruments at Gemini continues to be the validation and characterization of exoplanet targets from the NASA Kepler, K2 and Transiting Exoplanet Survey Satellite (TESS) missions, as well as exoplanets discovered by precision radial velocity (RV) and other measurements (Howell et al., 2021a; Howell et al., 2021b; Lester et al., 2021). Speckle imaging enables binary/close companion systems with separations from ∼0.02 to 1.2″ to be imaged and directly have their color, separation, and position angle determined. From these data, individual stellar masses and binary orbital periods can be estimated.
The determination of binarity is used to validate potential exoplanet detections, particularly in the case of blended binaries. Constraints placed on the stellar properties help to characterize exoplanets and their host stars. The instruments also provide photometric data that can determine accurate stellar magnitudes and colors, which in turn can provide stellar parameter and structure information for stellar modeling. The limiting magnitude for speckle observations is around 18th magnitude in SDSS r at Gemini, while wide-field, normal CCD imaging operation allows longer exposures and therefore can go much fainter. The instruments are also well-suited for fast operation and high time resolution observations with integrations possible as short as 1 ms, suitable for time-domain astronomy, transients, and general variability studies.
2 Methods and Materials
2.1 Instrument Description
The Gemini instruments ‘Alopeke and Zorro have identical cameras and internal components to the NESSI instrument at WIYN (Scott et al., 2018). They differ only in form factor and lens choice, due to 1) different f-ratio input beams between WIYN and the Gemini telescopes and 2) ‘Alopeke and Zorro have a two lens system for the wide field mode collimation stage where NESSI has only a single simple collimation lens. The major components of the Gemini instruments are shown in Figure 2. The Gemini instruments are located between the Instrument Support Structure (ISS) and the Gemini Calibration (GCAL) unit. To mount the instrument, a thin light baffle was replaced by a structural cylinder that connects the ISS to our instrument while maintaining an unobstructed path to GCAL. As a result of the restricted space, the instruments are designed to be extremely compact and have a “pick-off arm.” This motorized arm is on a remotely operable rotating stage that can extend a 4 inch mirror into the Gemini light path and direct the beam to our instrument. Effectively, this set-up adds a new instrument port onto the Gemini telescopes.
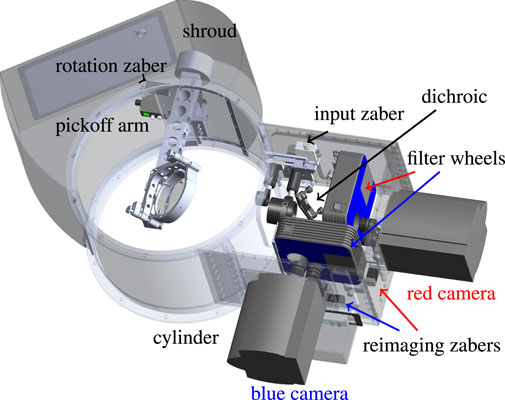
FIGURE 2. The Gemini Speckle Instruments–‘Alopeke and Zorro. The two instruments are identical and are constructed to make use of limited space between the instrument mounting surface and a calibration unit at the Gemini telescopes. As much as possible, commercial off the shelf (COTS) parts were used in the “optics bench in a box” housing. The main structural component is a rolled aluminum cylinder that replaced a sheet metal light baffle. For reference, the inner diameter of this cylinder is 0.4 m with a height of 0.28 m. The box housing the optics and components is 0.32 m on a side. The main parts of the instruments are labelled: the structural cylinder, pick-off arm and mirror with Newport Pico motors for alignment, collimating and re-imaging lenses mounted on motorized stages made by Zaber Inc., Newport filter wheels and Andor EMCCD cameras.
The Gemini telescopes provide an input beam to ‘Alopeke and Zorro that has an f-ratio of 16. The input optic for the instruments in speckle mode is a 1 inch diameter 35 mm focal length convex lens. This collimates the beam which passes through the dichroic for the red channel or reflects for the blue channel. The light then passes through the filter wheels and into the camera lens, a 75 mm focal length convex lens. For wide field mode the input optics are two two in diameter lenses with focal lengths of 75 mm and -100 mm and the camera lenses have a 50 mm focal length.
One key aspect of the instruments is the simultaneous operation of two optical channels. Dual-channel operation doubles the amount of data recorded for a given exposure; thereby increasing the signal-to-noise ratio (SNR) and allowing target colors to be determined. Color data may be used to distinguish between close line-of-sight companions and true bound pairs, aid in the elimination of false detection, and provide stellar parameters for the stars observed. Color information may also be used in the data reduction process to compensate for atmospheric dispersion, a major source of error at the smallest spatial scales (Horch et al., 2009). When operating as speckle interferometers, these instruments can provide both astrometry and photometry for targets and reach diffraction-limited resolution of 17.5 mas at 562 nm (Wooden et al., 2018; Lester et al., 2021). At Gemini, the DSSI speckle camera achieved diffraction-limited resolution for binary separations and provided astrometric and photometric precision of ∼1 mas and ∼0.1 magnitudes, respectively (Horch et al., 2012b). When their capabilities are fully exploited, we expect similar performance from ‘Alopeke and Zorro.
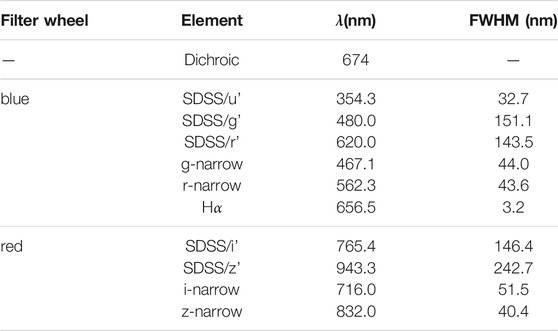
The Gemini instruments also have a “wide-field” mode, that is a field-of-view (FoV) near one arcminute. Filters included are standard Sloan Digital Sky Survey (SDSS) filters and custom narrow-band filters used for speckle work. The design of the speckle mode optics has a pixel scale of 0.0096″/pxl, while the pixel scale of wide-field mode is 0.0725″/pxl. Figure 3 and Table 1 show the particular filters and the transmission curves for the filters and dichroic used.
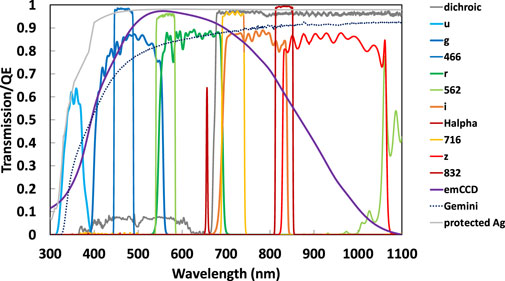
FIGURE 3. The EMCCD Quantum efficiency curve for the Andor iXon Ultra 888 EX cameras is shown here along with the overall Gemini telescope transmission curve. ‘Alopeke and Zorro have a single Ag pickoff mirror whose transmission is also shown here. Within the instruments, the dichroic divides the incoming beam into red and blue channels at 674 nm. Each channel has a filter wheel with two narrow-band filters for speckle observations, which are centered at 466, 562, 716, and 832 nm. In addition to the narrow filters, each wheel has wide-band SDSS (ugriz) filters suitable for broadband photometry and imaging. The data for these curves were supplied by the respective manufacturers. Note: the Ag curve describes reflection, not transmission for the pickoff mirror. The Gemini curve represents the total transmission for the telescope prior to the instrument and was provided by Gemini staff.
In terms of basic function, the instruments are quite simple. Light entering from the telescope science fold is collimated by the first lens system and passes through or is reflected off of a dichroic element. Each beam passes through a filter wheel and then a re-imaging lens. The input and both re-imaging lenses can be switched via remotely operable stages to select between the narrow speckle FoV and wide-field mode. The collimated beam is incident upon a Semrock manufactured dichroic with a break at 673.7 nm. This dichroic splits the beam into “red” and “blue” components. Each beam has its own detector. Nyquist sampling is achieved in the red channel, however the blue channel is slightly undersampled. As a result of the single dichroic reflection, the blue and red channel images are reversed. The fields of both modes under-fill the detector and experience some vignetting of the edges from the shadow of the dichroic filter holder. For speckle observations, the unvignetted FoV is 6.7″. During speckle observations, we center a region of interest (ROI) on a star or stars and observe a sub-ROI of 256 × 256 for 1,000 frames per data cube. This is approximately 2.5″ on a side, so vignetting is not an issue. The diameter of the vignetted wide-field is ∼ 60″, however, the diameter of the unvignetted wide-field is ∼ 35″.
Filter wheels for each beam of the instrument are Newport Corp. model USFW-100. Each filter wheel is capable of holding six one-inch round filters. As each beam of our instrument requires only two wide-band and two narrow-band filters, we have options for future expansion (e.g., an Hα filter has been installed in Zorro).
‘Alopeke and Zorro use two identical Andor iXon Ultra 888 EX EMCCD cameras. These cameras have a 1024 × 1024 pixel array with 13 μm square pixels. Their rapid readout rate and low noise makes them very well suited for speckle observations. The CCDs are frame-transfer CCDs, enabling high-speed shutterless operation. The entire chip can be read out at 26 fps and up to 9,690 fps for subarray readout. The maximum readout rate is 30 MHz. In electron multiplying mode, read noise is <1 e− and the detectors are sensitive to single photons. The maximum pixel well depth is 80,000 e− with a dark current of 0.0002 e−/pix/s. The adjustable gain and electron multiplying mode enables a large dynamic range but also allows the detectors to be used as normal CCDs for imaging. The EX coating gives >80% quantum efficiency from 420 to 780 nm and >90% QE from 550 to 720 nm. The detector response is >99.9% linear. They are thermoelectrically cooled down to a minimum of −95°C with no consumables, although we typically operate them at −60°C. Clock induced charge is a hurdle for EMCCDs, which we mitigate by careful selection of camera readout modes (Scott et al., 2018). Data are transferred to the control computer via USB3 and then transferred via the Gemini LAN. Raw image data collected each night is sent to the Gemini Observatory Archive, our team’s backup archive, and to NASA’s Infrared Processing and Analysis Center (IPAC) for processing.
3 Results
3.1 Operation
One big advantage of the speckle imaging technique is the efficiency of observing. Typically targets are organized into queue blocks based on proposal rank and hour angle. Targets are then observed in sets of FITS file data cubes, bracketed by point-source calibration targets. Each FITS file contains 1,000 individual frames of 60 ms exposures. Each observing sequence generates a FITS file consisting of a 3-D image extension and a binary table extension containing timestamps for each frame in each channel, red and blue. For bright targets or point source calibrators, a single 1 min observation may be sufficient. For faint sources, more files are taken as part of a set. Based on our observations and data analysis experience, we have an empirically derived guide to the typical number of sets acquired for a given target magnitude (e.g., a target of apparent magnitude ∼12 would be observed for about 8 min in good conditions resulting in the collection of ∼ 8,000 individual frames). During the data reduction process, the entire set of FITS files (one or more) are combined in Fourier space and reduced as one single observation. Note that this differs greatly from image stacking, shift-and-add, or lucky imaging which selects only a small fraction of recorded frames and combines them in the spatial domain. By combining the data interferometrically in the frequency domain, each frame contributes to the signal. For most targets, sets of three to five files are all that is required along with a point spread function (PSF) calibrator observation. The PSF standard is typically a bright, single star that is used to calibrate the data in the Fourier reduction pipeline. It is not uncommon for 50–60 (bright) science targets and their point source calibrators to be observed in a single night.
To improve the operation of our instruments, our team has developed custom software to control all aspects of the instrument and Andor cameras. The user GUI control software runs under Ubuntu Linux, makes use of the Andor Corporation SDK, and is based on the C and TCL languages. From this GUI, the instruments may be operated with minimal user input for “standard” speckle observations. The pick-off arm, lens selection stages, and filters may be controlled from the software. The Andor cameras have many user-controllable settings, most of which are set automatically by the observing control software. For speckle mode the primary configuration settings are a region-of-interest (ROI) of 256 square pixels, a 60 ms exposure for a series of 1,000 frames per FITS file. The detector is cooled to −60°C and read out at 20 MHz at a vertical shift speed of 1.13 µs. The cameras may be operated as conventional CCDs or in electron-multiplying mode. The Andor iXon Ultra has the capability to “over-clock” the vertical shift transfer speed which reduces the clock-induced charge (CIC) and leads to faster frame rates. This is especially valuable for sub-frame ROIs and when binning. These over-clocked shift speeds come at the cost of reduced single pixel well depth. For our speckle operations, we operate well below the pixel well depth and so make use of the over-clocked speeds. The horizontal pixel shift readout rate defines the rate at which pixels are read from the shift register and is also user adjustable. A faster horizontal readout rate enables a greater frame rate but increases the readout noise. For our speckle sub-full frame ROIs (256 × 256 pixels), we use the slowest rate that still allows for 60 ms exposure times in a kinetic series.
At the end of the night, the science data, calibration data, and observing notes are delivered to IPAC’s data center. All raw data are also uploaded to the Gemini Observatory Archive.3 The data are subject to a proprietary period as specified by the principal investigator of the program. Usually within a few weeks, speckle data are run through our data reduction pipeline which produces reconstructed speckle images and 5σ contrast detection limit curves for each target in both filters. The reconstructed images are produced by the procedure outlined in Section 2.2 of Scott et al. (2018). The data reduction pipeline, which is partly automated, takes about one full day to reduce one night’s worth of data. In the event that a companion is detected, the derived properties of separation (arcsec), position angle (degrees), brightness ratio (magnitude), and seeing (arcsec) are produced and written to a results file.
An example is given in Figure 4 of the reconstructed speckle images and 5σ contrast detection limit curve that are delivered to each principal investigator. Since a companion was detected for TOI 1217, the results of the accompanying binary fit are given in Table 2. Reduced speckle data products are uploaded to the NExScI Exoplanet Follow-up Observing Program (ExoFOP) website archive.4
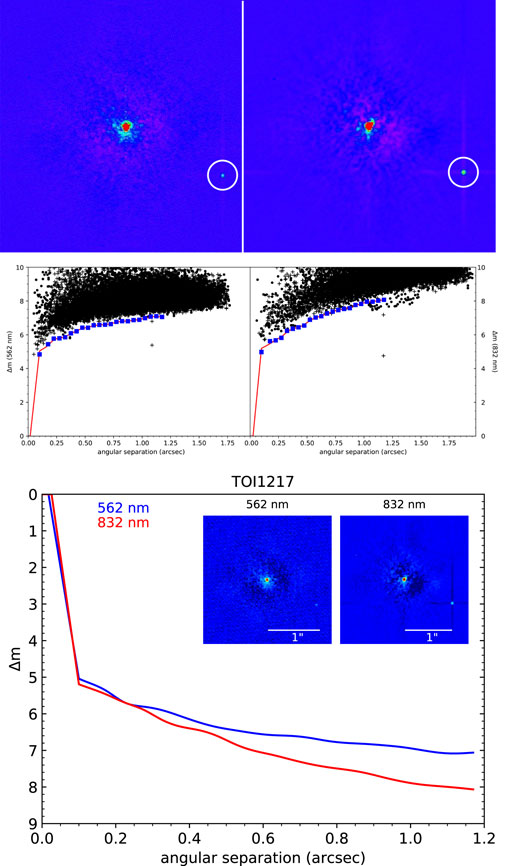
FIGURE 4. The reduced data products provided to users for TOI 1217. At the top are the final reconstructed images for the 562 and 832 nm observations (left and right, respectively). For clarity, the detected companion is circled in these images. In the middle row are the respective detection contrast limit curves. The curves here represent the 5σ detection limit and the detected companion is evident as the “+” symbol located below the detection limit. At the bottom is a final plot provided as part of the data reduction compositing the reconstructed images, scale, and 5σ contrast curves for both filters.
3.2 Pixel Scale Calibration
The data reduction pipeline calculates binary parameters for any detected companions based on fringe detection in Fourier space. It then produces a single reconstructed image from the thousands of frames taken for each target and in each filter. The pipeline accepts a pixel scale to translate the pixel separation in the images to angular separation on the sky. In order to produce an accurate conversion from pixel-space to angular separation, this pixel scale needs to be calibrated.
As part of the calibration process, close binaries (separation ≤1 arcsec) can be used as pixel-scale calibrators. A sample of such binaries with well known orbits are observed during each observing run, and from their reduced data an accurate pixel scale is derived for each channel. A representative sample of the set of calibration binaries used for determining the pixel scale and delta magnitude (brightness ratio) measurements is described in Table 3.
The pixel scale of camera changes at different rotator positions, after instrument changes, and from some changes of the Gemini telescope itself, for example adjustment of the science fold mirror. Also, at times the cameras are removed from the instrument as a precaution during work on other instruments and the camera is placed back at a slightly different focus position. In practice this is why pixel scale calibration observations are done for every run and a new pixel scale is derived and used for all data from that run so that the variations have little to no impact on the data quality itself. The variations in pixel scale are within one to two standard deviations between runs in almost every case.
After every observing run, a fringe-fitting routine is performed on the speckle data for the calibrators. This routine outputs the separation in pixels and the position angle in degrees. This separation and position angle is compared to the separation (in arcseconds) and position angle (PA) determined from the orbital empherides derived from the Washington Double Star Catalog ephemerides.5 From this, a pixel scale (arcsecond/pixel) is determined for each observing run. The average pixel scale and position angle difference per observing semester are given for each instrument in Table 4 and shown graphically in Figure 5. A combined global average is also given for each instrument. Relatively large shifts in pixel scale, of ∼1%, do occur after the instrument has been removed and replaced back on the telescope but are compensated for in each run’s pixel scale calibration. The pixel scale and position angle values are derived for each run and yield a typical uncertainty/run of ±0.21 mas for the pixel scale and ±0.7 degrees for the position angle. For more detailed astrometric work refer to Colton et al. (2021).
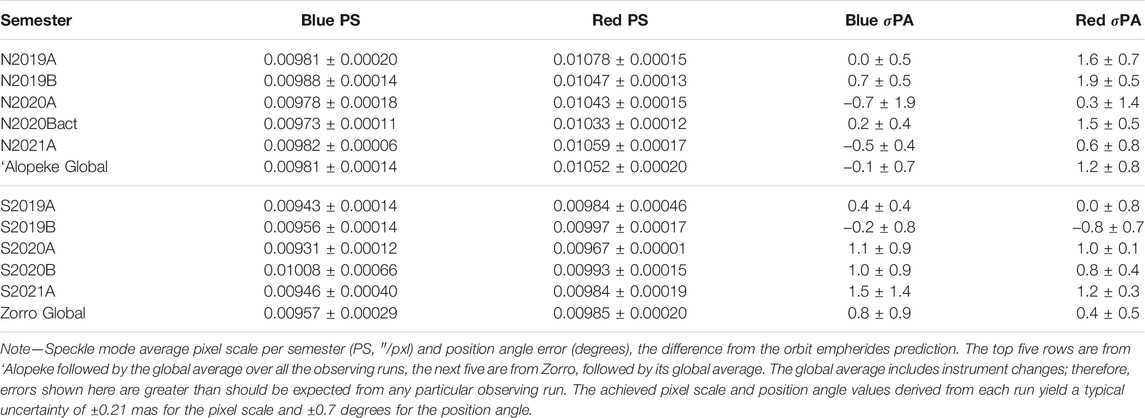
TABLE 4. Speckle mode average Pixel Scale and Position Angle difference from orbit empherides prediction for each observing semester.
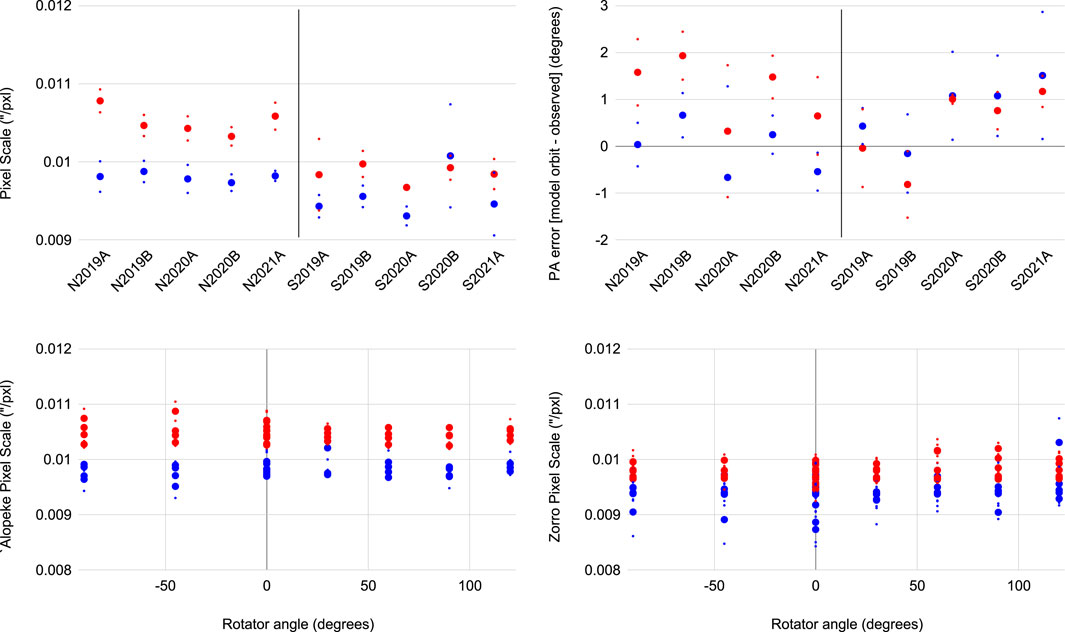
FIGURE 5. The average pixel scale for each observing semester (top left) for ‘Alopeke and Zorro (prefixed with “N” and “S,” respectively) in the 562 (blue) and 832 (red) nm filters. A single average pixel scale is determined for each observing run and plotted here along with the standard deviation. Top right shows the position angle error found by taking the difference between the predicted companion position angle at time of observation from the measured position angle for each run. The bottom row shows the derived pixel scale across various instrument rotator angles. ‘Alopeke is shown on the left and Zorro on the right. The instrument rotator changes the angle of the calibration binary image on the CCD, allowing the pixel scale to be derived at different orientations.
At least once per observing run, a specific calibration binary is observed 9 times in a row while the telescope image rotator is rotated through distinct positions. Data are recorded at each fixed rotation angle and are used to examine the pixel scale over the entire FoV, at all position angles, and in each color (results shown in Figure 5, bottom row). This test gives us additional information on the pixel scale in regards to any tilt or optical issues across the FOV. See Horch et al. (2012a) for an example of this procedure for a past instrument. We see no significant change in pixel scale across rotator angle. Outliers in these plots can be traced back to nights of extremely poor conditions where there were few data points and low SNR.
3.3 Magnitudes
We have discussed above the measurements and uncertainties in our derived values for separation and position angle. Here, we discuss the third parameter derived from speckle measurements in which a companion is detected, the magnitude difference between the two stars. For this we used a sample of calibration binaries that are regularly observed. Figure 6 provides an illustrative comparison between the Alopeke and Zorro measured Δm values to ΔV values taken from the WDS catalogue. For the stars that we observed more than once, we have calculated the mean of their binary fit in Δm, ρ (separation), and seeing, and plotted the standard deviation of each with vertical bars showing the range as seen in multiple observations. Stars with no bars were only observed once and we assign no formal errors to the V magnitudes taken from the WDS. In Figure 6A, the difference between the binary stars’ magnitudes (ΔV), taken from the WDS catalogue, is plotted as a function of the magnitude difference observed by us in each filter (Δm): 562 and 832 nm. The measured magnitude differences agree nicely with the literature considering we’re comparing narrow-band and broad-band filters. We note that the 562 nm observations fall closer to V, as expected. Figure 6B gives the differentials of the magnitude differences (ΔV−Δm) as a function of seeing, measured during the binary fit. We see a good correlation across a range of seeing values as our Δm values track the standard V measures. In Figure 6C, the differential ΔV−Δm is presented as a function of separation (ρ), which shows that within our typical field of view ( ∼1″), the measured magnitude differences (Δm) of the binary components are quite consistent across multiple observations, typically to within ±0.1 mag. In Figure 6D, the differential ΔV−Δm is plotted as a function of separation (ρ, ″) times seeing, a metric used for assessing data quality. Beyond 0.6 arcsec2, a possible loss in correlation may occur for only some Δm measurements, leading to the Δm value being overestimated. A similar decrease in precise Δm reliability was also noted by Horch et al. (2011b) for DSSI measurements and can result in an overestimation of the observed magnitude differences between binary companions when the value of ρ times seeing exceeds ∼0.6 arcsec2.
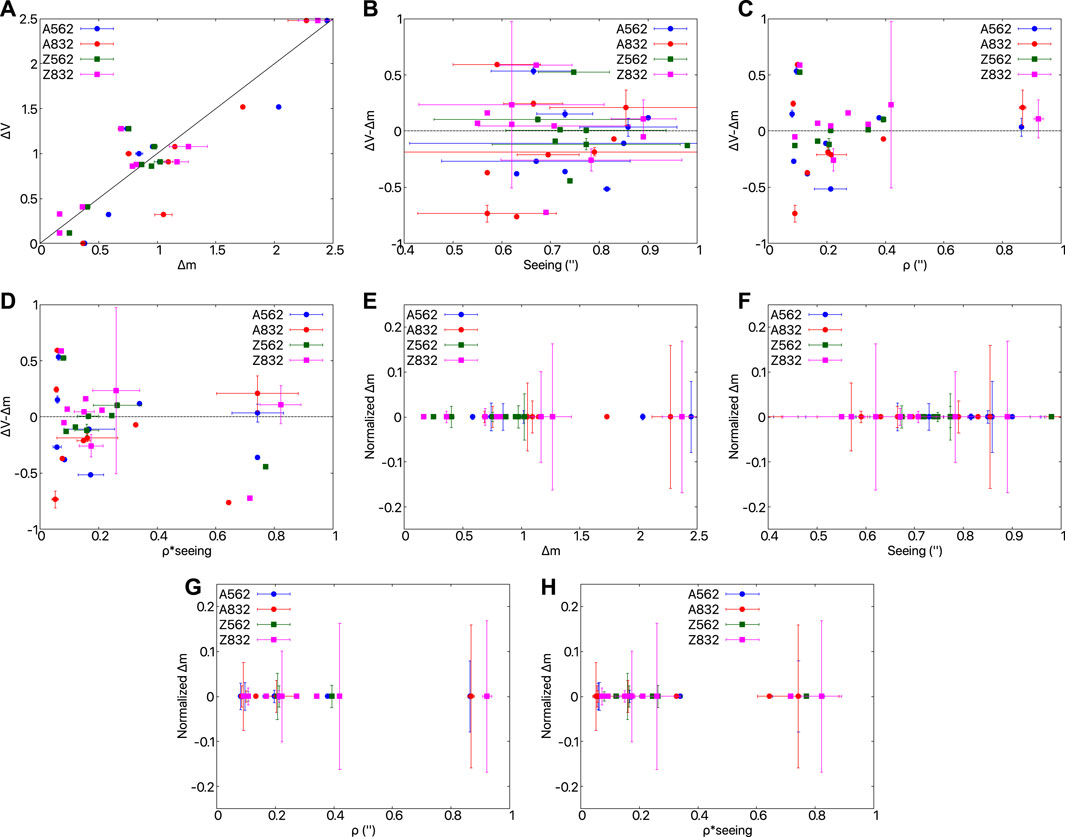
FIGURE 6. Illustrative plots showing the relationship between our derived Δm from ‘Alopeke (blue and red circles) and Zorro (green and pink squares) observations of the calibration binaries compared with ΔV values taken from the WDS catalogue. For stars that were observed more than once, horizontal and vertical bars are given showing the standard deviation of the measurements. The points without such bars were only observed once. In subfigure (A), we compare our run of magnitude differences in both filters (Δm) with that of ΔV from the WDS. We would not expect this to be a perfect match as we are comparing two different photometric filter systems, but we note the similar trend in the values. Our 562 nm values are closer to V than the 832 nm values, thus they are a better match to V. For the same sample of calibration binaries, we present the measured difference in the stellar component magnitudes (Δm) but normalized by subtracting the average Δm for each observation. This allows us to intercompare our Δm measurements over their different values and in a variety of observing conditions. For stars with more than one observation, vertical bars were plotted showing the standard deviation of the measurement and the range in our derived measurements. Plots (B), (C), and (D) show the difference in Δ magnitudes with respect to Seeing (″), separation (ρ), and the product of seeing and separation, respectively. The plots show the normalized Δm with respect to (E) the observed range in Δm, (F) seeing, (G) binary separation, and (H) the product of separation*seeing. We note from these plots that our narrow-band instrumental photometry generally follows a standard photometric system even as observing conditions change.
Measurements of Δm for detected companions with Zorro are similar to those measured with ‘Alopeke, despite Maunakea typically having better seeing conditions. For our particular observing runs, Cerro Pachon had better than average seeing for that site, and this resulted in similar quality data from each instrument.
In Figures 6E-H, we present the same sample of calibration binaries but with their measured magnitude differences (Δm) normalized by subtracting the mean Δm for each observation. The use of a normalized Δm allows us to intercompare our Δm measurements over their different values and in a variety of observing conditions. For stars with more than one observation, vertical bars were plotted to show the standard deviations of the Δm measurements, and horizontal bars show the standard deviations of the derived seeing, separation (ρ), and the product of ρ times seeing values.
These plots highlight the robust precision of the majority our observational determination of Δm over a variety of seeing conditions as well as with companion star separation and with seeing times separation. Higher uncertainties can occur for large values of Δm, seeing greater than about 0.8 arcsec, and ρ times seeing values greater than 0.6 arcsec2. Typical Δm uncertainties of ±0.02 magnitudes in the blue channel and ±0.04 magnitudes in the red channel can be expected for either instrument.
3.4 Contrast Curves
As described in Horch et al. (2011a), a series of annuli that define bins of separation may be centered on the target star. Contrast curves that represent the 5σ detection limit can then be made from these bins. This is done for each target processed by the speckle data reduction pipeline.
Contrast curves for all data from 2019 through mid-2020 are overplotted in Figure 7. A line of best fit for the blue and red channels was computed using GNUPLOT and a combination of a negative exponential function and a quadratic of the form:
with best-fit values a = 2.46, n = −5.87, b = 0.07, d = 0.3, c = 2.46 for ‘Alopeke blue channel, a = −0.97, n = −6.93, b = 0.09, d = 1.34, c = 6.91 for ‘Alopeke red channel, a = 2.66, n = 0.07, b = −6.31, d = 0.43, c = 2.66 for Zorro blue channel, a = 3, n = −7.04, b = 0.09, d = 1.21, c = 3 for Zorro red channel. These fits results in an average reduced chi squared of 0.7 and 0.6 for ‘Alopeke blue and red channel data and 0.7 and 0.5 for the Zorro blue and red channels, respectively. These are characteristic curves based on more than 1 year’s worth of data covering a wide range of target magnitudes and observed under various sky conditions then processed with the semi-automated “standard” data reduction pipeline. This empirical solution seems to represent the data well for illustrative and observing planning purposes. The primary factors that impact the observed contrast limit are the target brightness and observing conditions: atmospheric seeing and sky brightness. Due to telescope scheduling targets are most often observed during bright conditions, but typically at seeing better than ∼1″.
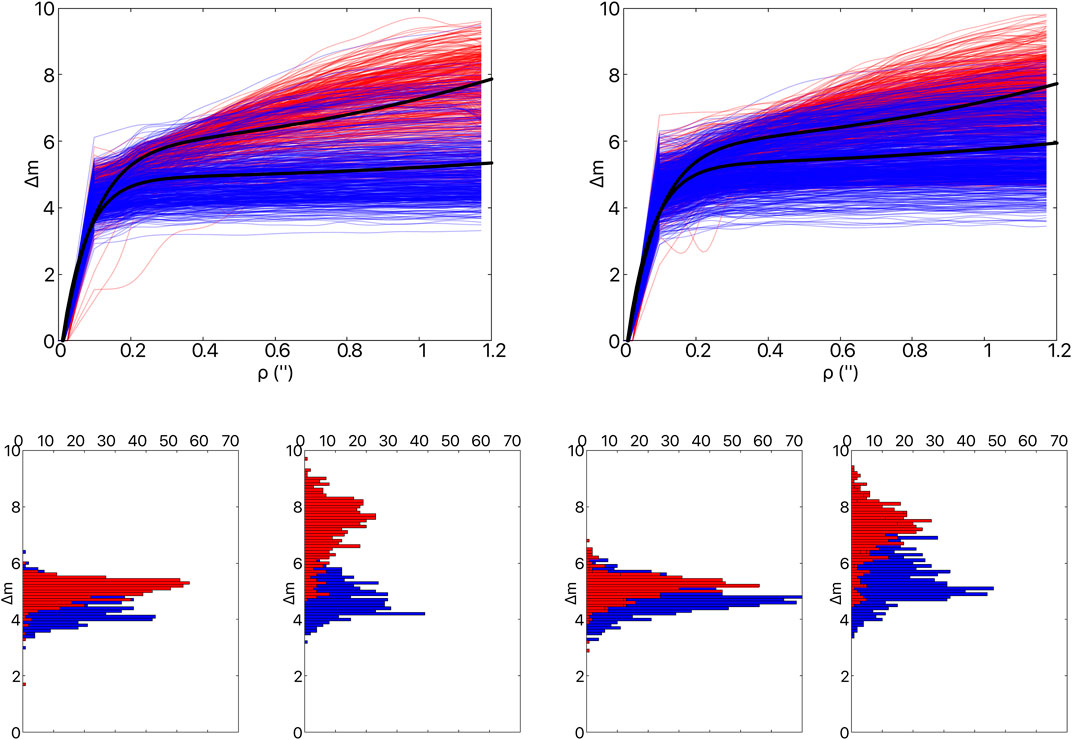
FIGURE 7. ‘Alopeke and Zorro Contrast Curves (top left and right, respectively), a compilation of 1,094 5-sigma contrast curves for data taken from 2019 to mid-2020 in the 466, 562, 716 and 832 nm channels. The 466 and 562 nm data is shown in blue while the 716 and 832 nm data is shown as red. The black curves are fits to the 562 and 832 nm data. The bottom row shows contrast curve cuts at 0.2 and 1.0″ for ‘Alopeke and Zorro, respectively. These cuts help to highlight the distribution of the set of contrast curves. The red data typically have better contrast than the blue due to the wavelength dependence of the seeing. Also, targets observed at higher airmass are less likely to be detected in the blue filter.
3.5 Photometric Calibration
In order to derive a photometric calibration for the wide-field mode several standards from the Southern u′g′r′i′z′ standard star catalog6 were observed with Zorro on the night of October 25, 2020. Image reduction and photometry were performed with standard IRAF tools (ccdred, apphot), while the transformation equations were derived with IRAF/photcal. The following equations were obtained, where the zeropoints and color terms were fitted with X being the airmass. The extinction terms come from the Gemini webpages and correspond to the values at Cerro Pachón,
The zero points of these equations can be directly compared to those of GMOS-S. From the GMOS web pages7 we obtain (27.99, 28.24, 28.23, 28.02) for griz, respectively. The differences mostly arise from the different QE of the detectors, while the iXon Ultra presents a flat QE from 400 to 700 nm, slightly outperforming the GMOS/Hamamatsu below ∼ 450 nm, the Hamamatsu are red-sensitive with a much improved QE over the iXon Ultra above ∼ 750nm, explaining the 1 mag difference in z. At 350 nm the iXon Ultra QE is lower than the Hamamatsu QE, but it rises faster towards 400 nm, and therefore the u-band performance is expected to be similar. Since GMOS-N lacks a u filter, ‘Alopeke can be a good alternative for point sources or slightly extended sources at this wavelength. u-band calibration equations will be at the ‘Alopeke/Zorro Gemini pages when available. Given the overall similarities in the zeropoints, the GMOS exposure time calculator8 can be used to estimate exposure times for the Zorro/‘Alopeke wide field, with the aforementioned caveat in z.
4 Discussion
4.1 Science With the Speckle Cameras
The primary motivation for our speckle imaging instruments is the validation and characterization of exoplanet host stars detected by the space missions Kepler, K2, TESS, and future missions (Howell et al., 2021a; Howell et al., 2021b; Matson et al., 2018). Wide-field exoplanet transit search missions, by design, have large pixel scales (e.g., 4 to 20 arcsec/pixel) and often, more than one star falls into each pixel, confounding the scene and obtained light curve. This can lead to false positive exoplanet detections and improperly determined stellar parameters resulting in incorrect conclusions about exoplanet characteristics. Furthermore, if the system is a multiple star system the derived exoplanet radius will be smaller than in actuality (Ciardi et al., 2015; Furlan and Howell, 2017). Figure 8 illustrates the effect of blended binaries when observed with different instruments; only high-resolution imaging can resolve sub-arcsecond binaries. The binaries detected throughout the course of these observations also provide fundamental astrophysics data, orbits, and stellar masses.

FIGURE 8. An SDSS i-band image of the spectroscopic binary beta Del left. The same SDSS i-band image re-sampled to the 21″ pixel scale for TESS with an inset showing the scale of the speckle FoV center. A reconstructed speckle image right of the binary from ‘Alopeke (ρ = 0.225″, Δm = 1.1). These images illustrate the difficulty in distinguishing blended sources within the large-scale photometric survey space telescopes like TESS and motivates the high-angular resolution imaging follow-up for exoplanet detections.
Speckle imaging is extremely sensitive to detecting and characterizing angularly close companions (i.e., binary systems) in a single observation and provides the separation, position angle, and color difference of the sources. Beyond validating exoplanets, Alopeke and Zorro are routinely used for various studies of binary stars and stellar multiplicity. Determining the multiplicity rates across stellar spectral types and the relationship between multiple systems and planetary system architecture is an on-going area of investigation. Winters et al. (2019) investigated the multiplicity rate of 1120 M stars within 25 pc and found that roughly a quarter of local M dwarfs have stellar companions at separations less than 300″. Winters et al. found a weak trend of smaller projected separation with decreasing primary mass, with a peak in the separation distribution at 4–20 au. Within 10 pc the multiplicity rate for M dwarfs was found to be 18 ± 3% at separations less than 2”. Horch et al. (2014), Matson et al. (2018) show that the FGK exoplanet hosts stars have a binary fraction near 46% and consistent with to the “field population” rate near 40–50% as found by Raghavan et al. (2010).
A fast and sensitive optical imager on an 8 m-class telescope has a multitude of uses beyond speckle interferometry, particularly when it is readily available to the Gemini community. These instruments are capable high-speed imagers with sub-millisecond timing precision coupled with a full set of SDSS filters enabling photometric work in a regime that is not frequently studied. ‘Alopeke and Zorro have already been used for observations of transients, targets of opportunity (ToO’s), time-domain astrophysics, and fundamental stellar astrophysics. Some of these interesting and atypical use cases currently being investigated include: large samples of nearby M/K/brown dwarfs, creating an unbiased TESS sample, cluster photometer and astrometry, transit photometry and occultation, and Nova shells or possible stellar mergers Figure 9.
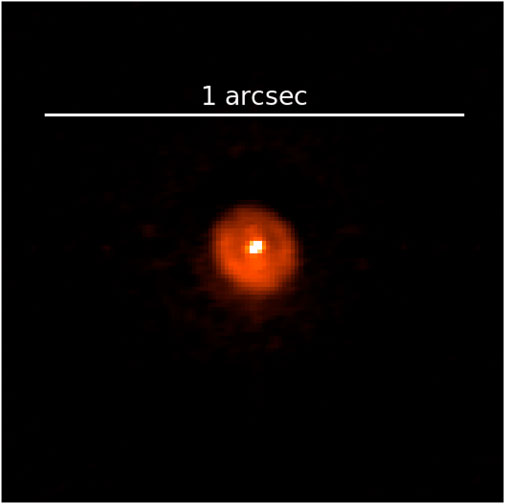
FIGURE 9. Nova V906 Car observed with Zorro on November 22, 2020; 978 days after its explosion. The image was taken with the 832 nm filter and shows an expanding nova shell with a radius of 90 mas. Detection of nova shells close to their progenitors will allows better understanding of their early geometries and expansion rates to a degree unachievable by seeing-limited observations.
4.2 Time Domain Astronomy
Although these instruments were built for speckle imaging, in meeting those design requirements our instruments also function as capable high-speed CCD imagers with application in time domain astronomy. Each camera is synchronized before every exposure with the instrument control computer that is connected to a Gemini network time protocol (NTP) server. Our control software produces a FITS timing table with timestamps for each frame. The published Andor camera timestamp accuracy is 10 ns
To test ‘Alopeke and Zorro’s performance for time-domain astronomy we performed two observational tests. First we observed the eclipsing white dwarf ZTFJ0220 + 2,141 (Kosakowski et al., 2021) and the short-period eclipsing cataclysmic variable SDSS J150240.98 + 333423.9, aka NZ Boo (Szkody et al., 2014). Characteristic examples of the resulting lightcurves are shown in Figure 10). The time-series light curves were produced from a series of 340 3-sec exposures taken on Feb 16–18th (ZTFJ0220 + 2,141) and June 6th and ninth 2020 (NZ Boo). ZTFJ0220 + 2,141 has an estimated eclipse duration of 90 s and NZ Boo has an estimated eclipse duration of 4 min. Due to their short duration events like these are easily missed in longer integrations.
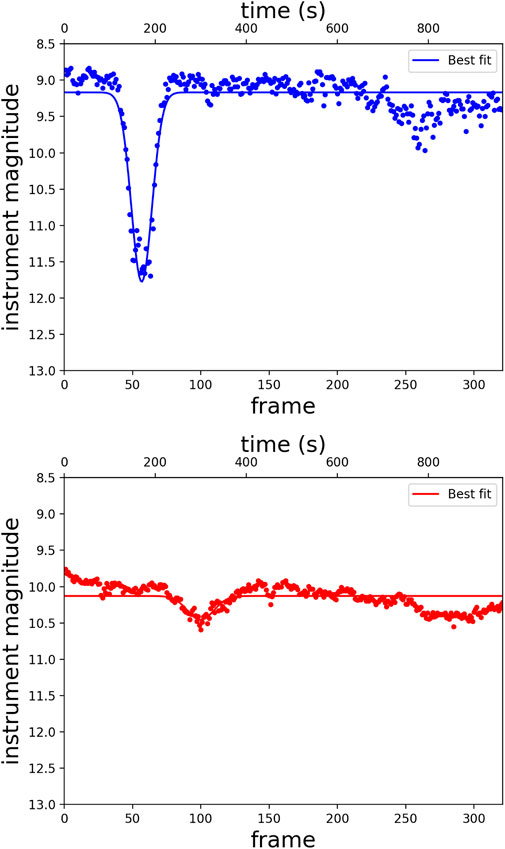
FIGURE 10. Light curve of the eclipsing white dwarf ZTFJ0220 + 2,141 taken in February 2020 (top). Multiple light curves were taken in both red and blue channels; this example light curve is from the blue channel. A Gaussian fit was applied to the eclipse with no de-trending applied to the data. 340 3-s exposures were taken to capture the ∼90 s eclipse duration. Bottom shows a characteristic light curve of the cataclysmic variable NZ Boo from data taken in June 2020. Multiple light curves were taken in both red and blue channels; this example lightcurve is from the red channel. A Gaussian fit was applied to the eclipse. The estimated eclipse duration is 4 min. These light curves demonstrate the high cadence observations possible with ‘Alopeke and Zorro.
Ultimately the most rigorous test of our timing precision and accuracy was the observation of the GPS satellite, GPS BIIR-2 PRN 13 aka “G13”. A series of 1,000 frames of 60 ms exposures were recorded as the satellite passed over Hawaii during twilight. By comparing the precisely known position of the GPS satellite for a given time from the empherides and comparing it with our observations (Figure 11) the accuracy of our camera time stamps can be measured directly.
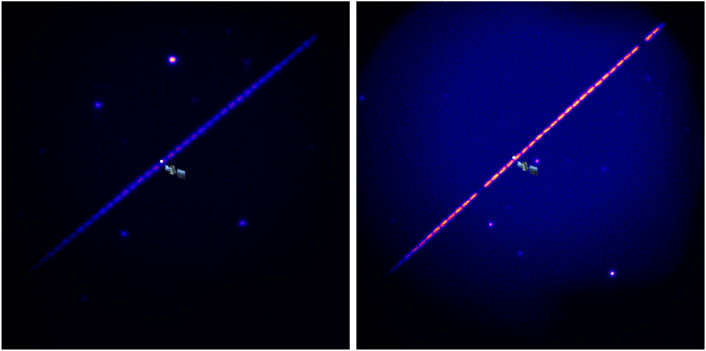
FIGURE 11. These are stacks of frames from a larger series taken from Gemini-North with ‘Alopeke on June 14th, 2020. The target is a crowded field that coincides with the path of the satellite GPS BIIR-2 PRN 13 aka “G13”. G13 crossed the wide field of the instrument moving at a rate of 35.4″/sec. A series of 60 ms exposures were taken in wide-fov mode. The images shown are from the 716 nm filter. The known position for observation time 14:49 UTC based on the ephemerides for the satellite is shown and corresponds to frame number 132 in the sequence left. The satellite path corresponds to frame 331 for the 14:55 UTC series right. Each “dash” in the stacked image corresponds to one exposure. Note that two of the dashes appear fainter in the 14:55 UTC stack due to image scaling but this has no impact on the measurement. Based on the timestamps recorded for the frames and the known time for the position of the GPS satellite we can conclude the absolute time accuracy for the instrument is ∼160 ms. For relative time measurements/kinetic cycle time within a file sequence the time precision is 70 ns
The procedure for measuring the timing accuracy by observing the GPS satellite is as follows: 1) Find the range of images with the satellite, 2) Median stack those images to remove the satellite and build up S/N on the stars, 3) Match the stars in the stack with GAIA to derive the WCS for the stacked image, 4) Measure the satellite position in each image using the WCS from the stacked image, 5) Find the closest position in the satellite ephemeris and calculate the time offset.
From the GPS observations, we conclude that our absolute timing accuracy is 163 ± 0.07 ms. The major contributor in this uncertainty is thought to be the variable lag between the computer receipt from the NTP server and the triggering of the cameras. The average timestamp frame-to-frame precision during a kinetic time series is 73 ns However, this is an average of the internal timing of the camera triggering during a single file sequence. The real-world performance has significant additional overheads and variable systematic errors that greatly depend upon the various settings of the camera. The standard deviation of the difference between frame timestamp and calculated frame time (from first frame + KCT*frame_number) is 19.5 ns For future time-domain work the incorporation of individual GPS time receivers to externally trigger the cameras should enable 10 ns precision.
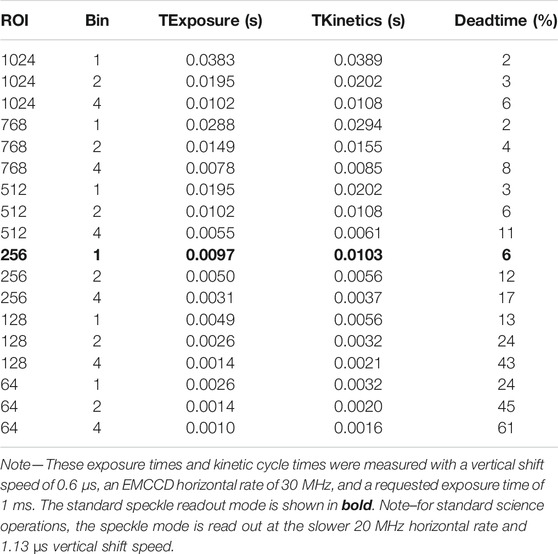
Another aspect of the camera/software operation we investigated was the minimum exposure time possible in various combinations of region of interest (ROI) readout and pixel binning. For a given ROI and binning, there are two main variables we can control that affect the readout rate, sensitivity, noise, pixel well depth, transfer efficiency, and clock induced charge. These are the Vertical Shift Speed (VSS) and the Horizontal Shift (HS) rate. The VSS is the speed at which the rows are shifted down the chip and the HS is the clock rate at which the pixels are read from the gain/shift register. There are tradeoffs in this parameter space of course, for instance, overclocking the VSS increases the frames per second (fps) and reduces the clock-induced-charge (CIC) but it reduces the pixel well depth and transfer efficiency. We have broken down the settings to optimize for speckle bright sources, speckle faint sources, traditional CCD imaging, and high-speed imaging. The minimum exposure time is the actual time the sensor is exposed to light, while the kinetic cycle time (KCT) is the minimum time between the start of subsequent frame. The KCT is reported back from the camera firmware based on an internal algorithm. The results of tests to achieve the highest possible fps are summarized in Table 5. TExposure is the actual minimum exposure time possible for a given set of camera parameters. TKinetics is the KCT returned from the Andor cameras for the given camera settings. The deadtime, D, is given as
4.3 Conclusion
‘Alopeke and Zorro are two speckle cameras at the Gemini-North and Gemini-South telescopes, respectively, and are available to the community via the peer review proposal process for Gemini based on the host institution. These instruments are capable of diffraction-limited speckle imaging, have wide-field conventional imaging capability, and are capable of high precision time-domain observations. Our team provides instrument support for speckle observation planning, observing, and data reduction; producing fully reconstructed images, detection limit curves, and binary fit information. Even though ‘Alopeke and Zorro are visitor instruments, there is no collaboration requirement with the instrument team; the team is available for consultations.
We acknowledge the great support and collaborations with the Gemini observatory staff.
Observations in the paper made use of the High-Resolution Imaging instruments ‘Alopeke and Zorro. ‘Alopeke and Zorro were funded by NASA headquarters and the NASA Exoplanet Exploration Program (ExEP) and built at the NASA Ames Research Center by Steve B. Howell, Nic Scott, Elliott P. Horch, and Emmett Quigley. ‘Alopeke and Zorro were mounted on the Gemini North and South telescopes of the international Gemini Observatory, a program of NSF’s NOIRLab, which is managed by the Association of Universities for Research in Astronomy (AURA) under a cooperative agreement with the National Science Foundation on behalf of the Gemini Observatory partnership: the National Science Foundation (United States), National Research Council (Canada), Agencia Nacional de Investigación y Desarrollo (Chile), Ministerio de Ciencia, Tecnología e Innovación (Argentina), Ministério da Ciência, Tecnologia, Inovações e Comunicações (Brazil), and Korea Astronomy and Space Science Institute (Republic of Korea).
The contrast curves shown in this paper included data from the following observing programs: GS-2019A-LP-101, GS-2019A-Q-230, GS-2019A-Q-222, GS-2019A-Q-110, GS-2019A-Q-311, GS-2019A-Q-302, GS-2019B-LP-101, GS-2019B-Q-212, GS-2019B-Q-213, GS-2019B-Q-111, GS-2019B-Q-216, GS-2019B-Q-116, GS-2019B-Q-223, GS-2019B-Q-120, GS-2019B-FT-103, GS-2020A-FT-203, GS-2020A-LP-101,GS-2020A-Q-125,GS-2020A-Q-232,GS-2020A-Q-302,GS-2020A-Q-321, GN-2019A-Q-128, GN-2019A-Q-216, GN-2019A-Q-209, GN-2019B-Q-309, GN-2019B-Q-111, GN-2019B-Q-224, GN-2019B-Q-227, GN-2020A-Q-304, GN-2020A-Q-114, GN-2020A-Q-219, GN-2020A-Q-132, GN-2020A-Q-321, GN-2020A-LP-101, GN-2020B-Q-234,GN-2020B-Q-227, GN-2020B-LP-105. The image of Nova V906 came from GS-2019A-SV-401.
This research has made use of the SIMBAD database, operated at CDS, Strasbourg, France, the Washington Double Star Catalog maintained at the U.S. Naval Observatory, and NASA’s Astrophysics Data System.
Facilities: Gemini-N, Gemini-S.
Software: SOLIDWORKS.
Data Availability Statement
The raw data supporting the conclusion of this article will be made available by the authors, without undue reservation.
Author Contributions
NS contributed all plots and most text, and is the instrument scientist. SH, CG, AS, and RS contributed to text. RM, EF, and EH provided valuable feedback and review of the manuscript drafts. EF and CG reduced much of the data presented. EH is the founder of the instrument design and provided extensive feedback and edits. DC provided suggestions, DM wrote the instrument software used for the data provided, and EQ advised on the fabrication of the instrument.
Conflict of Interest
The authors declare that the research was conducted in the absence of any commercial or financial relationships that could be construed as a potential conflict of interest.
Publisher’s Note
All claims expressed in this article are solely those of the authors and do not necessarily represent those of their affiliated organizations, or those of the publisher, the editors and the reviewers. Any product that may be evaluated in this article, or claim that may be made by its manufacturer, is not guaranteed or endorsed by the publisher.
Supplementary Material
The Supplementary Material for this article can be found online at: https://www.frontiersin.org/articles/10.3389/fspas.2021.716560/full#supplementary-material.
Footnotes
1https://www.gemini.edu/instrumentation/alopeke-zorro
2https://www.gemini.edu/instrumentation
4https://exofop.ipac.caltech.edu/tess/
5http://www.astro.gsu.edu/wds/orb6.html
6https://www-star.fnal.gov/Southern_ugriz/New/index.html
7https://www.gemini.edu/instrumentation/gmos/calibrations
8http://www.gemini.edu/sciops/instruments/integration-time-calculators/gmoss-itc
References
Ciardi, D. R., Beichman, C. A., Horch, E. P., and Howell, S. B. (2015). Understanding the Effects of Stellar Multiplicity on the Derived Planet Radii From Transit Surveys: Implications Forkepler, K2, and Tess. Astrophysical J. 805, 16. doi:10.1088/0004-637x/805/1/16
Colton, N. M., Horch, E. P., Everett, M. E., Howell, S. B., Davidson, J. W., Baptista, B. J., et al. (2021). Identifying Bound Stellar Companions to Kepler Exoplanet Host Stars Using Speckle Imaging. Astronomical J. 161, 21. doi:10.3847/1538-3881/abc9af
Docobo, J. A., and Andrade, M. (2013). Dynamical and Physical Properties of 22 Binaries Discovered by W. S. Finsen. MNRAS. 428, 321–339. doi:10.1093/mnras/sts045
Docobo, J. A., and Ling, J. F. (2009). Binary Stars With Components of Solar Type: 25 Orbits and System Masses. Astronomical J. 138, 1159–1170. doi:10.1088/0004-6256/138/4/1159
Furlan, E., and Howell, S. B. (2017). The Densities of Planets in Multiple Stellar Systems. Astronomical J. 154, 66. doi:10.3847/1538-3881/aa7b70
Hayward, T. L., Brandl, B., Pirger, B., Blacken, C., Gull, G. E., Schoenwald, J., et al. (2001). PHARO: A Near‐Infrared Camera for the Palomar Adaptive Optics System. Publ. Astron. Soc. Pac. 113, 105–118. doi:10.1086/317969
Hodapp, K. W., Jensen, J. B., Irwin, E. M., Yamada, H., Chung, R., Fletcher, K., et al. (2003). The Gemini Near‐Infrared Imager (NIRI). Publ. Astron. Soc. Pac. 115, 1388–1406. doi:10.1086/379669
Horch, E. P., Bahi, L. A. P., and Gaulin, J. R. (2012a). Speckle Observations of Binary Stars With the Wiyn* Telescope. Vii. Measures During 2008–2009. Astronomical J. 143, 10. doi:10.1088/0004-6256/143/1/10
Horch, E. P., Howell, S. B., Everett, M. E., and Ciardi, D. R. (2012b). Observations of Binary Stars With the Differential Speckle Survey Instrument. Iv. Observations Ofkepler,corot, Andhipparcosstars From the Gemini North Telescope. Astronomical J. 144, 165. doi:10.1088/0004-6256/144/6/165
Horch, E. P., Casetti-Dinescu, D. I., Camarata, M. A., Bidarian, A., Altena, W. F. v., Sherry, W. H., et al. (2017). Observations of Binary Stars With the Differential Speckle Survey Instrument. VII. Measures From 2010 September to 2012 February at the WIYN Telescope. Astronomical J. 153, 212. doi:10.3847/1538-3881/aa6749
Horch, E. P., Franz, O. G., and van Altena, W. F. (2006). Characterizing Binary Stars Below the Diffraction Limit With CCD-Based Speckle Imaging. Astronomical J. 132, 2478–2488. doi:10.1086/508813
Horch, E. P., Gomez, S. C., and Sherry, W. H. (2011a). Observations of Binary Stars With the Differential Speckle Survey Instrument. Ii. Hipparcos Stars Observed in 2010 January and June. Astronomical J. 141, 45. doi:10.1088/0004-6256/141/2/45
Horch, E. P., van Altena, W. F., Howell, S. B., Sherry, W. H., and Ciardi, D. R. (2011b). Observations of Binary Stars With the Differential Speckle Survey Instrument. Iii. Measures Below the Diffraction Limit of the Wiyn Telescope. Astronomical J. 141, 180. doi:10.1088/0004-6256/141/6/180
Horch, E. P., Howell, S. B., Everett, M. E., and Ciardi, D. R. (2014). Most Sub-Arcsecond Companions of Kepler Exoplanet Candidate Host Stars Are Gravitationally Bound. Astronomical J. 795, 60. doi:10.1088/0004-637X/795/1/60
Horch, E. P., Veillette, D. R., Baena Gallé, R., Shah, S. C., O'Rielly, G. V., and van Altena, W. F. (2009). Observations of Binary Stars With the Differential Speckle Survey Instrument. I. Instrument Description and First Results. Astronomical J. 137, 5057–5067. doi:10.1088/0004-6256/137/6/5057
Howell, S. B., Matson, R. A., and Ciardi, D. R. (2021a). Speckle Observations of TESS Exoplanet Host Stars: Understanding the Binary Exoplanet Host Star Orbital Period Distribution. Astronomical J. 161, 164. doi:10.3847/1538-3881/abdec6
Howell, S. B., Scott, N. J., and Matson, R. A. (2021b). The NASA High-Resolution Speckle Interferometric Imaging Program: Validation and Characterization of Exoplanets and Their Stellar Hosts. Front. Astron. Space Sci. 8, 635864. doi:10.3389/fspas.2021.635864
Kosakowski, A., Kilic, M., and Brown, W. (2021). A Catalogue of Potential Post Common Envelope Binaries. MNRAS. 500, 5098. doi:10.1093/mnras/staa3571
Labeyrie, A. (1970). Attainment of Diffraction Limited Resolution in Large Telescopes by Fourier Analysing Speckle Patterns in Star Images. Astron. Astrophysics. 6, 85.
Lester, K. V., Matson, R. A., and Howell, S. B. (2021). Speckle Observations of TESS Exoplanet Host Stars. II. Stellar Companions at 1–1000 au and Implications for Small Planet Detection. Astronomical J. 162, 2.
Mason, B. D., Douglass, G. G., and Hartkopf, W. I. (1999). Binary Star Orbits From Speckle Interferometry. I. Improved Orbital Elements of 22 Visual Systems. Astronomical J. 117, 1023–1036. doi:10.1086/300748
Matson, R. A., Howell, S. B., Horch, E. P., and Everett, M. E. (2018). Stellar Companions of Exoplanet Host Stars in K2. Astronomical J. 156, 31. doi:10.3847/1538-3881/aac778
Muterspaugh, M. W., Hartkopf, W. I., Lane, B. F., O’Connell, J., Williamson, M., Kulkarni, S. R., et al. (2010a). The Phases Differential Astrometry Data Archive. Ii. Updated Binary Star Orbits and a Long Period Eclipsing Binary. Astronomical J. 140, 1623–1630. doi:10.1088/0004-6256/140/6/1623
Muterspaugh, M. W., Lane, B. F., Kulkarni, S. R., Konacki, M., Burke, B. F., Colavita, M. M., et al. (2010b). The Phases Differential Astrometry Data Archive. V. Candidate Substellar Companions to Binary Systems. Astronomical J. 140, 1657–1671. doi:10.1088/0004-6256/140/6/1657
Muterspaugh, M. W., Lane, B. F., Fekel, F. C., Konacki, M., Burke, B. F., Kulkarni, S. R., et al. (2008). Masses, Luminosities, and Orbital Coplanarities of the Μ Orionis Quadruple-Star System from Phases Differential Astrometry. Astronomical J. 135, 766–776. doi:10.1088/0004-6256/135/3/766
Muterspaugh, M. W., Wijngaarden, M. J. P., Henrichs, H. F., Lane, B. F., Hartkopf, W. I., Henry, G. W., et al. (2015). Predicting TheαComae Berenices Time of Eclipse: How 3 Ambiguous Measurements Out of 609 Caused A 26 Year Binary's Eclipse to Be Missed. Astronomical J. 150, 140. doi:10.1088/0004-6256/150/5/140
Raghavan, D., McAlister, H. A., Henry, T. J., Latham, D. W., Marcy, G. W., Mason, B. D., et al. (2010). A Survey of Stellar Families: Multiplicity of Solar-Type Stars. Astrophysical J. Suppl. Ser. 190, 1–42. doi:10.1088/0067-0049/190/1/1
Ramey, E., Lu, J. R., and Yin, R. (2020). Analyzing Long-Term Performance of the Keck-II Adaptive Optics System. Proc. SPIE. 11448, 1144859. doi:10.1117/12.2563252
Scott, N. J., Howell, S. B., Horch, E. P., and Everett, M. E. (2018). The NN-Explore Exoplanet Stellar Speckle Imager: Instrument Description and Preliminary Results. Publications Astronomical Soc. Pac. 130, 054502. doi:10.1088/1538-3873/aab484
Scott, N. J. (2018). “Optical and Infrared Interferometry and Imaging VI,” in Society of Photo-Optical Instrumentation Engineers (SPIE) Conference Series, Vol. 10701, Optical and Infrared Interferometry and Imaging VI. Editors M. J. Creech-Eakman, P. G. Tuthill, and A. Mérand, 1070112.
Szkody, P., Everett, M. E., Howell, S. B., Landolt, A. U., Bond, H. E., Silva, D. R., et al. (2014). Follow up Observations of Sdss and Crts Candidate Cataclysmic Variables. Astronomical J. 148, 63. doi:10.1088/0004-6256/148/4/63
Tokovinin, A., Mason, B. D., Mendez, R. A., Horch, E. P., and Briceño, C. (2019). Speckle Interferometry at SOAR in 2018. Astronomical J. 158, 48. doi:10.3847/1538-3881/ab24e4
Winters, J. G., Henry, T. J., Jao, W.-C., Subasavage, J. P., Chatelain, J. P., Slatten, K., et al. (2019). The Solar Neighborhood. XLV. The Stellar Multiplicity Rate of M Dwarfs Within 25 Pc. Astronomical J. 157, 216. doi:10.3847/1538-3881/ab05dc
Keywords: astronomical instrumentation, speckle interfcromctry, multiple stars, ground-based astronomy, optical astronomy
Citation: Scott NJ, Howell SB, Gnilka CL, Stephens AW, Salinas R, Matson RA, Furlan E, Horch EP, Everett ME, Ciardi DR, Mills D and Quigley EA (2021) Twin High-Resolution, High-Speed Imagers for the Gemini Telescopes: Instrument Description and Science Verification Results. Front. Astron. Space Sci. 8:716560. doi: 10.3389/fspas.2021.716560
Received: 28 May 2021; Accepted: 09 August 2021;
Published: 03 September 2021.
Edited by:
Wolfgang Max Adolf Bernhard Osten, University of Stuttgart, GermanyReviewed by:
Lucia Kleint, Université de Genève, SwitzerlandBringfried Stecklum, Thüringer Landessternwarte Tautenburg, Germany
Yvonne Elsworth, University of Birmingham, United Kingdom
Copyright © 2021 Scott, Howell, Gnilka, Stephens, Salinas, Matson, Furlan, Horch, Everett, Ciardi, Mills and Quigley. This is an open-access article distributed under the terms of the Creative Commons Attribution License (CC BY). The use, distribution or reproduction in other forums is permitted, provided the original author(s) and the copyright owner(s) are credited and that the original publication in this journal is cited, in accordance with accepted academic practice. No use, distribution or reproduction is permitted which does not comply with these terms.
*Correspondence: Nicholas J. Scott, bmljLnNjb3R0LjlAZ21haWwuY29t
 Nicholas J. Scott
 Steve B. Howell
 Crystal L. Gnilka1
 Ricardo Salinas
 Rachel A. Matson
 Elise Furlan
 Elliott P. Horch
 Emmett A. Quigley