 Owen R. Lehmer
 David C. Catling2
 Tori M. Hoehler
- 1Exobiology Branch, Ames Research Center, National Aeronautics and Space Administration (NASA), Moffet Field, CA, United States
- 2University of Washington, Seattle, WA, United States
- 3Goddard Institute for Space Studies (NASA), New York, NY, United States
In the search for life on other planets, the presence of photosynthetic surface vegetation may be detectable from the colors of light it reflects. On the modern Earth, this spectral reflectance is characterized by a steep increase in reflectance between the red and near‐infrared wavelengths, a signature known as the “red edge”. This edge-like signature occurs at wavelengths of peak photon absorbance, which are the result of adaptations of the phototroph to their spectral environment. On planets orbiting different stellar types, red edge analogs may occur at other colors than red. Thus, knowing the wavelengths at which photosynthetic organisms preferentially absorb and reflect photons is necessary to detect red edge analogs on other planets. Using a numerical model that predicts the absorbance spectrum of extant photosynthetic pigments on Earth from Marosvölgyi and van Gorkom (2010), we calculate the absorbance spectrum for pigments on an Earth-like planet around F through late M type stars that are adapted for maximal energy production. In this model, cellular energy production is maximized when pigments are tuned to absorb at the wavelength that maximizes energy input from incident photons while minimizing energy losses due to thermal emission and building cellular photosynthetic apparatus. We find that peak photon absorption for photosynthetic organisms around F type stars tends to be in the blue while for G, K, and early M type stars, red or just beyond is preferred. Around the coolest M type stars, these organisms may preferentially absorb in the near-infrared, possibly past one micron. These predictions are consistent with previous, qualitative estimates of pigment absorptance. Our predicted absorbance spectra for photosynthetic surface organisms depend on both the stellar type and planetary atmospheric composition, especially atmospheric water vapor concentrations, which alter the availability of surface photons and thus the predicted pigment absorption. By constraining the absorbance spectra of alien, photosynthetic organisms, future observations may be better equipped to detect the weak spectral signal of red edge analogs.
1 Introduction
Oxygenic photosynthetic organisms dominate primary productivity on the modern Earth (e.g., Field et al., 1998). Abundant, green surface vegetation is a prominent example of such productivity. While surface vegetation slightly reflects green photons in the visible spectrum, the strongest spectral reflectance occurs just beyond the visible in near-infrared (NIR) wavelengths. This sharp contrast in absorbance in the red and reflectance in the NIR is termed the “vegetation red edge” or simply the “red edge”. This spectral signature is sufficiently strong on the modern Earth and distinct from mineral spectra that satellite observations of it are used to map the presence and activity of vegetation (Tucker and Maxwell, 1976). It thus serves as a model for similar reflectance biosignatures that future telescope observations could detect on an Earth-like exoplanet (e.g., Sagan et al., 1993; Seager et al., 2005; Kiang et al., 2007a; O’Malley-James and Kaltenegger, 2018; Wang and He, 2021).
The absorption of red photons by green land plants is due to chlorophyll a (Chl a), which is the primary photopigment in oxygen-producing photosynthetic organisms, such as algae and cyanobacteria on the modern Earth. In these organisms, Chl a and other light harvesting pigments absorb photons across the visible, with the long wavelength cut-off where Chl a absorbs red photons, peaking at 680 and 700 nm. In plant leaves, strong scattering occurs in the NIR due to the change in the index of refraction between leaf mesophyll cell walls and air spaces in the leaf and lack of absorbance by pigments (Gausman, 1974). This step-like change in spectral absorbance results in the red edge.
In all phototrophs, accessory pigments often accompany the primary photopigment, providing additional photon harvesting. Photon absorption for Chl a peaks in the blue and red, and accessory pigments offer additional spectral coverage. The excitation energy of shorter wavelength, higher-energy photons is stepped down through energetically favorable resonant transfer to the red absorbance of Chl a, which trap that energy in a reaction center (e.g., Blankenship, 2008). The excess photon energy is released as heat during this transfer process so that each photon absorbed by the photosynthetic cell provides an input energy to Chl a equivalent to a red photon. The reaction center Chl a molecules enable charge separation; that is, the excited pigment provides the conversion of photon energy to chemical potential, giving up an excited electron for electron transfers in biochemical reactions. Around other stars, Chl a analogs could arise in the form of different pigments that may be tuned to absorb photons at different wavelengths, changing the wavelength of a vegetative red edge analog. See Schwieterman et al. (2018), Blankenship (2008) and Blankenship (2014) for thorough discussions of Chl a and the molecular mechanisms of photosynthesis.
The structure of Chl a has been attributed to evolution from simpler porphyrins, or the chemical properties required of a pigment to participate in oxygenic photosynthesis (e.g., Mauzerall et al., 1976; Björn et al., 2009; Björn and Ghiradella, 2015). In addition, optimization arguments based on the available radiation spectrum have been proposed as a driver for the structure and absorbance spectrum of Chl a (Björn, 1976; Kiang et al., 2007b; Stomp et al., 2007; Milo, 2009; Marosvölgyi and van Gorkom, 2010; Ritchie et al., 2017; Arp et al., 2020). Kiang et al. (2007b), Stomp et al. (2007) and Ritchie et al. (2017) observed that the absorption wavelength for reaction center pigments in extant organisms correlates with spectral peaks in the incident photon flux per uniform wavelength interval. However, Björn (1976) and Milo (2009) noted that such correlations may be somewhat artificial, as the wavelength of peak photon flux depends on whether one considers photons per uniform frequency interval, or photons per uniform wavelength interval. Therefore, optimality arguments based on maximal rates of energy storage have been explored (Björn, 1976; Milo, 2009; Marosvölgyi and van Gorkom, 2010).
Björn (1976) considered how incident flux constrains the maximum achievable chemical potential in optically thin systems, such as in unicellular photosynthetic organisms. By approximating the Sun as a blackbody and accounting for thermal emission of pigments, Björn (1976) showed that, in full sunlight, chemical energy production is maximized in photosynthetic surface organisms when absorbing near 700 nm. A similar optimal wavelength was found by Milo (2009) by considering the energetic overhead encountered during photosynthesis to move electrons from H2O to NADPH, termed an “overpotential”. Using the empirical overpotential of Photosystems I and II along with the spectrally resolved flux available at the Earth’s surface, Milo (2009) found pigment absorption was optimized between 680 and 720 nm. Marosvölgyi and van Gorkom (2010) extended the work of Björn (1976) to consider optically thick systems, accounting for the possibility of multiple dipoles, and the spectrally resolved incident Solar flux considered by Milo (2009). In addition, Marosvölgyi and van Gorkom (2010) considered the energetic cost for a cell to create pigments and store photosynthetic energy, an important consideration raised by Milo (2009). With these enhancements to the model of Björn (1976), Marosvölgyi and van Gorkom (2010) showed that Chl a is optimized when peak absorption occurs at
While Marosvölgyi and van Gorkom (2010) optimized power gain based on incident flux to predict pigment absorbance spectra, Arp et al. (2020) assumed a fixed power demand by photosynthetic organisms to determine the optimal wavelength for pigment absorption. Arp et al. (2020) examined the role of antenna light harvesting pigments in picking out separate spectral bands of an organism’s light environment to minimize the mismatch between the energy supply and demand. A two-absorber system at separate bands helps to ensure a steadier power supply, which can be generalized to more absorbers. This scheme appears to predict wavelengths of peak absorbance for both the trap and Soret band wavelengths for Chl a-bearing organisms, but the role of light quality for underwater and anoxygenic phototrophs is less clear. Because this scheme does not directly model the actual light harvesting processes and requires assumptions of the shape of the pigment absorbance peaks and the number of absorbers, we adopt the model of Marosvölgyi and van Gorkom (2010) to be agnostic to these specifications and to more directly simulate light energy use processes in this work. The model of Marosvölgyi and van Gorkom (2010) requires only the available photon flux to predict plausible pigment absorbance spectra, thus it could constrain the absorbance spectra of surface pigments around other stars.
Prediction of pigment absorption around other stars has been considered previously, but via a simplified model with stars approximated as blackbodies (Lehmer et al., 2018), or qualitatively based on the incident spectral flux (Kiang et al., 2007a; Ritchie et al., 2017; Takizawa et al., 2017). Based on the observed correlations between photon flux and pigment peak absorbance wavelengths, Tinetti et al. (2006) proposed a red edge analog for an M dwarf star could be near 1.1 μm. Takizawa et al. (2017) also explored photosynthesis around M dwarf stars, but considered how multi-band photosystems might be restricted in different spectral light environments and did not attempt to predict light harvesting pigment spectra precisely.
Here, we apply the power gain optimization model of Marosvölgyi and van Gorkom (2010) to the Earth around other stars to predict the absorbance spectra of alien photoautotrophs. Using simulated surface spectra through the modern Earth’s atmosphere for F2V through M5V stars from Kiang et al. (2007b), we predict the absorption peak and profile of pigments for various stellar types. Our predictions could inform future observations looking for the photosynthetic red edge as a possible biosignature (Sagan et al., 1993; Seager et al., 2005; Kiang et al., 2007a; O’Malley-James and Kaltenegger, 2018; Wang and He, 2021) and provide a quantitative update to the qualitative predictions for red edge analogs around other stars from Kiang et al. (2007b).
2 Methods
To predict optimal pigment absorption based on incident photon flux, we use the model initially developed by Björn (1976) then refined and justified in detail by Marosvölgyi and van Gorkom (2010). Our implementation recreates the numerical model described in Marosvölgyi and van Gorkom (2010), which we summarize below.
The model solves for an absorbance spectrum that optimizes power gain in an optically thick suspension of photosynthetic cells. It does so by considering the incident flux available for absorption, thermal emission, and the costs to build the photosynthetic apparatus. With incident flux known, the input energy intensity over all frequencies in W m−2,
where k is the Boltzmann constant (
The excitation rate due to the incident stellar flux,
where
Similar to
where
The definition of
In Eqs 2, and 3, we use the optical depth,
From the power input to the cell,
The saturation term in Eq 4,
The proteins required to build these photosynthetic pigments and the subsequent chemical storage of the captured energy must have some cost to the cell. Following Marosvölgyi and van Gorkom (2010), we define
With the cellular costs
We want to find the number of dipoles in each frequency bin, that is the
In Eq 6, h is the Planck constant (
The left-hand side of Eq 6 is the transmitted photon energy and is balanced by two terms on the right-hand side (RHS). The first term on the RHS of Eq 6 is the scaled blackbody flux of the pigment. This term sets the frequency below which pigments would emit more energy than they absorb and results in an abrupt transition to a transmittance of one below the cutoff frequency. This frequency cutoff is analogous to the bandgap in photovoltaic semiconductors (Marosvölgyi and van Gorkom, 2010) and depends on the incident stellar photon flux.
The second term on the RHS of Eq 6 imposes an input energy threshold on the frequencies at which a pigment can absorb (Marosvölgyi and van Gorkom, 2010). This term is spectrally constant but depends on C. As
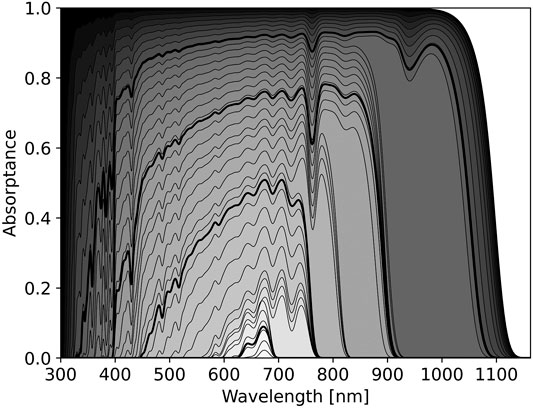
FIGURE 1. The optimal pigment absorptance spectrum for different cost parameters around the Sun, a G2V star. The horizontal axis shows wavelength in nm, the vertical axis shows pigment absorptance. Each black curve shows the predicted pigment absorptance for the given cost parameter, C from Eq 6. The value of C is indicated by the shading where darker shading indicates lower cost. Black shading corresponds to no cost, i.e.,
Eq 6 is a fixed-point equation that can be solved for
The effect of changing C on the optimal pigment absorbance spectrum from Eq 6 is shown in Figure 1. As C increases, Eq 6 predicts pigment absorption should focus on spectral regions where the balance between photon absorption and thermal emission maximizes energy input to the cell. Thus, pigment absorbance spectra should jump across atmospheric absorption bands. This is readily seen in Figure 1, where jumps in predicted pigment absorptance correspond to atmospheric absorption features, such as those of O2 at 688 and 761 nm and from H2O at 720, 820, and 940 nm (Hill and Jones, 2000; Kiang et al., 2007a).
As wavelength increases, blackbody emission of the organism becomes increasingly important. Even in the scenario
The relative cost parameter, C, can be freely tuned in the model. However, a relative cost of
As inputs to the model, we use the standard solar irradiance spectrum for the modern Earth at sea level from ASTM (2020). We also consider simulated surface spectra from Kiang et al. (2007b) around F2V, K2V, M1V, and M5V type stars. For simulated spectra around other stars, the atmosphere was assumed to be 1 bar with O2, CO2, and N2 mixing ratios equivalent to modern Earth’s. For fixed O2, the atmospheric compositions were photochemically evolved to equilibrium based on the incident stellar irradiance spectrum (see Kiang et al. (2007b) for details). The spectra considered in this work are shown in Figure 2.
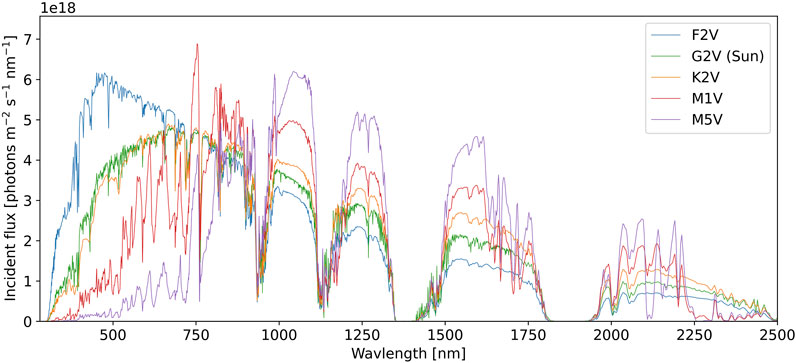
FIGURE 2. The surface spectral photon flux for planets with modern Earth-like CO2, N2, O2, and surface-to-atmosphere reactive gas fluxes that are equilibrated with the spectral radiation of different parent stellar types (see text for details). The horizontal axis shows photon wavelength in nm, the vertical axis shows the incident photon flux per unit area, per second, per nm. Each colored contour shows the surface photon flux for a different stellar type, as labelled. For each stellar type, the total stellar flux corresponds to a mean planetary surface temperature of 288 K. The photon flux for the Sun is from ASTM (2020). All other spectra are from Kiang et al. (2007b).
3 Results
From the spectra in Figure 2, Figure 3 shows the predicted absorbance spectrum for optimal pigments around each stellar type. The gray shaded region shows the absorbance spectrum of spinach chloroplasts from Marosvölgyi and van Gorkom (2010), which matches the predicted absorbance spectrum in the
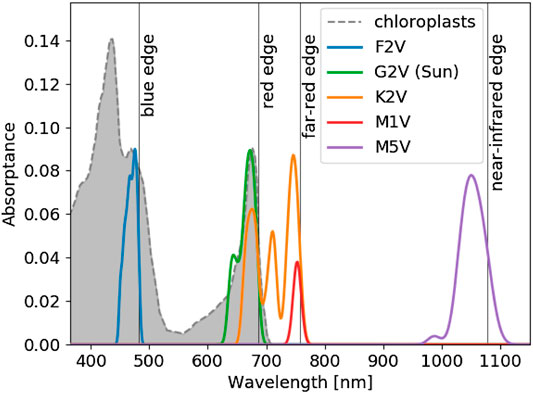
FIGURE 3. The optimal pigment absorbance spectrum for each stellar type from our pigment optimization model (see Methods). The horizontal axis shows wavelength in nm. The vertical axis shows the predicted absorptance of pigments from the model. Each colored contour represents a different stellar type, as labelled. The shaded gray region and dashed gray line show the absorptance of spinach chloroplasts from Marosvölgyi and van Gorkom (2010), arbitrarily normalized to match the vertical extent of the optimal pigment profile for Earth. The absorbance spectra were smoothed by convolution with a 10 nm wide Gaussian function, following Marosvölgyi and van Gorkom (2010). The model predicts the wavelength of peak absorption and the corresponding absorption shape around that peak. The total absorptance of an organism is not reflected by the vertical axis. An organism could produce additional pigments to boost total absorptance, but the optimized absorption peak and shape would remain the same. The position of and shape of Chl a absorption at
The optimized absorptance peaks shown in Figure 3 are listed in Table 1 and agree with the qualitative predictions from Kiang et al. (2007b). In addition to predicting the absorptance peaks, we also predict the shape of the absorbance spectra around each peak and, depending on stellar type, multiple absorptance peaks. The shapes of the absorptance peaks depend on the incident stellar flux, atmospheric absorption, and the relative cost parameter. The broad absorptance peak predicted for an M5V star arises due to abundant available photons near 1,050 nm with limited atmospheric attenuation around that peak. Stronger atmospheric absorption features near the absorptance peaks for the other stellar types restrict the width of the predicted absorptance peaks.
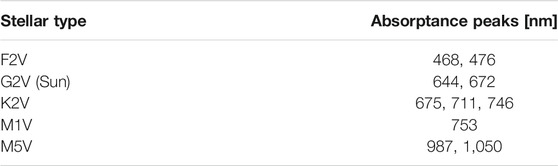
TABLE 1. The model predicted absorptance peaks for each stellar type shown in Figure 3.
The optimal absorbance spectra depend on the relative cost parameter, C, and the total available stellar photon flux for absorption, as demonstrated in Figure 4. As gray contours, Figure 4 shows the model predicted optimal absorbance spectra for six different values of
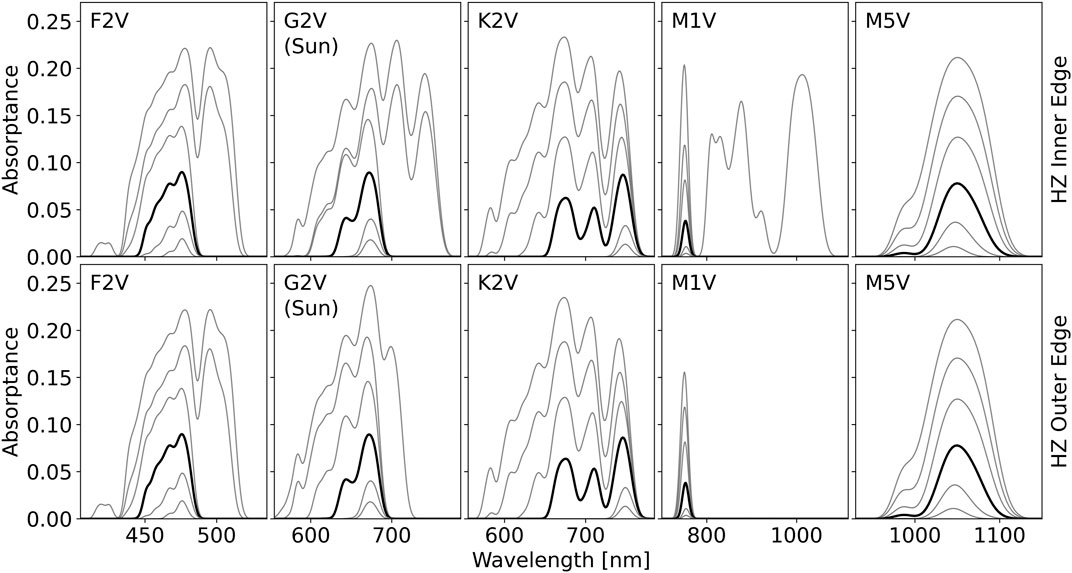
FIGURE 4. The optimal pigment absorptance predicted by the model for each stellar type for irradiance intensities approximately spanning the inner and outer edges of the habitable zone (HZ) for various relative cost parameters, C. From top to bottom, the contours in each figure correspond to a C value of: 0.90, 0.92, 0.94, 0.962, 0.98, 0.99. The 0.962 contour is shown in bold black while all other contours are in gray. The top row of plots shows the optimal pigment absorptance profile at the inner edge of the HZ, the bottom row at the outer edge. The flux values used for the inner and outer edge of the HZ are given in Table 2. For
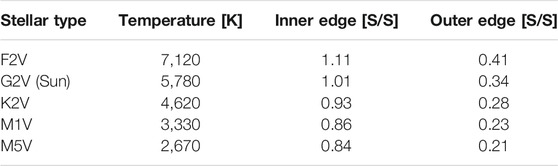
TABLE 2. The normalized incident fluxes, S, at the inner and outer edges of the habitable zone (HZ) for each stellar type. The HZ flux limits are normalized to the incident flux of the modern Earth (
In the outer HZ, the decreased total stellar flux can push the optimal absorbance peak wavelength toward shorter wavelengths when C is low. This is readily seen for the
The predicted optimal absorbance spectra for each stellar type shows the influence of atmospheric absorption on pigment optimization. Comparing the input spectra in Figure 2 to the predicted absorbance wavelengths in Figure 3, we see that atmospheric absorption features, particularly from H2O at 720, 820, 940, and 1,130 nm (Hill and Jones, 2000; Kiang et al., 2007a), exert a strong pressure on pigments to absorb in atmospheric windows. In addition, short-wavelength, high-energy photons in the visible (and just beyond) provide maximum growth energy for organisms around F, G, K, and even early M stars. Only around the coolest M5V star are organisms optimized when absorbing well into the NIR. These predictions may better inform the search for red edge analogs around other stars, as discussed below.
See Supplementary Appendix A.2 for plots comparing the different stellar spectrum and corresponding predictions for optimal pigment absorptance.
4 Discussion
If we are to detect a sharp change in reflectance spectra from alien, photosynthetic organisms, i.e., a red edge analog, knowing the exact wavelengths to observe is critical as the spectral signal may be small (Sagan et al., 1993; Seager et al., 2005; Kiang et al., 2007b; O’Malley-James and Kaltenegger, 2018; Wang and He, 2021). In this work, the goal of predicting pigment absorbance spectra is to inform the wavelength ranges future observations should preferentially consider for detection of a red edge analog.
On the modern Earth, the red edge in the NIR corresponds to the steep drop in absorption beyond the optimal peak of Chl a (gray shaded region in Figure 3). If photosynthetic organisms around other stars exhibit similar edge-like spectral reflectance features, we might expect red edge analogs to occur on the long-wavelength side of the optimal pigment absorption, similar to the prediction of Tinetti et al. (2006).
The wavelength of optimal pigment absorption will depend on both the atmospheric composition and the photon flux of the host star. Both stars and planetary atmospheres evolve with time (e.g., Bahcall et al., 2001; Lyons et al., 2014), so the optimal wavelength for pigment absorption may also evolve with time. For the Sun, changes in luminosity with time have not led to significant spectral change across the photosynthetically active radiation wavelengths (Claire et al., 2012). In addition, from Figure 4, we see that changes in total stellar flux do not alter the optimal pigment absorption wavelengths except at low values of C; lower values of C could also result as adaptations to low light, as seen in the far-red and low-light adapted cyanobacterium Acaryochloris marina (Mielke et al., 2011). Thus, for the Earth through time, changes in atmospheric composition could regulate optimal pigment absorption wavelengths.
Atmospheric compositions on habitable exoplanets could be very different from modern Earth’s (e.g., Segura et al., 2003, 2005; Schwieterman et al., 2018), which would filter radiation and alter the surface spectral irradiance (Kiang et al., 2007a) to which optimal wavelengths for pigments absorption would be adapted. A relationship between available photon fluxes and pigment absorption profiles is well established on the modern Earth (see Introduction) and is even found in photoautotrophs where accessory pigments rather than the trap pigment dominate the spectral light absorbance. For example, the anoxygenic photosynthetic bacterium Blastochloris viridis has a bacteriochlorophyll b trap wavelength at 960 nm where the underwater photon flux in this organism’s environment is low, while core antenna pigments provide higher absorbance at
As mentioned earlier, land plants have abundant accessory pigments throughout the visible spectrum. Indeed, green plants absorb almost all visible photons, including
In addition to absorption of short-wavelength photons from accessory pigments, large pigments, such as Chl a, should have auxiliary, short-wavelength absorption features (e.g., Papageorgiou, 2004). Pigments like Chl a must be sufficiently large that their π-electrons can be excited by long-wavelength photons at the edge of the visible spectrum (Mauzerall et al., 1976). This large structure results in additional absorption features from higher energy electron orbitals (e.g., Björn et al., 2009). So the absorption of blue photons by Chl a, which provides additional photon harvesting for a Chl a-bearing organism similar to an accessory pigment, may be a side-effect of the structure of Chl a being tuned to optimally absorb in the red rather than a feature that was selected for (Marosvölgyi and van Gorkom, 2010), but see Arp et al. (2020) for an alternative explanation.
If alien photoautotrophs have abundant accessory pigments and auxiliary, short-wavelength absorption features in their pigments, as occur on Earth, Earth-like planets around the stars considered here would have sufficient spectral energy to sustain the Earth’s extant biosphere. If we assume photons longer than 300 nm may be used by photosynthetic organisms (McCree, 1971), more than double the current photon use of the terrestrial biosphere is available for each stellar type shown in Figure 2. This assumes absorption only occurs between 300 nm and the optimal wavelength shown in Figure 3. Even if we account for the reduced quantum yield of the M5V pigment, which may be
The full reflectance spectra of an organism is derived not only from its pigments. As noted by Kiang et al. (2007b), cellular structure, and in the case of land plants, canopy structure and leaf morphology could play important roles in determining the reflectance spectra and thus the red edge. These aspects are not considered in our model so the discussion of the alien red edge analog location should be considered approximate. However, given the lack of understanding on how these other properties may alter the red edge around different stars (Kiang et al., 2007a), we propose the optimal absorption peak is a reasonable initial location to search for a vegetative red edge analog, as is the case on the modern Earth.
5 Conclusion
Future exoplanet observations may search for a vegetative red edge equivalent, a spectral signature due to a sharp slope in the reflectance of photosynthetic organisms (e.g., Sagan et al., 1993; Seager et al., 2005; Kiang et al., 2007a; O’Malley-James and Kaltenegger, 2018; Wang and He, 2021). The wavelength where a red edge analog occurs on other planets will likely depend on the stellar type, as seen in Figure 3. Here, we only consider atmospheric compositions with CO2, N2, and O2 similar to the modern Earth that are photochemically equilibrated with the incident stellar photon flux (see Methods), but different atmospheric compositions could also change the wavelength of red edge analogs by altering the availability of surface photons (e.g., Kiang et al., 2007a; Arney et al., 2016). Direct imaging mission concepts, such as NASA’s HabEx and LUVOIR, could constrain the atmospheric composition and thus the surface photon flux of habitable worlds and search for a vegetative red edge analog based on that measurement, as modeled here.
The exact nature of oxygenic photosynthesis, why certain absorption features exist and what drives accessory pigment production remains under investigation (e.g., see reviews Björn et al., 2009; Björn and Ghiradella, 2015). However, the model described in this work and similar models can explain the absorption features, at least in part, of numerous extant Earth organisms (Björn, 1976; Kiang et al., 2007b; Stomp et al., 2007; Milo, 2009; Marosvölgyi and van Gorkom, 2010). An edge-like photosynthetic pigment signature on an extrasolar planet will depend on the context of the parent star, atmosphere, and evolutionary stage of the planet. If evolution of photosynthesis tends always toward maximizing power gain, then the most likely candidate for a photosynthetic red edge analog on habitable exoplanets occurs at the optimal absorption peak, as depicted in Figure 3 for a selection of stellar types.
Data Availability Statement
The original contributions presented in the study are included in the article/Supplementary Material. In addition, the input spectra and pigment prediction model (as a Python script) are available as a zipped file in the Supplementary Material, further inquiries can be directed to the corresponding author.
Author Contributions
All authors listed have made a substantial, direct and intellectual contribution to the work and approved it for publication.
Funding
We would like to thank NASA’s Virtual Planetary Laboratory (grant 80NSSC18K0829) at the University of Washington and the NASA Pathways Program at the NASA Ames Research Center for funding this work.
Conflict of Interest
The authors declare that the research was conducted in the absence of any commercial or financial relationships that could be construed as a potential conflict of interest.
Supplementary Material
The Supplementary Material for this article can be found online at: https://www.frontiersin.org/articles/10.3389/fspas.2021.689441/full#supplementary-material
References
Arney, G., Domagal-Goldman, S. D., Meadows, V. S., Wolf, E. T., Schwieterman, E., Charnay, B., et al. (2016). The Pale Orange Dot: The Spectrum and Habitability of Hazy Archean Earth. Astrobiology 16, 873–899. doi:10.1089/ast.2015.1422
Arp, T. B., Kistner-Morris, J., Aji, V., Cogdell, R. J., van Grondelle, R., and Gabor, N. M. (2020). Quieting a Noisy Antenna Reproduces Photosynthetic Light-Harvesting Spectra. Science 368, 1490–1495. doi:10.1126/science.aba6630
ASTM (2020). Reference Air Mass 1.5 Spectra | Grid Modernization | NREL. Availabe at: https://www.nrel.gov/grid/solar-resource/spectra-am1.5.html. (Accessed April 3, 2020).
Bahcall, J. N., Pinsonneault, M. H., and Basu, S. (2001). Solar Models: Current Epoch and Time Dependences, Neutrinos, and Helioseismological Properties. ApJ 555, 990–1012. doi:10.1086/321493
Björn, L. O., and Ghiradella, H. (2015). “Spectral Tuning in Biology I: Pigments,” in Photobiology. Editor L. O. Björn (New York, NY: Springer New York), 97–117. doi:10.1007/978-1-4939-1468-5_9
Björn, L. O., Papageorgiou, G. C., Blankenship, R. E., and Govindjee, (2009). A Viewpoint: Why Chlorophyll a? Photosynth Res. 99, 85–98. doi:10.1007/s11120-008-9395-x
Björn, L. O. (1976). Why Are Plants green - Relationships between Pigment Absorption and Photosynthetic Efficiency. Photosynthetica 10, 121. Availabe at: http://lup.lub.lu.se/record/134648. (Accessed December 1, 2017).
Blankenship, R. E. (2014). Molecular Mechanisms of Photosynthesis. United Kingdom: John Wiley & Sons.
Blankenship, R. E. (Editor) (2008). “The Basic Principles of Photosynthetic Energy Storage,” in Molecular Mechanisms of Photosynthesis (Chichester, United Kingdom: Blackwell Science Ltd), 1–10. doi:10.1002/9780470758472.ch1
Catling, D. C., and Kasting, J. F. (2017). Atmospheric Evolution on Inhabited and Lifeless Worlds. New York: Cambridge University Press.
Claire, M. W., Sheets, J., Cohen, M., Ribas, I., Meadows, V. S., and Catling, D. C. (2012). The Evolution of Solar Flux from 0.1 Nm to 160 μm: Quantitative Estimates for Planetary Studies. ApJ 757, 95. doi:10.1088/0004-637X/757/1/95
Field, C. B., Behrenfeld, M. J., Randerson, J. T., and Falkowski, P. (1998). Primary Production of the Biosphere: Integrating Terrestrial and Oceanic Components. Science 281, 237–240. Availabe at: http://science.sciencemag.org/content/281/5374/237.short. doi:10.1126/science.281.5374.237
Hill, C., and Jones, R. L. (2000). Absorption of Solar Radiation by Water Vapor in clear and Cloudy Skies: Implications for Anomalous Absorption. J. Geophys. Res. 105, 9421–9428. doi:10.1029/1999JD901153
Kiang, N. Y., Segura, A., Tinetti, G., Govindjee, , Blankenship, R. E., Cohen, M., et al. (2007a). Spectral Signatures of Photosynthesis. II. Coevolution with Other Stars and the Atmosphere on Extrasolar Worlds. Astrobiology 7, 252–274. doi:10.1089/ast.2006.0108
Kiang, N. Y., Siefert, J., Govindjee, , and Blankenship, R. E. (2007b). Spectral Signatures of Photosynthesis. I. Review of Earth Organisms. Astrobiology 7, 222–251. doi:10.1089/ast.2006.0105
Kopparapu, R. K., Ramirez, R., Kasting, J. F., Eymet, V., Robinson, T. D., Mahadevan, S., et al. (2013). Habitable Zones Around Main-Sequence Stars: New Estimates. ApJ 765, 131. doi:10.1088/0004-637X/765/2/131
Lehmer, O. R., Catling, D. C., Parenteau, M. N., and Hoehler, T. M. (2018). The Productivity of Oxygenic Photosynthesis Around Cool, M Dwarf Stars. ApJ 859, 171. doi:10.3847/1538-4357/aac104
Lyons, T. W., Reinhard, C. T., and Planavsky, N. J. (2014). The Rise of Oxygen in Earth's Early Ocean and Atmosphere. Nature 506, 307–315. doi:10.1038/nature13068
Marosvölgyi, M. A., and van Gorkom, H. J. (2010). Cost and Color of Photosynthesis. Photosynth Res. 103, 105–109. doi:10.1007/s11120-009-9522-3
Mauzerall, D., Neuberger, A., and Kenner, G. W. (1976). Chlorophyll and Photosynthesis. Phil. Trans. R. Soc. Lond. B 273, 287–294. doi:10.1098/rstb.1976.0014
McCree, K. J. (1971). The Action Spectrum, Absorptance and Quantum Yield of Photosynthesis in Crop Plants. Agric. Meteorology 9, 191–216. doi:10.1016/0002-1571(71)90022-7
Mielke, S. P., Kiang, N. Y., Blankenship, R. E., Gunner, M. R., and Mauzerall, D. (2011). Efficiency of Photosynthesis in a Chl D-Utilizing Cyanobacterium Is Comparable to or Higher Than that in Chl A-Utilizing Oxygenic Species. Biochim. Biophys. Acta (Bba) - Bioenerg. 1807, 1231–1236. doi:10.1016/j.bbabio.2011.06.007
Milo, R. (2009). What Governs the Reaction center Excitation Wavelength of Photosystems I and II? Photosynth Res. 101, 59–67. doi:10.1007/s11120-009-9465-8
O'Malley-James, J. T., and Kaltenegger, L. (2018). The Vegetation Red Edge Biosignature through Time on Earth and Exoplanets. Astrobiology 18, 1123–1136. doi:10.1089/ast.2017.1798
Papageorgiou, G. C. (2004). “Fluorescence of Photosynthetic Pigments In Vitro and In Vivo,” in Chlorophyll a Fluorescence: A Signature of Photosynthesis, Advances in Photosynthesis and Respiration. Editors G. C. Papageorgiou, and Govindjee (Dordrecht: Springer Netherlands), 43–63. doi:10.1007/978-1-4020-3218-9_2
Porporato, A., D’Odorico, P., Laio, F., Ridolfi, L., and Rodriguez-Iturbe, I. (2002). Ecohydrology of Water-Controlled Ecosystems. Adv. Water Resour. 25, 1335–1348. doi:10.1016/S0309-1708(02)00058-1
Porporato, A., D’Odorico, P., Laio, F., and Rodriguez-Iturbe, I. (2003). Hydrologic Controls on Soil Carbon and Nitrogen Cycles. I. Modeling Scheme. Adv. Water Resour. 26, 45–58. doi:10.1016/S0309-1708(02)00094-5
Reinhard, C. T., Planavsky, N. J., Gill, B. C., Ozaki, K., Robbins, L. J., Lyons, T. W., et al. (2016). Evolution of the Global Phosphorus Cycle. Nature 541, 386–389. doi:10.1038/nature20772
Ritchie, R. J., Larkum, A. W. D., and Ribas, I. (2017). Could Photosynthesis Function on Proxima Centauri B? Int. J. Astrobiol. 17, 147–176. doi:10.1017/S1473550417000167
Ross, R. T., and Calvin, M. (1967). Thermodynamics of Light Emission and Free-Energy Storage in Photosynthesis. Biophysical J. 7, 595–614. doi:10.1016/S0006-3495(67)86609-8
Sagan, C., Thompson, W. R., Carlson, R., Gurnett, D., and Hord, C. (1993). A Search for Life on Earth from the Galileo Spacecraft. Nature 365, 715–721. doi:10.1038/365715a0
Schwieterman, E. W., Kiang, N. Y., Parenteau, M. N., Harman, C. E., DasSarma, S., Fisher, T. M., et al. (2018). Exoplanet Biosignatures: A Review of Remotely Detectable Signs of Life. Astrobiology 18, 663–708. doi:10.1089/ast.2017.1729
Seager, S., Turner, E. L., Schafer, J., and Ford, E. B. (2005). Vegetation's Red Edge: A Possible Spectroscopic Biosignature of Extraterrestrial Plants. Astrobiology 5, 372–390. doi:10.1089/ast.2005.5.372
Segura, A., Kasting, J. F., Meadows, V., Cohen, M., Scalo, J., Crisp, D., et al. (2005). Biosignatures from Earth-like Planets Around M Dwarfs. Astrobiology 5, 706–725. doi:10.1089/ast.2005.5.706
Segura, A., Krelove, K., Kasting, J. F., Sommerlatt, D., Meadows, V., Crisp, D., et al. (2003). Ozone Concentrations and Ultraviolet Fluxes on Earth-like Planets Around Other Stars. Astrobiology 3, 689–708. doi:10.1089/153110703322736024
Stomp, M., Huisman, J., Stal, L. J., and Matthijs, H. C. P. (2007). Colorful Niches of Phototrophic Microorganisms Shaped by Vibrations of the Water Molecule. Isme J. 1, 271–282. doi:10.1038/ismej.2007.59
Takizawa, K., Minagawa, J., Tamura, M., Kusakabe, N., and Narita, N. (2017). Red-edge Position of Habitable Exoplanets Around M-Dwarfs. Sci. Rep. 7. doi:10.1038/s41598-017-07948-5
Tinetti, G., Rashby, S., and Yung, Y. L. (2006). Detectability of Red-Edge-Shifted Vegetation on Terrestrial Planets Orbiting M Stars. ApJ 644, L129–L132. doi:10.1086/505746
Tucker, C. J., and Maxwell, E. (1976). Sensor Design for Monitoring Vegetation Canopies. Photogrammetric Eng. 42, 1399.
Tyrrell, T. (1999). The Relative Influences of Nitrogen and Phosphorus on Oceanic Primary Production. Nature 400, 525–531. doi:10.1038/22941
Wang, F., and He, J. (2021). Diurnal Variability and Detectability of Vegetation Red Edge of Earth-like Exoplanets. ApJ 909, 9. doi:10.3847/1538-4357/abd6ff
Keywords: biosignature, photosynthesis, pigment, red edge, exoplanet, reflectance, absorptance, vegetation
Citation: Lehmer OR, Catling DC, Parenteau MN, Kiang NY and Hoehler TM (2021) The Peak Absorbance Wavelength of Photosynthetic Pigments Around Other Stars From Spectral Optimization. Front. Astron. Space Sci. 8:689441. doi: 10.3389/fspas.2021.689441
Received: 31 March 2021; Accepted: 14 June 2021;
Published: 08 July 2021.
Edited by:
Wolf Dietrich Geppert, Stockholm University, SwedenReviewed by:
Josep M. Trigo-Rodríguez, Consejo Superior de Investigaciones Científicas, SpainJack Madden, Carl Sagan Institute, United States
Copyright © 2021 Lehmer, Catling, Parenteau, Kiang and Hoehler. This is an open-access article distributed under the terms of the Creative Commons Attribution License (CC BY). The use, distribution or reproduction in other forums is permitted, provided the original author(s) and the copyright owner(s) are credited and that the original publication in this journal is cited, in accordance with accepted academic practice. No use, distribution or reproduction is permitted which does not comply with these terms.
*Correspondence: Owen R. Lehmer, b3dlbi5yLmxlaG1lckBuYXNhLmdvdg==