 Agnit Mukhopadhyay
 Xianzhe Jia
 Daniel T. Welling
 Michael W. Liemohn
95% of researchers rate our articles as excellent or good
Learn more about the work of our research integrity team to safeguard the quality of each article we publish.
Find out more
BRIEF RESEARCH REPORT article
Front. Astron. Space Sci. , 21 April 2021
Sec. Space Physics
Volume 8 - 2021 | https://doi.org/10.3389/fspas.2021.637197
This article is part of the Research Topic Towards a Full Understanding of Magnetic Storms and Substorms View all 6 articles
The performance of three global magnetohydrodynamic (MHD) models in estimating the Earth's magnetopause location and ionospheric cross polar cap potential (CPCP) have been presented. Using the Community Coordinated Modeling Center's Run-on-Request system and extensive database on results of various magnetospheric scenarios simulated for a variety of solar weather patterns, the aforementioned model predictions have been compared with magnetopause standoff distance estimations obtained from six empirical models, and with cross polar cap potential estimations obtained from the Assimilative Mapping of Ionospheric Electrodynamics (AMIE) Model and the Super Dual Auroral Radar Network (SuperDARN) observations. We have considered a range of events spanning different space weather activity to analyze the performance of these models. Using a fit performance metric analysis for each event, the models' reproducibility of magnetopause standoff distances and CPCP against empirically-predicted observations were quantified, and salient features that govern the performance characteristics of the modeled magnetospheric and ionospheric quantities were identified. Results indicate mixed outcomes for different models during different events, with almost all models underperforming during the extreme-most events. The quantification also indicates a tendency to underpredict magnetopause distances in the absence of an inner magnetospheric model, and an inclination toward over predicting CPCP values under general conditions.
The global state of the terrestrial magnetosphere may be broadly characterized by two categories of physical identifiers: (a) geomagnetic indices which indicate variations in the near-Earth space environment due to activity (e.g., Dst, Sym-H, Kp, AE; Pulkkinen et al., 2011; Glocer et al., 2016; Liemohn et al., 2018), and (b) physical quantities that help describe the morphology and energy balance in the magnetosphere (ground magnetic perturbations dB/dt and ΔB, field aligned currents, polar cap potential; Rastätter et al., 2011; Honkonen et al., 2013; Pulkkinen et al., 2013; Anderson et al., 2017; Welling et al., 2017). In the latter set, the cross polar cap potential (CPCP) and magnetopause standoff distances (MPSD) are two widely used physical quantities that simultaneously help define the structure and state of the magnetospheric system. The MPSD, defined as the nearest subsolar point of the magnetopause to the Earth's surface (e.g., Fairfield, 1971; Elsen and Winglee, 1997; Gombosi, 1998), has been a predominant measure in studying compression of the Earth's dayside magnetosphere (e.g., Welling et al., 2021), while providing an instantaneous value of the energy imparted on the terrestrial magnetic system by the solar wind (e.g., Lin et al., 2010). The CPCP, on the other hand, acts as an instantaneous indicator of the amount of energy flowing into the Earth's magnetosphere-ionosphere system from the solar wind (e.g., Boyle et al., 1997; Burke et al., 1999; Russell et al., 2001; Liemohn and Ridley, 2002; Ridley and Liemohn, 2002; Ridley, 2005; Ridley et al., 2010), and is frequently used in conjunction with field aligned currents (FACs) to describe ionospheric electrodynamics (e.g., Reiff et al., 1981; Siscoe et al., 2002a,b; Ridley et al., 2004; Khachikjan et al., 2008; Mukhopadhyay et al., 2020). Observationally, these two quantities are difficult to measure globally, with MPSD estimates largely depending on satellite crossings of the magnetopause over a distributed period of time (e.g., Shue et al., 1997), and CPCP depending on incomplete global coverage of the hemisphere using ground-based observations and/or in-situ measurements from space (e.g., Gao, 2012). These quantities are, therefore, measured using physics-driven empirical (e.g., Petrinec and Russell, 1993; Boyle et al., 1997; Shue et al., 1997) or assimilative techniques (e.g., Kihn and Ridley, 2005). Since most of these techniques were created for different initial conditions (e.g., Lin et al., 2010; Gao, 2012), comparison of multiple such models against first-principles-based global models or each other is a daunting task. This task is made especially precarious when studying extreme events, as most of these techniques were not designed to simulate extreme conditions (e.g., Welling et al., 2017; Mukhopadhyay et al., 2020).
Several empirical models have been developed to estimate the MPSD. Physically, the size and shape of the magnetopause can be estimated based on the dynamic and static pressure of the solar wind (e.g., Kivelson and Russell, 1995) along with sufficient knowledge of the interplanetary magnetic field. This is the primary basis of these models that estimate MPSD by assuming a general shape of the magnetopause. The most commonly used magnetopause models such as the Shue et al. (1997, 1998) models or the Petrinec and Russell (1993, 1996) model use trigonometric functions and solar wind parameters to describe the MPSD. Later models such as the Liu et al. (2015) model have attempted to include additional pressure and magnetic field components of the solar wind using predicted values from first-principles-based models in addition to satellite crossing data in order to improve on these empirical models. A performance analysis of many such models was presented by Lin et al. (2010) to compare their model against a range of empirical models dating back to 1993. More recently, Staples et al. (2020) conducted a thorough analysis of MPSD model performance, especially during extreme driving.
In contrast to MPSD models, the CPCP which is defined as the difference between the maxima and minima of the ionospheric potential (e.g., Boyle et al., 1997) is largely derived from instantaneous observations of ionospheric and/or ground-based quantities. The four most commonly used techniques to estimate the ionospheric CPCP are: (1) polar observations by the Defense Meteorological Satellite Program (e.g., Hairston and Heelis, 1996), (2) the polar cap index (e.g., Troshichev et al., 1996), (3) measurements by the Super Dual Auroral Radar Network (SuperDARN; e.g., Khachikjan et al., 2008), and (4) the Assimilative Mapping of Ionospheric Electrodynamics (AMIE) technique (e.g., Ridley and Kihn, 2004). An extensive comparison of the general features, advantages, and limitations of these datasets could be found in the work by Gao (2012).
With the advent of physics-driven space weather prediction over the last couple of decades, validation of global first-principles-based models has become a common exercise in the space science community to identify and improve on our physical understanding of the near-Earth system (e.g., Pulkkinen et al., 2011, 2013; Rastätter et al., 2011). Compared to other space weather indices and/or space-based plasma quantities, fewer studies have compared the performance of MPSD and CPCP values from global models until recently (Mukhopadhyay et al., 2018, 2019; Burleigh et al., 2019; Collado-Vega et al., 2019). This is partly because, contrary to space weather indices (e.g., Glocer et al., 2013) and most other space weather quantities like FACs (e.g., Anderson et al., 2017) or ΔB (e.g., Welling et al., 2017), both MPSD and CPCP are measured by multiple methods and datasets. This means that a metric analysis of these quantities modeled after the GEM Challenges, which compared globally-modeled results against singular observational datasets, will not yield meaningful results.
In this study, an attempt to quantitatively compare globally-simulated MPSD and CPCP against multiple observationally-derived datasets has been undertaken. Three global magnetospheric models – the Space Weather Modeling Framework (SWMF), the Lyon-Fedder-Mobarry (LFM) model, and the Open General Geospace Circulation Model (OpenGGCM) have been simulated through the NASA Community Coordinated Modeling Center (CCMC) website for seven space weather events. The global results are compared against six empirical MPSD models and two CPCP datasets. The performance analysis conducted in Pulkkinen et al. (2011), Rastätter et al. (2011), and Honkonen et al. (2013), one of the few validation studies to have compared MPSD and CPCP against the Lin et al. (2010) model and SuperDARN respectively, were used as a basis to select events and construct a metric performance analysis. However, to better serve the primary aim of the study, a new metric, Exclusion Parameter in addition to modified versions of the Root-Mean-Square Error and Maximum Amplitude Ratio has been used to dissociate physics-driven deficiencies in each model that impact the prediction of MPSD and CPCP. Results indicate global models to be overpredicting CPCP, while reasonably estimating MPSD values.
Three global models have been compared in this study – (1) SWMF, (2) LFM model, and (3) OpenGGCM. The SWMF is a true framework containing a number of physics-based models (Tóth et al., 2005, 2012) and is operationally used in space weather prediction (e.g., Cash et al., 2018). It employs the BATS-R-US model (Powell et al., 1999) to simulate the global magnetospheric domain using conservative MHD equations. BATS-R-US is dynamically coupled to an inner magnetospheric model like Rice Convection Model (Wolf et al., 1982) which provides realistic ring current pressure and density (De Zeeuw et al., 2004; Glocer et al., 2016; Welling et al., 2018). The global and inner magnetospheric components are connected to the Ridley Ionosphere Model (RIM) which solves for the ionospheric electrodynamics using a prescribed empirical conductance model (Ridley et al., 2004; Mukhopadhyay et al., 2020).
The LFM model (Merkine et al., 2003; Lyon et al., 2004; Merkin et al., 2005a,b) is another global model that is actively used throughout the space science community. The MHD component employs a 3D stretched spherical grid to solve for semi-conservative MHD equations in the magnetospheric domain, which is then coupled with a magnetosphere-ionosphere coupler/solver (MIX). MIX solves for the ionospheric electric potential using a semi-empirical auroral conductance module that is driven using MHD inputs (Fedder et al., 1995; Wiltberger et al., 2001). Although the model is capable of additional coupling to an inner magnetospheric module (Pembroke et al., 2012), this coupling is not yet fully available on the CCMC website, and, therefore, was not utilized in the simulations conducted for this study.
OpenGGCM (Raeder et al., 2001, 2008) employs a non-uniform static Cartesian grid to solve the semi-conservative resistive MHD equations in the GSE coordinate system. It is coupled with the Coupled Thermosphere-Ionosphere Model (CTIM; e.g., Connor et al., 2016) to solve for the ionospheric potential using both first-principle based and empirical methods. OpenGGCM provides auroral precipitation and ionospheric FACs to CTIM, and receives the potential as an inner boundary condition. In spite of its capability (Cramer et al., 2017), like LFM, there is no coupled inner magnetospheric model for OpenGGCM available through the CCMC website, and therefore only OpenGGCM with coupled CTIM was used in this study.
Seven geospace events, listed in Table 1, were chosen for the study. The selected events vary in strength and magnetospheric structure as indicated by the minimum Dst and maximum AE reached during the course of each event. Each event has been studied at least once in previous work. (Miyoshi et al., 2006; Yermolaev et al., 2008; Pulkkinen et al., 2011; Honkonen et al., 2013). All global models have been executed through the CCMC website (http://ccmc.gsfc.nasa.gov/) and receive as input the solar wind value at L1. The ionospheric CPCP of the MHD models, made available as DPhi on the CCMC website, was used. The features and settings of the global models were kept as similar to each other as possible. All models were run with solar wind parameters provided by ACE and/or WIND, depending on availability. The simulation results have been listed in the dataset provided with this manuscript, and have been made available through the CCMC website using the CCMC-assigned run names.
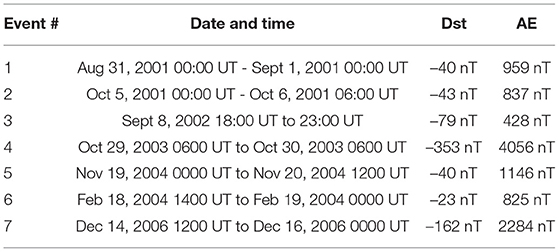
Table 1. List of all geospace events studied in the present work.
All magnetopause models used in this study have been listed in Table 2 along with a summary of their fitting details with the solar wind. A total of six empirical MPSD models were chosen for validation, and driven using the same solar inputs used to drive the global models. The results of Lin et al. (2010) were primarily used to select the list of empirical models. In order to better evaluate MPSD models, Lin et al. (2010) used the standard deviation σ(d) to compare their model's performance with existing models against 246 satellite crossings of the magnetopause with 5 min average solar wind parameters (see Table 10 in Lin et al., 2010). The present study has included only those empirical models that predicted with a standard deviation lesser than ~1. In addition to the above, a later model developed by Liu et al. (2015) has also been used.
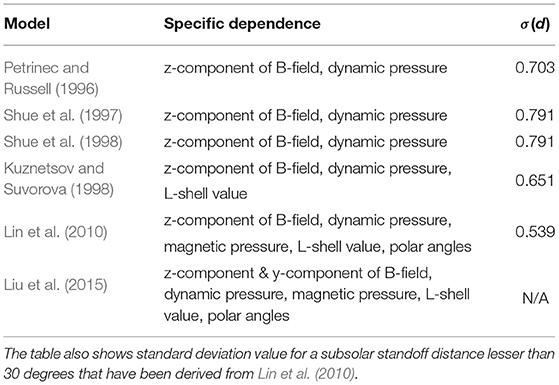
Table 2. Summary of the Empirical Models with a list of solar-wind dependencies required for their execution.
Observations from SuperDARN and assimilated results from AMIE have been used to derive CPCP for this study. SuperDARN is a network of radars that measures line-of-sight ionospheric convection velocities with a ground-based network of radars and then infers functional forms of the electrostatic potential, as a function of the colatitude and longitude (Ruohoniemi and Baker, 1998). For more detail on SuperDARN's estimation technique of the CPCP, please refer to Khachikjan et al. (2008). AMIE assimilates many types of data from both ground-based and space-based instruments and produces estimates of several ionospheric parameters including the potential in the polar cap (Richmond and Kamide, 1988). In the version used in this study (Kihn and Ridley, 2005), only ground magnetometer data have been used to predict the potential.
To undertake this comparative analysis, we have used the following three performance metrics: (1) Root-Mean-Square Error (RMSE), (2) Maximum Amplitude Ratio (MAR), and (3) Exclusion Parameter (EP). RMSE and MAR have been defined similarly to the metrics defined in Pulkkinen et al. (2011) and Honkonen et al. (2013), in order to quantify the error in the simulated results. The metric EP has been introduced specifically for this study in order to better quantify model-model comparisons. In the following, results from the empirical magnetopause models and ionospheric results from AMIE and SuperDARN have been interchangeably termed predicted observations or simply observations, to distinguish from results from the global models.
RMSE is a popular fit metric used to quantify the difference between predictions and observations, with a value of 0 indicating perfect performance. RMSE is defined as
where xobs and xmod are the observed and the modeled results, respectively, < ...> indicates the arithmetic mean taken over i ranging over N time steps. Throughout this work i corresponds to the time series over individual events, with N indicating the total number of time steps in a given event(s). Because RMSE takes the square of the numbers involved, the values cannot be negative.
The second metric, MAR is defined as the ratio of the maximum amplitudes:
where i, xobs, and xmod stand for the same variables as in Equation (1). Clearly, MAR = 1 indicates perfect model performance, while MAR>1 and MAR < 1 indicates over- and underestimation. This is especially useful in analyzing quantities like MPSD, where it is critical to understand whether the peak value of globally-modeled MPSD is overpredicted or underpredicted when compared against empirically-modeled MPSD which provides useful insight regarding the physical morphology of the magnetosphere, especially during storm-time magnetospheric compression.
The third metric EP has been used to quantify times when simulated results lay outside the range of observationally-derived estimates (including their standard deviations), and if during such times the simulated results overestimated or underestimated the values. This is an important aspect to study as this investigation is comparing modeled results against multiple observational and modeled datasets, and it is highly unlikely that the observationally-derived estimates will match with each other. Any and every prediction of the MHD-modeled data that is “excluded” from the observational range (outside the range of observed values) has been characterized as an incorrect prediction, and therefore counted as an exclusion. Mathematically, this could be defined as
Here, i, xobs, and xmod are the same as the previous equations, while σobs is the standard deviation of the observed data, and (max, min) signify the maxima and minima of observed values at timestep i. Using the above relation, EP identifies the number of times when the model is outside the set limits of the observed values, and measures if the exclusivity is due to underprediction or overprediction of values at each time step using the following relation:
At the end of calculations, the total number of “excluded” time steps as a fraction of the total number of time steps defines the total EP underprediction and overprediction as a percentage value, such that the addition of the total underpredicted and overpredicted fractions results in the EP:
where EPevent is the total EP as a fraction of the total number of time steps, N. Note that the under- and over-prediction percentages are as a fraction of the total event time and not of the total wrongly predicted times. For example, a model with an EP value of 50% with a total under-prediction percentage of 10% for a given event indicates that the model results lie outside the observation thresholds 50% of all times during the event but under-predict only 10% of the total time, further signifying that 40% of the total time the model results are over-predicted. This parameter was specifically introduced to understand variations in the both the MP standoff distance and CPCP values, as the observations/empirical-derived quantities themselves vary at a given time step. Further discussion about this parameter's usage is described in sections 3 and 4.
Figure 1 displays a composite image of the performance quantification of model-predicted magnetopause standoff distances against predicted observations using the empirical models. In part (a), a time series comparison of the magnetopause distance for the August 31, 2001 event has been shown. Results from the global models displayed using the solid lines are plotted against a gray band of values encompassing the individual time-series of all 6 empirical magnetopause models. The black solid line passing through the middle of the gray band is the median value of the empirically modeled results. In part (b), the aggregate RMSE (top subplot i), MAR (middle subplot ii), and EP (bottom subplot iii) have been computed for each event. In order to compute each metric, the time series data simulated by the global models were compared against the median value of the observationally-derived estimates. LFM magnetopause distances exhibit the lowest RMSE for each event, with 6 out of 7 events having a RMSE value 1 RE. OpenGGCM has the highest RMSE values with 5 out the 7 events have RMSE values greater than 1 RE. SWMF follows LFM results closely for all events except for the December 2006 event (Event 7) where it exhibits the highest RMSE value among all the global models. The median RMSE values across all events are plotted in light-dashed lines – LFM has the lowest aggregate RMSE at 0.5 RE, followed closely by SWMF with a median RMSE value of 0.76 RE and by OpenGGCM with a median RMSE value of 2.01 RE. In part (b-ii), all models exhibit MAR values deviated from unity by less than 0.2 except during the Halloween Storm of 2003 (Event 4) and February 2004 event (Event 6). LFM performs reasonably well for all events, exhibiting a median MAR value of 1.15 RE. While SWMF has the least median MAR value of 1.03 RE, it underperforms during 3 of the 7 events resulting in the highest MAR values for Events 1, 2, and 4, overpredicting by a factor of >1.4 times the observed values during the Halloween Storm of 2003 (Event 4). OpenGGCM performs reasonably for 5 of the 7 events, with the model exhibiting significant deviation from unity during the Halloween Storm of 2003 (Event 4) and the December 2006 Storm (Event 7). In part (b-iii), the magnetopause standoff distance EPs for the three global models are compared. Both LFM and SWMF exhibit EP values less than 50% for almost all events resulting in an aggregate EP value of 36 and 42%, respectively, with the only exception being SWMF's performance during Event 7. By comparison, OpenGGCM has a high EP value for almost all events with the model showing a median EP value of ~78%. The EP values are model-wise re-plotted in part (c) of the figure, but the area under the curve is colored by the proportion of underprediction and overprediction. Since underprediction and overprediction of the EP is calculated as a fraction of the total time series, the total EP for any given model could be defined as the addition of the underpredicted fraction and the overpredicted fraction. As shown in part (c-i), SWMF mostly overpredicts the magnetopause distance during all events except Event 7. It also has a significant underprediction fraction during Events 4, 5, and 6, which along with Event 7 correspond with some of the strongest events being studied in this report. In contrast to SWMF results, both LFM and OpenGGCM predominantly underpredict during almost all events when outside of empirically-predicted range of values. The only exception to this is OpenGGCM's EP values during the Halloween Storm of 2003 where the overprediction fraction are greater than the underprediction.
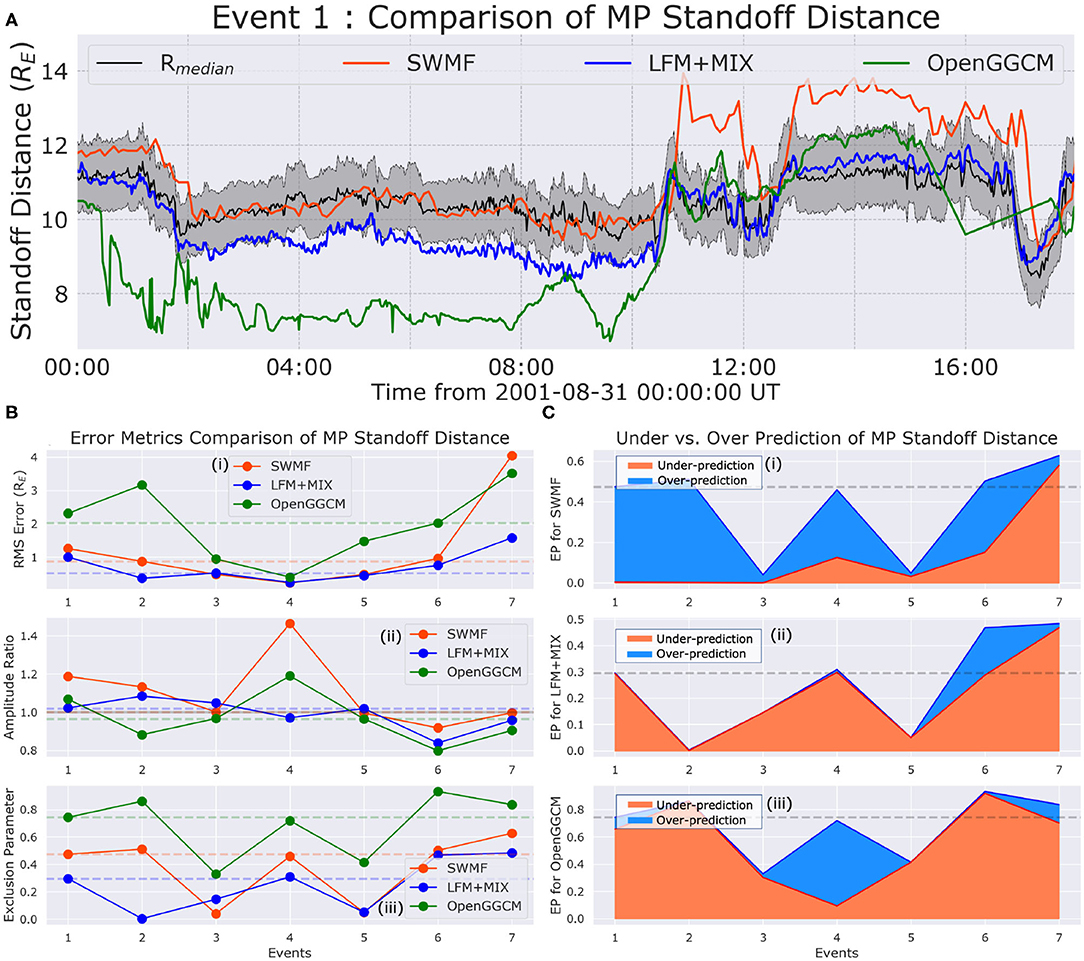
Figure 1. Analysis of the MHD-predicted magnetopause standoff distances against the empirical models – (A) An example time-transient comparison of the magnetopause distances during Event 1 from SWMF (in red), LFM+MIX (in blue), and OpenGGCM (in green) compared against the six empirical magnetopause models which have been shown here as a range of values demarcated by the gray band, with the black line in the center of the band being the median value. (B) Comparison of (i) RMS Error, (ii) Amplitude Ratio, and (iii) Exclusion Parameter for the three models across all 7 events (in same color scheme as Top plot). The dashed lines in the background signify the median value of these metrics across all events. (C) Comparison of the Underprediction and Overprediction score from the Exclusion parameter. The results have been separately presented for (i) SWMF, (ii) LFM+MIX, and (iii) OpenGGCM, with orange signifying underprediction of values, and light-blue indicating overprediction. The overpredicted values are plotted atop the underpredicted values.
Figure 2 describes the comparison of CPCP values estimated by global models and compared against AMIE and SuperDARN measurements. A similar format to Figure 1 is followed for consistency. In part (a), a time series comparison of the CPCP for the December 14, 2006 event has been shown comparing MHD-modeled results against the band of values observed by SuperDARN and predicted by AMIE. In part (b-i), while the aggregate RMSE values for each model are within 100 kV, event-wise performance varies – SWMF exhibits the lowest median RMSE value of 24 kV, with the RMSE value being <50 kV for all events except Event 4. LFM follows a similar pattern as SWMF, but displays comparatively higher RMSE values for Events 6 and 7. OpenGGCM exhibits RMSE values greater than 100 kV for Events 2, 4, and 6. The simulations of the Halloween Storm of 2003 (Event 4) lead to the highest errors for CPCP. In part (b-ii), the MAR values of all models are much higher when compared to magneopause MAR values. All three models follow a similar trend for all events, except OpenGGCM during Event 2 and 6 when it exhibits a MAR value greater than 4 times the observed median values for those events. LFM exhibits a median MAR value of 2.05 while SWMF has the closest MAR value to unity of 0.995. In part (b-iii), all models exhibit an EP value >50% for all events except Event 4 and 7. OpenGGCM has the highest median EP value at 98.7%, with 4 out of 7 events being 100% out of range. LFM shows a median EP of 78.6%, while SWMF exhibits the lowest median EP value of 72%. The EP values replotted in part (c) show that LFM (part ii) and OpenGGCM (part iii) largely overpredict the CPCP when outside the range of observed values. While SWMF largely underpredicts the CPCP during Events 1, 2, 3, and 4, CPCP during the remaining events was mainly overpredicted.
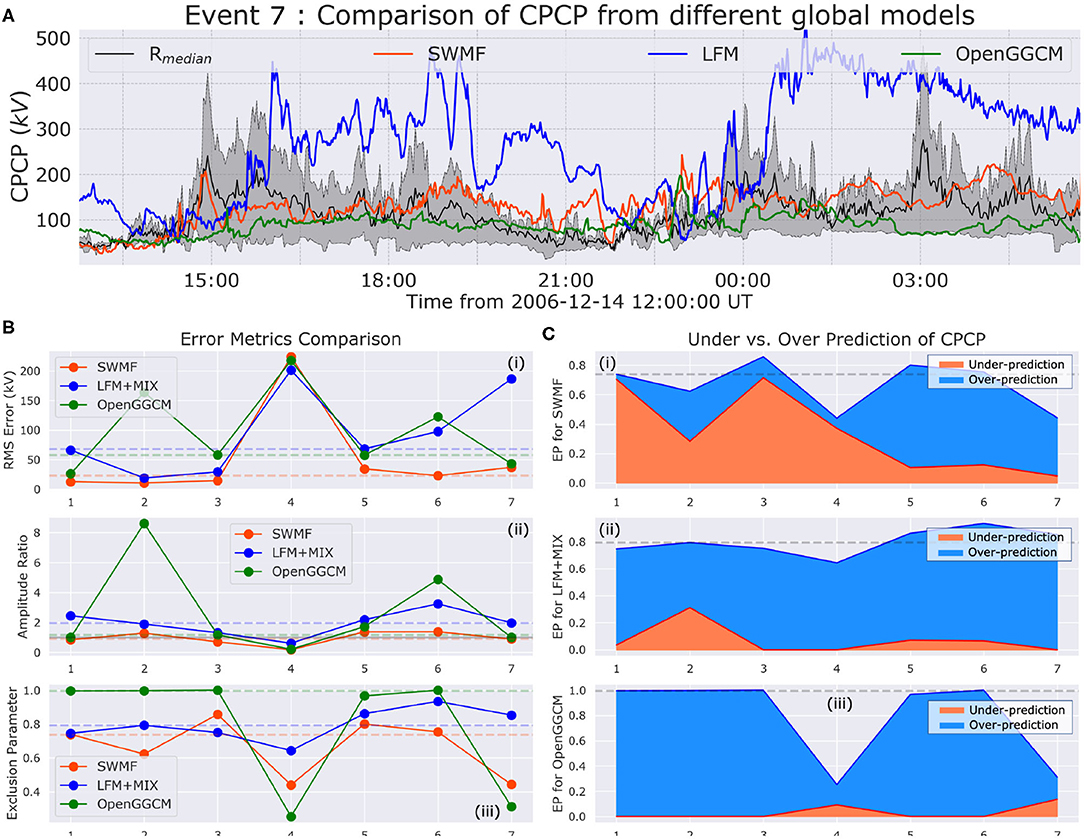
Figure 2. Analysis of the MHD-predicted cross polar cap potential (CPCP) against AMIE and SuperDARN estimates – (A) An example time-transient comparison of the CPCP during Event 7 from SWMF (in red), LFM+MIX (in blue), and OpenGGCM (in green) compared against the combined range of values between AMIE and SuperDARN estimates demarcated here by the gray band, with the black line in the center of the band being the median value. Formats for subplots (B,C) are similar to Figures 1B,C.
Because modeled MPSD and CPCP were compared against multiple datasets, the lone usage of error metrics like RMSE is not enough to meaningfully rank model performance (Liemohn et al., 2021) as has often been done before (e.g., Pulkkinen et al., 2011). Because there is no single right answer, a significant aim of this study has been to develop innovative metrics to better quantify the performance of global models against multiple, divergent observationally-derived estimates. For example, CPCP values from SuperDARN and AMIE are at significant odds with each other during stronger events as evidenced by Figure 2A. To counter this problem, MAR and EP are used which allow us to identify whether a global model overpredicts or underpredicts; this does not give us a quantitative error value, but is able to create a blanket range of values within which a modeled result could be considered reasonable. While the usage of better metrics (e.g., Haiducek et al., 2017; Morley et al., 2018) would be strongly considered for future studies involving CPCP and MPSD validation, the rudimentary metric analysis in this study has been used to understand the differences in each model's performance and discuss future directions toward improvements.
In the performance analysis of MPSD, the metrics indicate reasonable performance during weaker events. For instance, some of the lowest EP values are exhibited by all three models during Events 3 and 5, which have the lowest AE. LFM and OpenGGCM tend to underpredict the MP standoff distance, as indicated in part (c) of Figure 1. This is probably due to the absence of an inner magnetospheric module to provide realistic ring current pressure values. SWMF, which uses RCM to provide a much stronger ring current input, tends to overpredict the MP standoff distance. This is in agreement with the study by Samsonov et al. (2016) which found that accounting for a realistic ring current in global MHD brings values closer to the empirical MP models. However, as shown in Staples et al. (2020), the validity of MP standoff distances as estimated by the empirical models during extreme events is questionable. Since the study does not employ direct comparisons with satellite crossings, a future extension of this work would compare modeled results directly against in-situ measurements from satellites like Cluster, THEMIS, MMS, or Geotail (e.g., Angelopoulos et al., 2009; Lin et al., 2010; Burch and Phan, 2016; Collado-Vega et al., 2019).
The CPCP metric analysis indicates that ionospheric potential predicted by the global models are greater than the expected value sometimes by more than a factor of 8. This tendency of global models to overpredict the CPCP could be driven by field aligned current generation in the global MHD domains and/or the ionospheric conductance value, as all models use a similar numerical framework to apply Ohm's Law (Goodman, 1995). Since FAC strength and pattern is an aspect of MHD grid resolution (Ridley et al., 2010; Wiltberger et al., 2017; Welling et al., 2019; Mukhopadhyay et al., 2020), incorrect estimation of the ionospheric conductance, especially in the polar (auroral) region, should play a significant role in the overprediction of CPCP. Since each global model uses different techniques to estimate this quantity (SWMF uses an empirical conductance model, while LFM and OpenGGCM use a semi-empirical physics-driven conductance system), it is challenging to suggest a universal solution. In addition, dependencies in techniques like AMIE on empirical relationships (e.g., Ahn et al., 1998) to derive ionospheric electrodynamics results in an independent challenge of establishing a global truth value for the ionospheric conductance. Recent advancements in addressing these issues through the ongoing Ionospheric Conductance Challenge was reported by Öztürk et al. (2020). Furthermore, significant deviations between AMIE and SuperDARN values, especially during the Halloween Storm (Event 4) and the December 2006 event (Event 7) indicate that a performance evaluation of CPCP measurement during extreme driving is necessary. Binning of CPCP metrics by geomagnetic indices like AE and Sym-H would be a future focus of this study, which could provide a quantitative measure of performance across activity thresholds, similar to Welling et al. (2017). Gao (2012) has discussed the disadvantages of using SuperDARN, which under-predicts, and AMIE, which over-predicts, leading to sharp deviation in CPCP predictions. Future studies should consider using a tertiary source of data (like DMSP or PC Index) or a different quantity (e.g., hemispheric power index) to evaluate ionospheric performance. Furthermore, conducting metric validation on ionospheric drivers of CPCP, like electric fields and ion drift velocities, that are available from instruments like DMSP SSIES (Kihn et al., 2006), should be considered.
The present study aimed at evaluating global models' prediction of MPSD and CPCP against multiple robust observationally-derived datasets. The study used well-documented space weather events simulated using three different global MHD models through the CCMC Run-on-Request feature. The MPSD from these model results were compared against empirical magnetopause models, while the predicted ionospheric polar cap potential values were compared against those obtained from SuperDARN and AMIE. Three performance metrics—RMSE, MAR, and EP—were used to quantify the predictions. While the models performed reasonably well during times of relatively weak geomagnetic activity, it was found that extreme events lead to increased errors and a tendency to overpredict the ionospheric potential. While inclusion of a ring current model in a global simulation leads to lesser underprediction of the MPSD during extreme driving, the study does not find that such an approach necessarily leads to reduced errors. Furthermore, the use of empirical models to predict MPSD, and statistics-based datasets to predict CPCP, may lead to incorrect evaluations during extreme events. Future studies should consider applying improved metrics to further evaluate these parameters.
The datasets presented in this study can be found in online repositories. The names of the repository/repositories and accession number(s) can be found at: DeepBlue Repository: Mukhopadhyay (2020).
We use the CRediT (Contributor Roles Taxonomy) categories (Brand et al., 2015) for providing the following contribution description. AM led the conceptualization, designed the methodology, conducted the investigation, performed data visualization and formal analysis, and wrote the original draft. XJ provided resources and supervised the initial conceptualization and methodology design. DW and ML assisted in conceptualization and formal analysis, provided the resources, funding acquisition, supervision, and aided in project administration. All authors have contributed toward the revision and editing of the manuscript.
This research was funded by NASA grants: NNX12AQ40G, 80NSSC18K1120, 80NSSC17K0015, NNX17AB87G, and NSF grant 1663770 - AWD004525. Partial funding for travel was also received by AM through the CCMC Student Research Contest held in 2017.
The authors declare that the research was conducted in the absence of any commercial or financial relationships that could be construed as a potential conflict of interest.
All model result data, input files and observation data are available via [DeepBlue Link] and through the Community Coordinated Modeling Center website (http://ccmc.gsfc.nasa.gov/), and the Virtual Model Repository website (http://vmr.engin.umich.edu/). This study would not have been possible without the support of the staff at the Community Coordinated Modeling Center, which is funded by the National Science Foundation, National Aeronautical and Space Administration, the Air Force Office of Scientific Research, and others. AM would also like to thank organizers of the CCMC Student Research Contest 2017 for their generous funding and support. The authors would also like to thank Mr. Shibaji Chakrabarty and Ms. Garima Malhotra who kindly provided us data from the SuperDARN system and University of Michigan's AMIE data repository. VMR is maintained by Dr. Aaron Ridley at the University of Michigan. The authors would also like to thank Mr. Brain Swiger for his valuable comments on the draft manuscript, and support with the manuscript submission.
Ahn, B.-H., Richmond, A. D., Kamide, Y., Kroehl, H. W., Emery, B. A., de la Beaujardiére, O., et al. (1998). An ionospheric conductance model based on ground magnetic disturbance data. J. Geophys. Res. Space Phys. 103, 14769–14780. doi: 10.1029/97JA03088
Anderson, B. J., Korth, H., Welling, D. T., Merkin, V. G., Wiltberger, M. J., Raeder, J., et al. (2017). Comparison of predictive estimates of high-latitude electrodynamics with observations of global-scale birkeland currents. Space Weather 15, 352–373. doi: 10.1002/2016SW001529
Angelopoulos, V., Sibeck, D., Carlson, C. W., McFadden, J. P., Larson, D., Lin, R. P., et al. (2009). First Results From the THEMIS Mission. New York, NY: Springer, 453–476.
Boyle, C. B., Reiff, P. H., and Hairston, M. R. (1997). Empirical polar cap potentials. J. Geophys. Res. Space Phys. 102, 111–125. doi: 10.1029/96JA01742
Brand, A., Allen, L., Altman, M., Hlava, M., and Scott, J. (2015). Beyond authorship: attribution, contribution, collaboration, and credit. Learn. Publ. 28, 151–155. doi: 10.1087/20150211
Burch, J. L., and Phan, T. D. (2016). Magnetic reconnection at the dayside magnetopause: advances with MMS. Geophys. Res. Lett. 43, 8327–8338. doi: 10.1002/2016GL069787
Burke, W. J., Weimer, D. R., and Maynard, N. C. (1999). Geoeffective interplanetary scale sizes derived from regression analysis of polar cap potentials. J. Geophys. Res. Space Phys. 104, 9989–9994. doi: 10.1029/1999JA900031
Burleigh, M., Mukhopadhyay, A., Welling, D., Ridley, A., and Liemohn, M. (2019). “The importance of self-consistent conductivity in coupling magnetosphere-ionosphere-thermosphere models,” in AGU Fall Meeting Abstracts (San Francsico, CA), Vol. 2019, SA41B–3168.
Cash, M., Singer, H., Millward, G., Toth, G., Welling, D., and Balch, C. (2018). “NOAA SWPC's operational geospace model performance during earth-affecting events,” in 42nd COSPAR Scientific Assembly (Pasadena, CA), Vol. 42, 37–18.
Collado-Vega, Y., Rastaetter, L., Khurana, S., Sibeck, D., and Anastopulos, M. (2019). “Magnetospheric science - global simulations: capabilities and limitations,” in AGU Fall Meeting Abstracts (San Francsico, CA), Vol. 2019, SM23D–3229.
Connor, H. K., Zesta, E., Fedrizzi, M., Shi, Y., Raeder, J., Codrescu, M. V., et al. (2016). Modeling the ionosphere-thermosphere response to a geomagnetic storm using physics-based magnetospheric energy input: openGGCM-CTIM results. J. Space Weather Space Clim. 6:A25. doi: 10.1051/swsc/2016019
Cramer, W. D., Raeder, J., Toffoletto, F. R., Gilson, M., and Hu, B. (2017). Plasma sheet injections into the inner magnetosphere: two-way coupled OpenGGCM-RCM model results. J. Geophys. Res. Space Phys. 122, 5077–5091. doi: 10.1002/2017JA024104
De Zeeuw, D. L., Sazykin, S., Wolf, R. A., Gombosi, T. I., Ridley, A. J., and Tóth, G. (2004). Coupling of a global MHD code and an inner magnetospheric model: initial results. J. Geophys. Res. Space Phys. 109, 1–14. doi: 10.1029/2003JA010366
Elsen, R. K., and Winglee, R. M. (1997). The average shape of the magnetopause: a comparison of three-dimensional global mhd and empirical models. J. Geophys. Res. Space Phys. 102, 4799–4819. doi: 10.1029/96JA03518
Fairfield, D. H. (1971). Average and unusual locations of the earth's magnetopause and bow shock. J. Geophys. Res. 76, 6700–6716. doi: 10.1029/JA076i028p06700
Fedder, J. A., Slinker, S. P., Lyon, J. G., and Elphinstone, R. D. (1995). Global numerical simulation of the growth phase and the expansion onset for a substorm observed by Viking. J. Geophys. Res. 100:19083. doi: 10.1029/95JA01524
Gao, Y. (2012). Comparing the cross polar cap potentials measured by SuperDARN and AMIE during saturation intervals. J. Geophys. Res., 117:A08325. doi: 10.1029/2012JA017690
Glocer, A., Fok, M., Meng, X., Toth, G., Buzulukova, N., Chen, S., et al. (2013). CRCM + BATS-R-US two-way coupling. J. Geophys. Res. Space Phys. 118, 1635–1650. doi: 10.1002/jgra.50221
Glocer, A., Rastätter, L., Kuznetsova, M., Pulkkinen, A., Singer, H. J., Balch, C., et al. (2016). Community-wide validation of geospace model local k-index predictions to support model transition to operations. Space Weather 14, 469–480. doi: 10.1002/2016SW001387
Gombosi, T. I. (1998). Physics of the Space Environment. Cambridge: Cambridge Atmospheric and Space Science Series; Cambridge University Press.
Goodman, M. L. (1995). A three-dimensional, iterative mapping procedure for the implementation of an ionosphere-magnetosphere anisotropic Ohm's law boundary condition in global magnetohydrodynamic simulations. Ann. Geophys. 13, 843–853. doi: 10.1007/s00585-995-0843-z
Haiducek, J. D., Welling, D. T., Ganushkina, N. Y., Morley, S. K., and Ozturk, D. S. (2017). SWMF global magnetosphere simulations of january 2005: geomagnetic indices and cross-polar cap potential. Space Weather 15, 1567–1587. doi: 10.1002/2017SW001695
Hairston, M. R., and Heelis, R. A. (1996). Analysis of Ionospheric Parameters Based on Dmsp Ssies Data Using the Dbase4 and Nadia Programs. Technical report, TEXAS UNIV AT DALLAS RICHARDSON CENTER FOR SPACE SCIENCES.
Honkonen, I., Rastätter, L., Grocott, A., Pulkkinen, A., Palmroth, M., Raeder, J., et al. (2013). On the performance of global magnetohydrodynamic models in the Earth's magnetosphere. Space Weather 11, 313–326. doi: 10.1002/swe.20055
Khachikjan, G. Y., Koustov, A. V., and Sofko, G. J. (2008). Dependence of SuperDARN cross polar cap potential upon the solar wind electric field and magnetopause subsolar distance. J. Geophys. Res. 113:A09214. doi: 10.1029/2008JA013107
Kihn, E. A., Redmon, R., Ridley, A. J., and Hairston, M. R. (2006). A statistical comparison of the AMIE derived and DMSP-SSIES observed high-latitude ionospheric electric field. J. Geophys. Res. 111:A08303. doi: 10.1029/2005JA011310
Kihn, E. A., and Ridley, A. J. (2005). A statistical analysis of the assimilative mapping of ionospheric electrodynamics auroral specification. J. Geophys. Res. 110:A07305. doi: 10.1029/2003JA010371
Kivelson, M., and Russell, C. (1995). Introduction to Space Physics. Nwe York, NY: Cambridge University Press.
Kuznetsov, S. N., and Suvorova, A. V. (1998). An Empirical Model of the Magnetopause for Broad Ranges of Solar Wind Pressure and BZ IMF. Dordrecht: Springer, 51–61.
Liemohn, M. W., Ganushkina, N. Y., De Zeeuw, D. L., Rastaetter, L., Kuznetsova, M., Welling, D. T., et al. (2018). Real-time swmf at ccmc: assessing the dst output from continuous operational simulations. Space Weather 16, 1583–1603. doi: 10.1029/2018SW001953
Liemohn, M. W., and Ridley, A. J. (2002). Comment on “Nonlinear response of the polar ionosphere to large values of the interplanetary electric field”? by C. T. Russell et al. J. Geophys. Res. Space Phys. 107, SIA13–1–SIA13–4. doi: 10.1029/2002JA009440
Liemohn, M. W., Shane, A. D., Azari, A. R., Petersen, A. K., Swiger, B. M., and Mukhopadhyay, A. (2021). RMSE is not enough: Guidelines to robust data-model comparisons for magnetospheric physics. J. Atmos. Solar Terrestr. Phys. 218:105624. doi: 10.1016/j.jastp.2021.105624
Lin, R. L., Zhang, X. X., Liu, S. Q., Wang, Y. L., and Gong, J. C. (2010). A three-dimensional asymmetric magnetopause model. J. Geophys. Res. 115:A04207. doi: 10.1029/2009JA014235
Liu, Z.-Q., Lu, J. Y., Wang, C., Kabin, K., Zhao, J. S., Wang, M., et al. (2015). A three-dimensional high mach number asymmetric magnetopause model from global mhd simulation. J. Geophys. Res. Space Phys. 120, 5645–5666. doi: 10.1002/2014JA020961
Lyon, J. G., Fedder, J. A., and Mobarry, C. M. (2004). The Lyon–Fedder–Mobarry (LFM) global MHD magnetospheric simulation code. J. Atmos. Solar Terres. Phys. 66, 1333–1350. doi: 10.1016/j.jastp.2004.03.020
Merkin, V. G., Milikh, G., Papadopoulos, K., Lyon, J., Dimant, Y. S., Sharma, A. S., et al. (2005a). Effect of anomalous electron heating on the transpolar potential in the LFM global MHD model. Geophys. Res. Lett. 32:L22101. doi: 10.1029/2005GL023315
Merkin, V. G., Sharma, A. S., Papadopoulos, K., Milikh, G., Lyon, J., and Goodrich, C. (2005b). Global MHD simulations of the strongly driven magnetosphere: modeling of the transpolar potential saturation. J. Geophys. Res. 110:A09203. doi: 10.1029/2004JA010993
Merkine, V. G., Papadopoulos, K., Milikh, G., Sharma, A. S., Shao, X., Lyon, J., et al. (2003). Effects of the solar wind electric field and ionospheric conductance on the cross polar cap potential: Results of global MHD modeling. Geophys. Res. Lett. 30:2180. doi: 10.1029/2003GL017903
Miyoshi, Y. S., Jordanova, V. K., Morioka, A., Thomsen, M. F., Reeves, G. D., Evans, D. S., et al. (2006). Observations and modeling of energetic electron dynamics during the October 2001 storm. J. Geophys. Res. 111:A11S02. doi: 10.1029/2005JA011351
Morley, S. K., Brito, T. V., and Welling, D. T. (2018). Measures of model performance based on the log accuracy ratio. Space Weather 16, 69–88. doi: 10.1002/2017SW001669
Mukhopadhyay, A. (2020). Dataset Containing Global Modeling Results Comparing Magnetopause Distances and CPCP [Data set]. University of Michigan - Deep Blue. doi: 10.7302/arg3-x036
Mukhopadhyay, A., Welling, D., Burleigh, M., Ridley, A., Liemohn, M., Anderson, B., and Gjerloev, J. (2019). “Conductance in the Aurora: influence of magnetospheric contributors,” in AGU Fall Meeting Abstracts (San Francisco, CA), Vol. 2019, SA41B–3169.
Mukhopadhyay, A., Welling, D., Liemohn, M., Zou, S., and Ridley, A. (2018). “Challenges in space weather prediction: estimation of auroral conductance,” in AGU Fall Meeting Abstracts (Washington, DC), Vol. 2018, SA33B–3462.
Mukhopadhyay, A., Welling, D. T., Liemohn, M. W., Ridley, A. J., Chakraborty, S., and Anderson, B. J. (2020). Conductance model for extreme events : impact of auroral conductance on space weather forecasts. Space Weather 19:e2020SW002551. doi: 10.1002/essoar.10503207.2
Öztürk, D. S., Garcia-Sage, K., and Connor, H. K. (2020). “All hands on deck for ionospheric modeling,” in Eos, 101.
Pembroke, A., Toffoletto, F., Sazykin, S., Wiltberger, M., Lyon, J., Merkin, V., et al. (2012). Initial results from a dynamic coupled magnetosphere-ionosphere-ring current model. J. Geophys. Res. 117:A02211. doi: 10.1029/2011JA016979
Petrinec, S. M., and Russell, C. T. (1993). An empirical model of the size and shape of the near-Earth magnetotail. Geophys. Res. Lett. 20, 2695–2698. doi: 10.1029/93GL02847
Petrinec, S. M., and Russell, C. T. (1996). Near-Earth magnetotail shape and size as determined from the magnetopause flaring angle. J. Geophys. Res. Space Phys. 101, 137–152. doi: 10.1029/95JA02834
Powell, K. G., Roe, P. L., Linde, T. J., Gombosi, T. I., and Zeeuw, D. L. D. (1999). A solution-adaptive upwind scheme for ideal magnetohydrodynamics. J. Comput. Phys. 154, 284–309. doi: 10.1006/jcph.1999.6299
Pulkkinen, A., Kuznetsova, M., Ridley, A., Raeder, J., Vapirev, A., Weimer, D., et al. (2011). Geospace environment modeling 2008-2009 challenge: ground magnetic field perturbations. Space Weather 9:S02004. doi: 10.1029/2010SW000600
Pulkkinen, A., Rastätter, L., Kuznetsova, M., Singer, H., Balch, C., Weimer, D., et al. (2013). Community-wide validation of geospace model ground magnetic field perturbation predictions to support model transition to operations. Space Weather 11, 369–385. doi: 10.1002/swe.20056
Raeder, J., Larson, D., Li, W., Kepko, E. L., and Fuller-Rowell, T. (2008). OpenGGCM simulations for the THEMIS mission. Space Sci. Rev. 141, 535–555. doi: 10.1007/s11214-008-9421-5
Raeder, J., McPherron, R. L., Frank, L. A., Kokubun, S., Lu, G., Mukai, T., et al. (2001). Global simulation of the Geospace Environment Modeling substorm challenge event. J. Geophys. Res. Space Phys. 106, 381–395. doi: 10.1029/2000JA000605
Rastätter, L., Kuznetsova, M. M., Vapirev, A., Ridley, A., Wiltberger, M., Pulkkinen, A., et al. (2011). Geospace environment modeling 2008–2009 challenge: geosynchronous magnetic field. Space Weather 9:S04005. doi: 10.1029/2010SW000617
Reiff, P. H., Spiro, R. W., and Hill, T. W. (1981). Dependence of polar cap potential drop on interplanetary parameters. J. Geophys. Res. Space Phys. 86, 7639–7648. doi: 10.1029/JA086iA09p07639
Richmond, A. D., and Kamide, Y. (1988). Mapping electrodynamic features of the high-latitude ionosphere from localized observations - Technique. J. Geophys. Res. 93, 5741–5759. doi: 10.1029/JA093iA06p05741
Ridley, A. J. (2005). A new formulation for the ionospheric cross polar cap potential including saturation effects. Ann. Geophys. 23, 3533–3547. doi: 10.5194/angeo-23-3533-2005
Ridley, A. J., Gombosi, T. I., and De Zeeuw, D. L. (2004). Ionospheric control of the magnetosphere: conductance. Ann. Geophys. 22, 567–584. doi: 10.5194/angeo-22-567-2004
Ridley, A. J., Gombosi, T. I., Sokolov, I. V., Tóth, G., and Welling, D. T. (2010). Numerical considerations in simulating the global magnetosphere. Ann. Geophys. 28, 1589–1614. doi: 10.5194/angeo-28-1589-2010
Ridley, A. J., and Kihn, E. A. (2004). Polar cap index comparisons with AMIE cross polar cap potential, electric field, and polar cap area. Geophys. Res. Lett. 31:L07801. doi: 10.1029/2003GL019113
Ridley, A. J., and Liemohn, M. W. (2002). A model-derived storm time asymmetric ring current driven electric field description. J. Geophys. Res. Space Phys. 107, SMP2–1–SMP2–12. doi: 10.1029/2001JA000051
Ruohoniemi, J. M., and Baker, K. B. (1998). Large-scale imaging of high-latitude convection with Super Dual Auroral Radar Network HF radar observations. J. Geophys. Res. Space Phys. 103, 20797–20811. doi: 10.1029/98JA01288
Russell, C. T., Luhmann, J. G., and Lu, G. (2001). Nonlinear response of the polar ionosphere to large values of the interplanetary electric field. J. Geophys. Res. Space Phys. 106, 18495–18504. doi: 10.1029/2001JA900053
Samsonov, A. A., Gordeev, E., Tsyganenko, N. A., Šafránková, J., Němeček, Z., Šimánek, J., et al. (2016). Do we know the actual magnetopause position for typical solar wind conditions? J. Geophys. Res. Space Phys. 121, 6493–6508. doi: 10.1002/2016JA022471
Shue, J.-H., Chao, J. K., Fu, H. C., Russell, C. T., Song, P., Khurana, K. K., et al. (1997). A new functional form to study the solar wind control of the magnetopause size and shape. J. Geophys. Res. Space Phys. 102, 9497–9511. doi: 10.1029/97JA00196
Shue, J.-H., Song, P., Russell, C. T., Steinberg, J. T., Chao, J. K., Zastenker, G., et al. (1998). Magnetopause location under extreme solar wind conditions. J. Geophys. Res. Space Phys. 103, 17691–17700. doi: 10.1029/98JA01103
Siscoe, G. L., Crooker, N. U., and Siebert, K. D. (2002a). Transpolar potential saturation: roles of region 1 current system and solar wind ram pressure. J. Geophys. Res. 107:1321. doi: 10.1029/2001JA009176
Siscoe, G. L., Erickson, G. M., Sonnerup, B. U. Ö., Maynard, N. C., Schoendorf, J. A., Siebert, K. D., et al. (2002b). Hill model of transpolar potential saturation: comparisons with MHD simulations. J. Geophys. Res. 107:1075. doi: 10.1029/2001JA000109
Staples, F. A., Rae, I. J., Forsyth, C., Smith, A. R. A., Murphy, K. R., Raymer, K. M., et al. (2020). Do statistical models capture the dynamics of the magnetopause during sudden magnetospheric compressions? J. Geophys. Res. Space Phys. 125:e2019JA027289. doi: 10.5194/egusphere-egu2020-21977
Tóth, G., Sokolov, I. V., Gombosi, T. I., Chesney, D. R., Clauer, C. R., De Zeeuw, D. L., et al. (2005). Space weather modeling framework: a new tool for the space science community. J. Geophys. Res. 110:A12226. doi: 10.1029/2005JA011126
Tóth, G., van der Holst, B., Sokolov, I. V., De Zeeuw, D. L., Gombosi, T. I., Fang, F., et al. (2012). Adaptive numerical algorithms in space weather modeling. J. Comput. Phys. 231, 870–903. doi: 10.1016/j.jcp.2011.02.006
Troshichev, O., Hayakawa, H., Matsuoka, A., Mukai, T., and Tsuruda, K. (1996). Cross polar cap diameter and voltage as a function of PC index and interplanetary quantities. J. Geophys. Res. Space Phys. 101, 13429–13435. doi: 10.1029/95JA03672
Welling, D., Dimmock, A., Rosenqvist, L., Morley, S., and Yordanova, E. (2019). “Resolving small scale GIC effects: what is our capability?,” in AGU Fall Meeting Abstracts (San Francisco, CA), Vol. 2019, SH32B–05.
Welling, D. T., Anderson, B. J., Crowley, G., Pulkkinen, A. A., and Rastätter, L. (2017). Exploring predictive performance: a reanalysis of the geospace model transition challenge. Space Weather 15, 192–203. doi: 10.1002/2016SW001505
Welling, D. T., Love, J. J., Rigler, E. J., Oliveira, D. M., Komar, C. M., and Morley, S. K. (2021). Numerical simulations of the geospace response to the arrival of an idealized perfect interplanetary coronal mass ejection. Space Weather. 19:e2020SW002489. doi: 10.1029/2020SW002489
Welling, D. T., Ngwira, C. M., Opgenoorth, H., Haiducek, J. D., Savani, N. P., Morley, S. K., et al. (2018). Recommendations for next-generation ground magnetic perturbation validation. Space Weather 16, 1912–1920. doi: 10.1029/2018SW002064
Wiltberger, M., Rigler, E. J., Merkin, V., and Lyon, J. G. (2017). Structure of high latitude currents in magnetosphere-ionosphere models. Space Sci. Rev. 206, 575–598. doi: 10.1007/s11214-016-0271-2
Wiltberger, M., Weigel, R. S., Lotko, W., and Fedder, J. A. (2001). Modeling seasonal variations of auroral particle precipitation in a global-scale magnetosphere-ionosphere simulation. J. Geophys. Res. Space Phys. 114, 381–395. doi: 10.1029/2008JA013108
Wolf, R. A., Harel, M., Spiro, R. W., Voigt, G.-H., Reiff, P. H., and Chen, C.-K. (1982). Computer simulation of inner magnetospheric dynamics for the magnetic storm of July 29, 1977. J. Geophys. Res. 87:5949. doi: 10.1029/JA087iA08p05949
Keywords: ionospheric potential, magnetopause standoff distance, global MHD modeling, space weather, model validation and analysis, NASA CCMC
Citation: Mukhopadhyay A, Jia X, Welling DT and Liemohn MW (2021) Global Magnetohydrodynamic Simulations: Performance Quantification of Magnetopause Distances and Convection Potential Predictions. Front. Astron. Space Sci. 8:637197. doi: 10.3389/fspas.2021.637197
Received: 02 December 2020; Accepted: 12 March 2021;
Published: 21 April 2021.
Edited by:
Rumi Nakamura, Austrian Academy of Sciences, AustriaReviewed by:
Nickolay Ivchenko, Royal Institute of Technology, SwedenCopyright © 2021 Mukhopadhyay, Jia, Welling and Liemohn. This is an open-access article distributed under the terms of the Creative Commons Attribution License (CC BY). The use, distribution or reproduction in other forums is permitted, provided the original author(s) and the copyright owner(s) are credited and that the original publication in this journal is cited, in accordance with accepted academic practice. No use, distribution or reproduction is permitted which does not comply with these terms.
*Correspondence: Agnit Mukhopadhyay, YWduaXRtQHVtaWNoLmVkdQ==
Disclaimer: All claims expressed in this article are solely those of the authors and do not necessarily represent those of their affiliated organizations, or those of the publisher, the editors and the reviewers. Any product that may be evaluated in this article or claim that may be made by its manufacturer is not guaranteed or endorsed by the publisher.
Research integrity at Frontiers
Learn more about the work of our research integrity team to safeguard the quality of each article we publish.