
94% of researchers rate our articles as excellent or good
Learn more about the work of our research integrity team to safeguard the quality of each article we publish.
Find out more
ORIGINAL RESEARCH article
Front. Astron. Space Sci., 10 March 2021
Sec. Space Physics
Volume 7 - 2020 | https://doi.org/10.3389/fspas.2020.600031
This article is part of the Research TopicCoupled Feedback Mechanisms in the Magnetosphere-Ionosphere SystemView all 25 articles
 Tadhg M. Garton1*
 Caitriona M. Jackman1,2
 Andrew W. Smith3
 Kiley L. Yeakel4
 Shane A. Maloney2
 Jon Vandegriff4
The products of magnetic reconnection in Saturn’s magnetotail are identified in magnetometer observations primarily through characteristic deviations in the north–south component of the magnetic field. These magnetic deflections are caused by traveling plasma structures created during reconnection rapidly passing over the observing spacecraft. Identification of these signatures have long been performed by eye, and more recently through semi-automated methods, however these methods are often limited through a required human verification step. Here, we present a fully automated, supervised learning, feed forward neural network model to identify evidence of reconnection in the Kronian magnetosphere with the three magnetic field components observed by the Cassini spacecraft in Kronocentric radial–theta–phi coordinates as input. This model is constructed from a catalog of reconnection events which covers three years of observations with a total of 2093 classified events, categorized into plasmoids, traveling compression regions and dipolarizations. This neural network model is capable of rapidly identifying reconnection events in large time-span Cassini datasets, tested against the full year 2010 with a high level of accuracy (87%), true skill score (0.76), and Heidke skill score (0.73). From this model, a full cataloging and examination of magnetic reconnection events in the Kronian magnetosphere across Cassini's near Saturn lifetime is now possible.
Magnetic reconnection is the primary process whereby magnetic fields under strain can reconfigure and energy within their structure can transfer. On the dayside, incoming plasma and magnetic fields can reconnect, opening previously closed planetary magnetic field lines. At planets like Earth, day-side (between 6 and 18 local time) reconnection is considered to play a primary role in energy and mass transportation between a planet's magnetic field and the interplanetary magnetic field (Milan et al., 2007). Similarly, on the night-side (0–6 and 18–24 local time), open planetary magnetic field lines become distended in an extended planetary magnetotail, within which field lines may reconnect to again form closed field lines (Dungey, 1961; Dungey, 1965). This cyclic transition between open and closed field configurations allows the transfer of mass, both in and out, of the planetary magnetosphere system. Alternatively, reconnection can further occur for rapidly rotating planets which involves no change in overall magnetic flux. For example, at Jupiter and Saturn fast rotation rates and significant internal mass sources result in the operation of the Vasyliunas cycle. In this cycle mass is lost down the magnetotail through the reconnection of centrifugally stretched, mass loaded field lines (Vasyliunas, 1983).
On a global scale reconnection can facilitate an energy balance, dynamic equilibrium between the planetary field and the interplanetary field, and serve as a way to balance the mass budget for magnetospheres where there is a significant amount of internal plasma loading, e.g., from volcanic moons. However, on a small scale it produces local fluctuations of energy and unstable closed magnetic field systems of plasma. These small scale products can be identified by in-situ spacecraft through measurements of magnetic field topology and changes in plasma flow. For this study, focus will be on reconnection signatures at Saturn, as identified from the Cassini magnetometer and now classified through machine learning. Reconnection for Saturn has long focused on the planetary magnetotail whereby two types of reconnection signatures are typically reported: dipolarizations and plasmoid ejections. Dipolarizations occur on the planetside of the reconnection site where previously stretched magnetic field lines relax, under a reconnection event, to a more dipole-like magnetic field (Bunce et al., 2005; Russell et al., 2008; Jackman et al., 2013; Jackman et al., 2015; Yao et al., 2017; Smith et al., 2018a; Smith et al., 2018b). On the tailside of the reconnection site, closed magnetic field systems encompassing a trapped bubble of plasma known as plasmoids are created during reconnection, which are rapidly ejected down-tail. These events were first identified in Earth's magnetosphere (Hones, 1977), but have since been identified in Saturn's magnetosphere (Jackman et al., 2007; Hill et al., 2008). Observations of these reconnection related structures can be further identified indirectly in magnetic field measurements in the adjacent magnetotail lobes through compressions in the magnetic field. These features are known as traveling compression regions (TCRs; Slavin et al. (1984)) due to their close following of plasmoid and dipolarization features. Notably, this indirect method of identification gives no insight to the internal structure of the plasmoid but do at least indicate reconnection occurring and hence can be used to estimate reconnection rates.
Typically signatures of reconnection may be identified by a rapid deflection in the north-south magnetic field component, as observed in Figure 1. At Saturn, plasmoids moving are expected to exhibit a south to north deflection and vice versa (north to south deflection) for planetward-moving dipolarizations. For plasmoids in particular, it is important to recognize the true velocity of the signature may have some azimuthal/corotational component following release (McAndrews et al., 2009; Thomsen et al., 2013; Neupane et al., 2019; Kane et al., 2020). The nature and magnitude of magnetic field deflection depends not only on the intensity of incoming reconnection event, but also on the orientation and direction of travel of the observing spacecraft through this region (Cowley et al., 2015). Spacecraft traveling through the center of reconnection signatures observe stronger deviations from the background north–south component of magnetic field, and vice versa. Without a priori knowledge of reconnection, these signatures are the principal identifiable feature in magnetic field data, and any deviation in north-south field component present a potential indication of magnetic reconnection. Notably, this is not a definitive method of classification as random turbulent motion in the magnetosphere or waves in the plasma sheet can reproduce similar signatures in the magnetic field observations (Nakagawa and Nishida, 1989; Jackman et al., 2009; Martin and Arridge, 2017).
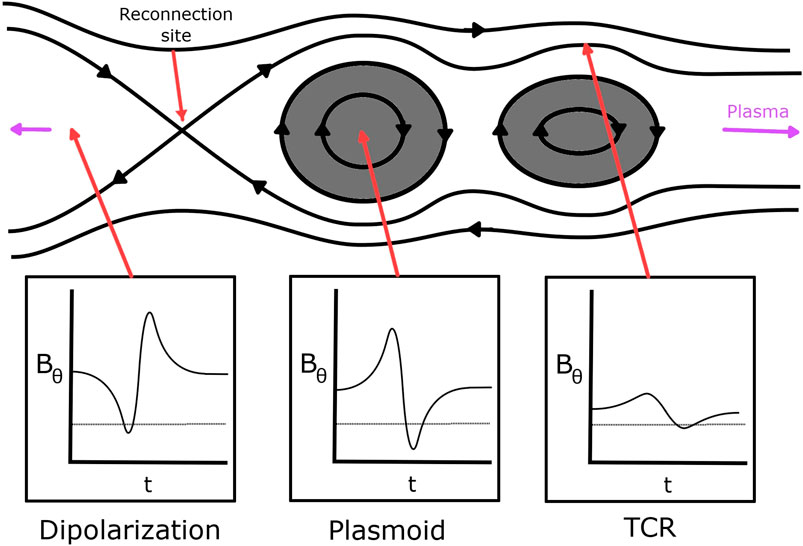
FIGURE 1. Model north-south magnetic field (
Only recently has there been sufficient data to catalog and identify large numbers of reconnection events in Saturn's magnetosphere. During 2006 the Cassini spacecraft executed a series of tail orbits to a maximum downtail distance of 68
Here, we apply established methods of machine learning (ML) to planetary magnetospheric reconnection classification to expand these previous surveys to spatially cover the entire Kronian magnetosphere and temporally cover all of Cassini’s near Saturn lifetime. ML is an application of artificial intelligence that allows computers the ability to learn from large datasets and experience without being explicitly programmed. This method aides in the prevention of biases and limitations that would otherwise be imposed by a human created model, such as event size and spatial constraints. Furthermore, these models perform well at identifying underlying structures that humans otherwise would not, or could not, that are essential for classification and can be extrapolated to identify features in previously unobserved datasets and have already been implemented across the field of astrophysics to solve a variety of problems (Ruhunusiri, 2018; Ruhunusiri et al., 2018; Waldmann and Griffith, 2019).
The datasets used in this study are magnetic field component measurements as observed by the Cassini magnetometer (MAG; Dougherty et al., 2004) instrument. Cassini was launched onboard a Titan IV rocket in 1997 and following Saturn Orbit Insertion in July 2004, it orbited the planet until 2017. During its lifetime it observed a variety of environments within the Kronian magnetosphere which can be used to gain a greater understanding of Saturn's magnetic processes. For this research, Kronocentric radial, theta, phi (KRTP) coordinates are used as this coordinate system has been shown to be useful in distinguishing reconnection related events from turbulent motion in the hinged current sheet (Jackman et al., 2009). In this spherical coordinate system the radial component (
Figure 2 illustrates the near-Saturn lifetime trajectory of Cassini in Kronocentric solar magnetospheric coordinates. This Cartesian coordinate system is oriented such that the x axis points toward the Sun, the x–z plane contains the planetary dipole axis, and the y component completes the right-handed set. The trajectories of Cassini during the Smith et al. observing window is highlighted in red for comparison. The full 13 years dataset shows the various magnetic environments about Saturn that the Cassini satellite has explored. Similarly, the trajectories during the highlighted observations cover much of these varied environments, however are focused primarily on longer observation times of Saturn's magnetotail within the equatorial plane. Furthermore, this observing window covered times when Saturn's night-side current sheet was hinged upward (southern hemisphere summer), was parallel to the equatorial plane (e.g., equinox; Khurana et al., 2009), or even hinged downward (northern hemisphere summer) later in the mission (Arridge et al., 2011). By allowing for identification across the entire Cassini lifetime, more accurate statistical investigations can be performed on reconnection occurrence across the entire morphology of Saturn's magnetosphere.
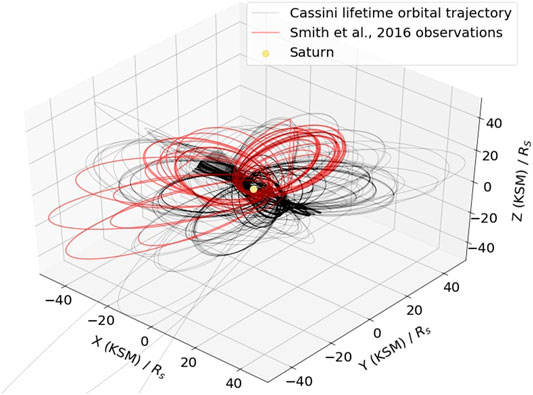
FIGURE 2. Lifetime trajectory (black) of Cassini around Saturn (yellow). The Cassini trajectories during the observing window employed in the creation of the Smith et al. (2016) catalog of magnetic reconnection are highlighted in red for comparison. For the creation of a machine learning training set, observations of events are taken from the Smith catalog and null events are randomly taken from a variety of local times and radial distances during the Smith catalog observing window.
For the construction of a supervised ML model, a previous, labeled database is required for the model to learn the parametric identifiers of the magnetic reconnection class, and to test against to validate the model's accuracy. The Smith et al. (2016) catalog (hereafter S16) of reconnection is selected as this classified dataset due to its large number of samples, variety of orbital trajectories sampled, and its final human based verification step. However, to utilize this catalog, the limitations of its selection criteria must be understood. This catalog was constructed from a semi-automated model with many hard-coded limitations. Excluding the aforementioned temporal limitations of observation window selection, this model further includes spatial and magnetic parametric limitations. Spatially, this model is defined within a ’viewing region’ where events are strictly only identified within the night-side, at distances greater than 15 RS from Saturn, and strictly within the magnetosphere. Figure 3 demonstrates the spatial constraints on the S16. This figure illustrates the entire 2010 trajectory of he Cassini instrument seperated into spatial constraints where the S16 could identify reconnection events (blue) and those where identifications are spatially ineligible (red). This catalog has similar magnetic parametric limitations. Primarily events are identified from the background through a quadratic fit to
where
where symbols have their previous meaning. These validation steps are imposed as it is difficult for humans to verify candidates that fall below these parametric limitations due to a signal to noise ratio problem. Through these identification and validation methods, the Smith et al. model identifies 2094 (1083 planetward and 1011 tailward) reconnection signatures within their observation window.
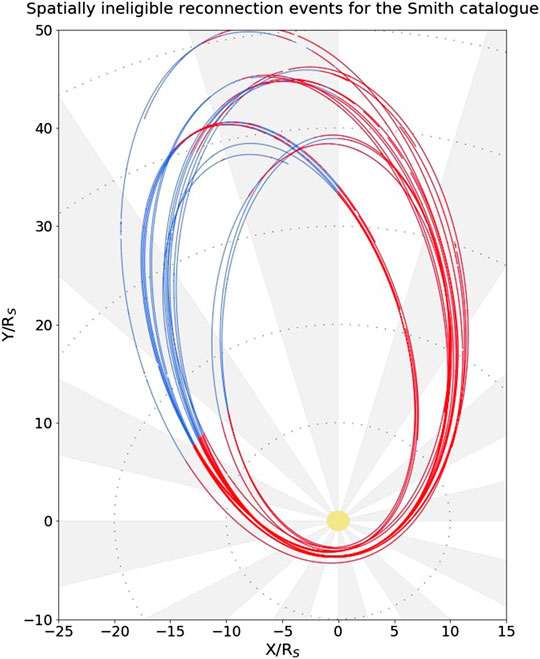
FIGURE 3. 2010 trajectory of Cassini about Saturn (yellow) separated by color into regions where the S16 could identify reconnection events (blue) and the trajectories that were spatially ineligible for identification (red). Notably, at large distances (
These events identify the temporal windows which act as a labeled dataset for a supervised training ML method. However, training of a ML model requires a collection of input parameters, from which the ML model learns the association of parameters to events. For this research, exclusively magnetic observations in the three spatial components of the KRTP coordinate systems are used for identification. This selection is made due to the coverage of Cassini's lifetime that the MAG instrument remained operational. While signatures of planetary reconnection exist in other property observations such as plasma density, MAG data is used as a predominant identifier for human based identifications. Furthermore, the Cassini plasma spectrometer (CAPS; Young et al., 2004) did not remain operational across the entirety of Cassini's near Saturn lifetime, being permanently inactive post-2012, nor did it provide a full 3D picture of the plasma environment, and so may miss any reconnection related jets due to pointing in the ‘wrong’ direction. A model for identifying magnetic reconnection signatures using only magnetic field component data would also ease possible transitions, and transfer learning of a ML model to use with new satellites and for different planetary magnetic fields. Hence, plasma property observations for these reconnection events are not used in this research, however, plasma observations could and should be used in any future implementation where the plasma measurements are comprehensive in both time and 3D viewing. Finally, it is envisioned that the construction of a catalog using this method across the entire Cassini dataset will enable the examination of numerous case studies of reconnection using multiple instruments.
Figure 4 illustrates example magnetic time series across the three KRTP spatial components as well as the total magnetic field,
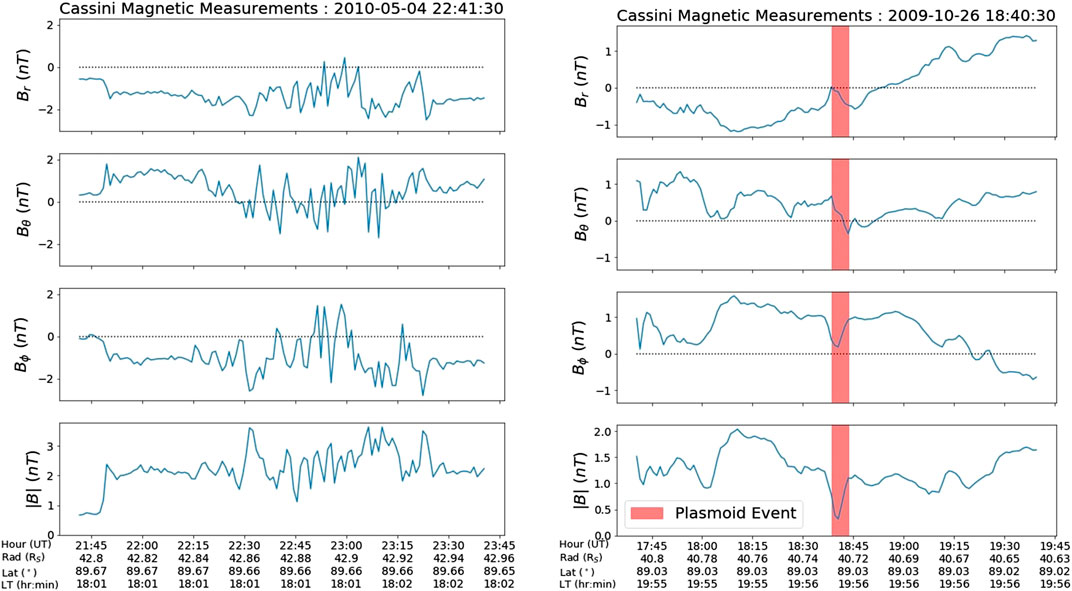
FIGURE 4. Examples of magnetometer data for a non event (left) and event (right) used to train a machine learning algorithm. Titles of these plots denote the time at center of these observing windows in a YYYY-MM-DD format.
The greatest risk for poorly constructed ML identification of relatively rare features is the possibility of a class imbalance (Buda et al., 2017). For this case, magnetic reconnection events are only identified occupying
The issue of a small sample size can be solved through data augmentation, such as data synthesis, or the transformation of already existing data (Mikołajczyk and Grochowski, 2018; Fawaz et al., 2018). Data synthesis is simply the creation of data through the combination of a model with some overlying noise in an attempt to create real-like datasets, however this method can be inaccurate if predictive models are inaccurate, or missing some underlying understanding. Data transformation takes already existing data and applies some kind of transformation, such as adding noise or filters over the existing measurements or translating the data either spatially or temporally. Since the signatures of magnetic reconnection occur across a number of minutes, averaging
A variety of ML models exist, ranging in complexity to allow for identification of more elaborate and subtle features within datasets. This research focuses on identification of features within three singular dimension magnetic field time series, hence, only relatively simple supervised learning ML methods will be investigated, namely: support vector classifier with a linear (LSVC) and non-linear kernel (NLSVC), random forest classifier (RFC), and a simple artificial feed forward neural network (ANN). All of these models are available in the sklearn python packages (Buitinck et al., 2013) and the TensorFlow libraries (Abadi et al., 2015). A LSVC creates a multi-dimensional hyperspace of observed parameters. The labeled data are then input into this hyperspace and a linear hyperplane is created as a decision boundary to optimally separate data of opposing labels with the widest possible margins. This hyperplane seperator is then stored and used to predict the labels of new datasets. A NLSVC behaves similarly to its linear variant, by creating some hyperplane as a decision boundary, however, the kernel function utilized by a NLSVC can non-linearly transform the feature space such that the classes become separable. RFC similarly creates a multi-dimensional hyper space, but instead of separating data by a continuous hyperplane, a vast array of Boolean decision tree networks, of variable depth, are created to segment a training dataset non-linearly. New data sets are then input into this array of decision trees and a classification is judged by majority vote outcome. The final type, ANNs, rely on the creation of input (parameters) and output (labels) neural nodes, interconnected by a collection of initially random weights and biases. This method of ML is optimized through tuning of various hyperparameters such as: the non-linear activation function on each of the nodes, the number of nodes within each layer, the loss and optimization functions, and the number of hidden layers within the architecture. These hidden layers of neural nodes between the input and output nodes have no true observable parameter, however they enable more complex feature identification by the ANN. To judge which of these models is optimal for identification of reconnection signatures, each must be trained and the model that exhibits the highest accuracy can be selected for further fine tuning. It is important to note that model accuracy is not typically the greatest indicator of a model's performance, and many other metrics will be discussed later, however this metric is significant enough to indicate a single ML model that can be best improved, and hence will be further investigated in this research. Table 1 indicates the accuracy for these 4 ML models to identify the signatures of magnetic reconnection using only the three KRTP magnetic field components observed by Cassini for times within the spatial and temporal limitations of the S16. Overfitting of these models was prevented by standard methods of train/test/validation splitting, principle component analysis and algorithm complexity limitations. The train/test/validation split had a weighted random assignment across all years in the S16 catalog with no temporal disjoint. This means the training set was composed of events from 2006, 2009, and 2010 allowing it to learn the structure of reconnection from varied spacecraft orbits and trajectories. However, set assignment was performed on a reconnection event basis, meaning all minutes of observations associated with an individual reconnection event are assigned to a single set. Most notably, ANNs exhibit the highest accuracy rating, likely due to their allowed higher complexity when compared to the other methods mentioned. Hence, ANNs are further utilized for this research.
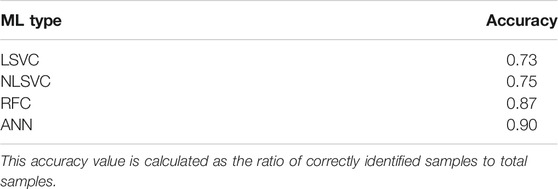
TABLE 1. Comparison of validation set accuracy for ML event classification using a linear support vector classifier (LSVC), a non-linear support vector classifier (NLSVC), a random forrest classifier (RFC), and artificial neural network (ANN).
Figure 5 demonstrates the architecture of a simple ANN created and trained during this research to identify signatures of magnetic reconnection. In this architecture, input properties are directed into the architecture in the input layer. Operations are performed on these parameters between each interconnected layer, with the goal being to accurately recreate the desired outputs in the output layer. ANNs are generally optimized and fine tuned through a process of trial and error, however some simple rules for their creation exist to prevent overfitting of training data. Generally, the number of free parameters must not exceed the number of samples used for training, i.e.,
where
where
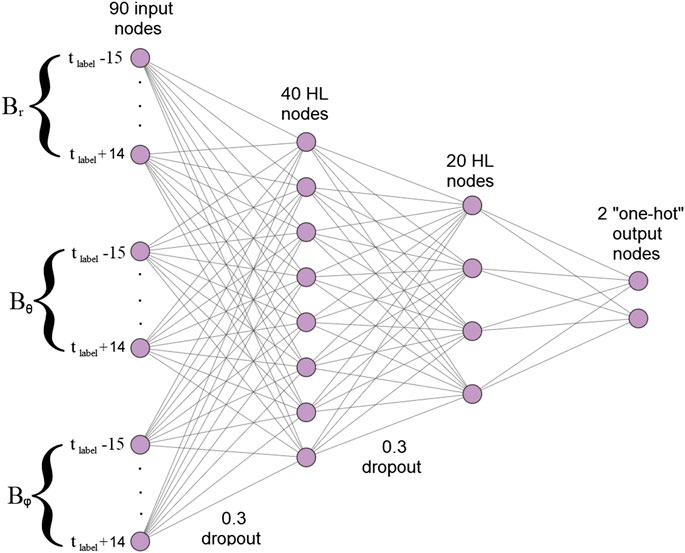
FIGURE 5. NN architecture used to train to identify reconnection signatures in Cassini magnetometer data. This structure shows 90 input nodes composed of three 30 min time windows centered on the label time (
The relative effectiveness of this architecture is displayed in Table 2 through four confusion matrices. A confusion matrix exists for each of the training, test and validation set, and a fourth confusion matrix illustrates the effectiveness of the ANN to identify reconnection events across the entirety of 2010, replicating how the model will perform on large continuous datasets. The year 2010 was selected for this comparison as it is one of two full years which the S16 covered, along with 2006. 2010 was selected between these two years as the trajectory of Cassini for this year included a wider sampling of varied magnetic environments, hence being the most stringent full year comparison possible. It is important to recognize that this 2010 confusion matrix includes identifications from the training, test, and validation datasets. Across each of these confusion matrices an accuracy of

TABLE 2. Confusion matrices for a feed-forward neural network classification of magnetic reconnection within the Kronian magnetosphere
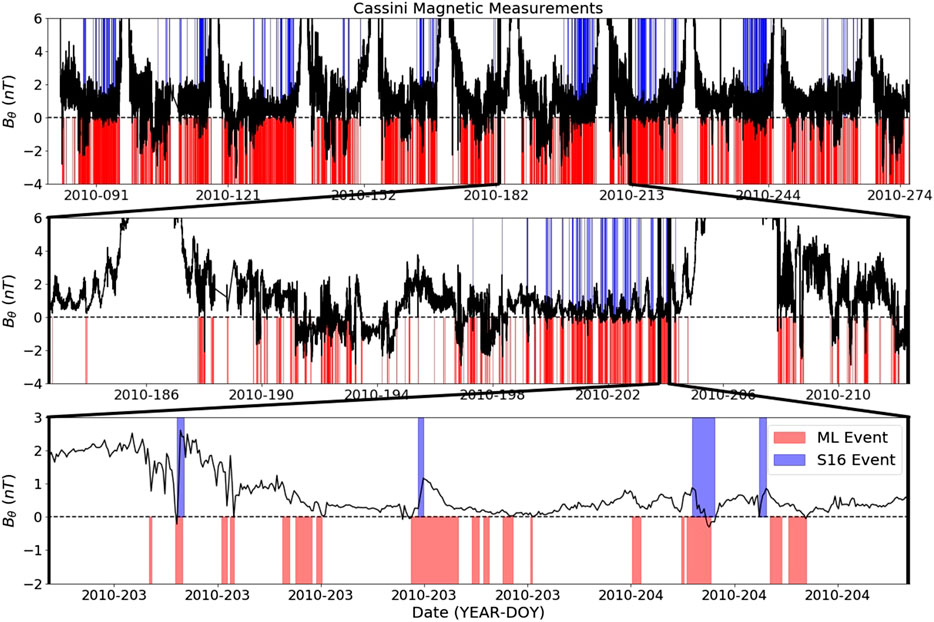
FIGURE 6. Output of reconnection signatures identified by a feed forward neural network (red areas) across half of 2010 compared to identifications from the Smith catalog (blue areas) for the same period. These areas are overplot onto the Bθ component of the magnetic field, where reconnection signatures are easiest identified by eye. Each successive plot examines zoomed in windows to observe finer structure in magnetic field measurements and identifications.
The results and corresponding skill scores from Table 2 would imply a significant bias of the neural network to mis-classify null observations, as classified by the S16 catalog, as events. Investigations into the spatial distribution of events to identify the cause of this large number of mis-classification are illustrated in Figure 7. This figure demonstrates the distribution of total time during the observation window of Smith et al. (2016) (purple) across radial distance, latitude and the Kronian local time. Additionally, the time spent observing reconnection related events as stated by the S16 (blue) and the time spent observing reconnection products as classified by the ANN (gray) are displayed for comparison. Blue percentile values illustrate the percentage of total time of a given distribution spent observing reconnection as found by S16. As is illustrated, the ANN observations have a similar spatial distribution of identifications to the S16, simply the ANN recognizes more minutes of reconnection occurring due to more events being identified. In the local time distribution, all events identified by both S16 and the ANN for 2010 are located on the planetary dusk side due to the orbital trajectory of the Cassini spacecraft at this time, being very close to the planet (
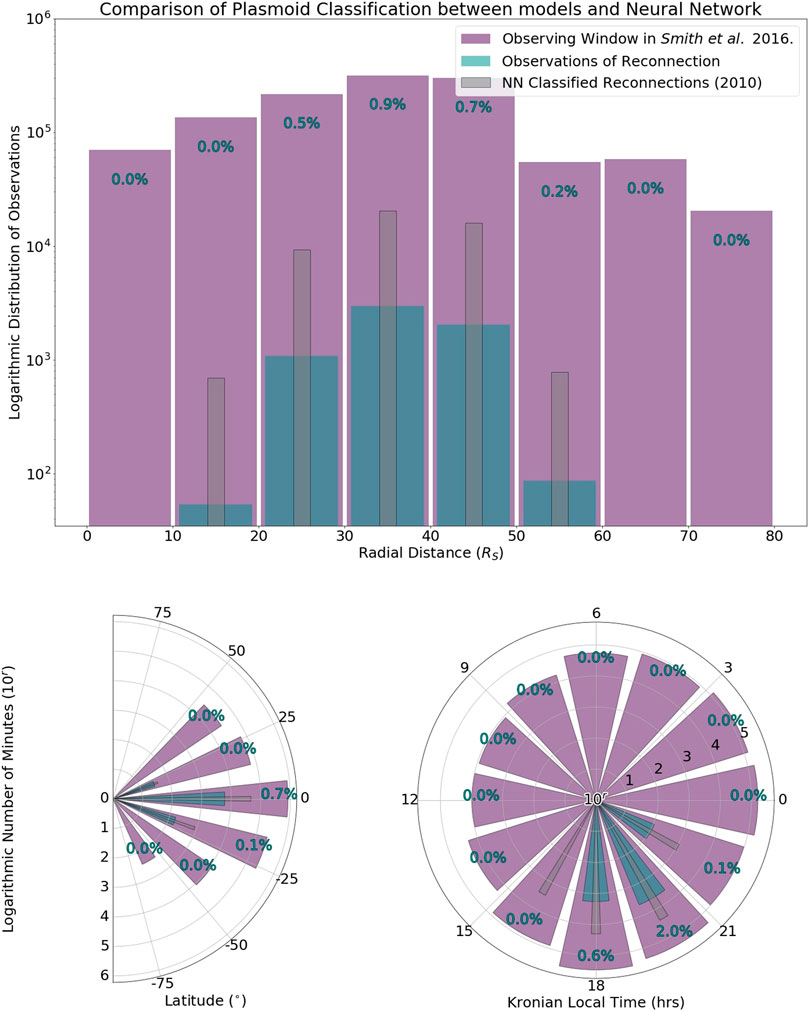
FIGURE 7. Total time of Cassini observations of Saturn's magnetosphere during the 2010 observing window (purple) with radius, latitude and local time respectively. This distribution is compared to the time classified as magnetic reconnection signatures by Smith et al. (blue) and as classified by a neural network method (grey). Percentiles indicate relative time spent near reconnection events as found in the Smith et al. catalog to the total window.
As previously mentioned, the S16 is constructed from numerous hard coded spatial and magnetic limitations within their semi-automatic identification method that significantly limit their identifications. In the ML model, these limitations are not in place, which leads to a substantial number of ML identifications that cannot otherwise be identified by the S16 method, thus leading to our abundance of apparent FPs. Hence, the confusion matrix for 2010 in Table 2 does not accurately compare the results of the neural network to the S16, and it must be corrected. By examining only the neural network reconnection identifications that could be recognized by the S16 (i.e. events with

TABLE 3. Confusion matrices of neural network classification considering only events that the Smith et al. catalog could have identified.
This corrected confusion matrix for eligible 2010 events has a significant increase in accuracy (87.0
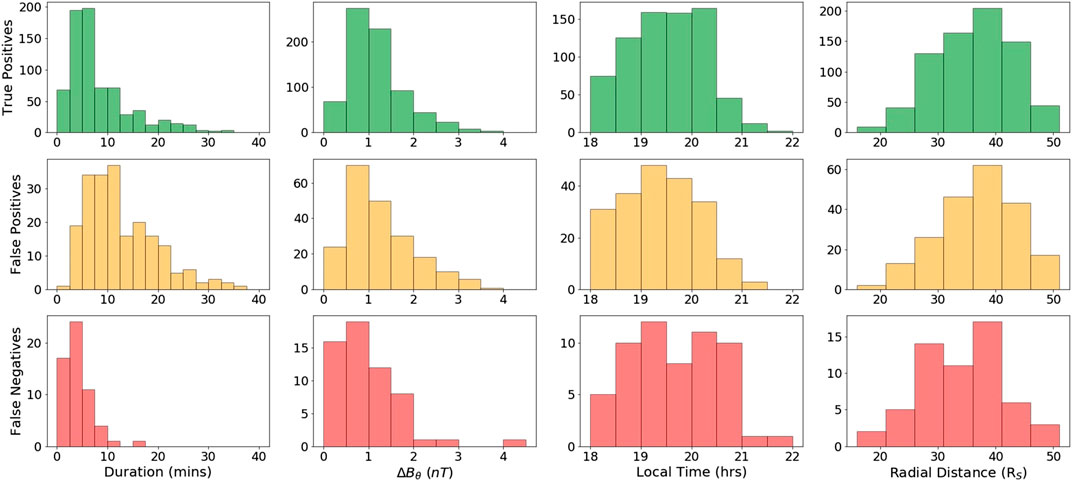
FIGURE 8. Temporal, magnetic and spatial properties of reconnection events that are classified as true positives (green), false positives (orange), and false negatives (red) when comparing the neural network classifications to those of the S16.
Figure 9 displays an epoch analysis for events classified by this NN for both day-side (light blue) and night side detections (dark blue) compared to the events from the S16 (black). These events are compared across 4 criteria: all events for 2010 (top left), all tailward event for 2010 (top right), all event for 2010 that all within the human built thresholds for S16 (bottom right) and all tailward events that fall within this threshold (bottom right). The term tailward here is defined as a reconnection event occurring with a negative slope in the deflection phase
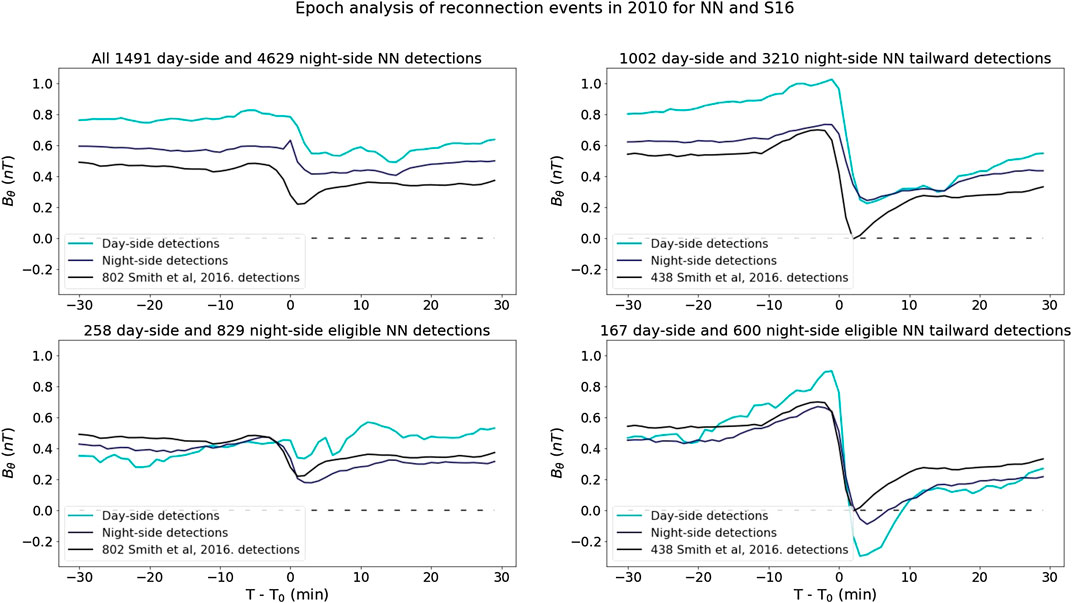
FIGURE 9. Epoch analysis of all 2010 events (top left), tailward events (top right), all 2010 events that meet the S16 criteria (bottom left), and meet the S16 criteria while also being tailward (bottom right) identified by the NN. Identifications are split onto the day-side (light blue) and night-side (dark blue) and are compared to the average of events from the S16 for 2010 (left) and tailward. (right)
Here, the operations and effectiveness of ML approaches to magnetic reconnection identification have been discussed. A new ANN model has been constructed to identify reconnection signatures in Saturn’s magnetosphere through spherical magnetic field measurements with a HSS
Further study is required on events within this catalog to identify statistical properties and spatial likelihood of magnetic reconnection in Saturn's magnetosphere to improve predictive modeling. The 13 years catalog created from this research can be used to identify long-term magnetospheric trends and create a statistical predictive model of reconnection occurence for extreme and rare events. This ANN was constructed using a limited sample of events (
The datasets presented in this study can be found in online repositories. The names of the repository/repositories and accession numbers can be found below: https://zenodo.org/record/3978252#.X0kgADV7nb0.
TG was responsible for development and application of machine learning methods to create a neural network reconnection classifier. CJ sourced datasets and applied physical insights into the model's creation. AS applied physical insights into the model's creation and laid groundwork for its creation. KY validated machine learning methods and applied insight into machine learning theory. SM validated machine learning methods and applied insight into machine learning theory. JV validated machine learning methods and applied physical insights into the model's creation.
TG’s work is supported by the Science and Technology Facilities Council Opportunities Fund Grant ST/T002255/1. CJ’s work at Southampton was supported by the STFC Ernest Rutherford Fellowship ST/L004399/1. AS was supported by STFC Consolidated Grant ST/S000240/1 and NERC Grant NE/P017150/1.
The authors declare that the research was conducted in the absence of any commercial or financial relationships that could be construed as a potential conflict of interest.
Abadi, M., Agarwal, A., Barham, P., Brevdo, E., Chen, Z., Citro, C., et al. (2015). TensorFlow: large-scale machine learning on heterogeneous systems. Software available from tensorflow.org.
Arridge, C. S., André, N., Khurana, K. K., Russell, C. T., Cowley, S. W. H., Provan, G., et al. (2011). Periodic motion of saturn’s nightside plasma sheet. J. Geophys. Res.: Space Physics 116. 14. doi:10.1029/2011JA016827
Azari, A. R., Biersteker, J. B., Dewey, R. M., Doran, G., Forsberg, E. J., Harris, C. D. K., et al. (2020). Integrating machine learning for planetary science: perspectives for the next decade. White Paper Sub. Decad. Surv. Planet. Sci. Astrobiol. 12, 2023–2032. doi:10.1787/9789264028586-en
Bagenal, F., Adriani, A., Allegrini, F., Bolton, S. J., Bonfond, B., Bunce, E. J., et al. (2017). Magnetospheric science objectives of the juno mission. Space Sci. Rev. 213, 219–287. doi:10.1007/s11214-014-0036-8
Bagenal, F., and Delamere, P. A. (2011). Flow of mass and energy in the magnetospheres of jupiter and saturn. J. Geophys. Res.: Space Phys. 116. doi:10.1029/2010JA016294
Buda, M., Maki, A., and Mazurowski, M. A. (2017). A systematic study of the class imbalance problem in convolutional neural networks. Neural Netw. 106, 249–259. doi:10.1016/j.neunet.2018.07.011
Buitinck, L., Louppe, G., Blondel, M., Pedregosa, F., Mueller, A., Grisel, O., et al. (2013). “API design for machine learning software: experiences from the scikit-learn project,” in ECML PKDD workshop: languages for data mining and machine learning, 108–122.
Bunce, E. J., Cowley, S. W. H., Wright, D. M., Coates, A. J., Dougherty, M. K., Krupp, N., et al. (2005). In situ observations of a solar wind compression-induced hot plasma injection in saturn’s tail. Geophys. Res. Lett. 32. 121–127. doi:10.1029/2005GL022888
Burkholder, B., Delamere, P. A., Ma, X., Thomsen, M. F., Wilson, R. J., and Bagenal, F. (2017). Local time asymmetry of saturn’s magnetosheath flows. Geophys. Res. Lett. 44, 5877–5883. doi:10.1002/2017GL073031
Cowley, S. W. H., Nichols, J. D., and Jackman, C. M. (2015). Down-tail mass loss by plasmoids in jupiter’s and saturn’s magnetospheres. J. Geophys. Res.: Space Phys. 120, 6347–6356. doi:10.1002/2015JA021500
Delamere, P. A., Otto, A., Ma, X., Bagenal, F., and Wilson, R. J. (2015). Magnetic flux circulation in the rotationally driven giant magnetospheres. J. Geophys. Res. 120, 4229–4245. doi:10.1002/2015JA021036
Dougherty, M., Kellock, S., Southwood, D., Balogh, A., Smith, E., Tsurutani, B., et al. (2004). The cassini magnetic field investigation. Space Sci. Rev. 114, 331–383. doi:10.1007/s11214-004-1432-2
Dougherty, M. K., Khurana, K. K., Neubauer, F. M., Russell, C. T., Saur, J., Leisner, J. S., et al. (2006). Identification of a dynamic atmosphere at enceladus with the cassini magnetometer. Science 311, 1406–1409. doi:10.1126/science.1120985
Dungey, J. W. (1961). Interplanetary magnetic field and the auroral zones. Phys. Rev. Lett. 6, 47–48. doi:10.1103/PhysRevLett.6.47
Dungey, J. W. (1965). The length of the magnetospheric tail. J. Geophys. Res. 70, 1753. doi:10.1029/JZ070i007p01753
Fawaz, H. I., Forestier, G., Weber, J., Idoumghar, L., and Muller, P. (2018). Data augmentation using synthetic data for time series classification with deep residual networks. Stud. Classif. Data Anal. Knowl. Org. Classif. Data Anal. 7, 345–352. doi:10.1007/978-3-642-60126-2_43
Garton, T. M. (2020). Machine learning identification of reconnection in cassini mag data programs. Berlin: Springer. doi:10.5281/zenodo.3978252
Guo, R. L., Yao, Z. H., Wei, Y., Ray, L. C., Rae, I. J., Arridge, C. S., et al. (2018). Rotationally driven magnetic reconnection in saturn’s dayside. Nat. Astronom. 2, 640–645. doi:10.1038/s41550-018-0461-9
Guo, X., Yin, Y., Dong, C., Yang, G., and Zhou, G. (2008). “On the class imbalance problem,” in Fourth international conference on natural computation, ICNC ’084. doi:10.1109/ICNC.2008.871
Heidke, P. (1926). Berechnung des erfolges und der güte der windstärkevorhersagen im sturmwarnungsdienst. Geogr. Ann. 8, 301–349. doi:10.1080/20014422.1926.11881138
Hill, T. W., Thomsen, M. F., Henderson, M. G., Tokar, R. L., Coates, A. J., McAndrews, H. J., et al. (2008). Plasmoids in saturn’s magnetotail. J. Geophys. Res.: Space Phys. 113. 33–39. doi:10.1029/2007JA012626
Hones, J., E. W. (1977). Substorm processes in the magnetotail: comments on ‘On hot tenuous plasmas, fireballs, and boundary layers in the Earth’s magnetotail’ by L. A. Frank, K. L. Ackerson, and R. P. Lepping. J. Geophys. Res. 82, 5633. doi:10.1029/JA082i035p05633
Huang, G.-B. (2003). Learning capability and storage capacity of two-hidden-layer feedforward networks. IEEE Trans. Neural Netw. 14, 274–281. doi:10.1109/TNN.2003.809401
Jackman, C. M., Achilleos, N., Cowley, S. W., Bunce, E. J., Radioti, A., Grodent, D., et al. (2013). Auroral counterpart of magnetic field dipolarizations in saturn’s tail. Planet. Space Sci. 82-83, 34–42. doi:10.1016/j.pss.2013.03.010
Jackman, C. M., Arridge, C. S., McAndrews, H. J., Henderson, M. G., and Wilson, R. J. (2009). Northward field excursions in saturn’s magnetotail and their relationship to magnetospheric periodicities. Geophys. Res. Lett. 36, 111–134. doi:10.1029/2009GL039149
Jackman, C. M., Russell, C. T., Southwood, D. J., Arridge, C. S., Achilleos, N., and Dougherty, M. K. (2007). Strong rapid dipolarizations in saturn’s magnetotail: in situ evidence of reconnection. Geophys. Res. Lett. 34, 77–79. doi:10.1029/2007GL029764
Jackman, C. M., Slavin, J. A., and Cowley, S. W. H. (2011). Cassini observations of plasmoid structure and dynamics: implications for the role of magnetic reconnection in magnetospheric circulation at saturn. J. Geophys. Res.: Space Phys. 116, 43–49. doi:10.1029/2011JA016682
Jackman, C. M., Slavin, J. A., Kivelson, M. G., Southwood, D. J., Achilleos, N., Thomsen, M. F., et al. (2014). Saturn’s dynamic magnetotail: a comprehensive magnetic field and plasma survey of plasmoids and traveling compression regions and their role in global magnetospheric dynamics. J. Geophys. Res.: Space Phys. 119, 5465–5494. doi:10.1002/2013JA019388
Jackman, C. M., Thomsen, M. F., Mitchell, D. G., Sergis, N., Arridge, C. S., Felici, M., et al. (2015). Field dipolarization in saturn’s magnetotail with planetward ion flows and energetic particle flow bursts: evidence of quasi-steady reconnection. J. Geophys. Res.: Space Phys. 120, 3603–3617. doi:10.1002/2015JA020995
Johnson, J. M., and Khoshgoftaar, T. M. (2019). Survey on deep learning with class imbalance. J. Big Data 6, 27. doi:10.1186/s40537-019-0192-5
Kane, M., Mitchell, D. G., Carbary, J. F., Dialynas, K., Hill, M. E., and Krimigis, S. M. (2020). Convection in the magnetosphere of saturn during the cassini mission derived from mimi inca and chems measurements. J. Geophys. Res.: Space Phys. 125, e2019JA027534. doi:10.1029/2019JA027534
Khurana, K. K., Mitchell, D. G., Arridge, C. S., Dougherty, M. K., Russell, C. T., Paranicas, C., et al. (2009). Sources of rotational signals in saturn’s magnetosphere. J. Geophys. Res.: Space Phys. 114, 24. doi:10.1029/2008JA013312
Ma, X., Delamere, P., Otto, A., and Burkholder, B. (2017). Plasma transport driven by the three-dimensional kelvin-helmholtz instability. J. Geophys. Res.: Space Phys. 122 (10382–10), 395. doi:10.1002/2017JA024394
Martin, C. J., and Arridge, C. S. (2017). Cassini observations of aperiodic waves on saturn’s magnetodisc. J. Geophys. Res.: Space Physics 122, 8063–8077. doi:10.1002/2017JA024293
McAndrews, H., Thomsen, M., Arridge, C., Jackman, C., Wilson, R., Henderson, M., et al. (2009). Plasma in saturn’s nightside magnetosphere and the implications for global circulation. Planet. Space Sci. 57, 1714–1722. doi:10.1016/j.pss.2009.03.003
Mikołajczyk, A., and Grochowski, M. (2018). Data augmentation for improving deep learning in image classification problem. Curr. Bioinform. 14, 117–122. doi:10.1109/IIPHDW.2018.8388338
Milan, S. E., Provan, G., and Hubert, B. (2007). Magnetic flux transport in the dungey cycle: a survey of dayside and nightside reconnection rates. J. Geophys. Res.: Space Phys. 112, 153. doi:10.1029/2006JA011642
Nakagawa, T., and Nishida, A. (1989). Southward magnetic field in the neutral sheet produced by wavy motions propagating in the dawn-dusk direction. Geophys. Res. Lett. 16, 1265–1268. doi:10.1029/GL016i011p01265
Neupane, B. R., Delamere, P. A., Wilson, R. J., and Ma, X. (2019). Quantifying mass and magnetic flux transport in saturn’s magnetosphere. J. Geophys. Res.: Space Phys. 124, 1916–1926. doi:10.1029/2018JA026022
Ruhunusiri, S., Halekas, J. S., Espley, J. R., Eparvier, F., Brain, D., Mazelle, C., et al. (2018). An artificial neural network for inferring solar wind proxies at mars. Geophys. Res. Lett. 45 (10855–10), 865. doi:10.1029/2018GL079282
Ruhunusiri, S. (2018). Identification of plasma waves at saturn using convolutional neural networks. IEEE Trans. Plasma Sci. 46, 3090–3099. doi:10.1007/978-1-4899-7687-1_100342
Russell, C. T., Jackman, C. M., Wei, H. Y., Bertucci, C., and Dougherty, M. K. (2008). Titan’s influence on saturnian substorm occurrence. Geophys. Res. Lett. 35. 121. doi:10.1029/2008GL034080
Simon, S., Wennmacher, A., Neubauer, F. M., Bertucci, C. L., Kriegel, H., Saur, J., et al. (2010). Titan’s highly dynamic magnetic environment: a systematic survey of Cassini magnetometer observations from flybys TA-T62. Planet. Space Sci. 58, 1230–1251. doi:10.1016/j.pss.2010.04.021
Slavin, J. A., Smith, E. J., Tsurutani, B. T., Sibeck, D. G., Singer, H. J., Baker, D. N., et al. (1984). Substorm associated traveling compression regions in the distant tail: Isee-3 geotail observations. Geophys. Res. Lett. 11, 657–660. doi:10.1029/GL011i007p00657
Smith, A. W., Jackman, C. M., Thomsen, M. F., Lamy, L., and Sergis, N. (2018a). Multi-instrument investigation of the location of saturn’s magnetotail x-line. J. Geophys. Res.: Space Phys. 123, 5494–5505. doi:10.1029/2018JA025532
Smith, A. W., Jackman, C. M., and Thomsen, M. F. (2016). Magnetic reconnection in saturn’s magnetotail: a comprehensive magnetic field survey. J. Geophys. Res. Space Physics 121, 2984–3005. doi:10.1002/2015JA022005
Smith, A. W., Jackman, C. M., Thomsen, M. F., Sergis, N., Mitchell, D. G., and Roussos, E. (2018b). Dipolarization fronts with associated energized electrons in saturn’s magnetotail. J. Geophys. Res.: Space Phys. 123, 2714–2735. doi:10.1002/2017JA024904
Solomon, S., McNutt, R., Gold, R., Acuña, M., Baker, D., Boynton, W., et al. (2001). The messenger mission to mercury: scientific objectives and implementation. Planet. Space Sci. 49, 1445–1465. doi:10.1016/S0032-0633(01)00085-X
Thomsen, M. F., Wilson, R. J., Tokar, R. L., Reisenfeld, D. B., and Jackman, C. M. (2013). Cassini/caps observations of duskside tail dynamics at saturn. J. Geophys. Res.: Space Phys. 118, 5767–5781. doi:10.1002/jgra.50552
Vasyliunas, V. M. (1983). Plasma distribution and flow. Cambridge: Cambridge Cambridge University Press, 395–453. doi:10.1017/CBO9780511564574.013
Waldmann, I. P., and Griffith, C. A. (2019). Mapping saturn using deep learning. Nat. Astronom. 3, 620–625. doi:10.1038/s41550-019-0753-8
Yao, Z. H., Grodent, D., Ray, L. C., Rae, I. J., Coates, A. J., Pu, Z. Y., et al. (2017). Two fundamentally different drivers of dipolarizations at saturn. J. Geophys. Res.: Space Phys. 122, 4348–4356. doi:10.1002/2017JA024060
Young, D. T., Berthelier, J. J., Blanc, M., Burch, J. L., Coates, A. J., Goldstein, R., et al. (2004). Cassini plasma spectrometer investigation. Space Sci. Rev. 114, 1–112. doi:10.1007/s11214-004-1406-4
Keywords: machine learning, magnetic reconnection, planetary magnetospheres, magnetotail, plasmoid
Citation: Garton TM, Jackman CM, Smith AW, Yeakel KL, Maloney SA and Vandegriff J (2021) Machine Learning Applications to Kronian Magnetospheric Reconnection Classification. Front. Astron. Space Sci. 7:600031. doi: 10.3389/fspas.2020.600031
Received: 28 August 2020; Accepted: 19 November 2020;
Published: 10 March 2021.
Edited by:
Scott Alan Thaller, University of Colorado Boulder, United StatesReviewed by:
Octav Marghitu, Space Science Institute, RomaniaCopyright © 2021 Garton, Jackman, Smith, Yeakel, Maloney and Vandegriff. This is an open-access article distributed under the terms of the Creative Commons Attribution License (CC BY). The use, distribution or reproduction in other forums is permitted, provided the original author(s) and the copyright owner(s) are credited and that the original publication in this journal is cited, in accordance with accepted academic practice. No use, distribution or reproduction is permitted which does not comply with these terms.
*Correspondence: Tadhg M. Garton, dC5tLmdhcnRvbkBzb3Rvbi5hYy51aw==
Disclaimer: All claims expressed in this article are solely those of the authors and do not necessarily represent those of their affiliated organizations, or those of the publisher, the editors and the reviewers. Any product that may be evaluated in this article or claim that may be made by its manufacturer is not guaranteed or endorsed by the publisher.
Research integrity at Frontiers

Learn more about the work of our research integrity team to safeguard the quality of each article we publish.