- 1CAS Key Laboratory of Solar Activity, National Astronomical Observatories, Chinese Academy of Sciences, Beijing, China
- 2School of Astronomy and Space Science, University of Chinese Academy of Sciences, Beijing, China
From 2018 Oct 12 to 13, three successive solar eruptions (E1–E3) with B-class flares and poor white light coronal mass ejections (CMEs) occurred from the same active region NOAA AR 12724. Interestingly, the first two eruptions are associated with Type II radio bursts but the third is not. Using the soft X-ray flux data, radio dynamic spectra and dual perspective EUV intensity images, we comparatively investigate the three events. Our results show that their relevant flares are weak (B2.1, B7.9, and B2.3) and short-lived (13, 9, and 14 min). The main eruption directions of E1 and E2 are along ~45° north of their radial directions, while E3 primarily propagated along the radial direction. In the EUV channels, the early speeds of the first two CMEs have apparent speeds of ~320 and ~380 km s−1, which could exceed their respective local Alfvén speeds of ~300 and ~350 km s−1. However, the CME in the third eruption possesses a much lower speed of ~160 km s−1. These results suggest that the observed Type II radio bursts in the eruptions E1 and E2 are likely triggered by their associated CMEs and the direction of eruption and the ambient plasma and magnetic environments may take an important place in producing Type II radio burst or shock as well.
1. Introduction
Solar Type II radio bursts were first reported by Payne-Scott et al. (1947) and named by Wild and McCready (1950). Usually, a Type II burst appeared as a slowly drifting, from high to low frequencies, narrow frequency band patterns in radio dynamic spectra (e.g., Nelson and Melrose, 1985). It is generally believed that type II bursts are excited by magnetohydrodynamics (MHD) shocks in the solar atmosphere (e.g., Nelson and Melrose, 1985; Cliver et al., 1999; Nindos et al., 2008, 2011; Vršnak and Cliver, 2008, and references therein).
Since the first discovery of Type II bursts, they have been found to be closely related to both flares (e.g., Wild et al., 1954; Maxwell and Thompson, 1962; Dodge, 1975) and high-velocity ejections (e.g., Dodson et al., 1953; Giovanelli and Roberts, 1958; Swarup et al., 1960). The blast wave initiated by flares and piston-driven mechanism associated with coronal mass ejections (CMEs) have become the two main competitors of the triggering mechanism of the Type II bursts as reviewed by the papers (e.g., Cliver et al., 1999; Vršnak and Cliver, 2008; Nindos et al., 2011) and also suggested by some recent studies (e.g., Zheng et al., 2018; Eselevich et al., 2019; Frassati et al., 2019). In the piston-driven mechanism, besides CME front, some other triggers, such as soft X-ray jet, erupting coronal loop and eruptive magnetic flux rope are also proposed to explain the production of shock or Type II burst (e.g., Klein et al., 1999; Klassen et al., 2003; Dauphin et al., 2006; Su et al., 2015; Eselevich et al., 2017; Grechnev et al., 2018).
In theory, the occurrence of a coronal shock requires the introduction of a sudden disturbance in the corona, which should travel with a speed faster than the local Alfvén velocity. Early studies (e.g., Gosling et al., 1976) indicate that the velocities of CMEs with type II bursts would exceed 400–550 km s−1. However, Gopalswamy et al. (2001) made a statistical study and found that 50% of limb CMEs associated Type II bursts during 1995–1997 have speeds lower than 500 km s−1 and the lower cutoff of these CMEs' speeds may reach ~ 250 km s−1. So far, detailed case studies about Type II radio bursts with slow CMEs and weak flares (below C-class) have been very rare.
In this paper, we present a case study about two successive Type II bursts associated with B-class flares and CMEs with slow speeds below ~400 km s−1 in the period of solar activity minimum. Our comparative investigations suggest that these Type II radio bursts are likely triggered by their associated CMEs and we also discuss the influence from the ambient coronal magnetic structures on the eruptions.
2. Observations
From 2018 Oct 12 to 13, three eruptions orderly took place in the active region (AR) NOAA 12724. AR 12724 is near the solar east limb in the field of view (FOV) of the ground-based telescopes (spectrographs) or space-based telescopes on geosynchronous satellites, such as the Solar and Heliospheric Observatory SOHO and the Solar Dynamics Observatory (SDO, Pesnell et al., 2012). The Solar Terrestrial Relations Observatory (STEREO, Kaiser et al., 2008) consists of two space-based observatories—one ahead of Earth in its orbit (STA), the other trailing behind (STB, lost communications since 2014 Oct 1). The STA orbits the Sun with a radius slightly smaller than 1AU and the separation angle between STA and the Earth was about 105° during the three events. The host AR is located on the disk in the view of STA.
We use the dynamic spectrum data from the radio spectrograph ORFEES (Observation Radio Frequence pour l'Etude des Eruptions Solaires) observing between 140 and 1,000 MHz, Learmonth solar radio spectrograph covering a frequency range of 25–180 MHz (LEAR, Kennewell and Steward, 2003), and the CALLISTO spectrometer (Benz et al., 2009) at the Greenland Observatory. Intensity images provided by the Atmospheric Imaging Assembly (AIA, Lemen et al., 2012) on SDO and the EUV Imager (EUVI, Wuelser et al., 2004) in the Sun Earth Connection Coronal and Heliospheric Investigation (SECHHI; Howard et al., 2008) on STA are also utilized to study the early stages of the eruptions. The observation from the Large Angle and Spectrometric Coronagraph (LASCO; Brueckner et al., 1995) on-board SOHO with a FOV of 2–6.0 R⊙ help us to check the associated CMEs.
3. Results
3.1. Overview of the Events
The general information of the three successive eruption events (E1–E3) are listed in Table 1. All the three events originated from the same active region (AR) NOAA 12724 and each of them involved a filament eruption, a B-class flare and a slow poor white light (WL) CME. Type II radio bursts only appeared in E1 and E2. The detailed magnitude and the start, peak, and end time of each flare are given in the “Flare Class” and “Flare Time” column, respectively. The central locations of the relevant filaments (F1–F3) in the FOV of AIA are presented in the “Filament Center” column. The CMEs' angular widths (AWs) and their quadratic speeds (obtained by performing second-order polynomial fittings to the height-time measurements) at the final height measurements are placed in the “CME AW” and “CME Speed” columns, respectively.
3.2. Filaments
The AIA 304 Å (left column) and EUVI A 195 Å (right column) images in Figure 1 show the morphologies of the AR 12724, the erupting filaments (F1–F3) and their corresponding flares (Flare1–Flare3). In the 304 Å images, it can be seen that F1 and F2 almost have a north-south orientation, while F3 runs from east to west. According to the EUVI A 195 Å observations, Flare1 and Flare2 were located in the northwest of AR 12724, while Flare3 mainly lay in the AR's southeast. To the east of AR 12724, a small emerging active region labeled “New” appeared to have nothing to do with the eruptions.
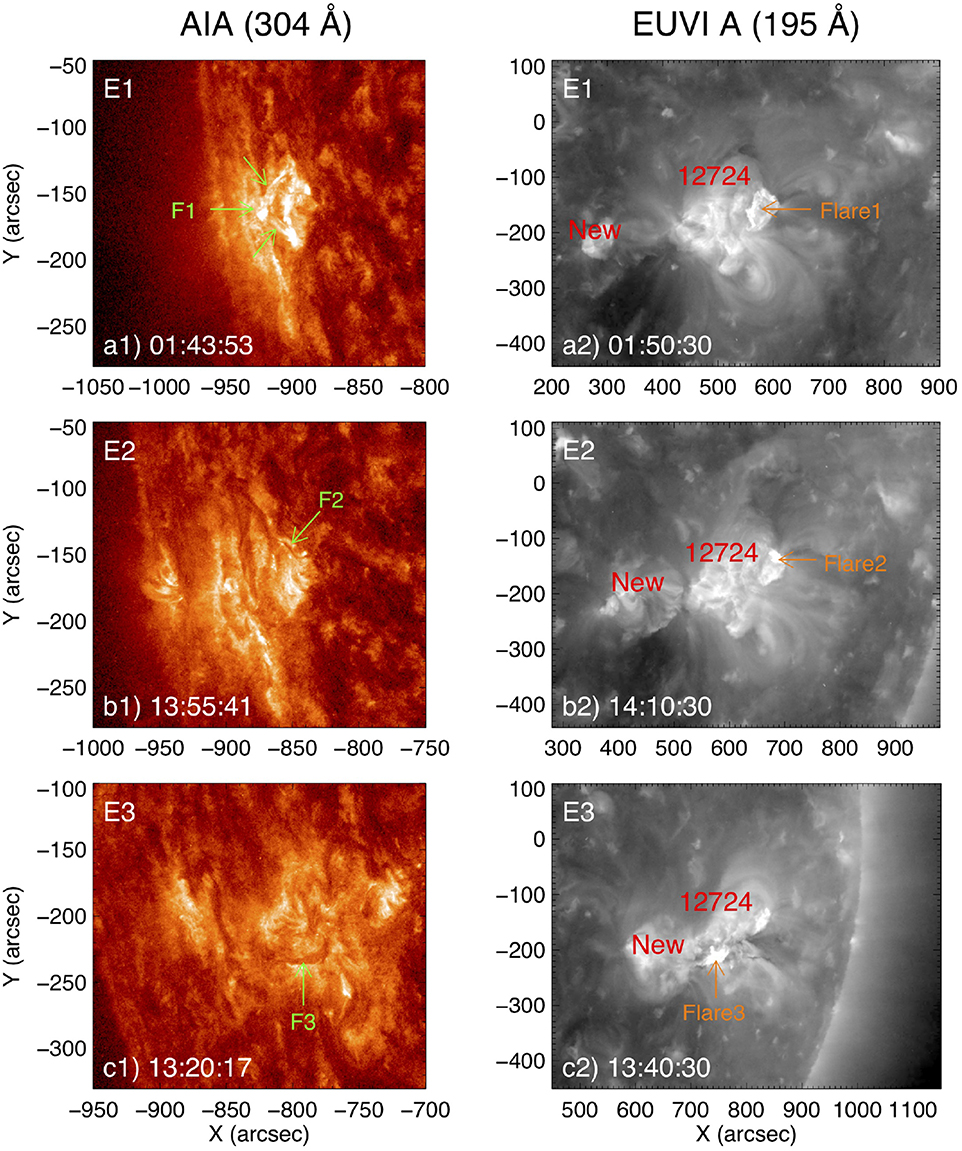
Figure 1. Observations in EUV passbands displaying the morphology of the host active region NOAA 12724 during the occurrences of E1, E2, and E3. (a1,b1) and (c1) show the AIA observation at 304 Å during E1, E2 and E3, respectively, and the green arrows point to the locations of filament1 (F1), filament2 (F2), and filament3 (F3). (a2,b2) and (c2) are EUVI images at 195 Å during E1, E2 and E3, respectively, and the orange arrows direct the positions of Flare1, Flare2, and Flare3.
3.3. Flares and Radio Bursts
The GOES X-ray fluxes and radio dynamic spectrums associated with E1, E2 and E3 are shown in the panels (a) and (b) of Figures 2–4, respectively. Figure 2a displays the short-lived B2.1 Flare1. In Figure 2b, a type II radio burst can be found in the Learmonth's radio dynamic spectrum, suggesting that a shock (Shock1) was generated during E1. The type II radio burst, including a fundamental band (F) and a harmonic band (H) with two splitting lanes (HL and HU), started from ~01:52 UT, when Flare1 has entered its descending phase. After ~02:00 UT, it gradually disappeared. The frequencies along F, HL and HU change from about 40, 78, and 80 MHz to 26, 54, and 64 MHz, respectively. Their average frequency drift rates are −0.086, −0.087, and −0.109 MHz s−1. We adopt the frequency values represented by the black (F), red (HL), and blue (HU) dashed curves to measure local plasma densities and further derive the speeds of Shock1 (see section 3.6).
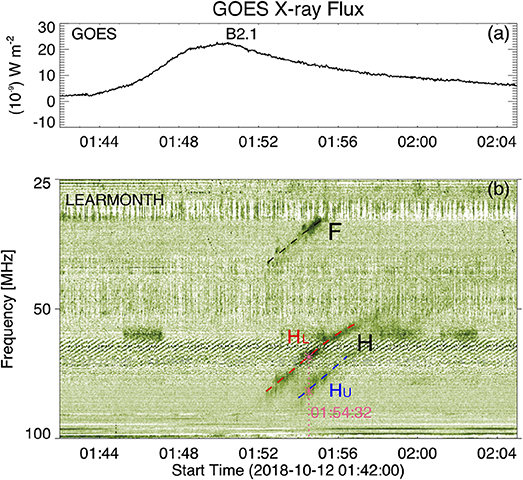
Figure 2. GOES soft X-ray flux during Flare1 in 1–8 Å (a) and a radio dynamic spectrum from Learmonth showing the information about the associated Type II radio burst (b). “F” indicates the fundamental frequency band and “H” mark the harmonic frequency band with the lower (“HL”) and higher (“HU”) splitting branches. The three curves along the fundamental (black), lower (red), and higher (blue) harmonic splitting bands are used to measure the frequency drifts and the height and speed of Shock1. The vertical line in (b) indicate the time at 01:54:32 UT. The two pink asterisks mark the frequencies which are applied to calculate the density compression of Shock1.
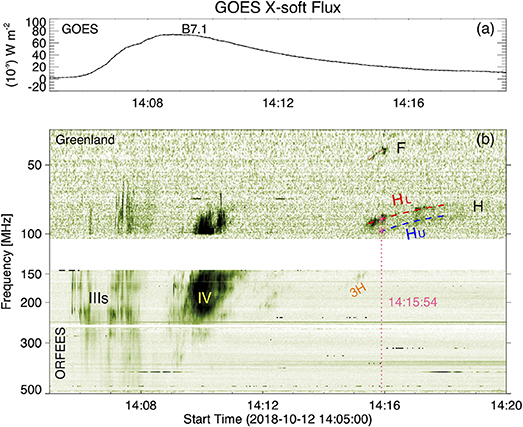
Figure 3. GOES soft X-ray flux during Flare2 in 1–8 Å (a) and the composite radio dynamic spectrum from Greenland (25–105 MHz) and ORFEES (144–400 MHz) displaying the complicated radio bursts during E2 (b). Along the red and blue dashed curves in (b) we will measure the frequency drift of the Type II radio burst and derive the height and speed of the associated shock (Shock2). The vertical line in (b) indicate the time at 14:15:54 UT. The two pink in (b) asterisks mark the frequencies which are used to calculate the density compressions of Shock2.
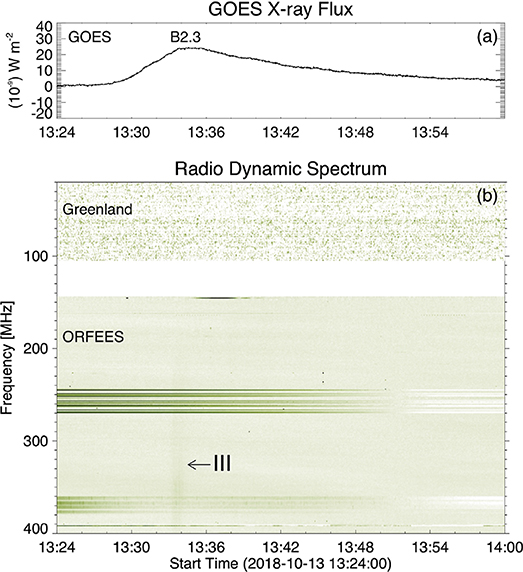
Figure 4. GOES soft X-ray flux in 1–8 Å during Flare3 (a) and a composite radio dynamic spectrum from Greenland (25–105 MHz) and ORFEES (144–400 MHz) during E3 (b).
It is generally believed that the band-splitting is caused by the emission from the upstream and downstream shock regions and the downstream/upstream density jump (X) could provide an estimate of the coronal Alfvén speed (e.g, Smerd et al., 1974; Mann et al., 1995; Vršnak, 2001). The density jump can be described as
(Vršnak et al., 2002). Here, n1 and n2 are the electron densities of the plasma at the frequency fL in the lower frequency branch and at the frequency fU in the upper frequency branch of the harmonic bands, respectively. For the Type II radio burst in E1, we take fU = 77.5 and fL = 64.5 at 01:54:32 UT (indicated by the vertical line in Figure 2b) and obtain X = 1.44, indicating that Shock1 is a weak shock. Under the quasi-perpendicular shock approximation and a plasma beta β− > 0, the Alfvén Mach number MA is related to the compression X as
Then, MA around 1.35 can be derived for Shock1.
The GOES X-ray flux of the B7.1-class flare (Flare2) and the composite dynamic spectrum from ORFEES (144–400 MHz) and Greenland (25–105 MHz) associated with E2 are displayed in the top and bottom panels of Figure 3, respectively. A variety of radio bursts, such as a group of type III bursts (IIIs), a relatively strong short-lived type IV burst and a weak type II burst, can be found in the composite dynamic spectrum. The Type III bursts occurred in the initial and impulsive phase of Flare2. Some of them show negative frequency drifts which probably result from energetic electron beams propagating outward along open coronal magnetic field (e.g., Yan et al., 2006; Huang et al., 2011), while others show positive drifts which may be caused by energetic electron beams propagating downward from where they are accelerated (likely the reconnection region) (e.g., Reid and Ratcliffe, 2014; Ning, 2016; Tan et al., 2016). The type IV burst appeared after the peak of Flare2 and lasted for about 2 min. It is probably excited by the energetic electrons trapped within the erupting magnetic structures (e.g., Smerd and Dulk, 1971; Vlahos et al., 1982; Stewart, 1985).
At around 14:15 UT on Oct 12, the type II burst appeared with obvious fundamental (F) and second harmonic bands (splitting into two lanes HL and HU) in the observation of Greenland. Similar to E1, it likely indicates a shock (Shock2) induced during the eruption E2. Along HL, the frequency varies from 90 to 74 MHz with a mean frequency drift of −0.099 MHz s−1 and that decreases from 98 MHz to 83 MHz with a mean frequency drift of −0.113 MHz s−1 along HU. In addition, a very faint third harmonic band (3H) seems to appear in the dynamic spectrum of ORFEES. Using the same method described above (see Equation 1), we obtained the density jump of Shock2 at 14:15:54 UT (marked by the vertical line in Figure 3b, when the HU is 98 MHz and HL is 86 MHz), which is about 1.30. The corresponding shock Mach number was deduced as 1.23.
Figure 4 shows the GOES X-ray flux of the flare (top panel) and the dynamic spectra (bottom panel) during E3. A B2.3-class flare (Flare3) correlated with E3. Taking advantage of the joint observations from ORFEES and Greenland, we found that only a very weak type III burst and no sign of type II burst appeared in this event.
3.4. White Light CMEs
The running difference intensity images of LASCO C2 and AIA at 193 Å are composited and shown in Figure 5, displaying the coronal changes during E1, E2, and E3. Three faint stream-like CMEs (CME1–CME3) can be separately identified in the three eruptions. They are indicated by the arrows in the left, middle and right column of Figure 5, respectively. According to the LASCO CME catalog (see https://cdaw.gsfc.nasa.gov/CME_list), CME1–CME3 only appear in the FOV of C2 (2~6R⊙) and belong to “poor CMEs.” They separately have an angular width of about 46, 44, and 38°, and a 2nd-order speed at the time of final height measurement of 333, 492, and 133 km s−1 (see Table 1). The times of their first appearance in the LASCO C2's FOV are around 02:48 UT (Oct 12), 15:12 UT (Oct 12), and 14:36 UT (Oct 13), respectively. Obviously, the Type II bursts in E1 and E2 had already formed before their corresponding CMEs came into the C2 FOV. No relevant CME can be found from the observations of COR 1 (inner coronagraph) and COR 2 (outer coronagraph) on-board STA. This may be related to the on-disk perspective of STA and the weak magnitudes of the eruptions.
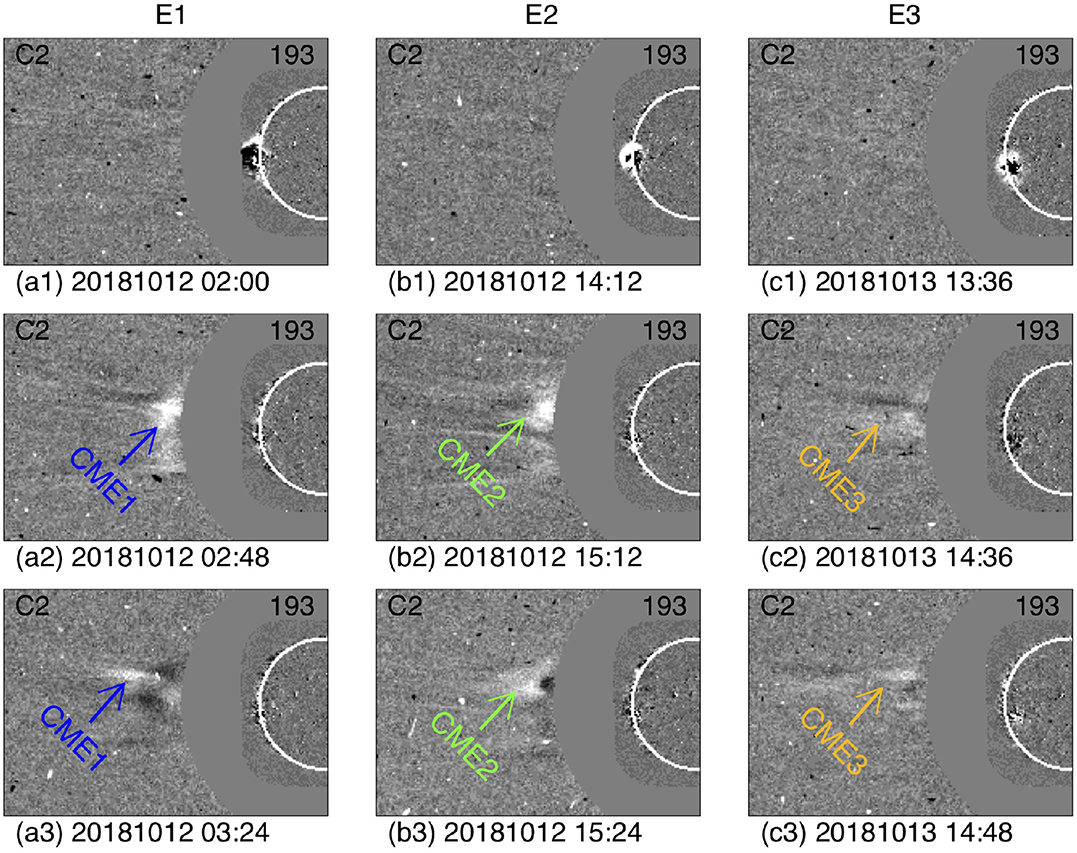
Figure 5. The composite images of LASCO C2 WL and AIA 193 Å running difference images show the propagations of the three faint CMEs. (a1–a3) for CME1, (b1–b3) for CME2, and (c1–c3) for CME3.
3.5. Eruptions in EUV
The AIA 193 Å (Figure 6) and EUVI 195 Å (Figure 7) intensity images display the early evolutions of E1–E3 from different perspectives. The original images in the left columns of Figures 6, 7 are utilized as references to get the base difference images in the middle and right columns. The AIA 193 Å data clearly exhibit the dome-like structures of CME1 and CME2 with distinct leading edges (LE1 and LE2) in their early stages, while CME3 had a tenuous leading edge (LE3). Comparing the main eruption directions of E1–E3 (indicated by the yellow arrows in Figure 6) with the radial directions (denoted by the purple arrows in Figure 6), it can be found that CME1 and CME2 primarily propagated northeast, whereas CME3 was ejected approximately along the radial direction.
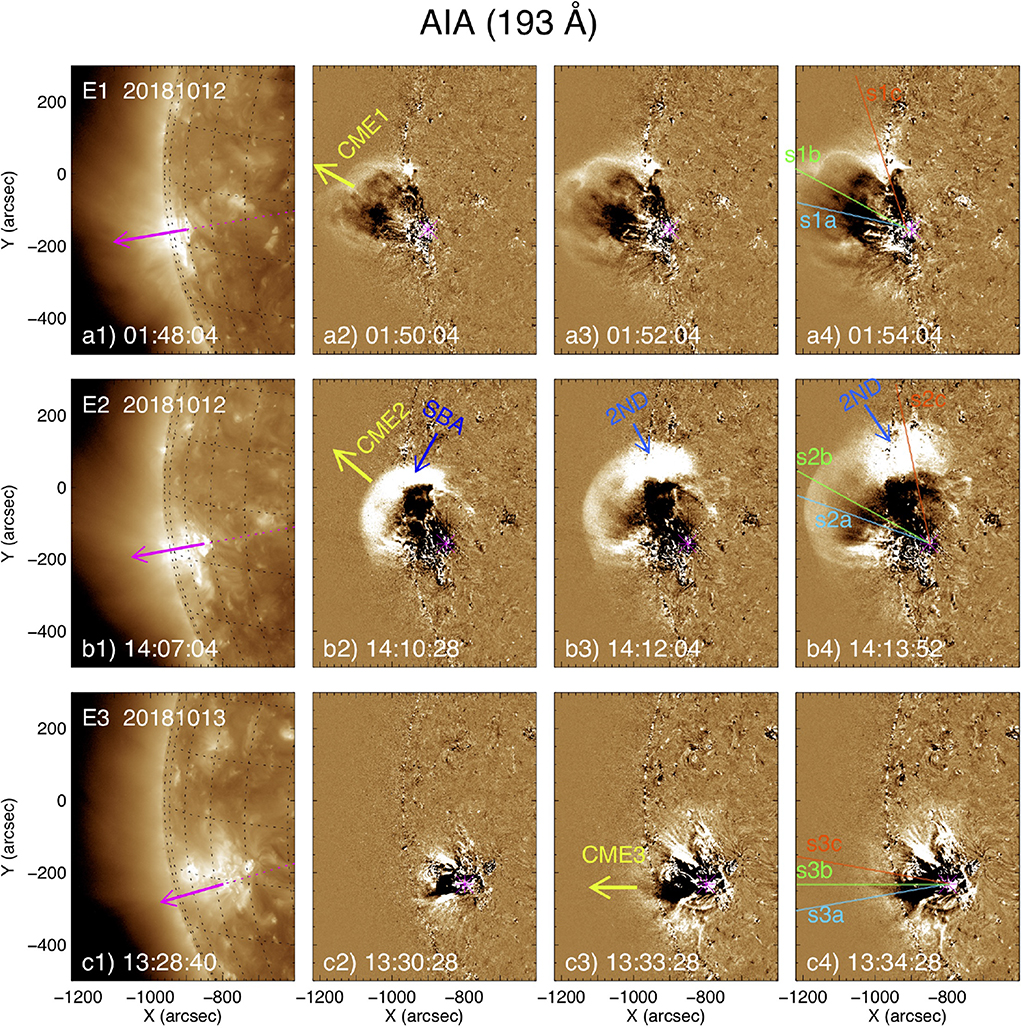
Figure 6. The AIA 193 Å intensity images display the early evolutions of E1 (top), E2 (middle), and E3 (bottom). The panels in left column (a1,b1,c1) are original images and the rest panels (a2–a4, b2–b4,c2–c4) are base difference images. The pink arrows in (a1–a3) denote the heliocentric radial directions that passing through the eruption centers of E1, E2, and E3, respectively. The pink asterisks in panels (a2–a4, b2–b4,c2–c4) mark the centers of the eruptions. The yellow arrows in (a2,b2,c3) show the main eruption directions of CME1, CME2, and CME3, respectively. “SBA” (b2) and “2ND” (b3–b4) refer to a special brightening area and a secondary disturbance during E2. The lines in (a4,b4,c4) indicate the position of slits s1a–s1c, s2a–s2c, and s3a–s3c, respectively.
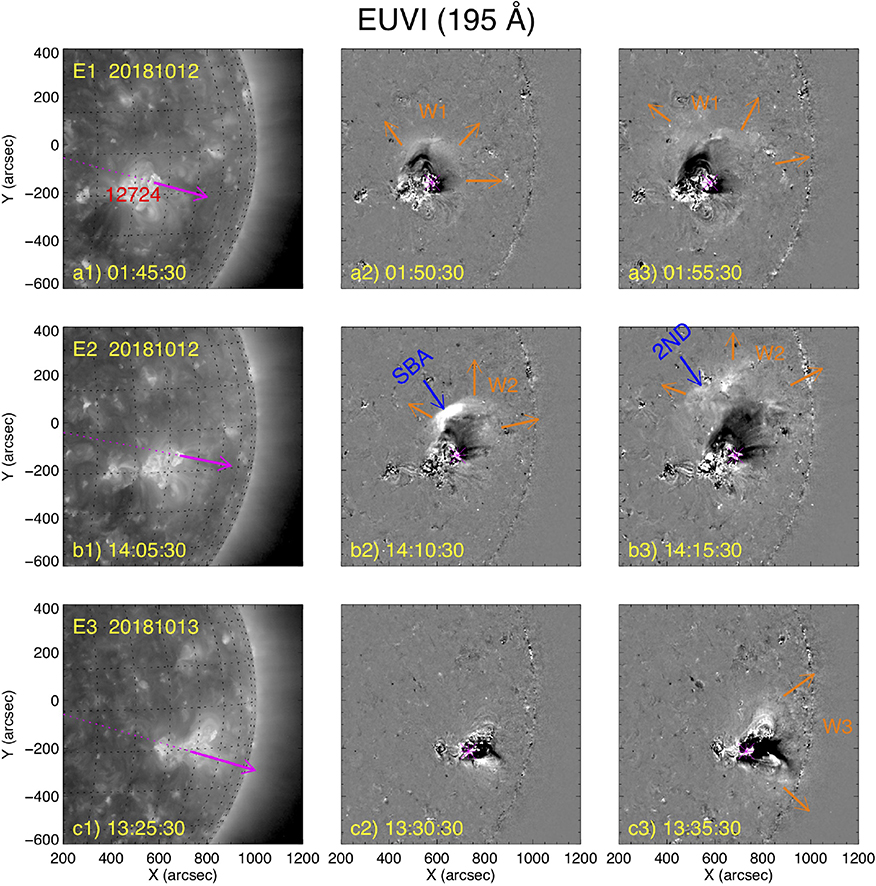
Figure 7. The EUVI 195 Å intensity images show the evolutions of E1 (a1–a3), E2 (b1–b3), and E3 (c1–c3) from on-disk perspective. The left column (a1,b1,c1) are the original images and the rest panels give the base difference images. Same to Figure 6, the pink arrows in the left column images (a1,b1,c1) show the heliocentric radial directions through each eruption centers (pink asterisks) The orange arrows indicate the propagation directions of the associated EUV wave “W1” (a2,a3), “W2” (b2,b3), and “W3” (c3).
In the EUVI observations, three diffusing EUV waves (W1–W3) can be observed, as indicated by the orange arrows in Figure 7. EUV waves are also called “EIT waves” or global coronal waves, which are large-amplitude waves initially driven by the rapid lateral expansion of a CME in the low corona and later propagating freely (cf. Long et al., 2017). Ma et al. (2009) showed the evidence that EUV wave front includes contribution from its associated CME at the early stage. More information about the “EUV waves” could be seen in the recent reviews (Liu and Ofman, 2014; Warmuth, 2015; Chen, 2016; Long et al., 2017). The propagation directions of W1 and W2 are similar and mainly toward the north from their eruption centers, while the traveling of W3 has no obvious preference. Combining the AIA and EUVI observations with a separation angle of 105°, we estimate that the eruption directions of E1 and E2 are alike along the ~45° north of their radial directions and E3 basically erupted radially.
Interestingly, a special brightening area (“SBA,” Figures 6b2, 7b2) was observed at the north border of AR 12724 when the north flank of CME2 swept there (from ~14:09 to ~14:11 UT on Oct 12). It showed as an arc structure in the AIA images and a brow-like brightening in the EUVI images. The SBA may be caused by the interaction of CME or EUV waves with some coronal structures. Later, another expanding dome-like structure and a propagating diffusing wave front can be detected to propagate forward through SBA in the AIA and EUVI intensity images, which are indicated by the blue arrows with “2ND” in Figures 6b3,b4, 7b3, respectively. It is probably a secondary wave.
3.6. Kinetics of the CMEs and Shocks
In order to explore the relationship between the CMEs and their associated Type II radio bursts, we studied the kinetics of CME1–CME3 and Shock1–Shock2, which are presented in Figure 8. For convenience, the identical colors represent the same bands or slits in Figures 2, 3, 6, 8. Because there is no associated radioheliograph observation to be available, the exact locations of Type II burst sources are hard to be determined. Assuming that the electron density of the corona varies with heliocentric distance and the shock propagates along the radial direction, we first deduced the local plasma densities (n) of Shock1 and Shock2 from the observed frequency (fp indicated by the black dashed line in Figure 2 or 2fp indicated by the red and blue dashed lines in Figures 2, 3) in the light of their relationship
The results are shown in Figures 8a2,a3. In order to further calculate the heights of Shock1 and Shock2 from the derived local plasma densities n, we apply the coronal plasma density model of Sittler and Guhathakurta (1999) (see also Figure 8a1),
where y is the height above the solar surface in solar radii and n0 is the electron number density at the solar surface. We choose n0 as 6.0 × 108 cm−3 considering the events under this study occurring in the period of solar activity minimum, which is similar to the value used in Ma et al. (2011). The time distance profiles of Shock1 and Shock2 calculated from the different splitting bands in the radio dynamic spectra are presented in the panels (c1) and (c2) of Figure 8, respectively. It can be seen that the heights of Shock1 and Shock2 approximately change from 1.45 R⊙ to 1.60 R⊙ and from 1.37 R⊙ to 1.46 R⊙, respectively.
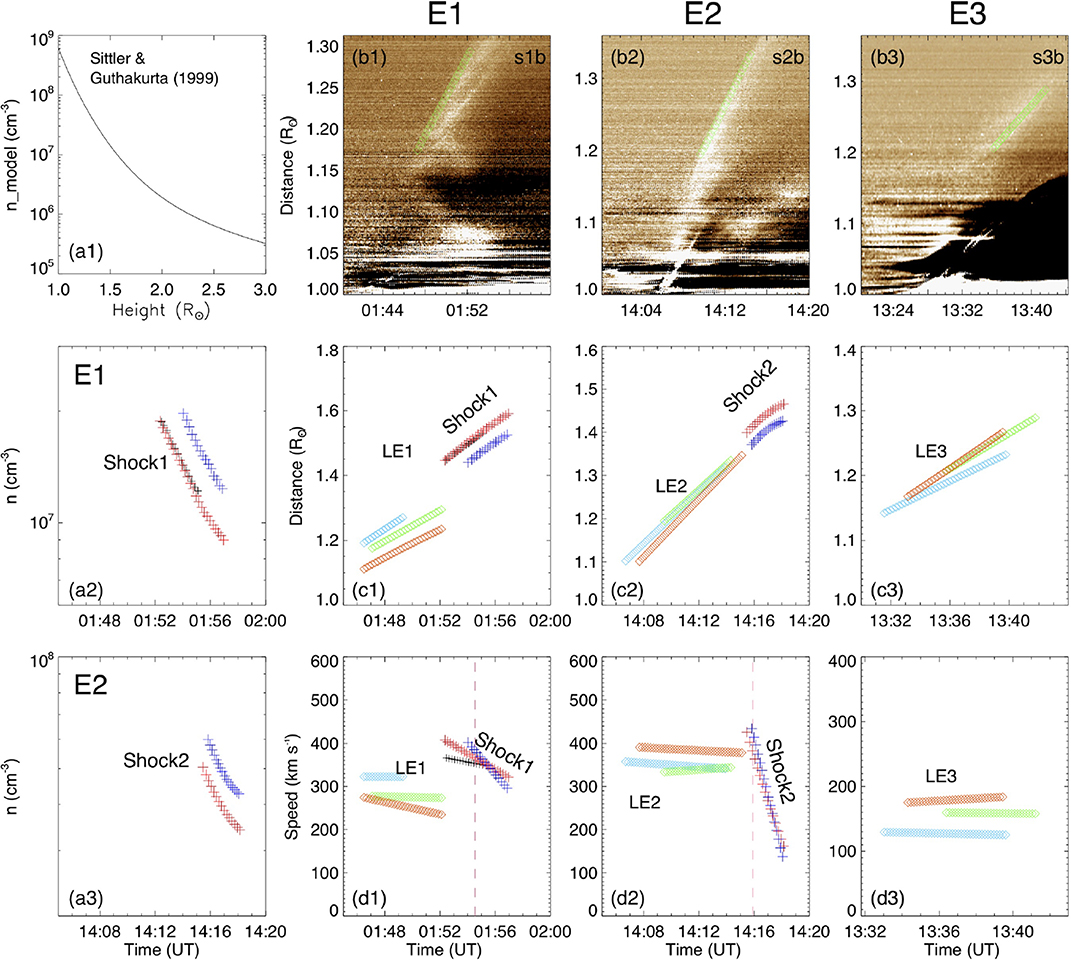
Figure 8. (a1) Shows the electron density changing with the height base on the model of Sittler and Guhathakurta (1999). (a2,a3) Display the local plasma electron densities of Shock1 and Shock2 calculated from the observations of their associated Type II radio bursts. (b1–b3) Are the time-slit images showing the motions of LE1, LE2, and LE3 along the slits s1b, s2b, and s3b, respectively. (c1–c3) Display the heliocentric distances of LE1 (diamonds) and Shock1 (pluses), LE2 (diamonds) and Shock2 (pluses), and LE3 (diamonds), respectively. (d1–d3) Are the same to (c1–c3), but for the speeds of LE1–LE3 and Shock1–Shock2. The identical colors in this figure represent the same bands or slits in Figures 2, 3, 6.
The leading edges (LE1–LE3) of CME1–CME3 can be tracked in the AIA running difference images at 193 Å. For each event, we chose three different slits (s1a–s1c, s2a–s2c, and s3a–s3c in Figure 6) to make the time-distance slit images, which display the propagations of the leading edges along different directions. As examples, three time-distance diagrams from s1b, s2b and s3b are plotted in the panels (b1–b3) of Figure 8. According to the tracks or stripes in the slit images, we calculated the heights of LE1–LE3 and derived their speeds, which are shown by the diamonds in Figures 8c1–c3,d1–d3, respectively.
From Figure 8c1, it can be seen that although LE1 had moved out of the AIA's FOV when Shock1 began to appear, the development trend of the LE1's heights and the height variation of Shock1 suggest a high degree correlation between them. Figure 8c2 indicates a similar situation for LE2 and Shock2. Thus, it is likely that the two shocks corresponding to the two Type II radio bursts in E1 and E2 were separately triggered by the expanding of the leading edges of CME1 and CME2. In Figures 8d1,d2, it can be found that LE1 and LE2 have various speeds along different propagation directions. LE1 has the largest velocity of ~320 km s−1 (azure diamonds in Figure 8d1) along s1a (azure line in Figure 6a4). The fastest speed of LE2 is ~380 km s−1 (red diamonds in Figure 8d2), which was calculated along the slit s2c (red line in Figure 6b4).
The speeds of Shock1 and Shock2 derived from their heights are given in Figures 8d1,d2, respectively. It can be found that the shocks' speeds calculated along the different Type II bursts bands are also different. These different speeds represent the speeds of the downstream (blue pluses) and upstream (red and black pluses) shock regions, which might be distinct from each other. In addition, the discrepancies of the speeds are also probably caused by the measurement errors. On average, Shock1 has an initial speed of ~400 km s−1 and that of Shock2 is ~430 km s−1. According to the relationship between the shock's speed (Vs) and the local Alfvén speed VA, i.e.,
the Alfvén speeds at the early phases of Shock1 (01:54:32 UT, indicated by the vertical line in Figures 2b, 8d1) and Shock2 (14:15:54 UT, indicated by the vertical line in Figures 3b, 8d2) can be deduced as ~300 and ~350 km s−1, respectively. Compared with the fastest speeds of LE1 (~320 km s−1) and LE2 (~380 km s−1), the local Alfvén speeds are smaller. These results are in agreement with the scenario of piston-driven shock, supporting our conjecture that the CMEs in E1 and E2 excited their relevant shocks and Type II radio bursts. Figure 8d3 shows that the leading edge of CME3 had a relatively slower speed (~160 km s−1) than LE1 and LE2. It is likely less than the local Alfvén speed, which might be the reason why Type II radio burst or shock is absent in E3.
3.7. Background Fields From PFSS Extrapolation
To probe the background field structures surrounding the eruption source area and their relationship with the eruptions, an extrapolation was performed using the potential field source surface (PFSS) model (e.g., Schatten et al., 1969; Schrijver and De Rosa, 2003) with a starting radius of 1.01 R⊙. For better reliability, one HMI longitudinal magnetogram on 2018 Oct 13 was applied to extrapolate the potential field. The magnetic field lines from the extrapolation are overlaid on the AIA 171 Å, EUVI 195 Å intensity images, HMI and rotated HMI magnetograms, as displayed by Figures 9a–d.
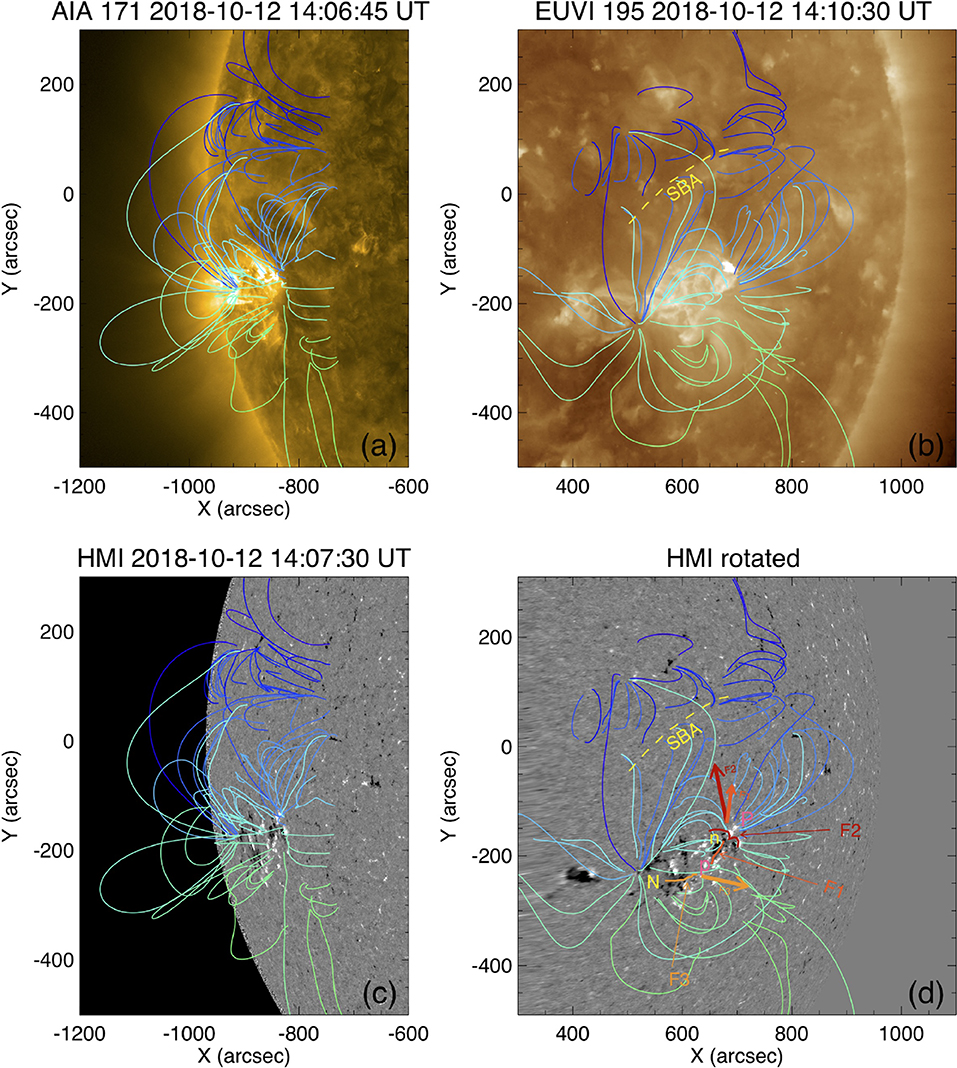
Figure 9. The extrapolated magnetic field lines using the PFSS model are overlaid on the AIA intensity image (a), the EUVI intensity image (b) and HMI magnetograms (c,d). The yellow dashed curves in (b,d) indicate the location of the “SBA.” “P” and “N” in (d) mark the leading and following magnetic fluxes of AR 12724. “p” and “n” in (d) denote the positive and negative parasitic magnetic elements surrounding N and P, respectively. The thick arrows in different colors in (d) point to the main eruption directions of F1–F3.
The HMI magnetogram in Figure 9d shows that AR 12724 mainly consists of the leading positive flux “P” and following negative flux “N,” with some surrounding parasitic magnetic elements, such as the fluxes “n” and “p.” In this panel, we also overlaid the profiles of the three filaments F1–F3, which are indicated by the red curves. It can be seen that F1 and F2 are located at the northwest of the AR and aligned along the magnetic neutral lines between N and p, while F3 lies in the AR's southeast region between the opposite polarity fluxes P and n. The spine directions of F1 and F2 are approximately from north to south, opposite to the east-west orientation of F3.
At the remote region to the north of AR 12724, we found some different magnetic loop systems, which are represented by the short dark blue field lines. Between these magnetic systems and the magnetic loops inside AR 12724, the magnetic quasi-separatrix layer (indicated by the yellow dashed line) may exist. That area is consistent with the place where the special brightening region SBA in E2 appeared. It is likely that SBA was caused by the interaction between the north flank of CME2 and the magnetic separatrix layer.
4. Summary and Discussion
Using radio dynamic spectra and dual perspective EUV observations, we investigate three successive solar eruptions (E1, E2, and E3) from the same active region AR 12724. All the eruptions were accompanied by a B-class flare and a poor WL CME. However, only the first two of them were observed to correlate with Type II radio bursts, suggesting the likely appearances of shocks (Shock1 and Shock2) only in the two events. From the radio dynamic spectra, we utilize the splitting bands of the Type II bursts to estimate the density jumps (1.44 and 1.30), Alfvén Mach numbers (1.35 and 1.23), and coronal Alfvén speeds (~300 and ~350 km s−1) of Shock1 and Shock2. Through a comparative study, we found that
• The apparent speeds of the CMEs' leading edges (LE1–LE3) are different. LE3 has an obvious slower speed (~160 km s−1) than LE1 (~320 km s−1) and LE2 (~380 km s−1). The speeds of LE1 and LE2 can exceed their corresponding local Alfvén speeds (~300 and ~350 km s−1).
• E1 and E2 originated from the northwest of AR 12724, while E3 took place from the AR's southeast region.
• The EUV imaging observations from two different perspective indicate that E1 and E2 erupted along the ~45° north of their radial directions, while CME3 in E3 approximately propagated radially.
4.1. Trigger of Type II Radio Bursts
According to the GOES soft X-ray flux data, Flare3 is a B2.3-class flare and stronger than the B2.1 Flare1. However, Type II radio burst is associated with the weaker one. This is in agreement with the finding that the magnitudes of flares are not directly related to the occurrence of Type II radio bursts (e.g., Cliver et al., 1999). In addition, since all the eruptions took place from the same AR and all the associated flares are relatively weak (only B-class), it is hard to conclude that the Type II bursts studied here were initiated by the blast wave due to flares. Our calculations have shown that the speeds of LE1 and LE2 along certain directions can exceed the local coronal Alfvén speeds, which meet the requirements of the formation of a piston-driven shock. Thus, It would be more reasonable that the Type II bursts were triggered by their associated CMEs. On the other, it should be noted that the third eruption E3 has a different source region and eruption direction from E1 and E2. The coronal plasma and magnetic field environments that the erupting structures of E3 encountered would be also distinct from those of E1 and E2. The missing of Type II burst in E3 may be associated with this situation as well.
4.2. SBA and the Secondary Wave
In the eruption E2, a special brightening area SBA is detected where a magnetic separatrix may exist according to the results of the PFSS extrapolation (Figure 9). The occurrence or appearance of SBA in this event might be explained by this scenario: when the flank of CME2 and/or EUV wave W2 arrived the magnetic separatrix layer, it would be likely compressed and heated, which might give birth to SBA. Along with the occurrence of the reflection and refraction of the EUV wave near the magnetic separatrix, a secondary wave 2ND might be further produced and propagate outward. Similar situations can be found in some other studies (e.g., Ofman and Thompson, 2002; Shen and Liu, 2012; Chandra et al., 2016; Zheng et al., 2018). In addition, some studies have shown a close relationship between Type II radio bursts and such interactions (e.g., Feng et al., 2012; Kong et al., 2012; Shen et al., 2019). Using simultaneous radio and EUV imaging data, Chen et al. (2014) found that the source location of a solar type II radio burst coincides with the interface between CME EUV wave front and a nearby coronal ray structure, where an obvious EUV brightening also appeared. They conjectured that the CME streamer interactions may be important to the formation of type II radio burst. Unfortunately, there is no radioheliograph observation available for our study and we can not confirm the exact location of the type II burst in E2, but according to the results of Chen et al. (2014), it can be suspected that the special brightening area SBA corresponds to the source region of the type II burst in E2.
Data Availability Statement
Publicly available datasets were analyzed in this study. This data can be found here: http://sdac.virtualsolar.org/cgi/search, https://rsdb.obs-nancay.fr, http://soleil.i4ds.ch/solarradio/callistoQuicklooks/.
Author Contributions
SM downloaded and analyzed the data in both radio and EUV passband, and wrote the paper. HC analyzed the data in EUV passband and wrote the paper.
Funding
This work was supported by NSFC (11433006, 11533008, 11661161015, 11790300, 11790301, 11790304, 11941003, 11973057, and 41331068) and the B-type Strategic Priority Program of the Chinese Academy of Sciences, Grant No. XDB41000000.
Conflict of Interest
The authors declare that the research was conducted in the absence of any commercial or financial relationships that could be construed as a potential conflict of interest.
Acknowledgments
We were grateful to Prof. Jun Lin and Prof. Baolin Tan for their insightful suggestions and informative discussions. We acknowledge NASA's open data policy in using SDO data. STEREO is a mission in NASA's Solar Terrestrial Probes program. SOHO is a project of international collaboration between ESA and NASA. We were grateful to ORFEES, Learmonth and Greenland teams for offering the radio spectra data. We thank the referees for their constructive comments and suggestions.
References
Benz, A. O., Monstein, C., Meyer, H., Manoharan, P. K., Ramesh, R., Altyntsev, A., et al. (2009). A world-wide net of solar radio spectrometers: e-CALLISTO. Earth Moon Planets 104, 277–285. doi: 10.1007/s11038-008-9267-6
Brueckner, G. E., Howard, R. A., Koomen, M. J., Korendyke, C. M., Michels, D. J., Moses, J. D., et al. (1995). The large angle spectroscopic coronagraph (LASCO). Solar Physics, 162:357.
Chandra, R., Chen, P. F., Fulara, A., Srivastava, A. K., and Uddin, W. (2016). Peculiar stationary EUV wave fronts in the eruption on 2011 May 11. Astrophys. J. 822:106. doi: 10.3847/0004-637X/822/2/106
Chen, P. F. (2016). Global coronal waves. Am. Geophys. Union Geophys. Monogr. Ser. 216, 381–394. doi: 10.1002/9781119055006.ch22
Chen, Y., Du, G., Feng, L., Feng, S., Kong, X., Guo, F., et al. (2014). A solar type II radio burst from coronal mass ejection-coronal ray interaction: simultaneous radio and extreme ultraviolet imaging. Astrophys. J. 787:59. doi: 10.1088/0004-637X/787/1/59
Cliver, E. W., Webb, D. F., and Howard, R. A. (1999). On the origin of solar metric type II bursts. Sol. Phys. 187, 89–114. doi: 10.1023/A:1005115119661
Dauphin, C., Vilmer, N., and Krucker, S. (2006). Observations of a soft X-ray rising loop associated with a type II burst and a coronal mass ejection in the 03 November 2003 X-ray flare. Astron. Astrophys. 455, 339–348. doi: 10.1051/0004-6361:20054535
Dodge, J. C. (1975). Source regions for type II radio bursts. Sol. Phys. 42, 445–459. doi: 10.1007/BF00149925
Dodson, H. W., Hedeman, E. R., and Owren, L. (1953). Solar flares and associated 200 Mc/sec radiation. Astrophys. J. 118:169. doi: 10.1086/145740
Eselevich, V. G., Eselevich, M. V., and Zimovets, I. V. (2019). Observations of a flare-generated blast wave in a pseudo coronal mass ejection event. Sol. Phys. 294:73. doi: 10.1007/s11207-019-1467-x
Eselevich, V. G., Eselevich, M. V., Zimovets, I. V., and Sharykin, I. N. (2017). Evidence for shock generation in the solar corona in the absence of coronal mass ejections. Astron. Rep. 61, 805–819. doi: 10.1134/S1063772917080030
Feng, S. W., Chen, Y., Kong, X. L., Li, G., Song, H. Q., Feng, X. S., et al. (2012). Radio signatures of coronal-mass-ejection-streamer interaction and source diagnostics of type II radio burst. Astrophys. J. 753:21. doi: 10.1088/0004-637X/753/1/21
Frassati, F., Susino, R., Mancuso, S., and Bemporad, A. (2019). Comprehensive analysis of the formation of a shock wave associated with a coronal mass ejection. Astrophys. J. 871:212. doi: 10.3847/1538-4357/aaf9af
Giovanelli, R. G., and Roberts, J. A. (1958). Optical observations of the solar disturbances causing type II radio bursts. Aust. J. Phys. 11:353. doi: 10.1071/PH580353
Gopalswamy, N., Lara, A., Kaiser, M. L., and Bougeret, J. L. (2001). Near-sun and near-earth manifestations of solar eruptions. J. Geophys. Res. 106, 25261–25278. doi: 10.1029/2000JA004025
Gosling, J. T., Hildner, E., MacQueen, R. M., Munro, R. H., Poland, A. I., and Ross, C. L. (1976). The speeds of coronal mass ejection events. Sol. Phys. 48, 389–397. doi: 10.1007/BF00152004
Grechnev, V. V., Lesovoi, S. V., Kochanov, A. A., Uralov, A. M., Altyntsev, A. T., Gubin, A. V., et al. (2018). Multi-instrument view on solar eruptive events observed with the Siberian Radioheliograph: from detection of small jets up to development of a shock wave and CME. J. Atmos. Solar Terres. Phys. 174, 46–65. doi: 10.1016/j.jastp.2018.04.014
Howard, R. A., Moses, J. D., Vourlidas, A., Newmark, J. S., Socker, D. G., Plunkett, S. P., et al. (2008). Sun earth connection coronal and heliospheric investigation (SECCHI). Space Sci. Rev. 136, 67–115. doi: 10.1007/s11214-008-9341-4
Huang, J., Démoulin, P., Pick, M., Auchére, F., Yan, Y. H., and Bouteille, A. (2011). Initiation and early development of the 2008 April 26 coronal mass ejection. Astrophys. J. 729:107. doi: 10.1088/0004-637X/729/2/107
Kaiser, M. L., Kucera, T. A., Davila, J. M., St. Cyr, O. C., Guhathakurta, M., and Christian, E. (2008). The STEREO mission: an introduction. Space Sci. Rev. 136, 5–16. doi: 10.1007/s11214-007-9277-0
Kennewell, J., and Steward, G. (2003). Solar Radio Spectrograph [SRS] Data. Sydney, NSW: IPS Radio and Space Serv.
Klassen, A., Pohjolainen, S., and Klein, K. L. (2003). Type II radio precursor and x-ray flare emission. Sol. Phys. 218, 197–210. doi: 10.1023/B:SOLA.0000013034.61996.c4
Klein, K.-L., Khan, J. I., Vilmer, N., Delouis, J.-M., and Aurass, H. (1999). X-ray and radio evidence on the origin of a coronal shock wave. Astron. Astrophys. 346, L53–L56.
Kong, X. L., Chen, Y., Li, G., Feng, S. W., Song, H. Q., Guo, F., et al. (2012). A broken solar type II radio burst induced by a coronal shock propagating across the streamer boundary. Astrophys. J. 750:158. doi: 10.1088/0004-637X/750/2/158
Lemen, J. R., Title, A. M., Akin, D. J., Boerner, P. F., Chou, C., Drake, J. F., et al. (2012). The atmospheric imaging assembly (AIA) on the solar dynamics observatory (SDO). Sol. Phys. 275, 17–40. doi: 10.1007/s11207-011-9776-8
Liu, W., and Ofman, L. (2014). Advances in observing various coronal EUV waves in the SDO era and their seismological applications. Sol. Phys. 289, 3233–3277. doi: 10.1007/s11207-014-0528-4
Long, D. M., Bloomfield, D. S., Chen, P. F., Downs, C., Gallagher, P. T., Kwon, R. Y., et al. (2017). Understanding the physical nature of coronal “EIT waves”. Sol. Phys. 292:7. doi: 10.1007/s11207-016-1030-y
Ma, S., Raymond, J. C., Golub, L., Lin, J., Chen, H., Grigis, P., et al. (2011). Observations and interpretation of a low coronal shock wave observed in the EUV by the SDO/AIA. Astrophys. J. 738:160. doi: 10.1088/0004-637X/738/2/160
Ma, S., Wills-Davey, M. J., Lin, J., Chen, P. F., Attrill, G. D. R., Chen, H., et al. (2009). A new view of coronal waves from STEREO. Astrophys. J. 707, 503–509. doi: 10.1088/0004-637X/707/1/503
Mann, G., Classen, T., and Aurass, H. (1995). Characteristics of coronal shock waves and solar type II radio bursts. Astron. Astrophys. 295:775.
Maxwell, A., and Thompson, A. R. (1962). Spectral observations of solar radio bursts. II. Slow-drift bursts and coronal streamers. Astrophys. J. 135:138. doi: 10.1086/147254
Nelson, G. J., and Melrose, D. B. (1985). “Type II bursts,” in Solar Radiophysics: Studies of Emission From the Sun at Metre Wavelengths (A87-13851 03-92), eds D. J. McLean and N. R. Labrum (Cambridge; New York, NY: Cambridge University Press), 333–359.
Nindos, A., Alissandrakis, C. E., Hillaris, A., and Preka-Papadema, P. (2011). On the relationship of shock waves to flares and coronal mass ejections. Astron. Astrophys. 531:A31. doi: 10.1051/0004-6361/201116799
Nindos, A., Aurass, H., Klein, K. L., and Trottet, G. (2008). Radio emission of flares and coronal mass ejections. Sol. Phys. 253, 3–41. doi: 10.1007/s11207-008-9258-9
Ning, Z. (2016). Bi-directional flows in a C-class solar flare. Astrophys. Space Sci. 361:22. doi: 10.1007/s10509-015-2606-y
Ofman, L., and Thompson, B. J. (2002). Interaction of EIT waves with coronal active regions. Astrophys. J. 574, 440–452. doi: 10.1086/340924
Payne-Scott, R., Yabsley, D. E., and Bolton, J. G. (1947). Relative times of arrival of bursts of solar noise on different radio frequencies. Nature 160, 256–257. doi: 10.1038/160256b0
Pesnell, W. D., Thompson, B. J., and Chamberlin, P. C. (2012). The solar dynamics observatory (SDO). Sol. Phys. 275, 3–15. doi: 10.1007/s11207-011-9841-3
Reid, H. A. S., and Ratcliffe, H. (2014). A review of solar type III radio bursts. Res. Astron. Astrophys. 14, 773–804. doi: 10.1088/1674-4527/14/7/003
Schatten, K. H., Wilcox, J. M., and Ness, N. F. (1969). A model of interplanetary and coronal magnetic fields. Sol. Phys. 6, 442–455. doi: 10.1007/BF00146478
Schrijver, C. J., and De Rosa, M. L. (2003). Photospheric and heliospheric magnetic fields. Sol. Phys. 212, 165–200. doi: 10.1023/A:1022908504100
Shen, Y., Chen, P. F., Liu, Y. D., Shibata, K., Tang, Z., and Liu, Y. (2019). First unambiguous imaging of large-scale quasi-periodic extreme-ultraviolet wave or shock. Astrophys. J. 873:22. doi: 10.3847/1538-4357/ab01dd
Shen, Y., and Liu, Y. (2012). Simultaneous observations of a large-scale wave event in the solar atmosphere: from photosphere to corona. Astrophys. J. Lett. 752:L23. doi: 10.1088/2041-8205/752/2/L23
Sittler, E. C. J.r., and Guhathakurta, M. (1999). Semiempirical two-dimensional magnetohydrodynamic model of the solar corona and interplanetary medium. Astrophys. J. 523, 812–826. doi: 10.1086/307742
Smerd, S. F., and Dulk, G. A. (1971). in Solar Magnetic Fields, Vol. 43 of IAU Symposium, ed R. Howard (Dordrecht: Reidel), 616. doi: 10.1017/S0074180900023081
Smerd, S. F., Sheridan, K. V., and Stewart, R. T. (1974). “On split-band structure in type II radio bursts from the sun,” in Coronal Disturbances, Vol. 57 of IAU Symposium, ed G. A. Newkirk (Dordrecht; Boston: Reidel), 389. doi: 10.1017/S0074180900234542
Stewart, R. T. (1985). Moving Type IV Bursts. Cambridge, New York, NY: Cambridge University Press. 361–383.
Su, W., Cheng, X., Ding, M. D., Chen, P. F., and Sun, J. Q. (2015). A type II radio burst without a coronal mass ejection. Astrophys. J. 804:88. doi: 10.1088/0004-637X/804/2/88
Swarup, G., Stone, P. H., and Maxwell, A. (1960). The association of solar radio bursts with flares and prominences. Astrophys. J. 131:725. doi: 10.1086/146885
Tan, B., Mészárosová, H., Karlický, M., Huang, G., and Tan, C. (2016). Microwave type III pair bursts in solar flares. Astrophys. J. 819:42. doi: 10.3847/0004-637X/819/1/42
Vlahos, L., Gergely, T. E., and Papadopoulos, K. (1982). Electron acceleration and radiation signatures in loop coronal transients. Astrophys. J. 258, 812–822. doi: 10.1086/160128
Vršnak, B. (2001). Solar flares and coronal shock waves. J. Geophys. Res. 106, 25291–25300. doi: 10.1029/2000JA004009
Vršnak, B., and Cliver, E. W. (2008). Origin of coronal shock waves. Sol. Phys. 253, 215–235. doi: 10.1007/s11207-008-9241-5
Vršnak, B., Magdalenić, J., Aurass, H., and Mann, G. (2002). Band-splitting of coronal and interplanetary type II bursts. II. Coronal magnetic field and Alfvén velocity. Astron. Astrophys. 396, 673–682. doi: 10.1051/0004-6361:20021413
Warmuth, A. (2015). Large-scale globally propagating coronal waves. Living Rev. Sol. Phys. 12:3. doi: 10.1007/lrsp-2015-3
Wild, J. P., and McCready, L. L. (1950). Observations of the spectrum of high-intensity solar radiation at metre wavelengths. I. The apparatus and spectral types of solar burst observed. Aust. J. Sci. Res. A Phys. Sci. 3:387. doi: 10.1071/CH9500387
Wild, J. P., Murray, J. D., and Rowe, W. C. (1954). Harmonics in the spectra of solar radio disturbances. Aust. J. Phys. 7:439. doi: 10.1071/PH540439
Wuelser, J.-P., Lemen, J. R., Tarbell, T. D., Wolfson, C. J., Cannon, J. C., Carpenter, B. A., et al. (2004). “EUVI: the STEREO-SECCHI extreme ultraviolet imager,” in Proceedings of the SPIE, Vol. 5171 of Society of Photo-Optical Instrumentation Engineers (SPIE) Conference Series, eds S. Fineschi and M. A. Gummin (San Diego, CA), 111–122. doi: 10.1117/12.506877
Yan, Y., Pick, M., Wang, M., Krucker, S., and Vourlidas, A. (2006). A radio burst and its associated CME on March 17, 2002. Sol. Phys. 239, 277–292. doi: 10.1007/s11207-006-0202-6
Keywords: radio radiation, coronal mass ejections (CMEs), UV radiation, flares, corona, filaments, shock waves, magnetic topology
Citation: Ma S and Chen H (2020) Two Successive Type II Radio Bursts Associated With B-Class Flares and Slow CMEs. Front. Astron. Space Sci. 7:17. doi: 10.3389/fspas.2020.00017
Received: 03 June 2019; Accepted: 07 April 2020;
Published: 12 May 2020.
Edited by:
Dipankar Banerjee, Indian Institute of Astrophysics, IndiaReviewed by:
Mingde Ding, Nanjing University, ChinaDebi Prasad Choudhary, California State University, Northridge, United States
Copyright © 2020 Ma and Chen. This is an open-access article distributed under the terms of the Creative Commons Attribution License (CC BY). The use, distribution or reproduction in other forums is permitted, provided the original author(s) and the copyright owner(s) are credited and that the original publication in this journal is cited, in accordance with accepted academic practice. No use, distribution or reproduction is permitted which does not comply with these terms.
*Correspondence: Suli Ma, c21hQG5hby5jYXMuY24=
 Suli Ma
 Huadong Chen