- 1Theoretical Design Division and Center for Theoretical Astrophysics, Los Alamos National Laboratory, Los Alamos, NM, United States
- 2Department of Astronomy, New Mexico State University, Las Cruces, NM, United States
In the second phase of the NASA Kepler mission (K2), the Kepler spacecraft observed fields along the ecliptic plane for about 80 days each to search for planetary transits and monitor stellar variability. We analyzed the light curves of thousands of main-sequence stars observed as part of the Kepler Guest Observer program. Here we summarize the statistics of discovery and properties of the pulsation amplitude spectra for 249 δ Scuti variable stars or candidates observed during K2 Campaigns 4 through 17. δ Sct variables are core or shell hydrogen-burning stars about twice as massive as the Sun, pulsating in many simultaneous radial and non-radial modes, with periods of about 2 h. The growing collection of long time-series high signal-to-noise photometric data from space missions such as Kepler, combined with constraints from ground and space-based data, will be useful to constrain the interior structure of these types of variables. We hope that this list of δ Sct candidates observed by Kepler will be useful as a starting point for identifying promising targets for asteroseismic investigations.
1. Introduction
The NASA Kepler mission was launched March 6, 2009, with a primary objective to use high-precision long time-series CCD photometry to search for exoplanets via planetary transits, and a secondary mission to study stellar variability and characterize exoplanet host stars (Borucki et al., 2010; Gilliland et al., 2010; Lundkvist et al., 2018). Stellar pulsations can be used to infer the interior structure of stars, and to determine their masses, radii, and ages, some of the goals of the field of asteroseismology (Aerts et al., 2010). The K2 mission was devised in 2013 (Howell et al., 2014), after failure of the second of four reaction wheels that were used to point the spacecraft cameras continuously toward the same field of view in the Cygnus-Lyra region to monitor stars for planetary transits. K2 relied on solar radiation pressure to assist spacecraft orientation, and observed 19 new fields along the ecliptic plane for up to 80 days each. The spacecraft eventually exhausted its fuel and was retired on November 15, 20181.
We report on analyses of light curves from the K2 mission from Campaigns 4 through 17 obtained as part of the Kepler K2 Guest Observer program2. We focus here on searching for δ Sct variable star candidates. The δ Sct variables are main-sequence stars (core or shell hydrogen-burning), with effective temperature (Teff) about 7,000 K and masses of about 2 M⊙ that pulsate in many simultaneous radial and non-radial modes with periods of about 2 h (Aerts et al., 2010). Kepler photometry can detect brightness variations produced by radial and low-degree non-radial acoustic (p-mode) pulsations for which the variations do not average out over the unresolved disk.
Apart from the Sun and sun-like stars, the δ Sct variables are arguably the most promising type of variable for using pulsations to infer interior structure. Similarities to and differences from the Sun can be used test physics input and methods of solar and stellar modeling. For example, the δ Sct stars have convective cores and radiative envelopes, whereas the Sun has a radiative core and convective envelope. The δ Sct p-mode pulsations are driven by the κ effect (opacity valving) mechanism, whereas solar-like oscillations are excited stochastically (Aerts et al., 2010). Most δ Sct variables rotate more rapidly than the Sun. Many interesting phenomena remain to be explained, for example, mode selection, pulsation amplitudes, frequency and mode amplitude variations, peculiar element abundances, and the prevalence of many hybrid stars showing both γ Dor gravity-mode and δ Sct p-mode pulsations, unexpected according to pre-Kepler theoretical predictions (see, e.g., Grigahcène et al., 2010; Uytterhoeven et al., 2011; Balona, 2018).
2. Data and Analysis Methods
For our K2 Guest Observer (GO) program proposals, we used the MAST interface to the K2 Ecliptic Plane Input Catalog, EPIC3 Huber et al. (2017), to search for stars within the coordinates of the K2 campaign field of view having either B-V or J-K colors between −0.3 and 1.2, placing them on or near the main sequence, allowing for uncertainties in color photometry or interstellar reddening. We used the k2fov tool found at the Kepler Asteroseismic Science Consortium web site4 to retain only targets that fell on active silicon in the Kepler field of view, and limited our target lists depending on campaign constraints. The target lists were truncated as necessary by the K2 GO office by removing the faintest targets first (at our request) or the brightest targets that are most costly in terms of number of pixels required. Table 1 summarizes the number of light curves observed for each campaign, and the brightest (Kp minimum) and faintest (Kp maximum) Kepler magnitude of the sample. For Campaigns 4, 5, and 7, we deliberately targeted open-cluster stars in the Pleiades, Hyades, M67, M44 (also known as the Praesepe or Beehive cluster), and R147, based on catalogs of cluster member candidates. The C13 field also has a small overlap with the C4 field and includes Hyades members. We did not propose K2 GO surveys for C14-C16, but in the future we could analyze light curves in the K2 data archive for these campaigns having the same target selection criteria. The C17 field significantly overlapped that of C6, and we deliberately chose to revisit stars with prior observations to extend the time series of observations. The two δ Sct candidates found in C17 in Table 1 were also found in C6. We have yet to analyze data from our C18 and C19 proposed observations, also revisiting many stars observed previously in Campaigns 5 and 12.

Table 1. K2 Guest Observer survey results, with number of stars observed, minimum, and maximum Kepler magnitudes of stars observed in campaign, and number of identified δ Sct candidates.
Here we analyze light curves with long-cadence observations (30 min integrations), although several of the stars were observed also in short cadence (1 min integrations) for our or others' Guest Observer programs. We developed a Python script with a graphical interface5 that processed the fits files for raw data available at the MAST K2 archive6, and plotted the light curve and amplitude spectrum for each star, displaying also stellar properties in the data file header from the EPIC catalog. Because of the 30 min cadence and associated Nyquist frequency limit of 24.5 cycles/day (c/d), we do not consider frequencies above the Nyquist limit; some modes with frequencies above this limit may appear as ‘Nyquist reflection’ frequencies between 0 and 24.5 c/d (see, e.g., Murphy et al., 2013).
We then examined by eye each light and amplitude spectrum, and flagged as δ Sct candidates those stars with one or more modes with frequency >5 c/d and amplitude greater than about 4 × the noise level of the adjacent power spectrum. We did not flag as δ Sct candidates those stars for which the amplitude spectrum shows only frequencies that are multiples of the spacecraft roll correction period of ~6 h (4.075 c/d) that are highlighted in the amplitude spectra plots. Some candidates were discarded, such as those having only low signal-to-noise frequencies > 5 c/d; there could therefore be many more δ Sct stars among the observed sample. It would also be useful to identify those stars with Teff placing them within the δ Sct instability region, but that show no apparent pulsation frequencies. We did not attempt to identify γ Dor candidates because these would be much more numerous, being less massive, and because of the high potential of ambiguities between intrinsic pulsation frequencies and a rotational period or variation from starspots/magnetic activity, a binary orbital period, instrumental artifacts, or Nyquist reflections of higher frequencies. Overall, 251 δ Sct candidates were flagged, two of which in C17 also were found in C6 (see Table 1). The percentage of δ Sct candidates varied from 4% (C11) or 5% (C7) down to only 0.15% (C8).
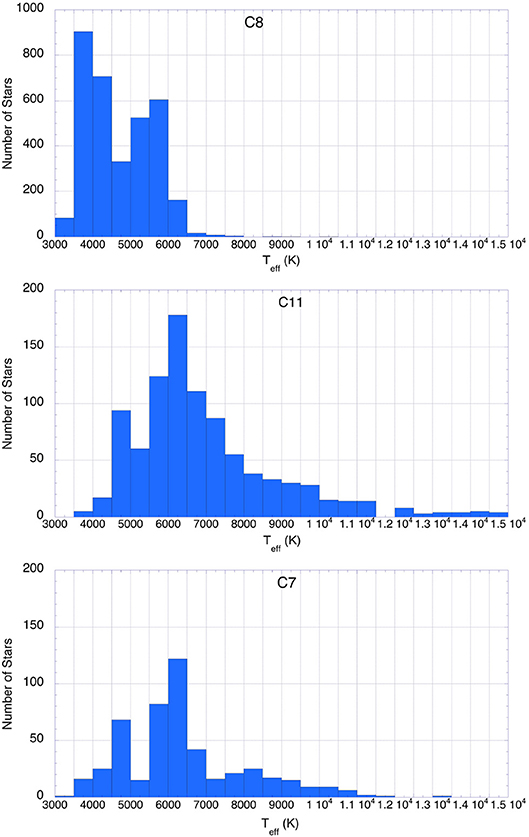
Figure 1 shows spectroscopic Hertzsprung-Russell diagrams, log surface gravity (log g) vs. Teff, for the C8, C11, and C7 targets, respectively, with the δ Sct candidates shown as red dots. The log g and Teff are taken from the K2 EPIC catalog (Huber et al., 2017). Figure 2 shows the Teff distribution of stars in each of these campaigns. We chose to illustrate results of these three campaigns because they represent the extremes in number of δ Sct candidates among the campaigns of Table 1. C8 has the most stars observed (3370), but only five δ Sct candidates (0.15%), primarily because this sample contains mostly stars in the lower main sequence with Teff < 6,000 K that are too cool to be δ Sct variables. The field for C11 (toward the Galactic Center) was so rich that the target list was truncated at magnitude < 13.2; therefore, the sample is biased toward hotter and higher-mass main-sequence, stars, and has a larger percentage of δ Sct candidates (3.8%). C7 has the smallest number of observed targets (506), but it actually has the largest percentage of δ Sct candidates (4.5%). This sample contains stars both on the lower main sequence and in the Teff region expected for δ Sct and hybrid stars.
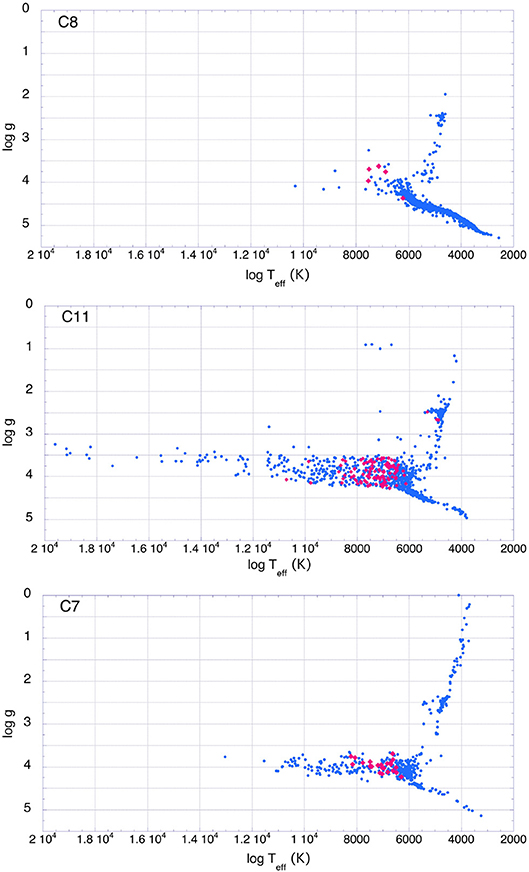
Figure 1. Spectroscopic H-R diagram, log surface gravity vs. log Teff, for C8, C11, and C7 targets observed by K2. Red dots label δ Sct candidates.
Figures 3–9 show example light curves and amplitude spectra for several δ Sct candidates. Figure 3 shows the brightest candidate, EPIC 210425611, with Kp magnitude 5.6, observed during C4. This star is the previously known δ Sct variable h Tau, also known as V483 Tau and 57 Tau (Liakos and Niarchos, 2017). Its amplitude spectrum also shows low-frequency γ Dor-type modes. Figure 4 shows the light curve and amplitude spectrum for the faintest candidate, EPIC 247333962, with Kp magnitude 15.9, observed during C13. The amplitude spectrum clearly shows several δ Sct frequencies, illustrating that Kepler is able to detect pulsations even for very faint targets.
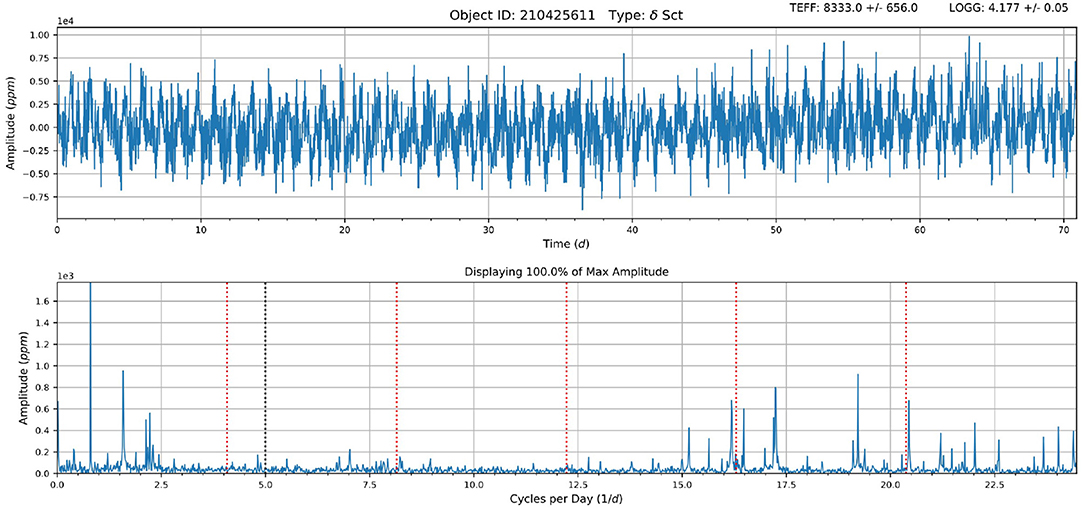
Figure 3. Light curve (Top) and amplitude spectrum (Bottom) for brightest δ Sct variable EPIC 210425611 (also known as h Tau, V483 Tau, and 57 Tau), with Kp magnitude 5.6, observed during C4. The red dashed vertical lines in the amplitude spectrum mark multiples of the spacecraft roll correction frequency, 4.075 c/d.
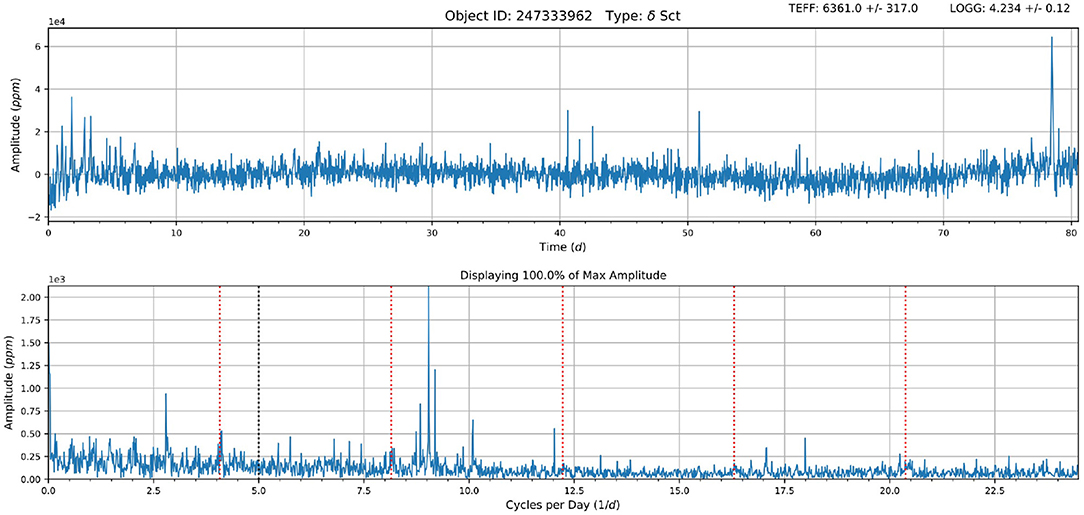
Figure 4. Light curve (Top) and amplitude spectrum (Bottom) for faintest δ Sct candidate, EPIC 247333962, with Kp magnitude 15.9, observed during C13.
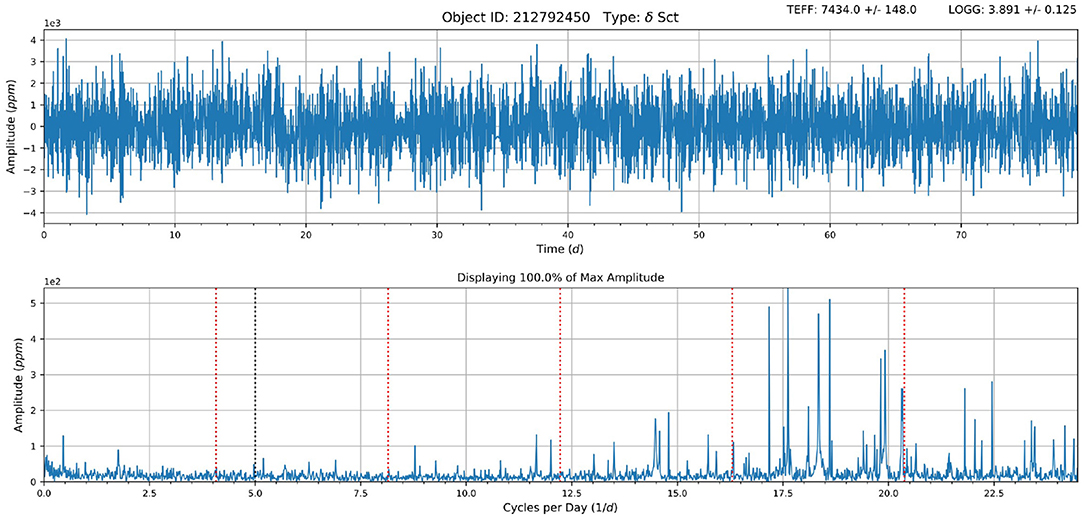
Figure 5. Light curve (Top) and amplitude spectrum (Bottom) for candidate with the largest number of δ Sct-type frequencies (over 30) visible by eye, EPIC 212792450, observed during C6.
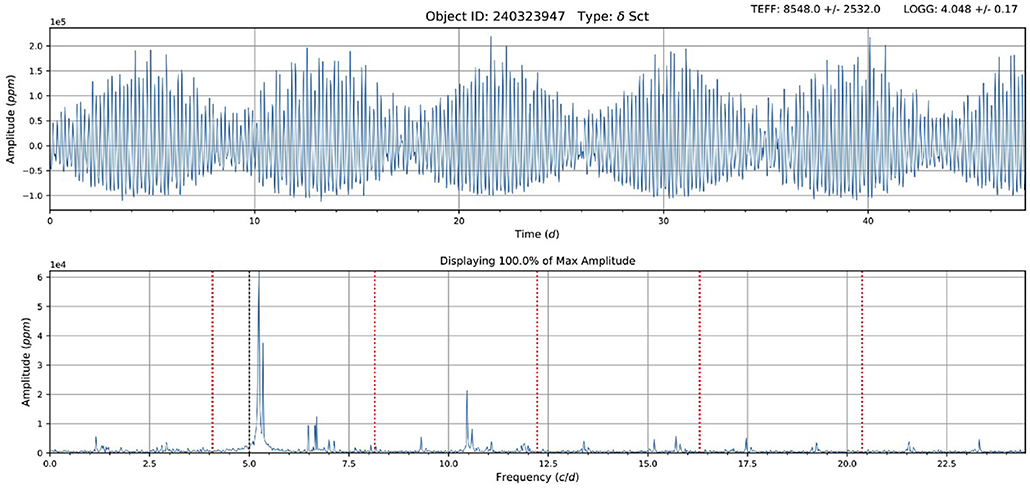
Figure 6. Light curve (Top) and amplitude spectrum (Bottom) for known high-amplitude δ Sct star, EPIC 240323947 (V974 Oph), observed during C11.
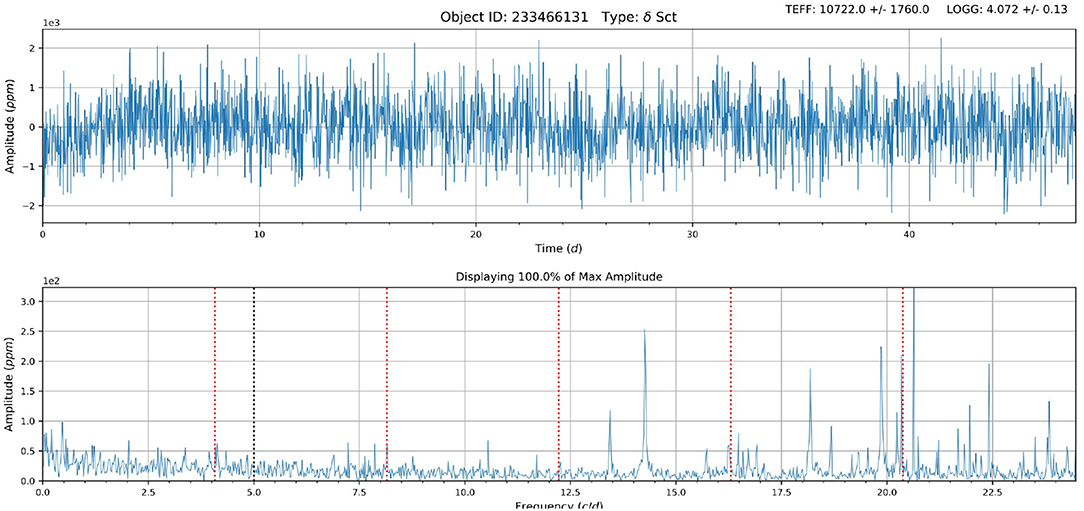
Figure 7. Light curve (Top) and amplitude spectrum (Bottom) for hottest δ Sct candidate, EPIC 233466131, observed during C11.
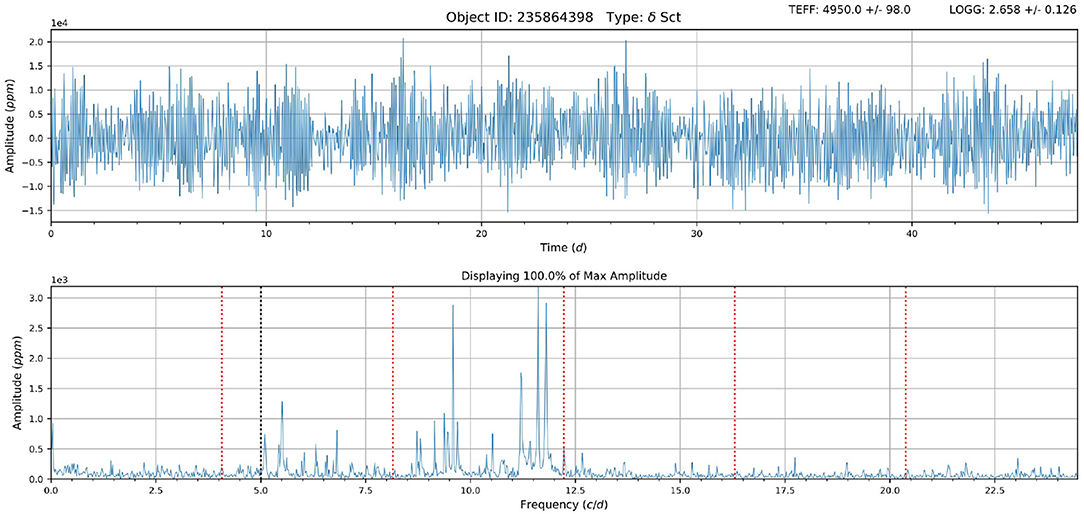
Figure 8. Light curve (Top) and amplitude spectrum (Bottom) for the coolest δ Sct candidate, EPIC 235864398, observed during C11.
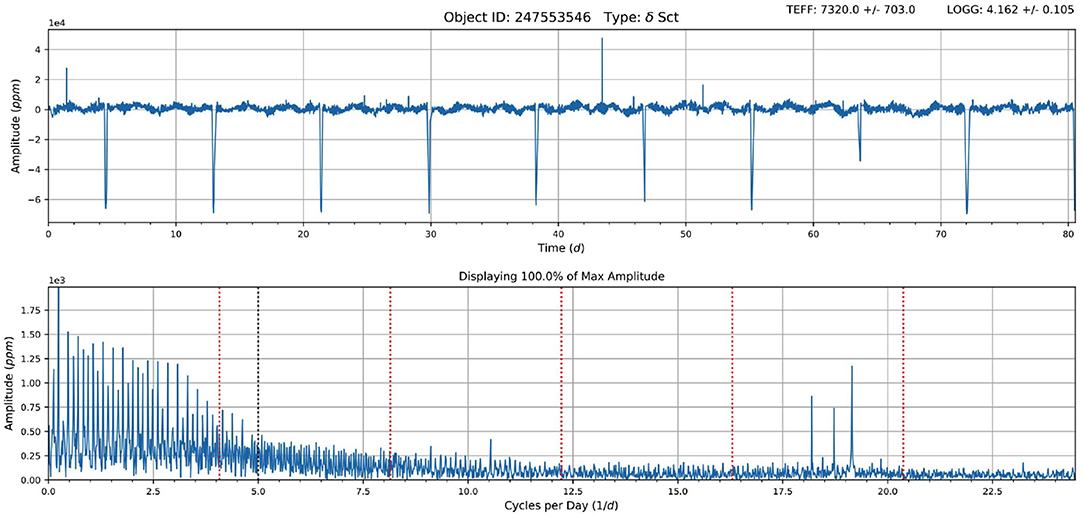
Figure 9. The light curve (Top) and amplitude spectrum (Bottom) of δ Sct candidate in an eclipsing binary, EPIC 247553546, observed during C13.
Figure 5 shows the light curve and amplitude spectrum for the candidate with the largest number of δ Sct-type frequencies visible by eye, EPIC 212792450, observed during C6. Figure 6 shows the highest-amplitude δ Sct variable, EPIC 240323947, observed during C11, with two modes of frequency just above 5 c/d beating against each other. This star is the known high-amplitude δ Sct star V974 Oph (Poretti, 2003).
Figure 7 shows the light curve and amplitude spectrum for the hottest δ Sct candidate, EPIC 233466131, observed during C11. This star, with EPIC catalog Teff 10,722 K, seems too hot to be a δ Sct variable, but is also too cool to be a β Cep p-mode pulsator. Figure 8 shows the light curve and amplitude spectrum for the coolest δ Sct candidate, EPIC 235864398, observed during C11. This star has Teff = 4950 K, a low surface gravity (log g = 2.68), and high luminosity, according to the EPIC catalog, and is likely evolving off of the main sequence. Finally, Figure 9 shows the light curve and amplitude spectrum of a δ Sct candidate in an eclipsing binary, EPIC 247553546, observed during C13.
For each of the 249 δ Sct candidates, Table 2 lists the EPIC catalog number, Kp magnitude, Teff, log g, alternate identifier in the SIMBAD Astronomical Database, number of references to the star in the literature from SIMBAD, and whether it is a known δ Sct variable. Most of the stars with Kp mag < 10 are not referenced beyond the EPIC catalog and have no alternate designation. However, many of the brighter stars have many references, and 17 are known δ Sct variables; these stars may be excellent candidates for asteroseismic analysis using the Kepler data. Not all of the candidates in Table 2 may turn out to be δ Sct stars. From the pulsation amplitude spectra alone they could be confused with, e.g., p-mode pulsating β Cep variables, or g-mode pulsating subdwarf B variables. However, β Cep variables typically have Teff of around 20,000 K, and so are hotter than the hottest stars in Table 2. The sdBV stars have Teff of 20,000–30,000 K, and log g ~ 5.2–5.8 (Heber, 2016), higher than the stars in Table 2. It is possible that the Teff and log g of the EPIC catalog are incorrect; Huber et al. (2016) use both color photometry and spectroscopy to derive the EPIC catalog values, taking into account systematic biases uncovered in the original Kepler input catalog, and quote uncertainties of ~ 3% for Teff (i.e., 210 K for a 7,000 K star), and 0.3 dex for log g. It is also possible that the K2 light curve data is contaminated by nearby stars, or that the stars are members of multiplets; deciphering these possibilities will require additional investigations.
Figure 10 shows distributions of properties from the EPIC catalog for the 249 δ Sct candidates. Most of the candidates have Kp magnitude between 8 and 12, but there are a significant number of faint candidates with Kp >14. The Teff distribution peaks at about 7,000 K, as expected for δ Sct variables, but there are a few somewhat hotter and cooler candidates. Most of the stars have metallicity [Fe/H] around 0, i.e., near solar; many have metallicities higher than solar, as would be expected for these variable candidates more massive and younger than the Sun. Some stars have a very low [Fe/H]; these stars could have formed from lower-metallicity material or may be showing abundance anomalies resulting from diffusive settling.
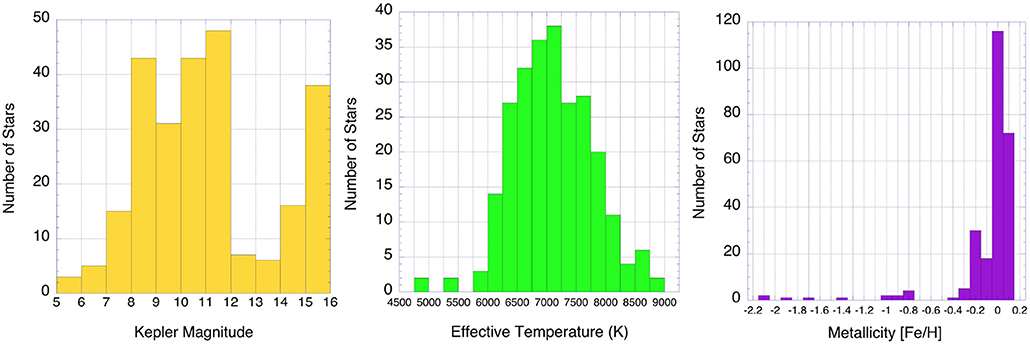
Figure 10. Kp magnitude (Left), Teff (Center), and metallicity [Fe/H] (Right) distributions of 249 δ Sct candidates, based on EPIC catalog quantities.
Figure 11 shows a Hertzsprung-Russell diagram of the 249 candidates, based on EPIC catalog luminosity and Teff values. Most of the stars lie along the main sequence, but a few appear to be evolving off of the main sequence. Figure 11 also shows the mass and distance distributions of the candidates, based again on EPIC catalog values. The mass distribution peaks at about 1.6 M⊙, typical for δ Sct variables. The distance distribution appears to have a bimodal structure, with most candidates nearby, but some at 1,000–2,000 pc, representing a population perhaps in a distant young cluster or Milky Way spiral arm.
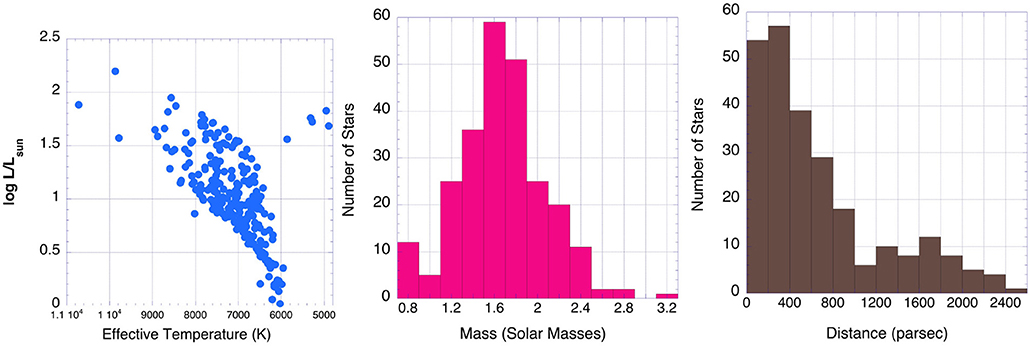
Figure 11. H-R diagram (Left), mass distribution (Center), and distance distribution (Right) of 249 δ Sct candidates, based on EPIC catalog quantities.
3. Results
For each δ Sct candidate, we counted by eye the number of modes with frequencies between 5 and 24.5 c/d having amplitude greater than about 4 × the local background level. We did not count frequencies that were very close to multiples of the 4.075 c/d (~6 hour) spacecraft roll correction frequency marked by red vertical dashed lines on the amplitude spectra (see, e.g., Figures 3–9). We also noted the amplitude and frequency with maximum amplitude, and flagged any candidates with more than one high-amplitude mode with frequency < 5 c/d, indicating a γ Dor/δ Sct hybrid candidate.
We created a Matlab algorithm to process the light curves, pre-whiten the δ Sct frequencies in order of the highest amplitude modes, and count the number of modes with signal/noise ratio > 6. The algorithm also searched for frequencies that were multiples of the spacecraft roll correction frequency, as well as frequencies that were combinations of a stellar frequency and the spacecraft roll correction frequency, thereby eliminating some spurious frequencies. Because the algorithm could identify frequencies with lower amplitudes than identifiable by eye, but also could eliminate more artifact combination frequencies, the algorithm sometimes counted more, but also sometimes fewer frequencies than counted by eye. The algorithm results generally agreed with the by-eye determination of the amplitude and frequency of the maximum-amplitude δ Sct mode, although it could quantify these values to higher accuracy than the by-eye estimate. The Matlab algorithm also identified and determined intrinsic and combination frequencies for later use in asteroseismic analyses.
Table 3 summarizes the number of modes with frequency > 5 c/d, and the amplitude and frequency of the maximum-amplitude mode, counted by eye and by using the Matlab script, for the 249 candidate δ Sct stars. The Table also flags the stars showing more than one low-frequency (< 5 c/d) mode that are hybrid candidates.
Figure 12 plots the distribution of the number of frequencies per star > 5 c/d (counted by eye), the distribution of amplitudes of highest-amplitude modes (excluding the two highest-amplitude candidates), and the distribution of frequencies having maximum amplitude for the 249 candidates. Most of the candidates have < 10 δ Sct modes, but some show more than 30 modes by eye, and up to 100 modes when counted using the Matlab algorithm; therefore these stars may yield the most useful constraints for asteroseismic studies. Most of the stars have maximum-amplitude mode < 2 parts per thousand that would be difficult to detect without long time-series, high-precision photometry such as obtained by Kepler. There does not seem to be any preferred frequency with maximum amplitude in the 5–24.5 c/d frequency range.
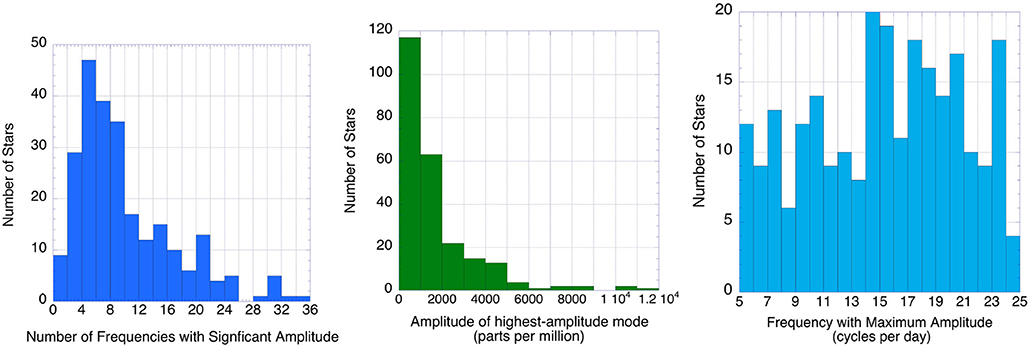
Figure 12. Distributions of number of frequencies per star > 5 c/d (Left), amplitude of maximum-amplitude mode (Center), and frequency of maximum-amplitude mode (Right) for 249 δ Sct candidates.
Figure 13 shows the number of frequencies counted by eye vs. the number found using the Matlab algorithm; as discussed earlier the Matlab pre-whitening algorithm is able to identify a larger number of significant frequencies, but also is able to find and remove more artifact frequencies. The middle panel shows the distribution of the number of frequencies > 5 c/d per star vs. Teff, and the last panel shows the distribution of amplitude of the maximum-amplitude frequency vs. Teff. It appears that stars with the largest amplitudes and the largest number of frequencies are found in the middle of the temperature range at about 7,000 K, i.e., in the middle of the δ Sct instability region.

Figure 13. Plot of number of modes per star with frequency > 5 c/d counted by eye vs. using Matlab algorithm (Left), number of frequencies per star vs. Teff (Center), and amplitude of maximum-amplitude mode vs. Teff (Right) for 249 δ Sct candidates.
4. Conclusions
Kepler has obtained unprecedented long time-series high signal-to-noise photometric data enabling the discovery and characterization of variable stars pulsating in many simultaneous radial and non-radial modes. We have identified 249 obvious δ Sct candidates so far in light curves collected as part of our K2 Guest Observer proposals for 11 (out of 19) campaigns of K2. Seventeen of these stars were already known as δ Sct stars, according to the SIMBAD database. 126 out of 249 candidates show low frequencies < 5 c/d and may be hybrid γ Dor/δ Sct pulsators. We do not find any correlations between pulsation properties (e.g., number of frequencies, frequency with maximum amplitude, etc.) and stellar properties (e.g., Teff, log g, . .), as listed in the EPIC catalog.
As stated by Bowman and Kurtz (2018), “The full scientific potential of studying δ Sct stars is as yet unrealized.” The δ Sct variables inspire many questions: Why are all of the frequencies expected by linear pulsation theory not observed? Why is it so difficult to find patterns or correlations between stellar properties and pulsation properties such as pulsation amplitudes and frequency content? Some correlations have been discussed in the literature, for example between stellar properties and mean frequency spacings, with the spacings interpreted as a large separation correlated with mean density, or possibly a rotational splitting frequency (see e.g., García Hernández et al., 2015; Paparó et al., 2016a,b; Moya et al., 2017; Bowman and Kurtz, 2018). Why do some stars in the instability regions not show pulsations (see, e.g., Balona, 2013; Murphy et al., 2015)? Why are there so many hybrid γ Dor/δ Sct variables scattered throughout the pre-Kepler theoretical instability regions of both stellar types? What determines the amplitudes of individual modes? Why do amplitudes or frequency content vary with time (Bowman et al., 2017; Breger et al., 2017)?
The Kepler and K2 data will be valuable for asteroseismic modeling to address these unsolved problems for A-F type main-sequence stars. Two questions that these K2 data will help to address are: If the star was known as a δ Sct being identified in the Kepler data, has its amplitudes or frequency content changed over time? Can additional frequencies be found using the high signal-to-noise data of Kepler/K2? The K2 targets are in general brighter than those in the original Kepler field, and are easier to observe using ground- or space-based spectroscopic and photometric observations, or other techniques such as interferometry, to provide long-term monitoring or additional constraints.
Author Contributions
JGu was responsible for the design, writing, content, figure, and table creation and selection for this paper. JGu was the author and Principle Investigator for the K2 GO proposals to obtain data used in this paper. JGa wrote the Python interface to plot light curves and amplitude spectra, classify targets, and create Figures 1–9. JGu used this interface to examine the data for each K2 target observed and to select the candidate δ Sct stars presented. JGu counted the number of frequencies and determined the amplitudes and frequency of the maximum-amplitude p mode by eye, and also reviewed each star using SIMBAD for alternate identifiers, descriptors of known variables, and number of references per star. JJ wrote the Matlab algorithm to pre-whiten spectra and count frequencies, search for combination frequencies, and determine amplitudes and frequency of the maximum-amplitude p mode.
Funding
JGu's research is supported at Los Alamos National Laboratory (LANL), managed by Triad National Security, LLC for the U.S. Department of Energy's NNSA, Contract #89233218CNA000001. JJ and JGa acknowledge support from NASA under cooperative agreement number NNX17AF74G.
Conflict of Interest Statement
The authors declare that the research was conducted in the absence of any commercial or financial relationships that could be construed as a potential conflict of interest.
Acknowledgments
The authors thank the K2 GO Program for the opportunity to propose targets, and for obtaining outstanding data over many years. The authors also made use of the MAST K2 EPIC target search and data archive, SIMBAD database, and K2 Field-of-View tool as implemented by the Kepler Asteroseismic Science Consortium. JGu thanks A. Pigulski for assistance with K2 GO proposals for C4, 5, and 7, observing open clusters. JGu thanks Reiner Friedel of the Center for Earth and Space Science at LANL and Chris Fryer (CCS-2, LANL) for support to attend the NM Astronomy Symposium in November 2018 to present this work, and the New Mexico Consortium for encouragement and assistance in preparing and submitting GO proposals. The authors also thank the reviewers for helpful comments and suggestions.
Footnotes
1. ^https://exoplanets.nasa.gov/news/1534/goodnight-kepler-final-commands-for-space-telescope
2. ^https://keplerscience.arc.nasa.gov/k2-approved-programs.html
3. ^https://archive.stsci.edu/k2/epic/search.php
4. ^http://kasoc.phys.au.dk/tools/k2fov
References
Aerts, C., Christensen-Dalsgaard, J., and Kurtz, D. W. (2010). “Astronomy and Astrophysics Library,” Asteroseismology (Heidelberg: Springer Science+Business Media B.V.).
Balona, L. A. (2013). “Activity in A-type stars,” in Progress in Physics of the Sun and Stars: A New Era in Helio- and Asteroseismology, ASP Conference Proceedings, Vol. 479, eds H. Shibahashi, and A. E. Lynas-Gray (San Francisco, CA), 385.
Balona, L. A. (2018). Gaia luminosities of pulsating A-F stars in the Kepler field. Month. Not. R. Astron. Soc. 479, 183–191. doi: 10.1093/mnras/sty1511
Borucki, W. J., Koch, D., Basri, G., Batalha, N., Brown, T., Caldwell, D., et al. (2010). Kepler planet-detection mission: introduction and first results. Science 327, 977–980. doi: 10.1126/science.1185402
Bowman, D. M., and Kurtz, D. W. (2018). Characterizing the observational properties of δ Sct stars in the era of space photometry from the Kepler mission. Month. Not. R. Astron. Soc. 476, 3169–3184. doi: 10.1093/mnras/sty449
Bowman, D. M., Kurtz, D. W., Breger, M., Murphy, S. J., and Holdsworth, D. L. (2017). Amplitude modulation in δ Sct stars: statistics from an ensemble of Kepler targets. Eur. Phys. J. Web Conf. 160:03008. doi: 10.1051/epjconf/201716003008
Breger, M., Montgomery, M. H., Lenz, P., and Pamyatnykh, A. A. (2017). Nonradial and radial period changes of the δ Scuti star 4 CVn. II. Systematic behavior over 40 years. Astron. Astrophys. 599:A116. doi: 10.1051/0004-6361/201629797
García Hernández, A., Martín-Ruiz, S., Monteiro, M. J. P. F. G., Suárez, J. C., Reese, D. R., Pascual-Granado, J., et al. (2015). Observational Δν-ρ relation for δ sct stars using eclipsing binaries and space photometry. Astrophys. J. Lett. 811:L29. doi: 10.1088/2041-8205/811/2/L29
Gilliland, R. L., Brown, T. M., Christensen-Dalsgaard, J., Kjeldsen, H., Aerts, C., Appourchaux, T., et al. (2010). Kepler asteroseismology program: introduction and first results. Public. Astron. Soc. Pac. 122:131. doi: 10.1086/650399
Grigahcène, A., Antoci, V., Balona, L., Catanzaro, G., Daszyńska-Daszkiewicz, J., Guzik, J. A., et al. (2010). Hybrid γ doradus-δ scuti pulsators: new insights into the physics of the oscillations from kepler observations. Astrophys. J. Lett. 713, L192–L197. doi: 10.1088/2041-8205/713/2/L192
Heber, U. (2016). Hot subluminous stars. Public. Astron. Soc. Pac. 128:082001. doi: 10.1088/1538-3873/128/966/082001
Howell, S. B., Sobeck, C., Haas, M., Still, M., Barclay, T., Mullally, F., et al. (2014). The K2 mission: characterization and early results. Public. Astron. Soc. Pac. 126:398. doi: 10.1086/676406
Huber, D., and Bryson, S. T. (2017). VizieR Online Data Catalog: K2 Ecliptic Plane Input Catalog (EPIC) (Huber+, 2017). Université de Strasbourg/CNRS.
Huber, D., Bryson, S. T., Haas, M. R., Barclay, T., Barentsen, G., Howell, S. B., et al. (2016). The K2 Ecliptic Plane Input Catalog (EPIC) and stellar classifications of 138,600 targets in campaigns 1-8. Astrophys. J. Suppl. Ser. 224:2. doi: 10.3847/0067-0049/224/1/2
Liakos, A., and Niarchos, P. (2017). Catalogue and properties of δ Scuti stars in binaries. Month. Not. R. Astron. Soc. 465, 1181–1200. doi: 10.1093/mnras/stw2756
Lundkvist, M. S., Huber, D., Silva Aguirre, V., and Chaplin, W. J. (2018). “Using asteroseismology to characterise exoplanet host stars,” in Handbook of Exoplanets, eds H. J. Deeg and J. A. Belmonte (Basal: Springer Nature), 1655–1678.
Moya, A., Suárez, J. C., García Hernández, A., and Mendoza, M. A. (2017). Semi-empirical seismic relations of A-F stars from COROT and Kepler legacy data. Month. Not. R. Astron. Soc. 471, 2491–2497. doi: 10.1093/mnras/stx1717
Murphy, S. J., Bedding, T. R., Niemczura, E., Kurtz, D. W., and Smalley, B. (2015). A search for non-pulsating, chemically normal stars in the δ Scuti instability strip using Kepler data. Month. Not. R. Astron. Soc. 447, 3948–3959. doi: 10.1093/mnras/stu2749
Murphy, S. J., Shibahashi, H., and Kurtz, D. W. (2013). Super-Nyquist asteroseismology with the Kepler Space Telescope. Month. Not. R. Astron. Soc. 430, 2986–2998. doi: 10.1093/mnras/stt105
Paparó, M., Benkő, J. M., Hareter, M., and Guzik, J. A. (2016a). Unexpected series of regular frequency spacing of δ scuti stars in the non-asymptotic regime. I. The Methodology. Astrophys. J. 822:100. doi: 10.3847/0004-637X/822/2/100
Paparó, M., Benkő, J. M., Hareter, M., and Guzik, J. A. (2016b). Unexpected series of regular frequency spacing of δ scuti stars in the non-asymptotic regime. II. Sample-echelle diagrams and rotation. Astrophys. J. Suppl. Ser. 224:41. doi: 10.3847/0067-0049/224/2/41
Poretti, E. (2003). Asteroseismology of HADS stars: V974 Oph, a radial pulsator flavoured by nonradial components. Astron. Astrophys. 409, 1031–1035. doi: 10.1051/0004-6361:20031223
Keywords: NASA Kepler mission, stars: δ Sct, stars: γ Dor, photometry, stars: variable, stars: main-sequence
Citation: Guzik JA, Garcia JA and Jackiewicz J (2019) Properties of 249 δ Scuti Variable Star Candidates Observed During the NASA K2 Mission. Front. Astron. Space Sci. 6:40. doi: 10.3389/fspas.2019.00040
Received: 16 January 2019; Accepted: 09 May 2019;
Published: 31 May 2019.
Edited by:
Jadwiga Daszynska-Daszkiewicz, University of Wrocław, PolandReviewed by:
Andrzej S. Baran, Pedagogical University of Kraków, PolandMargit Paparo, Konkoly Observatory (MTA), Hungary
Copyright © 2019 Guzik, Garcia and Jackiewicz. This is an open-access article distributed under the terms of the Creative Commons Attribution License (CC BY). The use, distribution or reproduction in other forums is permitted, provided the original author(s) and the copyright owner(s) are credited and that the original publication in this journal is cited, in accordance with accepted academic practice. No use, distribution or reproduction is permitted which does not comply with these terms.
*Correspondence: Joyce Ann Guzik, am95QGxhbmwuZ292
 Joyce Ann Guzik
 Jorge A. Garcia
 Jason Jackiewicz