 Geofrey Kapalaga1*
 Florence N. Kivunike1
 Susan Kerfua2Daudi Jjingo3,4
 Savino Biryomumaisho5Justus Rutaisire2
 Paul Ssajjakambwe2Swidiq Mugerwa2Yusuf Kiwala6
- 1Department of Information Technology, College of Computing and Information Sciences, Makerere University, Kampala, Uganda
- 2National Livestock Resources Research Institute, Kampala, Uganda
- 3African Center of Excellence in Bioinformatics (ACE-B), Makerere University, Kampala, Uganda
- 4Department of Computer Science, College of Computing and Information Sciences, Makerere University, Kampala, Uganda
- 5College of Veterinary Medicine, Animal Resources and Bio-Security, Makerere University, Kampala, Uganda
- 6College of Business and Management Sciences, Makerere University, Kampala, Uganda
In Uganda, the absence of a unified dataset for constructing machine learning models to predict Foot and Mouth Disease outbreaks hinders preparedness. Although machine learning models exhibit excellent predictive performance for Foot and Mouth Disease outbreaks under stationary conditions, they are susceptible to performance degradation in non-stationary environments. Rainfall and temperature are key factors influencing these outbreaks, and their variability due to climate change can significantly impact predictive performance. This study created a unified Foot and Mouth Disease dataset by integrating disparate sources and pre-processing data using mean imputation, duplicate removal, visualization, and merging techniques. To evaluate performance degradation, seven machine learning models were trained and assessed using metrics including accuracy, area under the receiver operating characteristic curve, recall, precision and F1-score. The dataset showed a significant class imbalance with more non-outbreaks than outbreaks, requiring data augmentation methods. Variability in rainfall and temperature impacted predictive performance, causing notable degradation. Random Forest with borderline SMOTE was the top-performing model in a stationary environment, achieving 92% accuracy, 0.97 area under the receiver operating characteristic curve, 0.94 recall, 0.90 precision, and 0.92 F1-score. However, under varying distributions, all models exhibited significant performance degradation, with random forest accuracy dropping to 46%, area under the receiver operating characteristic curve to 0.58, recall to 0.03, precision to 0.24, and F1-score to 0.06. This study underscores the creation of a unified Foot and Mouth Disease dataset for Uganda and reveals significant performance degradation in seven machine learning models under varying distributions. These findings highlight the need for new methods to address the impact of distribution variability on predictive performance.
1 Introduction
Foot and Mouth Disease (FMD) is a highly contagious disease primarily affecting cloven-hoofed animals such as cattle, pigs, sheep, and goats (Udahemuka et al., 2020; Chepkwony et al., 2021). FMD is caused by an aphthovirus of the family Picornaviridae, inducing fever and blister-like sores in the mouth and feet of susceptible animals (Childs et al., 2022). While adult animals usually survive, morbidity rates can reach 100% in susceptible populations, especially among young livestock (Bertram et al., 2020; Rodríguez-Habibe et al., 2020). Clinical symptoms include vesicles or blisters on the tongue, hooves, mouth, and udder, leading to lameness and reduced appetite (Alexandersen et al., 2019; Clemmons et al., 2021).
In the endemic setting of Uganda, FMD has persisted as a significant challenge for over 60 years (Munsey et al., 2019), leading to a 23% decline in income for livestock stakeholders at the processing level, along with reductions in market values of bulls and cows by 83 and 88%, respectively (Baluka, 2016). Despite implementing traditional intervention methods such as vaccination campaigns, quarantine measures, and movement restrictions, the country continues to face significant challenges in effectively mitigating the impact of FMD (Kerfua et al., 2018; Mwiine et al., 2019; Velazquez-Salinas et al., 2020). Figure 1 shows FMD prevalence between 2011 and 2022 across the districts of Uganda. The insufficient preparedness, partly due to lack of timely and accurate information on potential outbreaks, hinders the country’s response efforts (Munsey et al., 2019; Mwiine et al., 2019). The absence of such information undermines continuous monitoring of FMD for early detection and efficient distribution of resources, thereby greatly affecting the overall effectiveness of FMD control efforts (Munsey et al., 2019). This obstacle obstructs the country’s progress within the global Progressive Control Pathway for Foot and Mouth Disease (PCP-FMD) framework, aimed at assisting endemic countries reduce the impact of FMD by progressively increasing the level of control through development of risk-based control strategies (Sumption et al., 2012). The country remains at stage 2 of the 5 PCP-FMD framework (FAO, 2018), where early-warning systems are recommended for enhancing preparedness through continuous surveillance, enabling early detection of FMD and optimal resource allocation (Munsey et al., 2019).
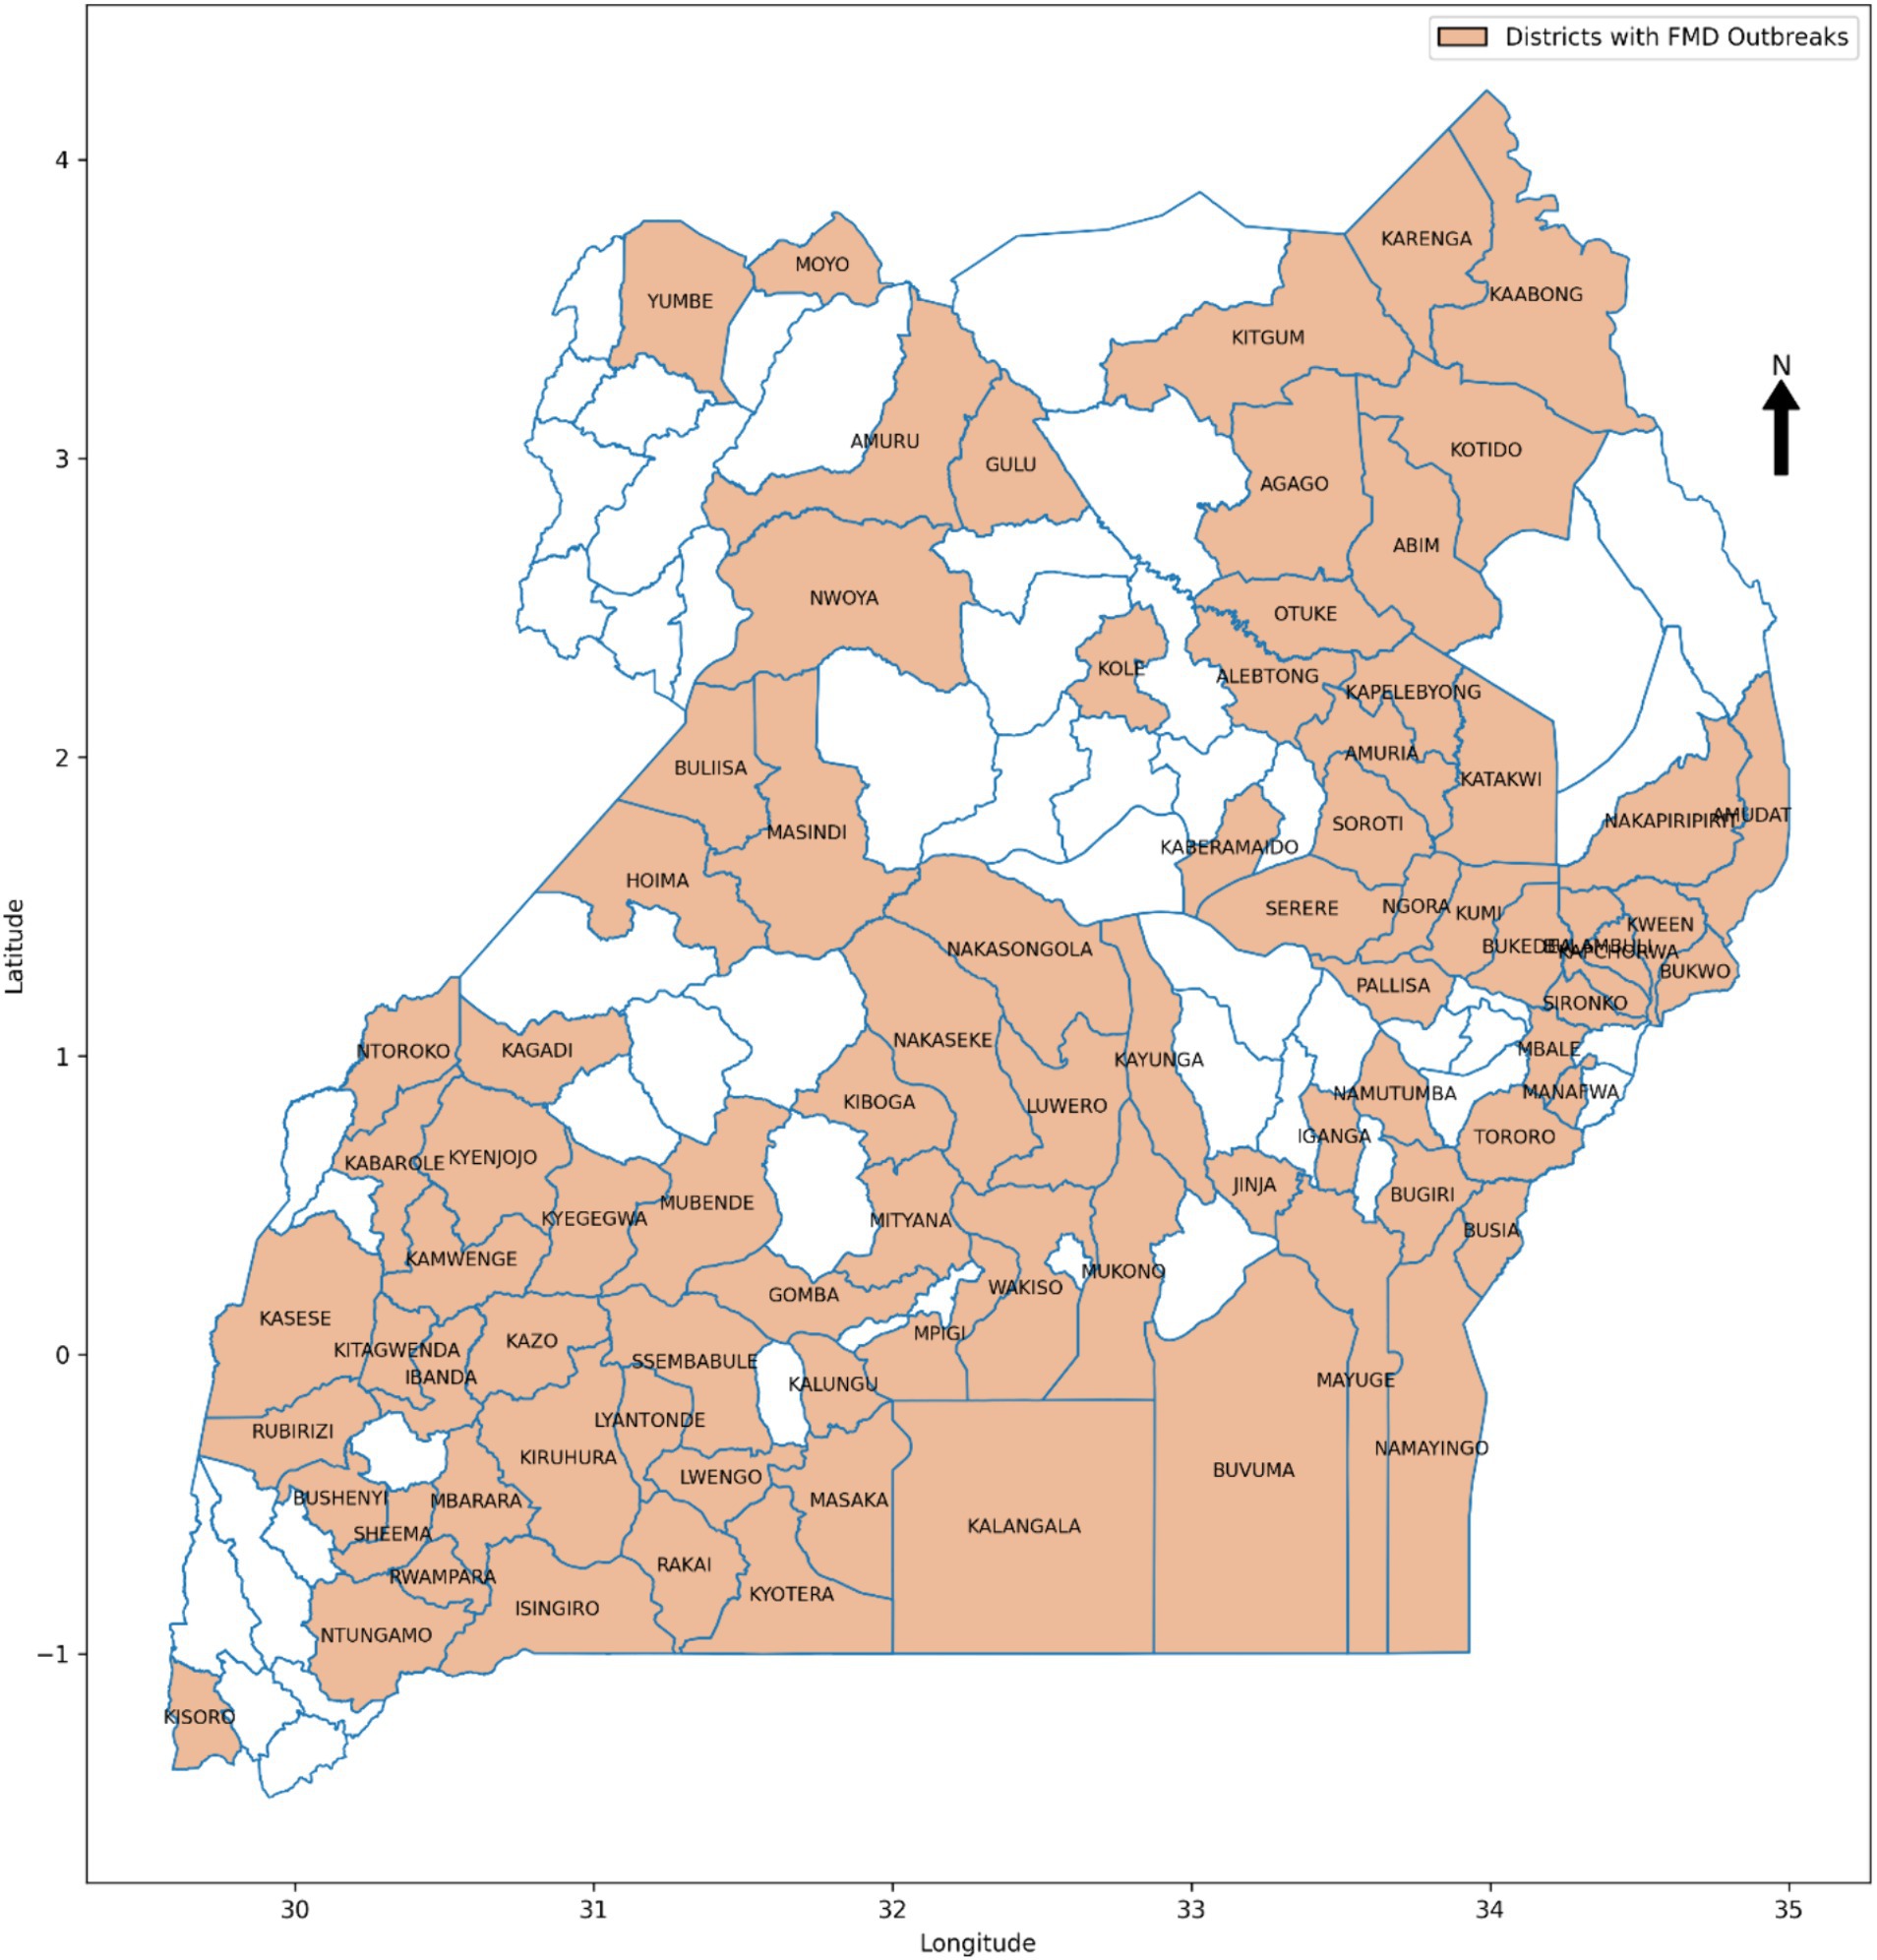
Figure 1. Prevalence of FMD outbreaks in Uganda between 2011 and 2022.
Enhancing Foot and Mouth Disease (FMD) preparedness is essential to mitigate the impact of outbreaks (Yadav et al., 2020). Machine learning (ML)-based predictive modeling has shown promise in enabling early detection and optimal resource allocation for outbreak prevention and control (Punyapornwithaya et al., 2022). However, these models have been typically trained and tested in stationary environments where training and test data distributions are similar (Punyapornwithaya et al., 2022; Sueabua and Seresangtakul, 2023), neglecting the effects of varying distributions on predictive performance. The lack of empirical evidence on how ML models for FMD outbreaks perform under varying conditions presents a significant research gap. This gap is critical for policy makers in dynamic settings of Uganda, where key risk factors including rainfall and temperature (Munsey et al., 2019), influenced by climate change (Nsubuga and Rautenbach, 2018), exhibit distribution variability. Additionally, FMD outbreak data and influencing factors are dispersed across multiple sources (Kerfua et al., 2018; Obubu et al., 2021), complicating the creation of comprehensive and high-performing predictive models. This study aims to fill these gaps by (1) creating a unified and curated FMD dataset for Uganda, and (2) assessing the predictive performance degradation rates of ML models under varying distributions. The study makes several significant contributions:
• Provides a valuable unified dataset for future research.
• Offers insights into the impact of varying distribution on ML model performance, underscoring the need for adaptive approaches in changing environmental conditions.
The rest of the paper is structured as follows: Section 2 details comprehensive literature; Section 3 focuses on the methodology; Section 4 presents the study results; Section 5 discusses the findings; and Section 6 provides conclusions for the study.
2 Literature review
In this section, the study reviews related literature on the key factors influencing FMD in Uganda and across the African continent, identifies data sources, and examines prior research on the application of ML algorithms in predicting FMD for improved preparedness.
2.1 Risk factors influencing FMD outbreaks
The disease transmission occurs through contact with infected animals, secretions, or contaminated environments, as well as through aerosols, facilitating long-distance spread (Paton et al., 2018; Poonsuk et al., 2018; Brown et al., 2022). Contact with wildlife is another risk factor for FMD occurrence (Munsey et al., 2019). While the African buffalo, Syncerus caffer, is the only confirmed wildlife reservoir (Dubie and Negash, 2021), transmission occurs when livestock share grazing land or water points with wildlife, especially during the dry season when pastures and water become scarce (Miguel et al., 2017). Similarly, several studies, including Hamoonga et al. (2014), Hasahya et al. (2023), Jemberu et al. (2016), Munsey et al. (2019), and Sinkala et al. (2014), have stressed the significance of animal movements in disease spread. Additionally, research by Chimera et al. (2022), Dubie and Negash (2021), Fasina et al. (2013), Hamoonga et al. (2014), Jemberu et al. (2016), Jenbere et al. (2011), and Munsey et al. (2019) has highlighted the impact of animal density and demographics on transmission dynamics. Furthermore, environmental conditions, including temperature, and rainfall play a crucial role in FMD outbreaks, as shown by studies conducted by Ayebazibwe et al. (2010), Baluka et al. (2013), Molla et al. (2013), Hamoonga et al. (2014), Wungak et al. (2016), Abdela (2017), Munsey et al. (2019), Udahemuka et al. (2020), Kerfua et al. (2021), and Chimera et al. (2022). FMD impacts approximately 77% of the global livestock population (Bachanek-Bankowska et al., 2018; Zewdie et al., 2023), with seven known serotypes of the FMD virus: A, O, C, Asia 1, SAT 1, SAT 2, and SAT 3, causing varying distributions across regions (Jamal and Belsham, 2018; Paton et al., 2021; Salem et al., 2021). The low-income and middle-income countries bear 75% of the costs associated with preventing and controlling FMD, with Africa and Eurasia accounting for 50 and 33% of the total expenses, respectively (World Organization for Animal Health, 2024).
2.2 Absence of a unified and curated FMD dataset for Uganda
Historical FMD data for Uganda, collected over the past 60 years, is stored at the National Animal Disease Diagnostic and Epidemiology Centre (NADDEC) and the World organization for Animal Health (WOAH). This data includes key features such as the time and location of outbreaks, confirmed cases, animals at risk, and total animal density. Data on risk factors reported to influence FMD occurrences, such as rainfall and temperature, are maintained by the Uganda National Meteorological Authority (UNMA). Additional factors, including proximity to protected areas and international borders, can be accessed from various sources including the Pennsylvania State University. Despite prior literature identifying these critical factors (Ayebazibwe et al., 2010; Baluka et al., 2013; Abdela, 2017; Munsey et al., 2019; Kerfua et al., 2021), there remains a lack of a comprehensive, integrated, and curated dataset for predicting potential FMD outbreaks in Uganda. The existing data is fragmented across multiple organizations, hindering the development of effective predictive models. Therefore, this study aims to access data on historical FMD outbreaks and relevant risk factors, preprocess and integrate them into a unified and curated dataset. This dataset will be used for training, testing, and validating ML-based models to predict FMD outbreaks in Uganda. By creating a comprehensive dataset, the study seeks to enhance the performance and reliability of predictive modeling, ultimately improving FMD preparedness and response strategies in the country.
2.3 Machine learning-based prediction of diseases under stationary environment
In disease prediction, machine learning approaches are increasingly utilized across diverse fields. Uddin et al. (2019) conducted a comprehensive literature review encompassing various studies that examined supervised learning methods including Logistic Regression (LR), Decision Trees (DT), Random Forest, Support Vector Machines (SVM), Naïve Bayes, K-nearest neighbors (kNN), and Artificial Neural Networks (ANN) for predicting diseases including heart disease, diabetes, Parkinson’s disease, and breast cancer. Their focus centered on studies employing multiple supervised machine learning algorithms within the same research context for disease prediction. Their findings highlighted the frequent application of the Support Vector Machine algorithm in 29 studies and the Naïve Bayes algorithm in 23 studies. However, despite this prevalence, the Random Forest algorithm demonstrated notably higher performance. Among the 17 studies employing Random Forest, it exhibited the highest accuracy in 53% of cases, surpassing SVM, which achieved the highest accuracy in 41% of the studies it was involved in.
In another study, Carslake et al. (2020) leveraged machine learning and wearable sensor technology to monitor multiple behaviors in pre-weaned dairy calves. Through an AdaBoost ensemble learning algorithm, the research achieved high performance in identifying behaviors including locomotor play, self-grooming, feeding, and lying activity. Additionally, the study introduced an adjusted count quantification method specifically tailored to estimate the prevalence of locomotor play behavior. While showcasing substantial accuracy in behavior identification up to (99.73%), the quantification estimates revealed a notable correlation with the true prevalence of behaviors, albeit with a slight overestimation around (18.97%). This novel approach utilizing machine learning for behavior identification and quantification in calves using wearable sensors offers significant potential to assess calf health and welfare.
In the prediction of FMD outbreaks for enhanced preparedness, Punyapornwithaya et al. (2022) explored ML algorithms to identify FMD outbreaks in the endemic setting of Thailand. In their study, algorithms, including classification trees, random forests, and Chi-squared automatic interaction detection (CHAID), were equipped with external risk factors as input variables. The results of the study were highly promising under stationary environment. Notably, the random forest model stood out, showcasing a remarkable predictive capability with an accuracy rate of 74%. Furthermore, it achieved the highest area under the operating characteristic curve (AUC) at 0.83 as shown in Table 1. Similarly, another study conducted by Sueabua and Seresangtakul (2023) also utilized machine learning techniques, such as support vector machines, decision trees, and artificial neural networks, to predict FMD outbreaks in the Nakhon Ratchasima province of Thailand. This research employed risk factors like rainfall, temperature, animal purchases in an animal market, sick animals in the month, and the percentage of vaccinated animals as input variables in the model development process. To address imbalanced datasets, the researchers applied the synthetic minority oversampling technique (SMOTE) to oversample the minority class, a common approach to mitigate class imbalance. The experimental results were quite promising, with the decision tree model adjusted for the imbalanced data, outperforming other models with an impressive accuracy rate of 98.86% as indicate in Table 1. However, like the previous study, the evaluation was based on a test dataset with a distribution similar to the training dataset as illustrated in Figure 2.
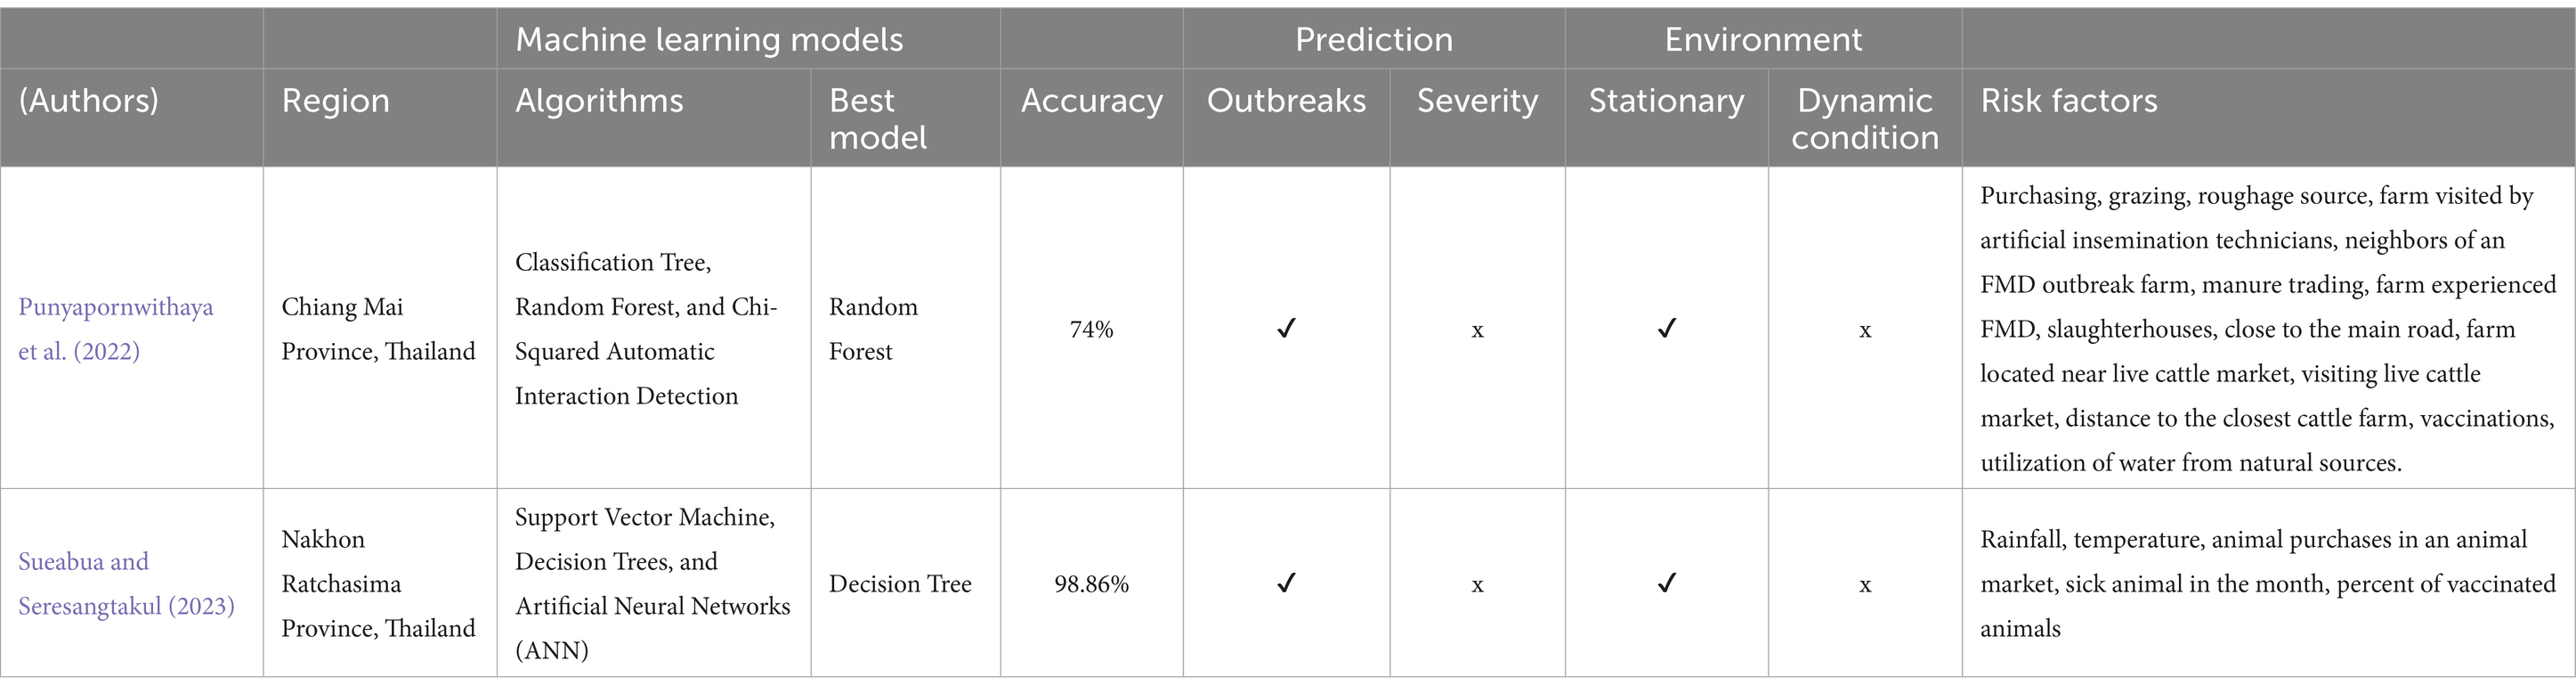
Table 1. Previous studies on machine learning-based prediction of FMD.
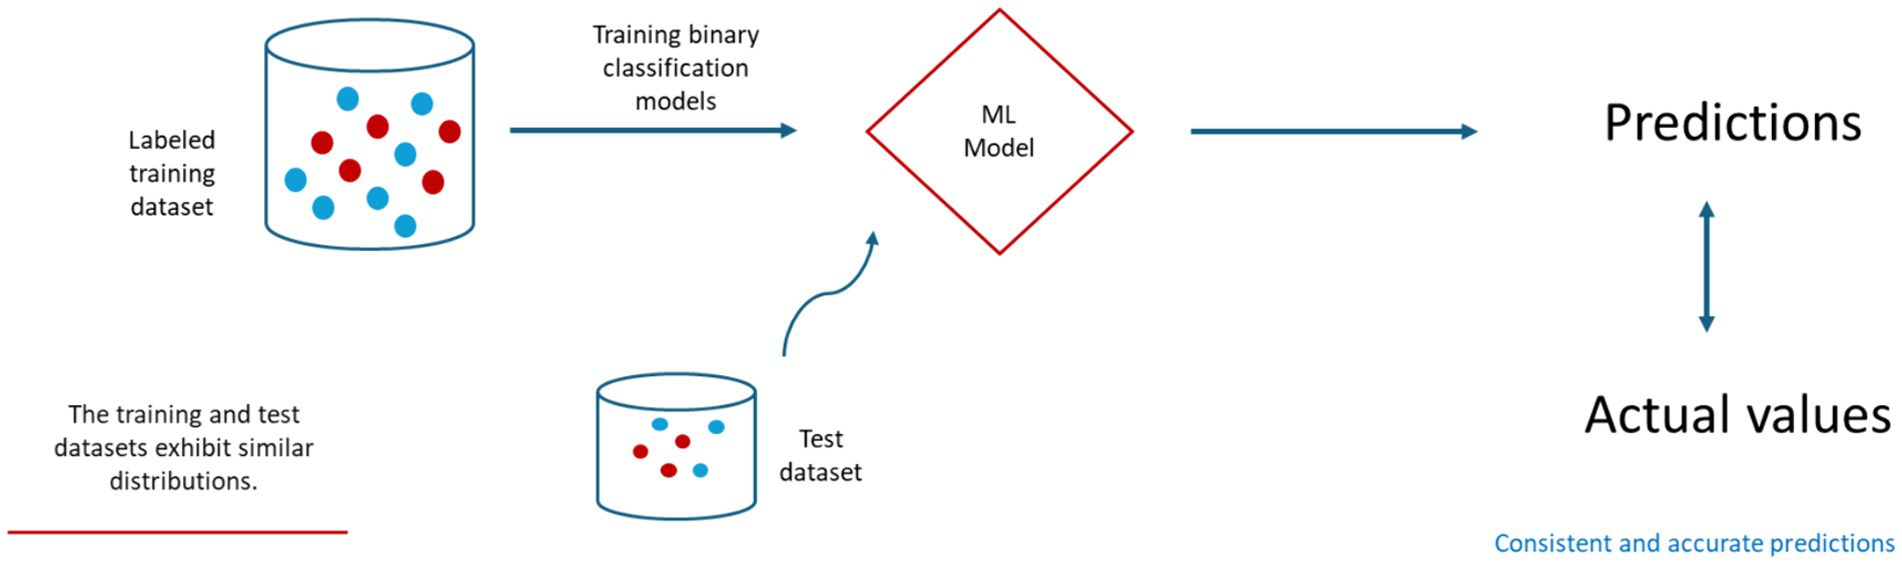
Figure 2. A general framework for training and testing ML-based prediction models for FMD under stationary environment.
The findings emphasize machine learning models’ vital role in predicting outbreaks for better disease management. However, their reliance on the independently identically distributed data assumption creates vulnerability to distribution shifts, limiting their use in new environments and affecting global disease mitigation efforts. Despite previous studies exploring machine learning for FMD prediction, they often overlooked varying distributions, a known concern in the field. The potential occurrence of these distribution variability over time may affect model performance, making them unreliable for FMD outbreak prediction. Given the disease’s rapid spread and impact on the livestock industry, timely intervention is crucial. Therefore, investigating distribution shifts in FMD datasets and their impact on machine learning methods is critical in developing adaptive models capable of accurate predictions, enhancing preparedness against FMD’s rapid spread.
3 Materials and methods
3.1 Utilizing the experimental design to conduct the study
To achieve the research objectives of developing a unified and curated FMD dataset and assess predictive performance degradation rates under varying distributions in Uganda, the study adopted an experimental research design. Experimental research design in ML entails a systematic methodology for planning, executing, and analyzing experiments to assess the performance of ML models while minimizing biases, noise, and distribution mismatch (Kamiri and Mariga, 2021). By adhering to a well-defined experimental design, the study can make informed decisions regarding the ML models, leading to improved performance and a deeper comprehension of the underlying mechanisms. Figure 3 outlines the experimental methodological approach with various phases for conducting experiments to meet the specified objectives in this study. The phases include Literature review, Data collection, Data pre-processing, Model training, Model testing, and Model evaluation.
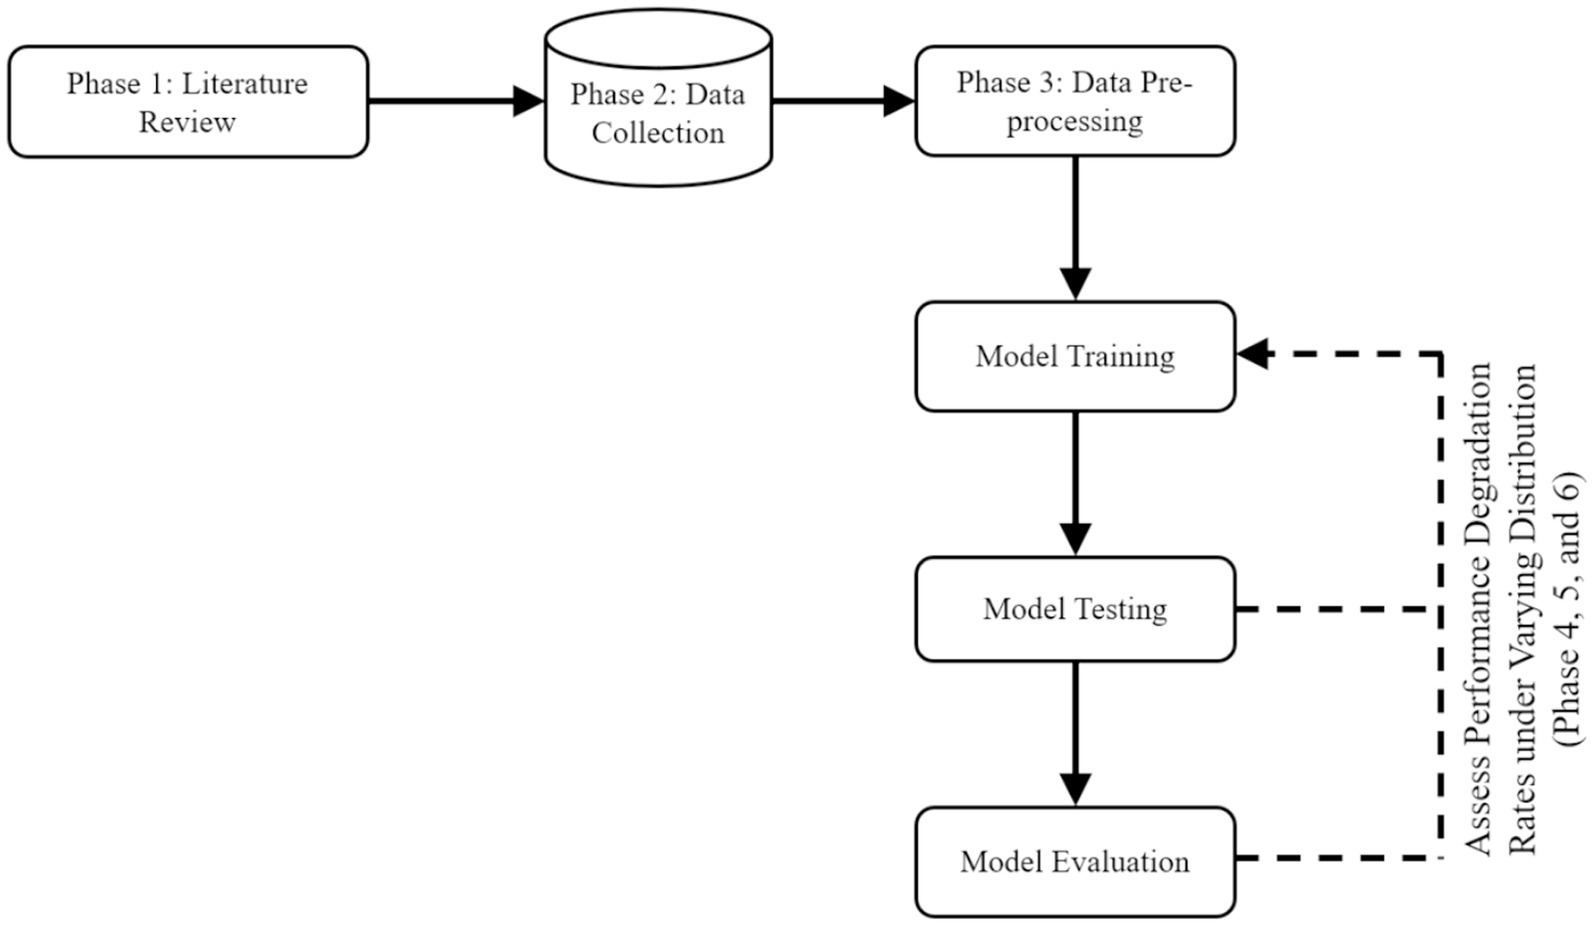
Figure 3. An experimental methodology to guide the study.
In this study, six phases depicted in Figure 3 were carried out across six key activities. Phase 1 (section 3.1.1) encompasses the activities of identifying a research problem and data sources. Phase 2 (section 3.1.2) focuses on data acquisition and compilation. Phase 3 (section 3.1.3) involves data cleaning and integrating disparate datasets into a unified and curated dataset. Phase 4 (section 3.1.4) involves training seven ML-based models. Phase 5 (section 3.1.5) entails testing the predictive performances of the seven trained models. Phase 6 (section 3.1.6) focuses on evaluating the predictive performances of the trained seven models using validation set. Table 2 provides a summary of these phases, key activities, accomplished study objectives, methods, and descriptions illustrating how the methods were employed to achieve the objectives. In the following sections, the study discusses in detail how the various phases are executed to achieve the study objectives.
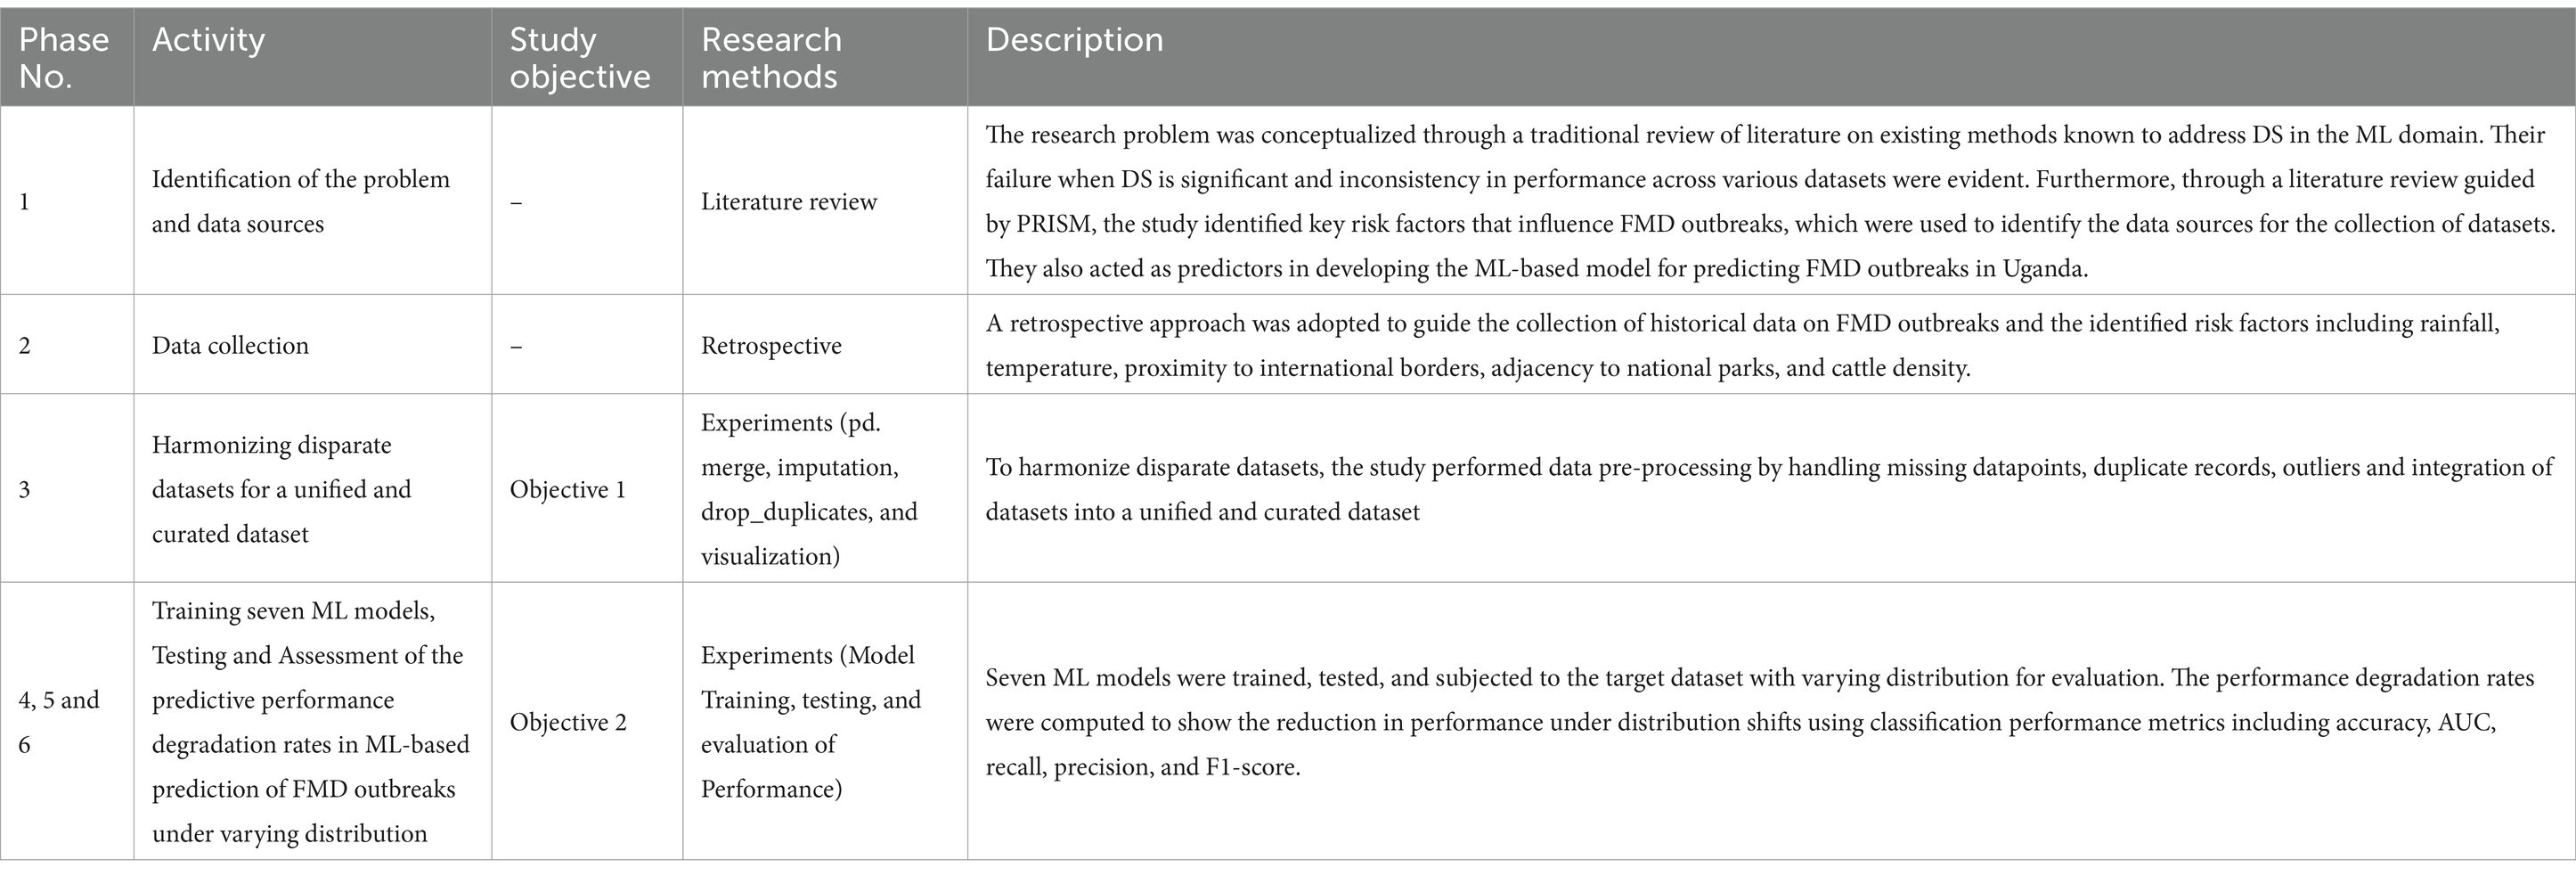
Table 2. A summary of the research phases, objectives, and methods for achieving the research objectives.
3.1.1 Phase 1: literature review
In Phase 1, the study conducted a traditional literature review to identify the research problem and a systematic literature review, guided by the Preferred Reporting Items for Systematic Reviews and Meta-Analyses (PRISMA) framework, to identify the risk factors influencing FMD outbreaks, as discussed in the following sections.
3.1.1.1 Identification of research problem and risk factors
This phase largely involved conducting a traditional and systematic literature review, as reported in section 2 Literature Review. The study highlighted the inadequacy in FMD preparedness and the potential of ML to generate predictive information for continuous surveillance, enabling early detection and optimal allocation of resources. Furthermore, the study identified absence of a unified and curated FMD dataset as an obstacle in developing ML-based predictive models. Additionally, the study identified the uncertainty aspect on the extent of performance degradation that can be caused by varying distribution in key risk factors including rainfall and temperature. While previous research has made significant advancements in ML-based prediction of FMD outbreaks (Punyapornwithaya et al., 2022; Sueabua and Seresangtakul, 2023), the focus on stationary environments renders such predictions vulnerable to unexpected distribution shifts. Therefore, this study investigated the extent to which varying distribution can have on the ML-based predictive performance for FMD outbreaks in Uganda. Based on this research gap identified through comprehensive literature review, research objectives were formulated. In addition, this phase identified crucial risk factors influencing FMD outbreaks, such as rainfall, temperature, proximity to protected areas, proximity to international borders, and cattle density (Figure 4). The circled factors (Figure 4) were utilized to identify data sources (Table 3) and acted as predictors in constructing the predictive model. Furthermore, the study utilized a descriptive statistical approach, leveraging Python 3.11.4 with Jupyter Notebook 7.0.0. Python libraries, particularly Pandas and Matplotlib, were instrumental in data handling, analysis, and visualization.
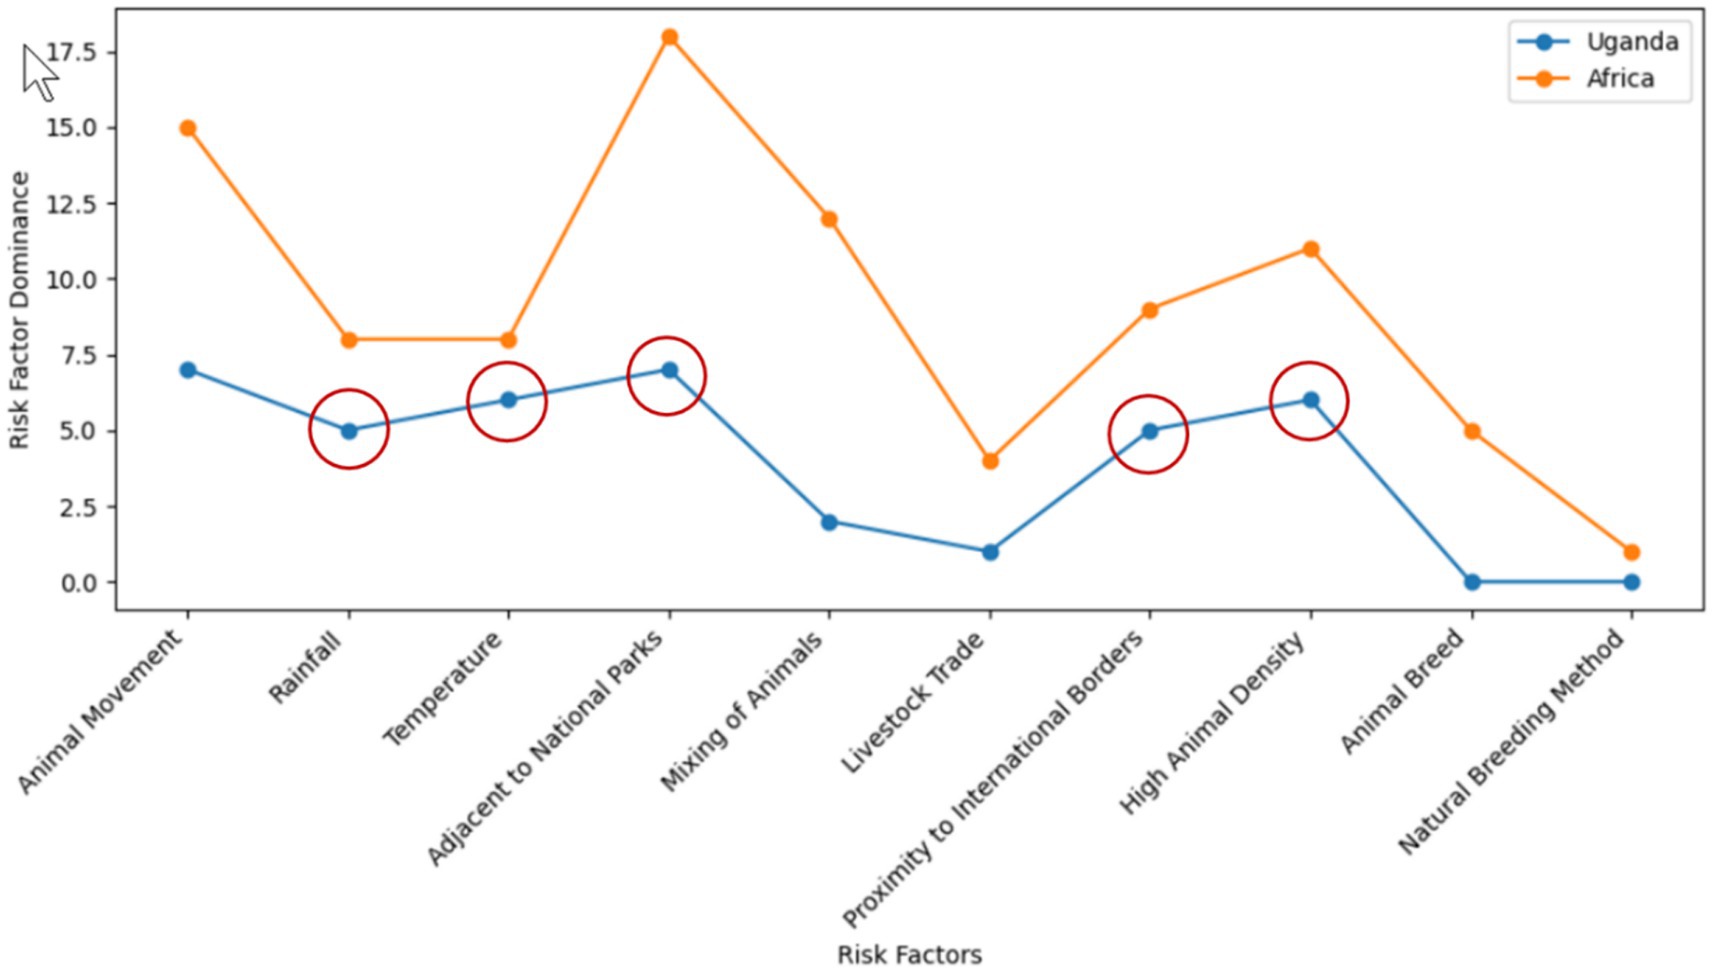
Figure 4. Visualization of FMD risk factors across Africa and the specific setting of Uganda.
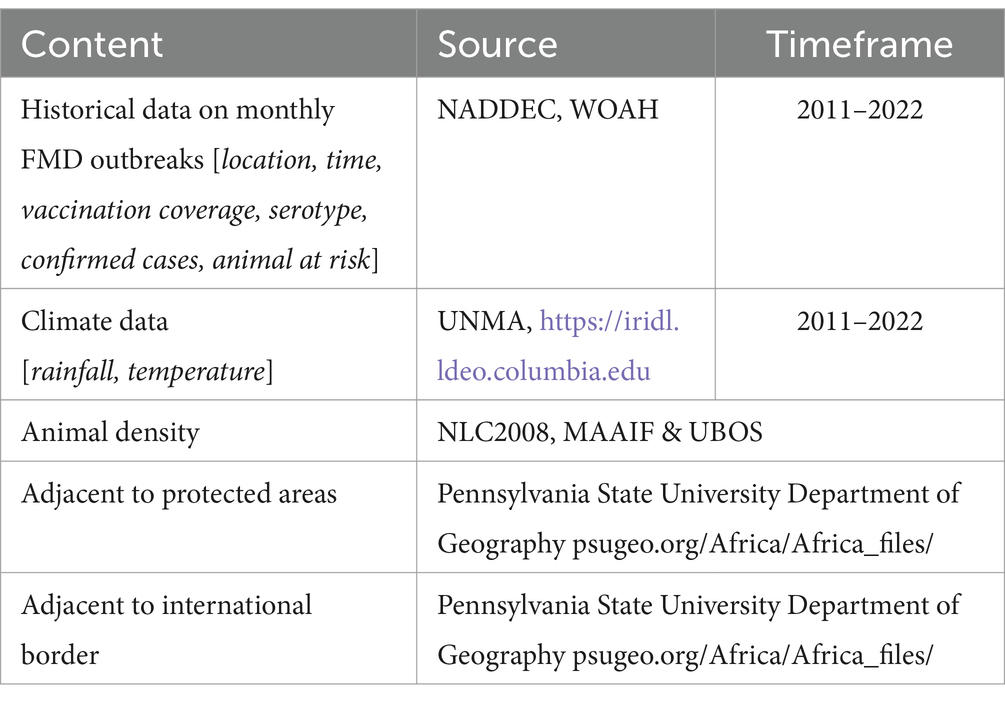
Table 3. FMD risk factors and data sources.
3.1.2 Phase 2: data collection
Uganda, situated in East Africa, is a landlocked country bordered by Kenya to the east, Tanzania to the south, Rwanda to the southwest, South Sudan to the north, and the Democratic Republic of Congo to the west. Positioned near the equator, Uganda spans diverse landscapes, encompassing expansive savannahs, dense forests, and the towering Rwenzori Mountains. With a latitude range of approximately 1°N to 4°N and a longitude between 29°E and 35°E, Uganda experiences a tropical climate, fostering a wide array of flora and fauna. The country’s diverse topography and climates contribute to varied ecological conditions, potentially affecting disease transmission dynamics (Munsey et al., 2019). From the lush vegetation of the southern regions to the arid landscapes in the north, these geographic and climatic diversities can significantly influence the occurrence and spread of FMD outbreaks, underscoring the importance of a comprehensive approach to disease prediction and control strategies within the country.
The study utilized a retrospective approach to guide the data collection process. The choice is justified by the approach’s ability to access historical information spanning a significant period, providing a rich dataset crucial for training and validating the ML-based predictive model for FMD. The study gathered an extensive dataset, spanning the period from 2011 to 2022 and encompassing various critical sources of information (Table 3). From 2011 to 2022, FMD outbreaks were confirmed in 86 districts across the country, as shown in Figure 1, with their prevalence detailed in Supplementary Figure 1. The historical FMD outbreak data were obtained from reputable sources, including the NADDEC and WOAH. The dataset contained essential details such as outbreak locations, timing of occurrence, and confirmed cases. Additionally, the study incorporated climatic factors by including rainfall and temperature data from the Uganda National Meteorological Authority (UNMA). Furthermore, to account for livestock-related factors, the utilized data from the National Livestock Census 2008 (NLC2008), jointly conducted by the Ministry of Agriculture, Animal Industry, and Fisheries (MAAIF) and the Uganda Bureau of Statistics (UBOS). The data provided valuable insights into livestock population densities across different regions. Moreover, the study collected geographical information concerning areas adjacent to protected wildlife zones and international borders from the Pennsylvania State University Department of Geography psugeo.org/Africa/Africa_files/, as these geographical features significantly influence FMD transmission dynamics. The FMD risk factors and their corresponding data sources are shown in Table 3.
3.1.2.1 Data sampling
Various data sampling techniques exist in data science, each suitable for different research needs (Bhardwaj, 2019; Sarker and Al-Muaalemi, 2022). This study leveraged the insights gained from the dominance of FMD outbreaks across the districts of Uganda, as illustrated in Supplementary Figure 1, 22 districts were purposively selected for inclusion (Figure 5). Specifically, the circled districts with the highest frequency of outbreaks during the study period of 2011–2022 were prioritized (Supplementary Figure 1). This approach ensured that the ML-based models had access to a substantial amount of data, which is crucial for their performance. Additionally, it helped avoid high imbalanced datasets that could negatively impact ML performance, especially in districts with fewer outbreaks. Moreover, research indicates that dominant districts, often referred to as hotspots, serve as sources of outbreaks that spread to other districts. Therefore, by focusing on these dominant districts, the study aimed to facilitate generalization to other districts and enhance the predictive model’s applicability.
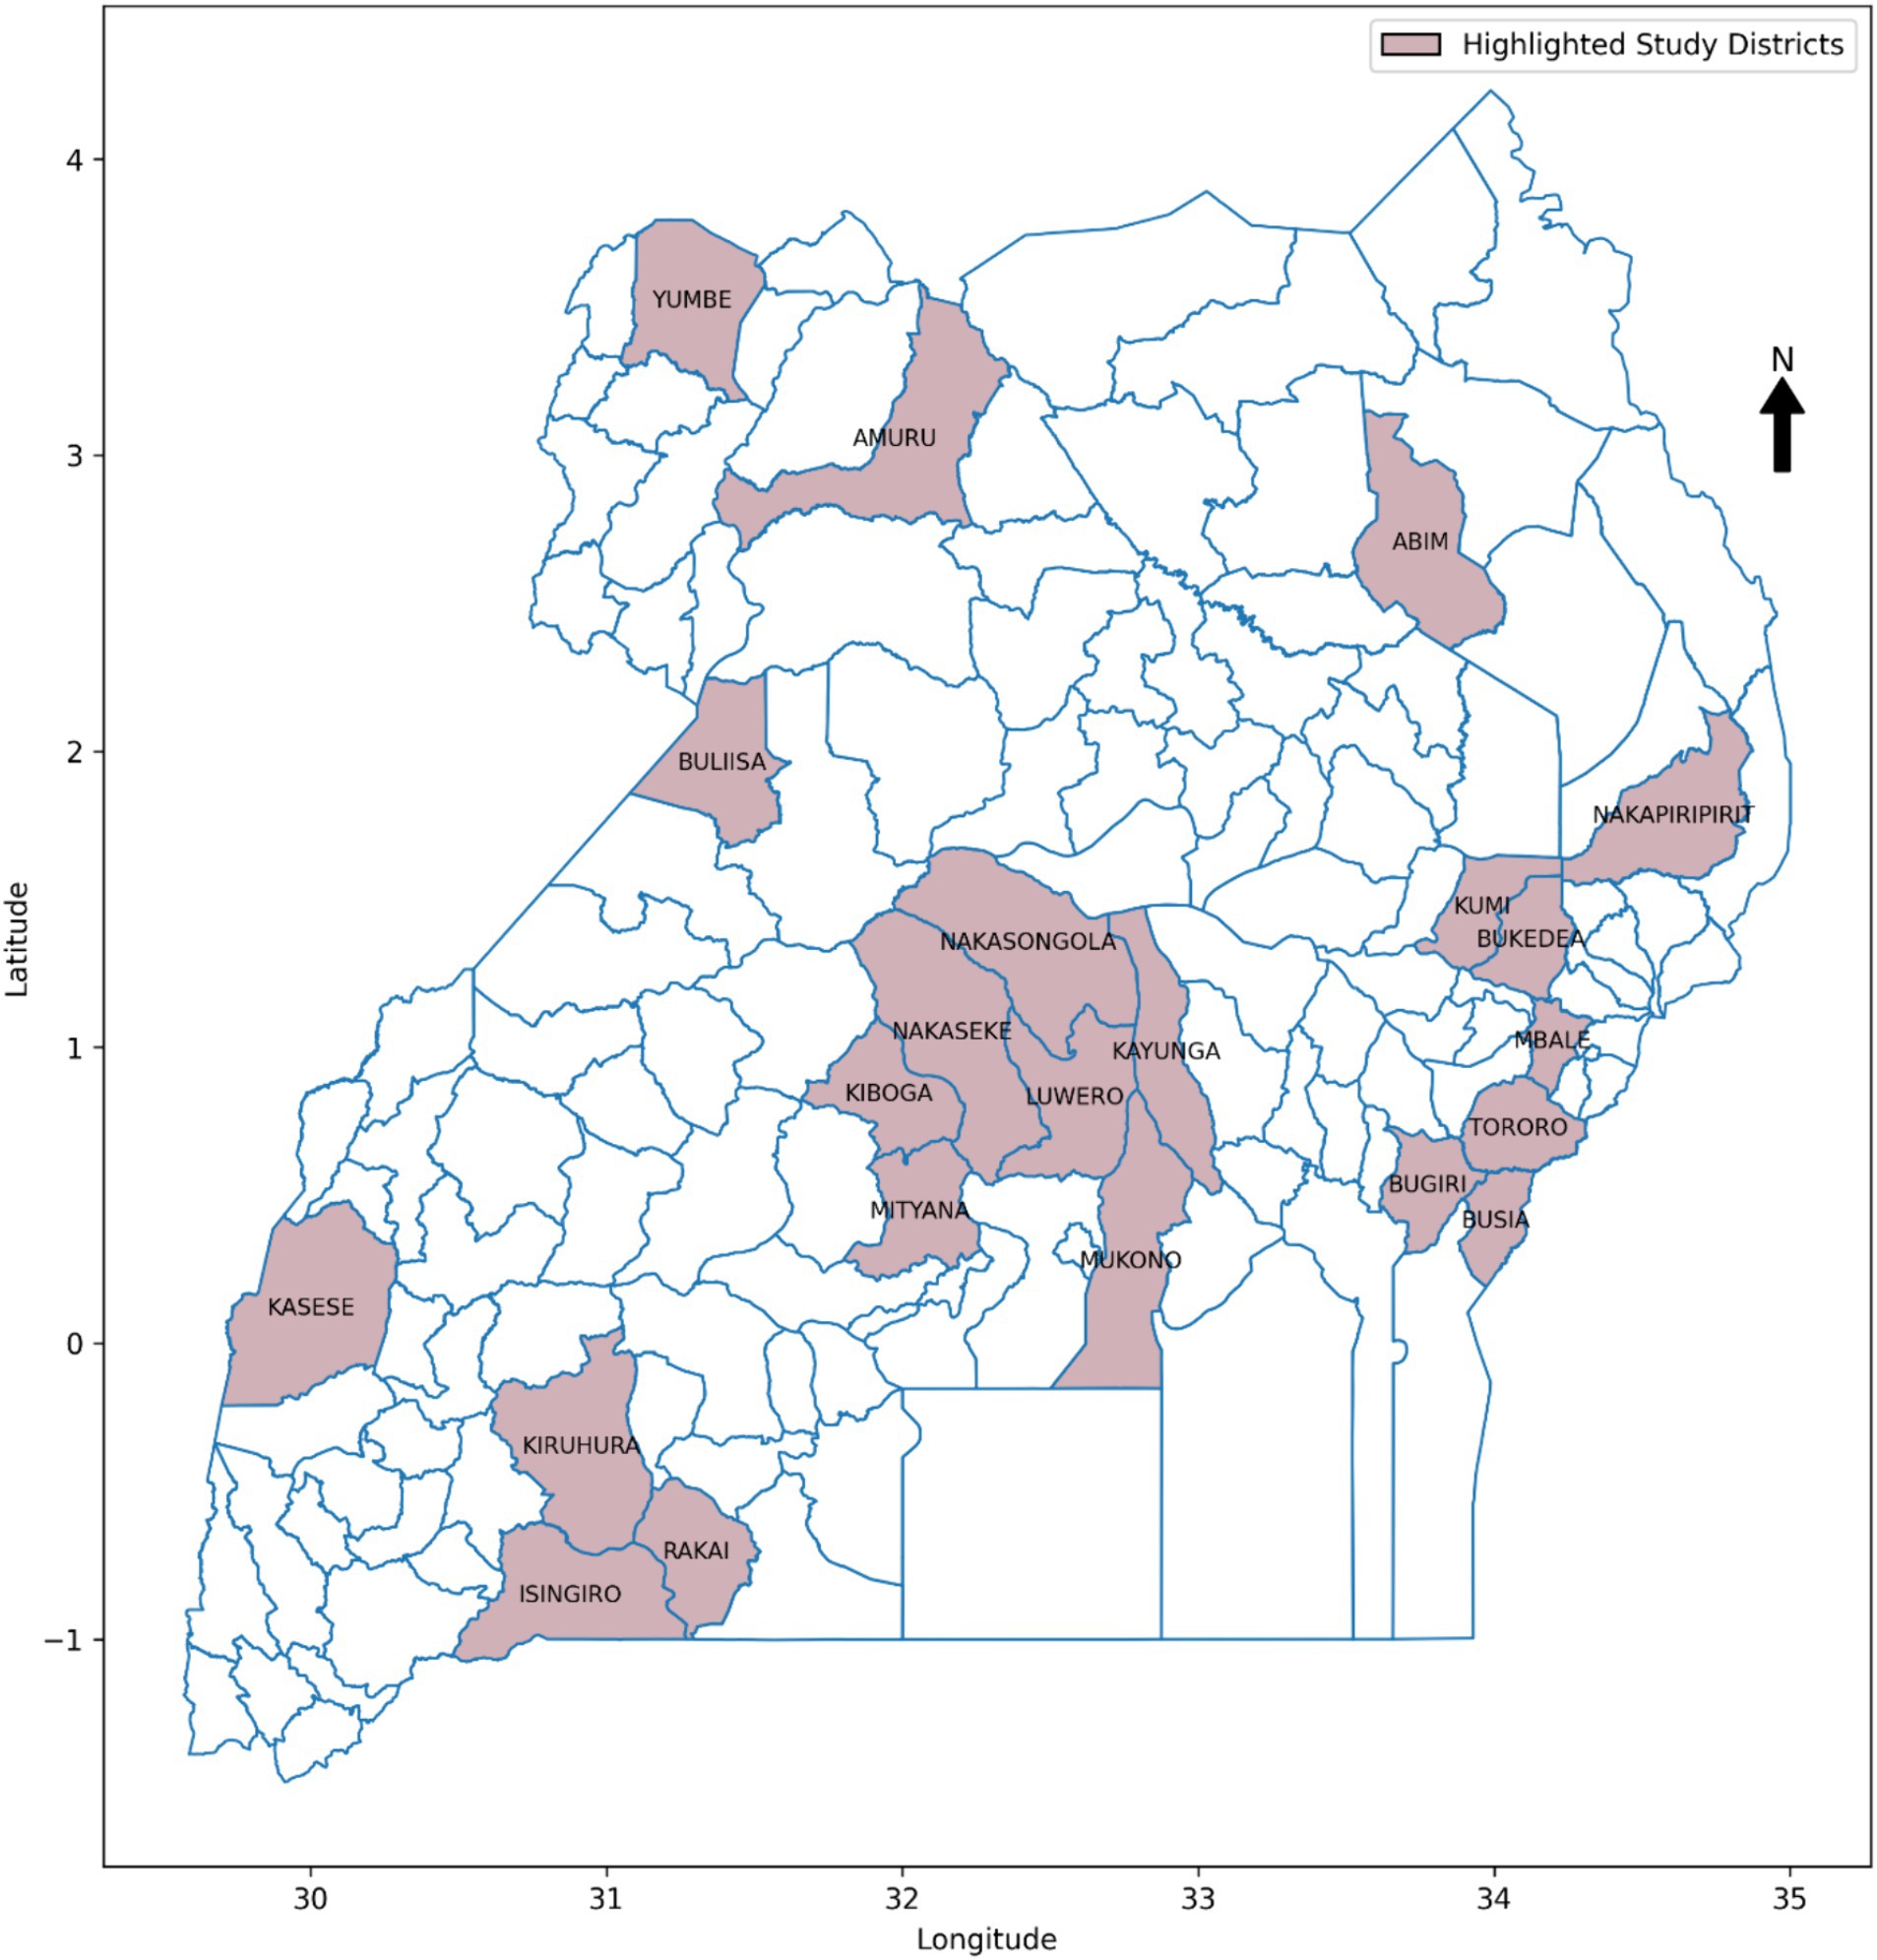
Figure 5. Map of Uganda with highlighted study districts.
3.1.3 Phase 3: data pre-processing
In Phase 3, the study aimed to achieve a unified and curated dataset for training, testing, and evaluating ML-based predictive models for FMD outbreaks in Uganda. Data pre-processing is a crucial step in ML-based research, focused on refining and harmonizing datasets from various sources (Grafberger et al., 2021; Laila et al., 2022). This preparatory phase ensures data accuracy and reliability by rectifying inconsistencies, eliminating redundant information, and addressing missing or erroneous data entries. Additionally, it establishes uniformity across disparate datasets, facilitating seamless integration and analysis. The pre-processing workflow is illustrated in Figure 6.
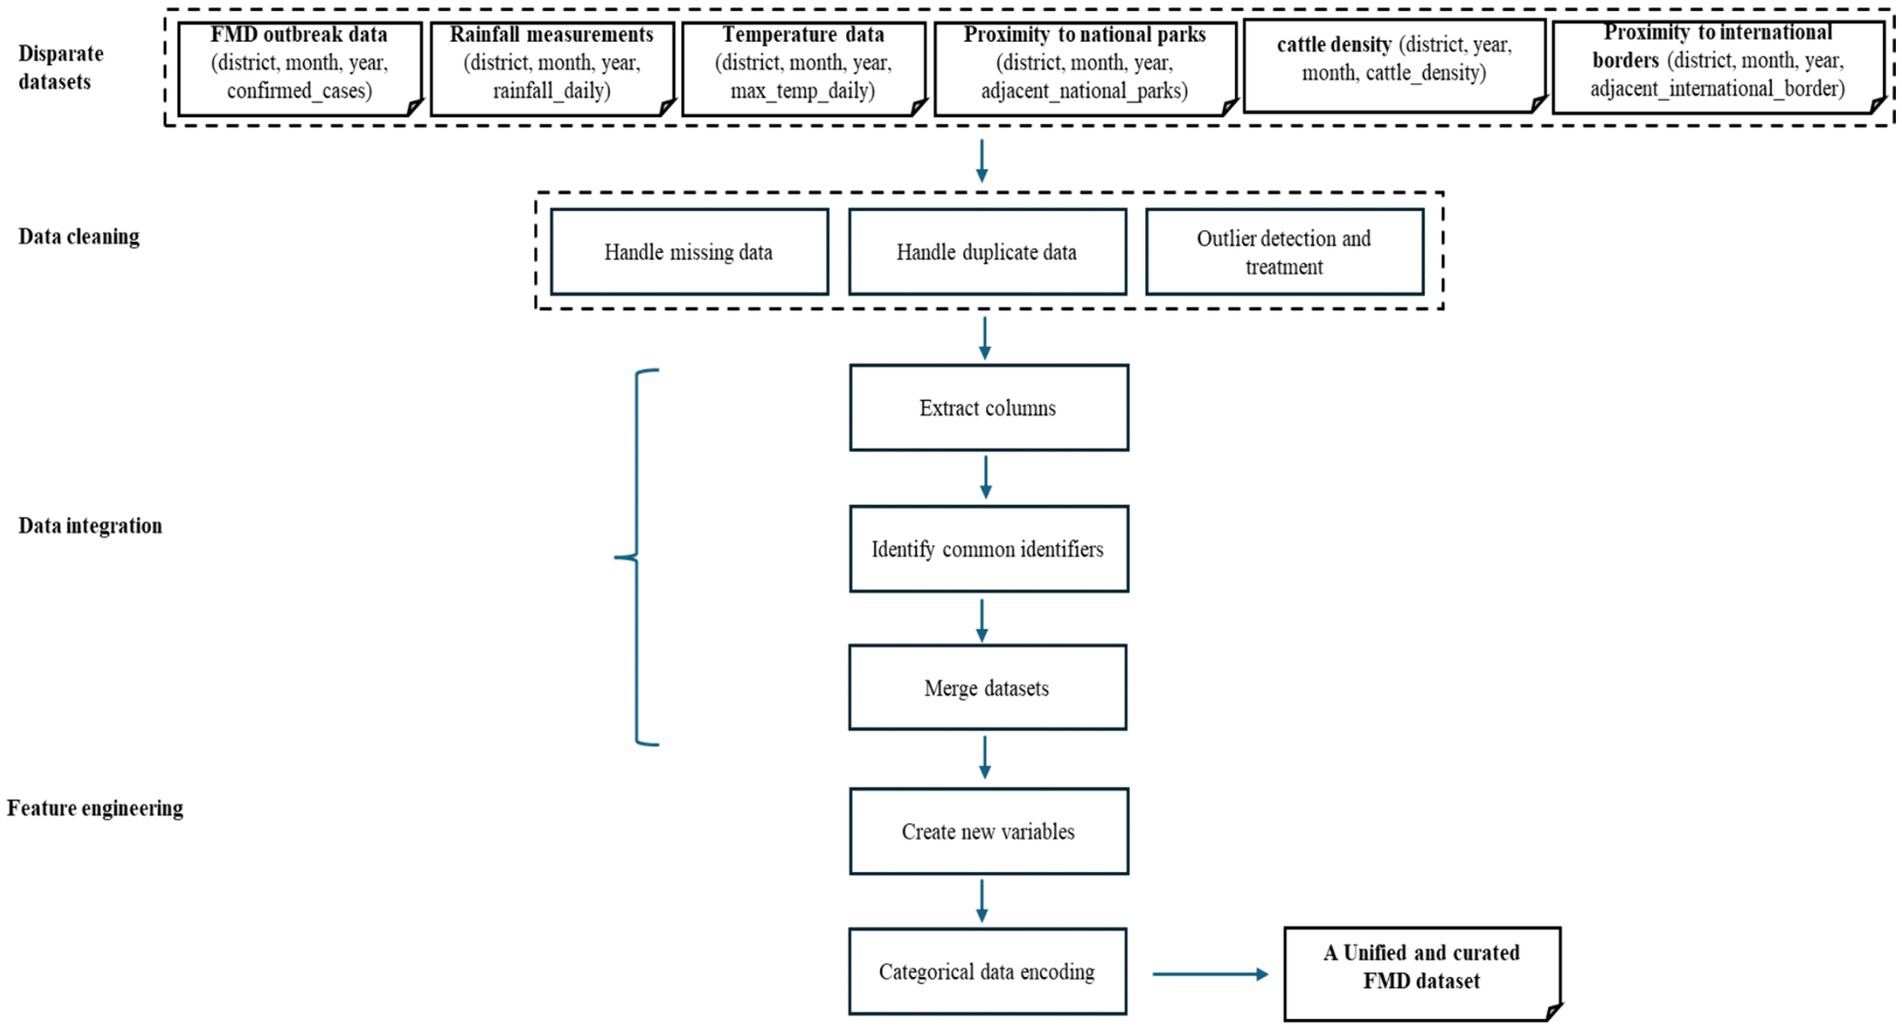
Figure 6. Visualization of the data pre-processing workflow.
3.1.3.1 Handling missing values
During data preprocessing, addressing missing values from various sources, including historical FMD outbreak datasets and environmental data, was crucial. Imputation techniques were employed to handle these gaps, with mean imputation being the chosen strategy (Ahn et al., 2022). Python, with libraries like Pandas, offered effective tools for identifying missing values. Functions including isnull or isna along with methods like sum facilitated the assessment of missing data prevalence per feature in datasets. For instance, using df.isnull().sum with a Pandas DataFrame ‘df’ efficiently detected missing values across columns. Mean imputation involved substituting missing values with the mean of their respective features. This approach aimed to maintain dataset completeness and preserve critical variables necessary for subsequent analyses and model development. The datasets retained essential information by employing mean imputation, ensuring integrity for analyzing risk factors associated with FMD outbreaks in Uganda. This strategy prevented the loss of valuable data points, enabling comprehensive analyses and robust model development with a more complete dataset.
3.1.3.2 Handling duplicate records
Addressing duplicate records from various datasets, including FMD outbreak historical records and environmental data, was crucial during preprocessing. Removing duplicates aimed to eliminate redundancy and ensure data accuracy (Tae et al., 2019; Mishra et al., 2020). Python, with libraries like Pandas, facilitated efficient detection and elimination of duplicate records. The drop_duplicates() function in Pandas allowed for the identification and removal of duplicate entries from a DataFrame. For instance, using df.drop_duplicates(subset = [‘column1’, ‘column2’], keep = ‘first’, inplace = True) with a Pandas DataFrame ‘df’ enabled the detection and deletion of duplicate entries based on specified columns.
Eliminating duplicates was vital for dataset accuracy and integrity. Duplicate entries could introduce biases, skewing analytical outcomes and affecting modeling reliability. Removing duplications preserved dataset integrity, ensuring each entry was unique and meaningful to analysis. This process enhanced dataset quality by ensuring each record was distinct and accurate, minimizing the risk of inflated statistics or biased outcomes. Removing duplicate records refined the dataset, laying the groundwork for more accurate analyses and predictive performances for FMD outbreaks in Uganda.
3.1.3.3 Outlier detection and treatment
Outlier detection and treatment were essential during preprocessing to ensure data consistency and accuracy. Python, with libraries like Pandas, Matplotlib, and NumPy, provided robust techniques for this task. The Z-score method was effective for identifying outliers, calculating the deviation of a data point from the mean in terms of standard deviations. Points with Z-scores beyond a threshold were considered outliers (Chikodili et al., 2021). Scatter plots visually confirmed identified outliers, aiding in recognizing data points significantly deviating from the general pattern.
Once outliers were confirmed, mean imputation treated them by replacing outlier values with the mean of the respective feature. Despite more sophisticated methods available, mean imputation was chosen for its simplicity and effectiveness in maintaining data consistency and integrity (Rubin, 2018; Jadhav et al., 2019). This meticulous outlier detection and treatment resulted in a refined dataset, devoid of extreme values that could skew analytical processes. By ensuring data integrity, we enhanced the accuracy and reliability of subsequent analyses and the FMD outbreak prediction model. This process was critical in training the model on accurate data, leading to more precise and dependable predictive modeling of FMD outbreaks.
3.1.3.4 Data integration
Data integration involves merging multiple datasets from various sources into a unified and coherent dataset (Isaac et al., 2020). Creating a comprehensive dataset that consolidates information from different sources is crucial for enabling more effective and thorough analysis. By utilizing the set function in Python, the study extracted columns from disparate datasets loaded in DataFrames, including historical FMD outbreak records (district, month, year, confirmed_cases), rainfall measurements (district, month, year, rainfall_daily), temperature data (district, month, year, max_temp_daily), proximity to national parks (district, month, year, adjacent_national_parks), cattle density (district, year, month, cattle_density), and proximity to international borders (district, month, year, adjacent_international_border) into sets. Using the intersection function on these sets, common columns were identified. Finally, the Pandas pd.merge function was utilized to combine the datasets based on the identified common identifiers. The choice of using the pd.merge function in Python is justified by its flexibility in merging datasets based on common features. It allows for a seamless integration process, ensuring that relevant information from different datasets is appropriately combined. The flowchart (Figure 6) illustrates this integration process, guiding the sequential steps from extracting columns into sets, identifying common identifiers, to joining datasets, ensuring consistency and reliability in preparing the unified dataset. The data distribution of the unified and curated dataset in shown in Figure 7.
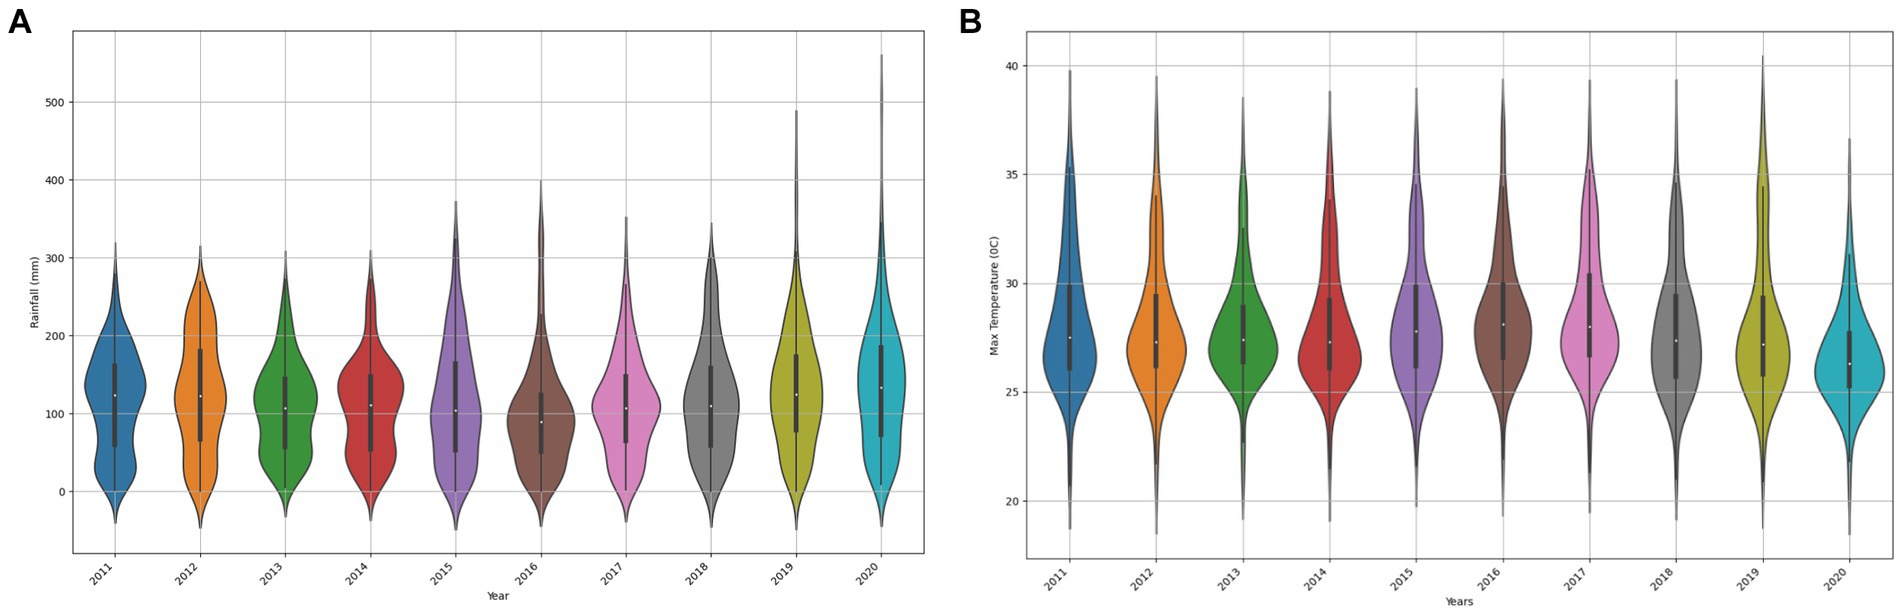
Figure 7. Visualization illustrating the variability in rainfall (A) and max temperature (B) features, highlighting distribution shifts.
3.1.3.5 Feature engineering
Feature engineering, a vital process in data pre-processing, involves creating new variables or modifying existing ones to enhance the performance of machine learning models (Kang and Tian, 2018; Maharana et al., 2022). It transforms raw data into meaningful features that better represent the underlying problem. In this study, feature engineering was utilized to create two key features: monthly rainfall (rainfall) and monthly maximum temperature (max_temp). Daily rainfall measurements were averaged, and daily maximum temperature values were averaged to align with the monthly FMD outbreak data. These engineered features were crucial for improving the predictive accuracy of the models, allowing for a more relevant and effective analysis of FMD outbreaks.
3.1.3.6 Categorical data encoding
During data preparation, categorical data encoding was crucial for converting qualitative variables into numerical formats, essential for machine learning algorithms (Jo, 2021). Using Pandas in Python, a ‘target’ class was created to represent outbreak (1) and non-outbreak (0) instances. This encoding was achieved by mapping ‘outbreak’ to 1 and ‘no-outbreak’ to 0 in the ‘target’ column using Pandas’ map() function. Converting categorical variables into numerical representations facilitated machine learning models’ interpretation of outbreak occurrences, aiding in predictive modeling (Hancock and Khoshgoftaar, 2020).
3.1.4 Phase 4: model training, testing and evaluation
In Phase 4, the study, aimed to investigate the performance degradation rates of ML-based models in predicting FMD outbreaks in the dynamic setting of Uganda. To fulfill this objective, the study conducted experiments on selected ML algorithms known to exhibit better predictive power using supervised learning techniques. In the following sections, study provides a detailed discussion of the methods employed to achieve this objective.
3.1.4.1 Splitting the dataset into reference (training) and current (target) sets
While investigating the degradation in performance exhibited by ML-based algorithms in a non-stationary environment when predicting FMD outbreaks using a curated dataset, a pivotal step entailed dividing the dataset into two subsets: the reference and target datasets. This study employed the sequential sampling technique which is suitable for splitting timeseries data. The reference (training) dataset encapsulated records from 2011 to 2020, while the current (target) dataset encompassed records from 2021 to 2022. This division allowed for distinct periods for training and validation purposes, ensuring that the models developed were based on historical data reference and then validated against more recent target information.
3.1.4.2 Visualizing varying distributions for rainfall and max temperature
To confirm data variability in rainfall and Max Temperature features, the study utilized violin plots to depict the changes in rainfall and max temperature distributions across different years in Uganda. Variations in the shape, median position, and quartiles within each violin plot highlight the dissimilarities in rainfall distribution patterns over time. The choice to use rainfall and temperature as metrics for demonstrating potential distribution shifts is grounded in the literature indicating their significance as contributing factors to FMD outbreaks in Uganda (Munsey et al., 2019).
3.1.4.3 Handling class imbalance
In ML domain, various researchers have reported on the significant impact of class imbalance on the predictive performance of ML-based algorithms (Tran et al., 2021). Class imbalance is a phenomenon where the instances of one class (majority) are significantly more than the samples in the other class (minority) (Buda et al., 2018). The study explored matplotlib to visualize the distribution of the dataset. Supplementary Figure 2 confirms the existence of existence of class imbalance where the non-outbreak samples (majority) are significantly more than the outbreak samples (minority). To a certain the impact of class imbalance, the study trained baseline models with the imbalanced instances. Additionally, the study conducted a random under-sampling technique to balance the classes (Supplementary Figure 3) and evaluated the performance. Similarly, the study explored SMOTE (original) and its variants including borderline-SMOTE, SMOTE-SVM, and ADASYN techniques to mitigate the impact of imbalanced classes (Supplementary Figure 4; Figure 8). The choice of SMOTE and its variants over other augmentation techniques is justified by its ability to intricately handle imbalanced datasets. Unlike random oversampling or under-sampling methods, SMOTE generates synthetic instances by considering the attributes of existing data points, thus producing more diverse and representative samples.
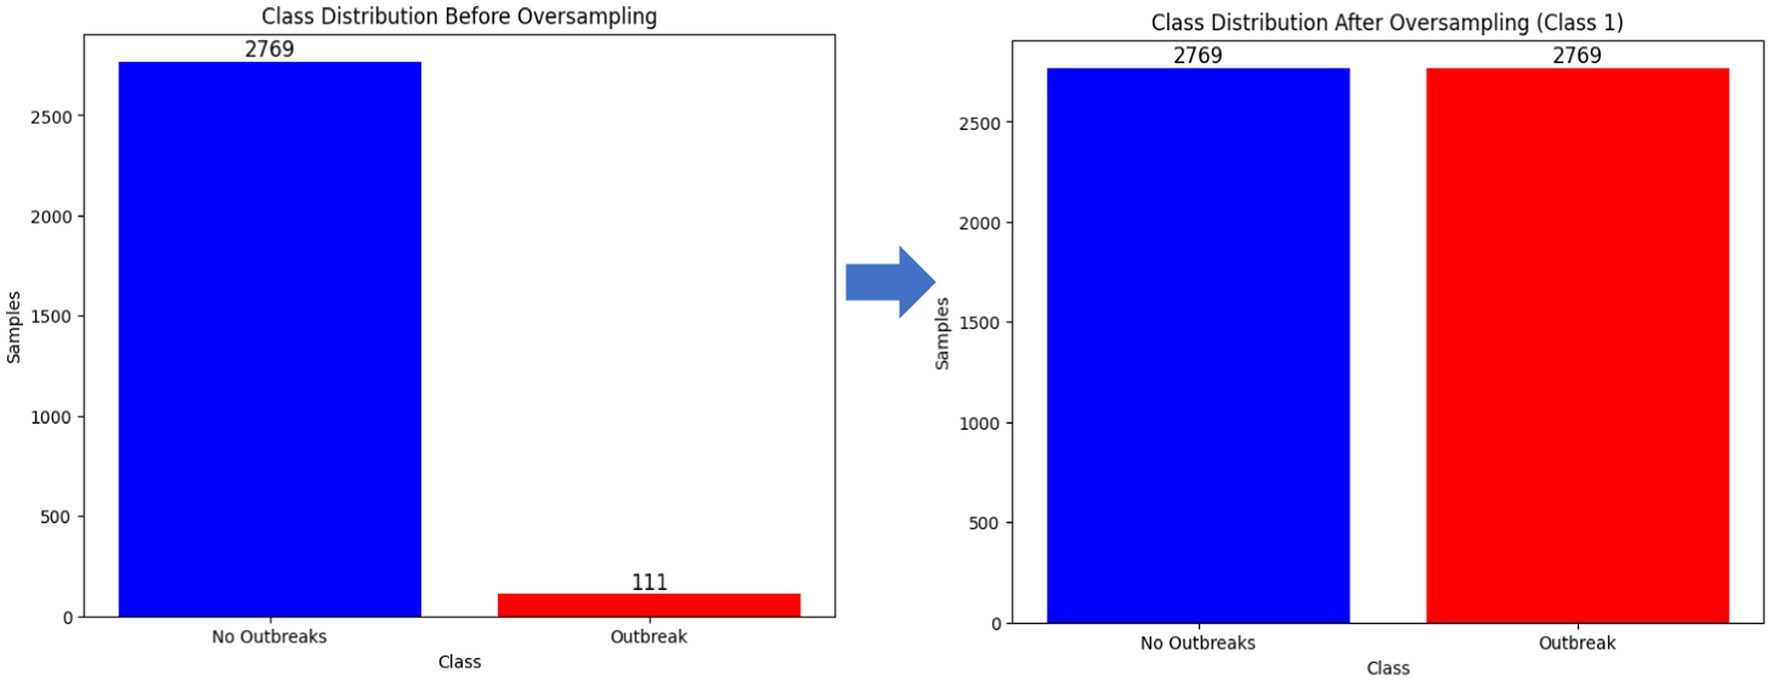
Figure 8. Utilizing SMOTE (original), SMOTE-SVM, borderline-SMOTE and ADASYN techniques for oversampling the minority class for a balanced dataset.
3.1.4.4 Experiments to assess performance degradation rates under distribution shifts
To assess the performance of ML-based models in predicting FMD outbreaks under distribution shifts required selecting appropriate ML algorithms suitable for the FMD datasets. In the subsequent sections the study discusses the experimental setup where seven ML algorithms were chosen, trained, tested and validated their performances using target dataset (Figure 9).
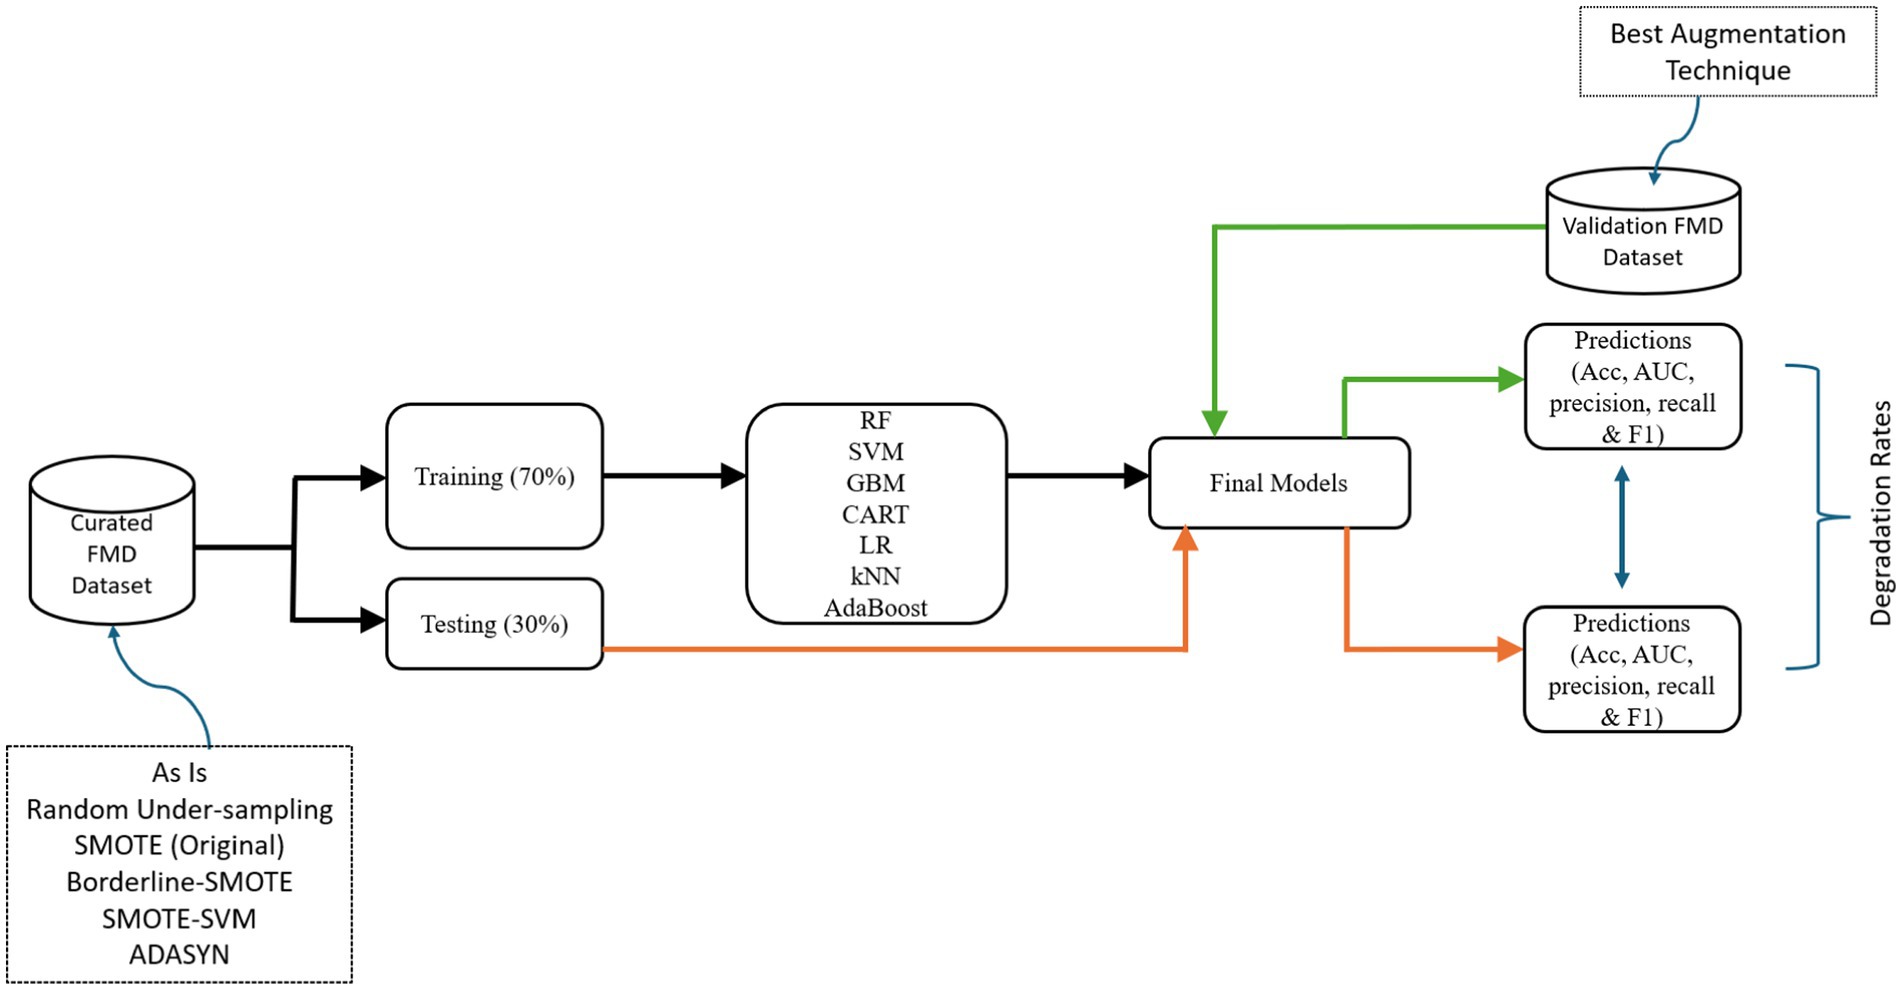
Figure 9. Experimental flowchart for the model development process.
The pipeline guides the development of Random Forest (RF), Support Vector Machine (SVM), Gradient Boosting Machine (GBM), Classification Regression Tree (CART), Logistic Regression (LR), k-Nearest Neighbors (kNN), and AdaptiveBoost (AdaBoost) models, testing, and validation.
3.1.4.4.1 Experimental setup
The study designed experiments for developing and evaluating ML-based models for predicting FMD outbreaks under non-stationary environment. The study began by employing Python programming language 3.11.4, known for its rich collection of libraries and tools tailored explicitly for machine learning applications (Soklaski et al., 2022; Rajamani and Iyer, 2023). This choice facilitated the data analysis and development processes, allowing efficient data exploration and code development within the Jupyter Notebook integrated development environment (IDE) 7.0.0 (Brewer et al., 2022; Hewage and Meedeniya, 2022).
In optimizing the computational resources, the study relied on a local machine learning platform configured to synergistically utilize the Graphics Processing Unit (GPU) and Central Processing Unit (CPU). Leveraging this combined processing power significantly accelerated general-purpose machine learning tasks, expediting the research pace and productivity. The study employed Pandas library for effective data manipulation, which excels in handling diverse data formats and structures (Chang et al., 2022). Complementing this, the study utilized NumPy for numerical operations and array manipulation, acknowledging its fundamental role in data science and machine learning (Ziatdinov et al., 2022; Rajamani and Iyer, 2023).
The development and evaluation of the ML-based models were conducted using the Scikit-Learn library (Narayanan et al., 2022). This comprehensive library offered extensive machine learning algorithms and evaluation tools, streamlining the experimentation process. Additionally, the study employed Matplotlib and Seaborn for data visualization and result communication. These visualization libraries created insightful graphs and charts (Schessner et al., 2022; Weiss, 2022). This thoughtfully constructed environment and toolset played a pivotal role in establishing a robust foundation for model training and subsequent analyses. They ensured the reliability and validity of the research outcomes, providing a structured and efficient framework for experimentation and evaluation.
3.1.4.4.2 Choosing machine learning algorithms
The selection of machine learning algorithms for predicting FMD outbreaks stemmed from the groundwork laid by Punyapornwithaya et al. (2022) and Sueabua and Seresangtakul (2023). Their research explored the efficacy of supervised learning methods in predicting FMD outbreaks within Thailand’s provinces. However, despite showcasing promising predictive capabilities, these prior studies overlooked the crucial aspect of assessing the models’ performance under distribution shifts, a significant limitation addressed in this research. By building upon this foundation, the researcher chose seven distinct machine learning algorithms for their proven strengths in predictive modeling (Karapapas and Goumopoulos, 2021; Dutta et al., 2022). The study chose Random Forest (RF), Support Vector Machine (SVM), k-Nearest Neighbors (kNN), Gradient Boosting Machine (GBM), AdaBoost, Logistic Regression (LR), and Classification and Regression Tree (CART) for predicting Foot and Mouth Disease outbreaks in the endemic settings of Uganda due to their diverse functionalities and strengths in handling various aspects of predictive modeling.
Random Forest: RF is a versatile ensemble learning method that excels in handling large datasets and complex interactions among variables (Choudhury et al., 2021). Its ability to aggregate the predictions of multiple decision trees reduces overfitting and enhances predictive performance.
Support Vector Machine: SVM is renowned for handling high-dimensional data and finding optimal hyperplanes for classification tasks (Cervantes et al., 2020). Its effectiveness in separating data points with a clear margin makes it suitable for binary classification problems like predicting FMD outbreaks.
Classification and Regression Tree: CART provides transparent decision-making processes through interpretable tree structures (Aghaei et al., 2021). Its simplicity and ease of interpretation make it a valuable tool for understanding the relationships between predictors and the target variable.
Logistic Regression: Logistic Regression, a classic method, remains robust and effective, especially in binary classification problems (Joshi and Dhakal, 2021). Its straightforward implementation and interpretability make it a staple in predictive modeling.
Gradient Boosting Machine: GBM is included due to its capability to effectively handle complex relationships in the data and its robustness against overfitting (Touzani et al., 2018). By building multiple weak learners sequentially, each learner focuses on the mistakes of its predecessors, leading to a strong overall model.
k-Nearest Neighbors: kNN is valuable in non-linear data scenarios by finding patterns based on neighboring data points (Bansal et al., 2022). Its simplicity and effectiveness in capturing local data patterns make it a useful addition.
AdaBoost: AdaBoost is a powerful ensemble learning technique that works by sequentially training a series of weak learners, such as decision trees, with each subsequent learner focusing on the examples that were misclassified by the previous ones (Mienye and Sun, 2022). Its robustness to overfitting and ability to generalize well to new data, along with its effectiveness in handling imbalanced datasets, make it a valuable tool for predicting FMD outbreaks.
The selection of these algorithms was grounded in their diverse functionalities, aimed at capturing various aspects of FMD outbreak prediction. Each algorithm brings unique capabilities, ensuring a comprehensive exploration of predictive modeling for FMD outbreaks, considering the details and complexities within the unified dataset. By focusing on these seven models, the study aimed to balance predictive power, interpretability, and computational feasibility in the context of predicting FMD outbreaks in Uganda under varying distribution.
The study employed RF, SVM, LR, GBM, AdaBoost, CART, and kNN for predicting FMD outbreaks in Uganda. The choice of RF, GBM, and AdaBoost was motivated by their strong ensemble predictive power (Sahin, 2020). SVM and LR were selected for their robustness in high-dimensional spaces (Pisner and Schnyer, 2020) and binary classification (Nusinovici et al., 2020), respectively, while kNN and CART were chosen for their simplicity and interpretability (Zafar and Khan, 2021). Moreover, these models exhibit computational efficiency in prediction (Reddy et al., 2020; Shobana and Umamaheswari, 2021; Singh et al., 2021; Sethuraman et al., 2023). The study used default hyperparameters across all models, justified by prior works (Punyapornwithaya et al., 2022; Sueabua and Seresangtakul, 2023) and to maintain consistency and simplicity in comparative analysis.
3.1.4.4.3 Performance evaluation metrics
In this study, classification performance metrics were employed to assess the efficacy of the learning algorithms in predicting FMD outbreaks. From the literature, performance is evaluated using two data sets: the training and test or validation sets (Ferri et al., 2009; Jiao and Du, 2016; Tharwat, 2020). The robustness of the ML-based models utilized in the experiments was evaluated through various performance metrics that provide quantitative measures, including accuracy, F-score, recall, precision, and the Area Under the Curve (AUC) of the Receiver Operating Characteristic (ROC) curve. Below, the study elaborates on the formulas utilized to calculate these performance metrics.
Accuracy (ACC): Accuracy measures the overall correctness of predictions made by the model (El-Hasnony et al., 2022). It is calculated as the ratio of correctly predicted instances to the total instances.
TP (true positive) is the number of samples whose actual value is positive, and the model predicts them as positive. TN (true negative) is the number of samples whose actual value is negative, and the model predicts them as negative. FP (false positive) is the number of samples whose actual value is negative, and the model predicts them as positive. FN (false negative) is the number of samples whose actual value is positive, and the model predicts them as negative.
Area Under the Curve (AUC) of the Receiver Operating Characteristic (ROC) Curve: AUC measures the model’s ability to distinguish between positive and negative instances (Wu et al., 2020; Kaur et al., 2022). It quantifies the area under the ROC curve, where a higher AUC indicates better model performance.
Precision (PR): Precision assesses the proportion of true positive predictions among all positive predictions made by the model (Iwendi et al., 2020; Wang et al., 2020).
Recall [Sensitivity (SE)] or True Positive Rate (TPR): Recall measures the proportion of true positive predictions among all actual positive instances (Powers, 2020).
F1-score: The F1 score is the harmonic mean of precision and recall, providing a balanced measure of model performance (Iwendi et al., 2020; Dixit, 2022).
The study computed and compared these classification performance metrics for each of the seven ML algorithms: RF, SVM, CART, LR, GBM, kNN, and AdaBoot. The comparative performance analysis assessed the predictive performance degradation rates under varying distribution.
3.1.4.4.4 Baseline model training and testing
In pursuit of achieving accurate FMD predictions in Uganda, this study commenced by undertaking baseline model training, testing and validation (Figure 9). The study began by segmenting the curated dataset from 2011 to 2020 (source) into two distinctive subsets using the train_test_split method in Python with random sampling: 70% allocated for training and 30% for testing. Random sampling ensures that each data point has an equal chance of being included in either the training or testing set, which helps to minimize bias and ensure that the resulting model’s performance is representative of its generalization ability (Mehrabi et al., 2021). Therefore, random sampling technique ensures that the training and testing sets are independent and identically distributed (i.i.d.), which is essential for evaluating the model’s performance accurately. The deliberate segregation of the source dataset was a critical step, ensuring a robust assessment of the predictive capabilities of the developed models. Each algorithm offered unique strengths and learning approaches, which aimed to leverage for the most effective predictive model.
The experimental approach encompassed a systematic procedure for each algorithm (Figure 9). The study initiated the training phase, utilizing 70% of source dataset. During this phase, the models analyzed the data, identifying intricate patterns and relationships crucial for accurate predictions. This intensive training phase was fundamental for each model to grasp the underlying features characterizing FMD outbreaks in Uganda. Subsequently, transitioned to the testing phase, employing the remaining 30% of the dataset. This independent subset played a vital role in rigorously evaluating each model’s predictive capabilities and ability to generalize when faced with previously unseen data with similar distribution. The predictive performance results from this phase would be vital in assessing the degradation rates for the various models under distribution shifts.
3.1.4.4.5 Optimal performing model under stationary environment
The process of choosing the best-performing model among the experimented class imbalance handling techniques involved combining individual performance metric scores into a single measure, the weighted average performance core which was subsequently used for ranking the model performance. The process was guided by the following steps:
a. Assign weights: Based on the relative importance for each performance metric, the study assigned an equal weight of 1 across all the metrics.
b. Calculate the weighted scores: Multiplied each performance metric by its corresponding weight and summed up the results.
c. Compute weighted average scores: Divided the sum of the weighted scores from (b) by the total number of performance metrics.
Therefore, the formula for calculating the weighted average score for metrics is as follows:
Where:
represents the weight assigned to metric , represents the value of metric, and
is the total number of metrics.
3.1.4.4.6 Validating baseline model under distribution shifts
To validate the performances of the seven baseline models under distribution shifts in predicting FMD outbreaks, the study utilized the sequentially sampled target dataset (2021–2022). To quantify the impact of distribution shifts on these models, the study computed the degradation rates of the selected performance metrics, including accuracy, Area Under the Curve (AUC), recall, F1-score, and precision (Khattak et al., 2022). The degradation rates for each metric of every model were computed using the formula below.
Where:
represents the performance for matric ,
represents the performance for matric .
This systematic approach allowed the study to gauge the reduction in performance metrics, serving as crucial indicators of the influence of distribution shifts on model efficacy. By quantifying the degradation rates across multiple performance metrics, the study comprehensively understood how the change in data distribution affected the models’ predictive abilities.
3.1.4.4.7 Analyzing key predictive features for FMD outbreaks
The analysis of feature importance is a critical aspect within machine learning models, offering invaluable insights into the contribution and influence of individual features or variables on predictive outcomes (Kumar et al., 2020; Feng et al., 2021). Understanding the relative importance of these features aids in comprehending their impact on the model’s predictive power. To delve into feature importance, the study leveraged the feature_importances_ attribute, a model-specific attribute associated with the algorithm that exhibited superior performance in predicting FMD outbreaks in Uganda. The study generated feature importance values for the selected models by utilizing this attribute. This analysis holds immense significance as it reveals which variables are pivotal in predicting FMD outbreaks within the machine learning models. Identifying such influential factors is instrumental in refining models, enhancing predictive accuracy, and strategically allocating resources toward the most impactful variables. By scrutinizing the importance of features across various models, the researchers comprehensively understand the primary drivers behind the strategies for predicting FMD outbreaks.
4 Results
In this section, the study reveals the research findings related to creation of a unified and curated FMD dataset and assessment of performance degradation rates under varying distribution in Uganda. The comprehensive investigation unfolds in two significant sections: a unified and curated dataset, and assessment of predictive performance degradation rates under varying distribution. Each section sheds light on distinct yet interconnected aspects.
4.1 A unified and curated FMD dataset
Through comprehensive data pre-processing, the study addressed missing values and outlier data points, resulting in the creation of a unified and curated FMD dataset. This pre-processed dataset is essential for constructing ML-based predictive models for FMD outbreaks. By ensuring the data’s accuracy and consistency, the study enhances the reliability and effectiveness of ML-based models, which are critical for early detection and optimal allocation of resources to mitigate FMD outbreaks.
4.1.1 Data collection and sources
Historical FMD Data: Data was collected from NADDEC and WOAH, covering a period of 12 years from 2011 to 2022. This data included 12,484 records detailing the time and location of outbreaks, confirmed cases, animals at risk, and animal density as indicated in Table 4.
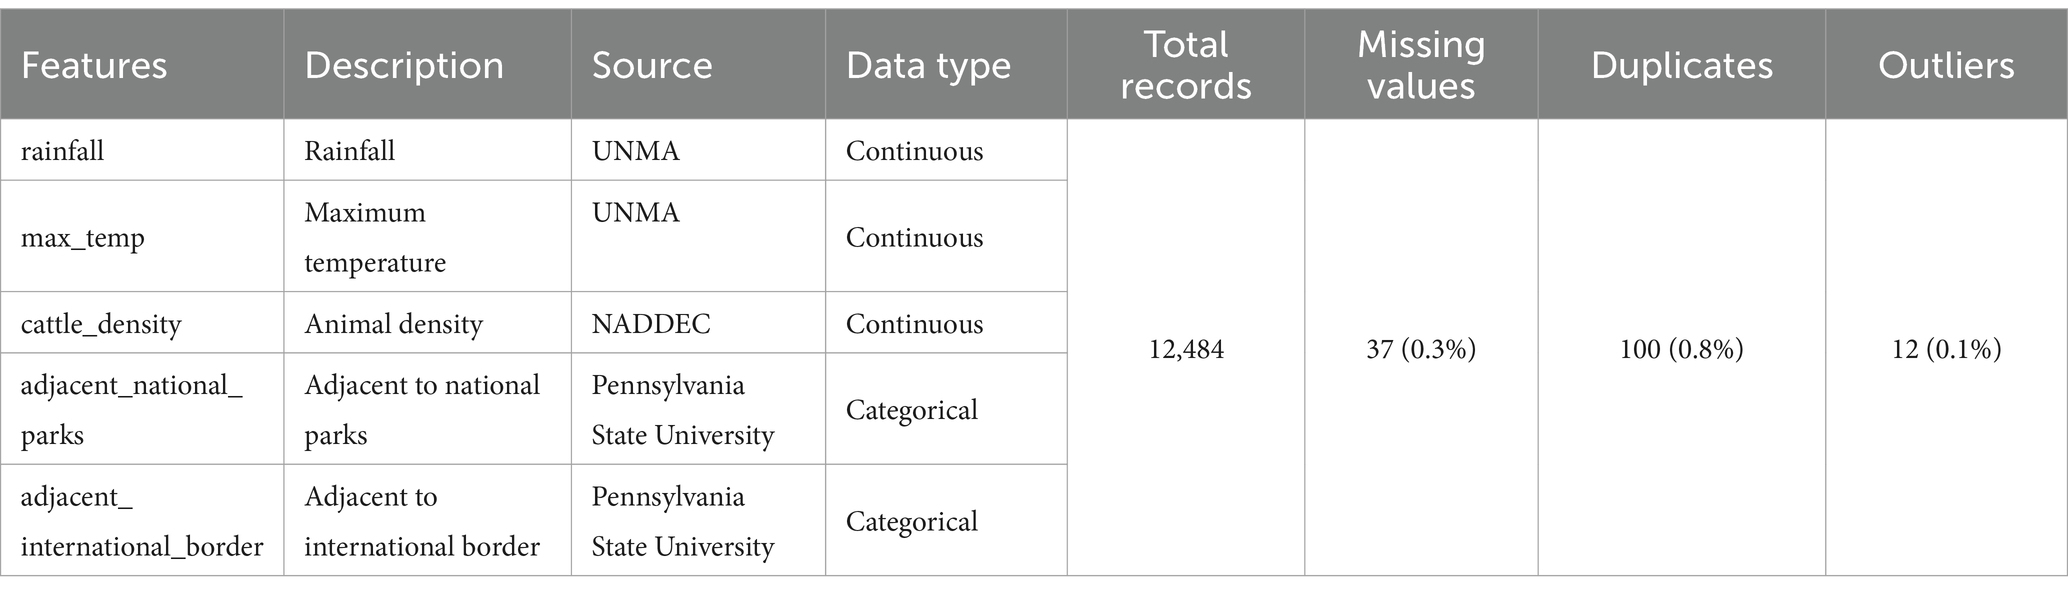
Table 4. Raw FMD dataset.
Risk Factor Data: Rainfall and maximum temperature data were obtained from UNMA, while proximity to protected areas and international borders was sourced from the Pennsylvania State University.
4.1.2 Data pre-processing
Data Cleaning: Initial data contained 0.3% missing values, 0.8% duplicates and 0.1% outliers. Missing and outlier values were handled using mean imputation, and duplicates were removed, resulting in a clean dataset with complete records.
Data Integration: Datasets were merged using common primary keys including location and time. Temporal data was aligned to ensure consistency across all records.
4.1.3 Final unified and curated dataset composition
The unified and curated dataset comprised a total of 12,384 records from 86 districts. Of these records, 97.88% represented non-outbreaks, while only 2.12% represented outbreaks, highlighting a significant class imbalance in the FMD dataset, as shown in Supplementary Table 1. This imbalance is crucial to consider as it can impact the performance of machine learning models trained on this data. Additionally, the prevalence of FMD outbreaks across different districts varies significantly, as illustrated in Supplementary Figure 5.
4.2 Assessing baseline predictive performance degradation rates in a non-stationary environment
To assess the impact of distribution shifts on the predictive performance of machine learning-based models for FMD outbreaks in Uganda, the study employed a comprehensive experimental methodology. Seven classification machine learning algorithms were carefully selected, trained, tested, and validated. To present the results effectively, the study adopted a structured three-phase approach: Phase 1 (Section 4.2.1.1) involved presenting the test results for the baseline models with imbalanced dataset. Phase 2 (Section 4.2.1.2) focused on presenting the test results for the baseline models using a randomly under-sampled dataset, aiming to address the class imbalance issue. Phase 3 (Section 4.2.1.3) encompassed presenting the test results for the baseline models utilizing various over-sampling techniques, including SMOTE (original), Borderline-SMOTE, SMOTE-SVM, and ADASYN, to further explore the impact of balancing techniques on model performance. From Phase 1 to 3, the study tested the baseline models under stationary environment. Finally, Phase 4 (Section 4.2.2.1) presents the results regarding the model performance degradation rates under distribution shifts, shedding light on the vulnerability of ML-based models to changes in data distribution.
4.2.1 Baseline model test performance under stationary environment
To comprehend the influence of distribution shifts on the predictive accuracy of ML-based models for FMD outbreaks, the study initially assessed the performance of baseline models in a stationary environment (section 4.2.1). Subsequently, in section 4.2.2, it examined performance under distribution shifts and conducts a comparative analysis for the performance degradation effect.
4.2.1.1 Phase 1: model performance with imbalanced classes
Examining the baseline models that were trained and tested on imbalanced dataset, Supplementary Table 2 reveals notably poor performance across all metrics, with bold values depicting the highest performance. This subpar predictive capability primarily stems from the substantial class imbalance present within the FMD dataset. The imbalance in class distribution poses a significant challenge for the ML-based models to accurately predict occurrences of FMD outbreaks, leading to lower performance across various evaluation metrics.
4.2.1.2 Phase 2: model performance with randomly undersampled dataset
Under-sampling the majority class (non-outbreak) to balance it with the minority class (outbreak) resulted in only marginal performance improvement, with the overall performance remaining poor across all metrics. The best performance is depicted in bold values, as highlighted in Supplementary Table 3. The poor performance can be attributed to the limited dataset used for training the baseline models.
4.2.1.3 Phase 3: baseline model performance with oversampled dataset
The original SMOTE algorithm and its three variants, including Borderline-SMOTE, SMOTE-SVM, and ADASYN, were explored to address the imbalanced dataset and enhance the baseline model performances for predicting FMD outbreaks in Uganda. The study compares the findings between two scenarios: one where the minority samples were oversampled by a factor of 20 and the other where the minority samples were oversampled to achieve balance with the majority class. Results from the oversampling process indicate that baseline models trained on a balanced dataset for all techniques consistently outperformed those trained on minority samples oversampled by a factor of 20. The highest performance is depicted in bold values, as shown in Tables 5 –8. Similarly, Figures 10 –13 visualize the performance across the SMOTE and itsvariants.
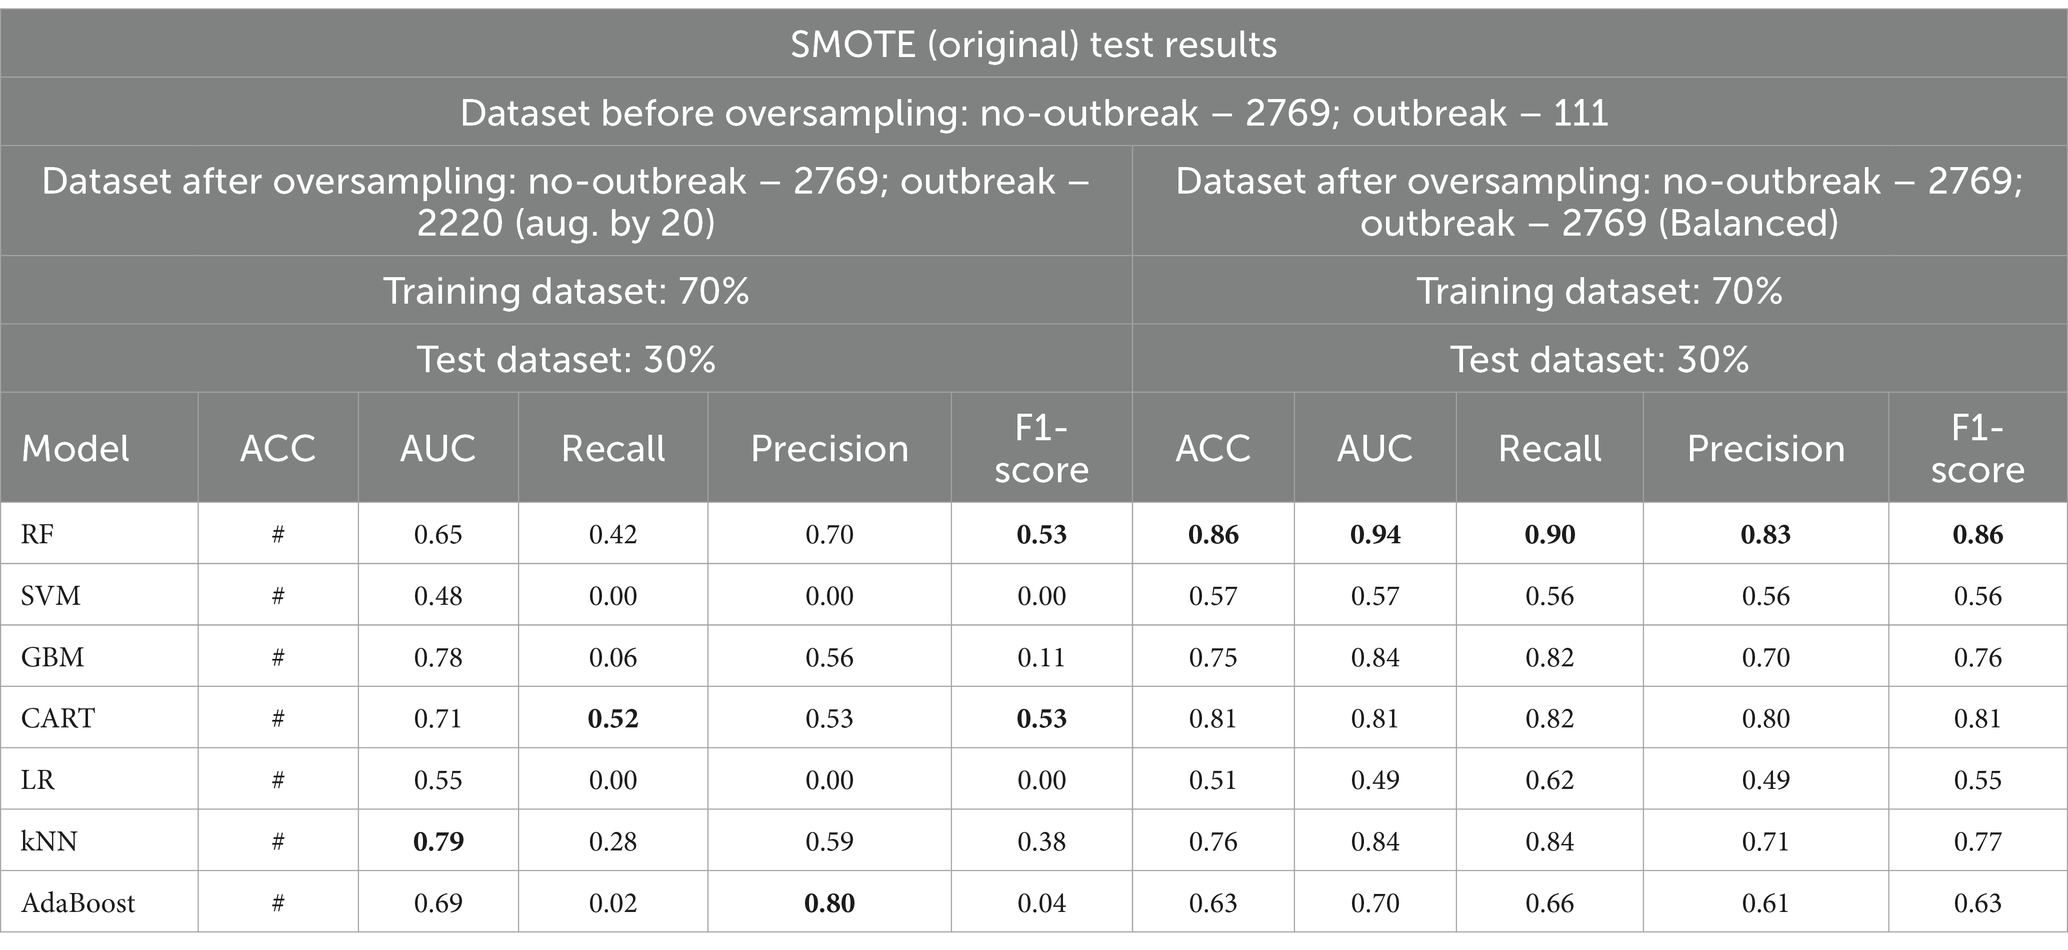
Table 5. Comparative analysis of baseline model performance with minority class oversampled by a factor of 20 and balanced dataset using SMOTE (original).
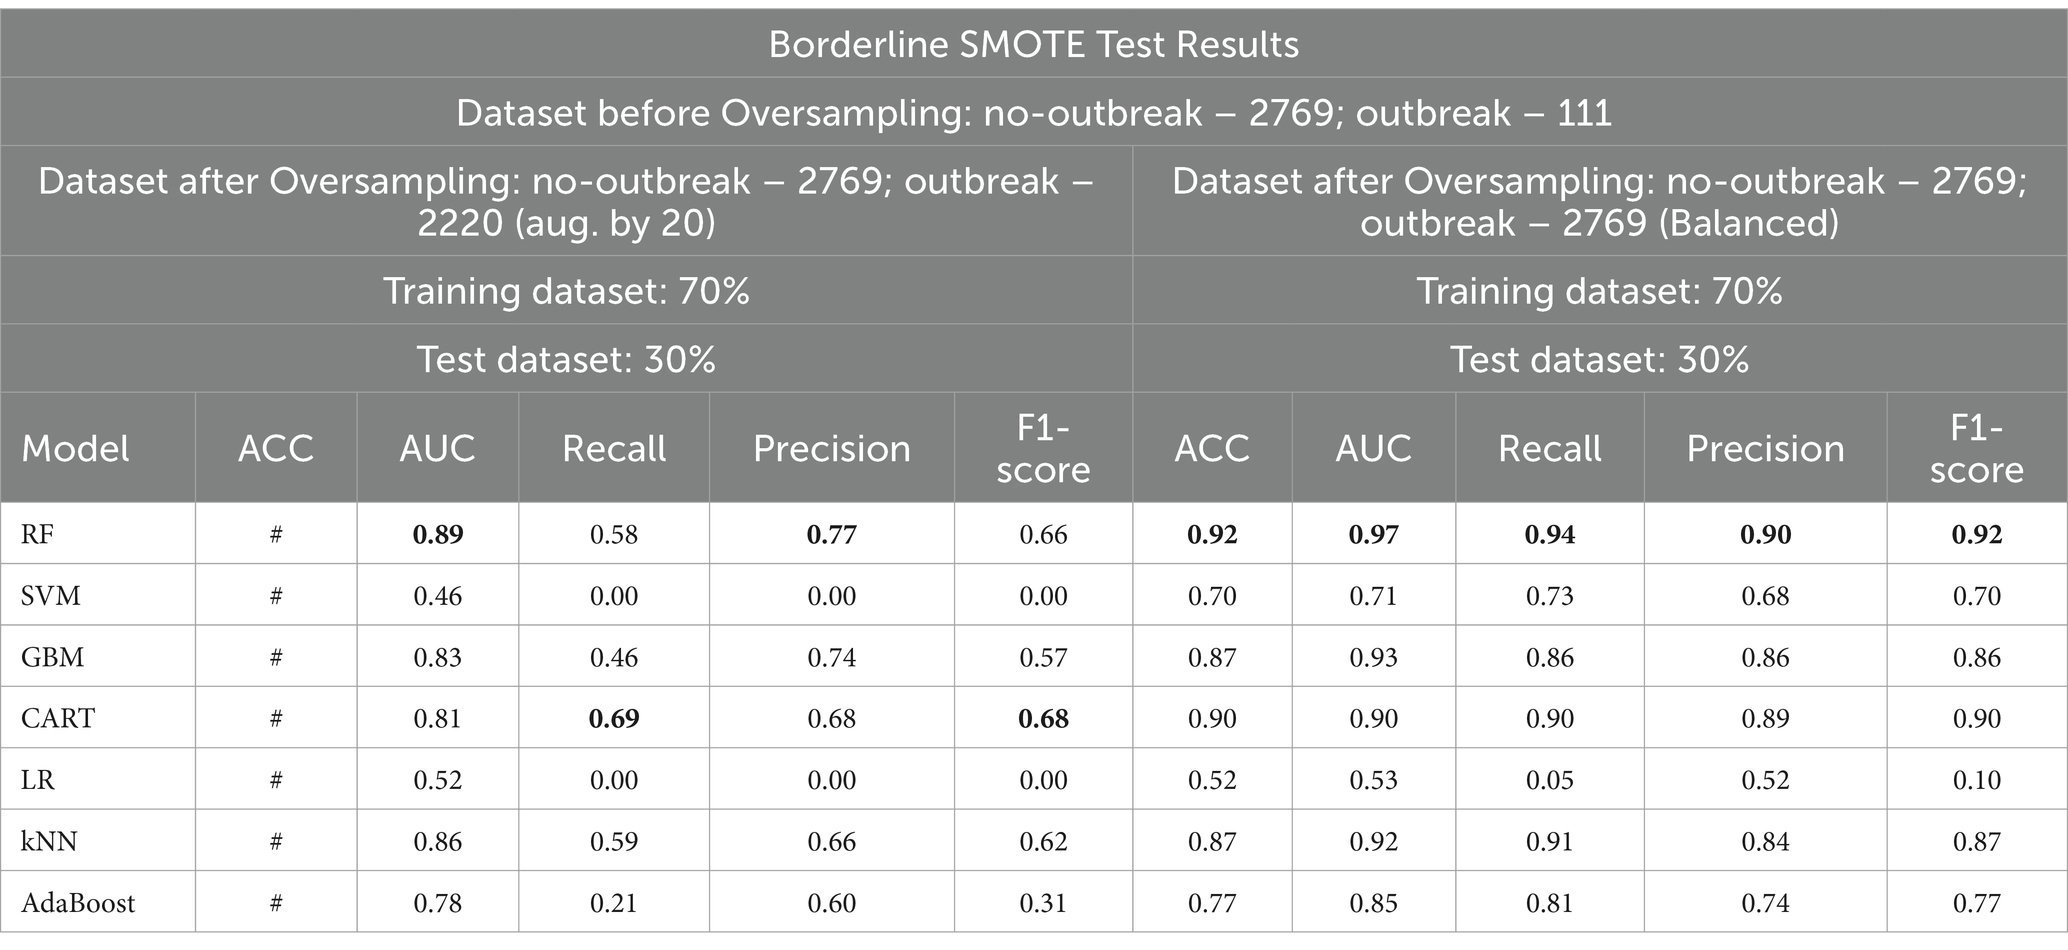
Table 6. Comparative analysis of baseline model performance with minority class oversampled by a factor of 20 and balanced dataset using borderline SMOTE.
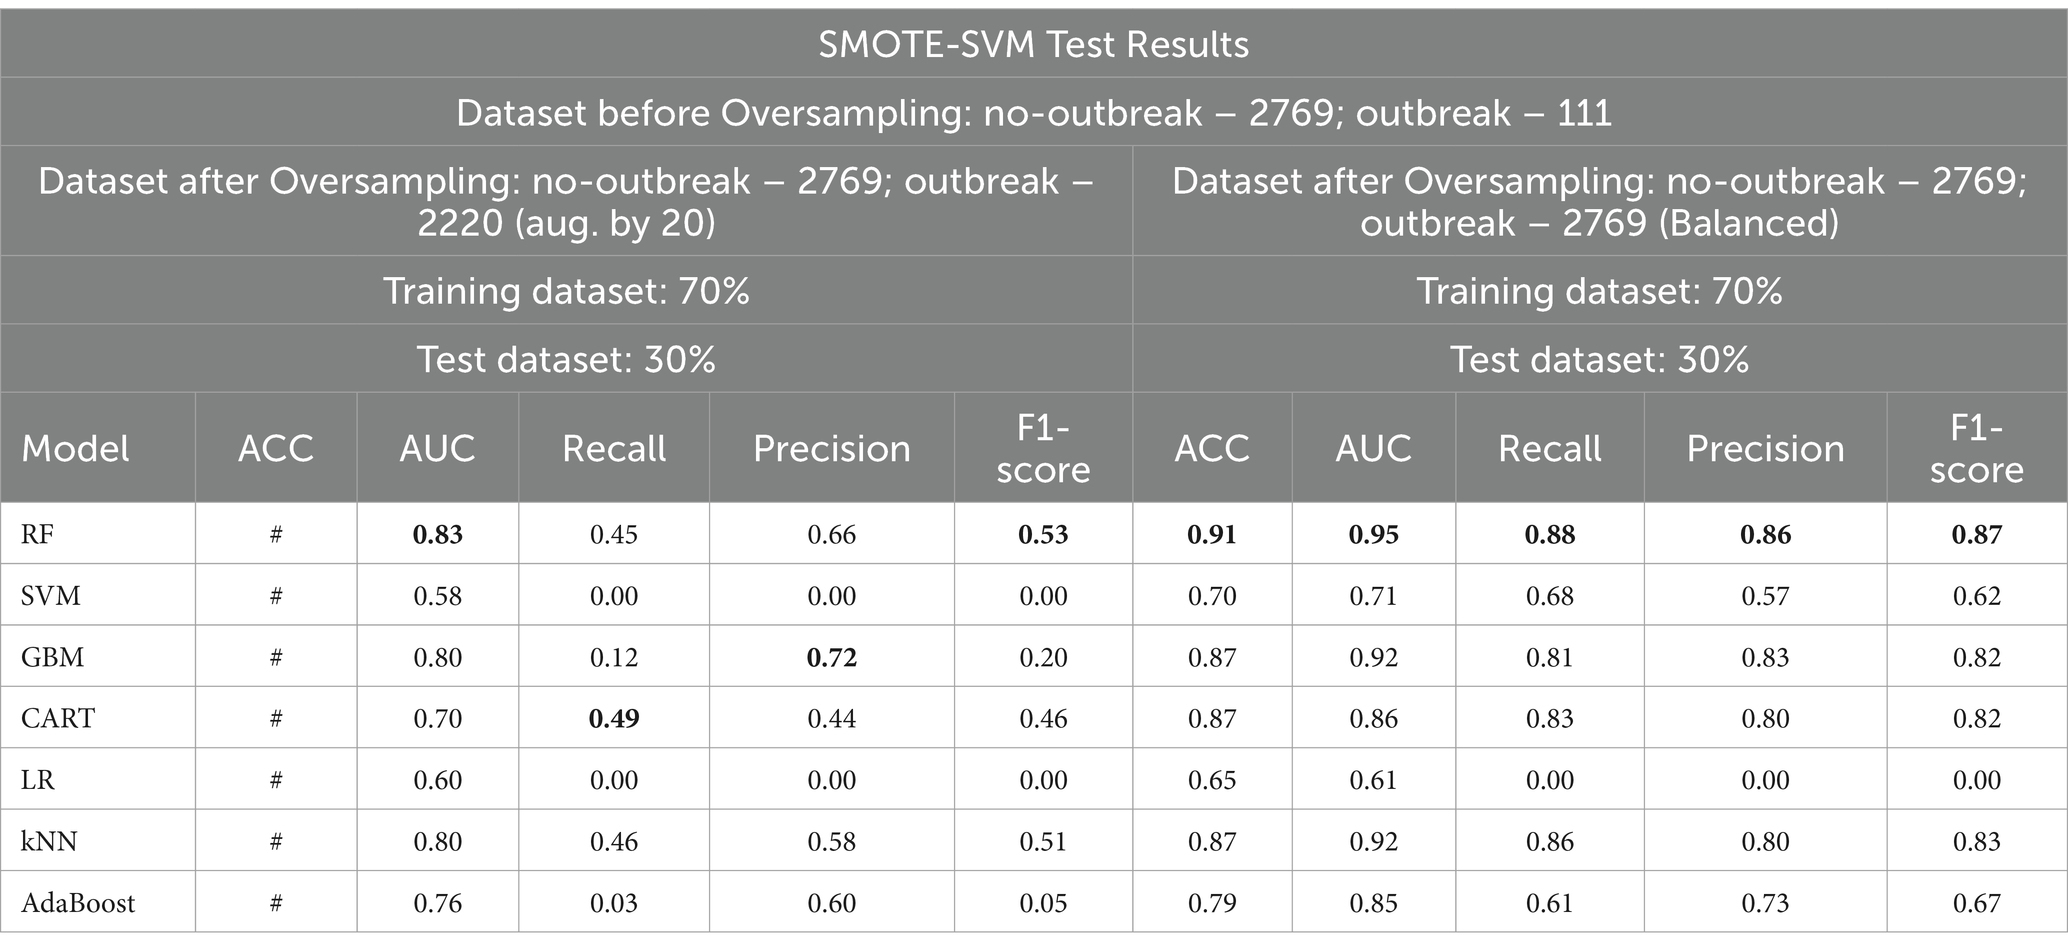
Table 7. Comparative analysis of baseline model performance with minority class oversampled by a factor of 20 and balanced dataset using SMOTE-SVM.
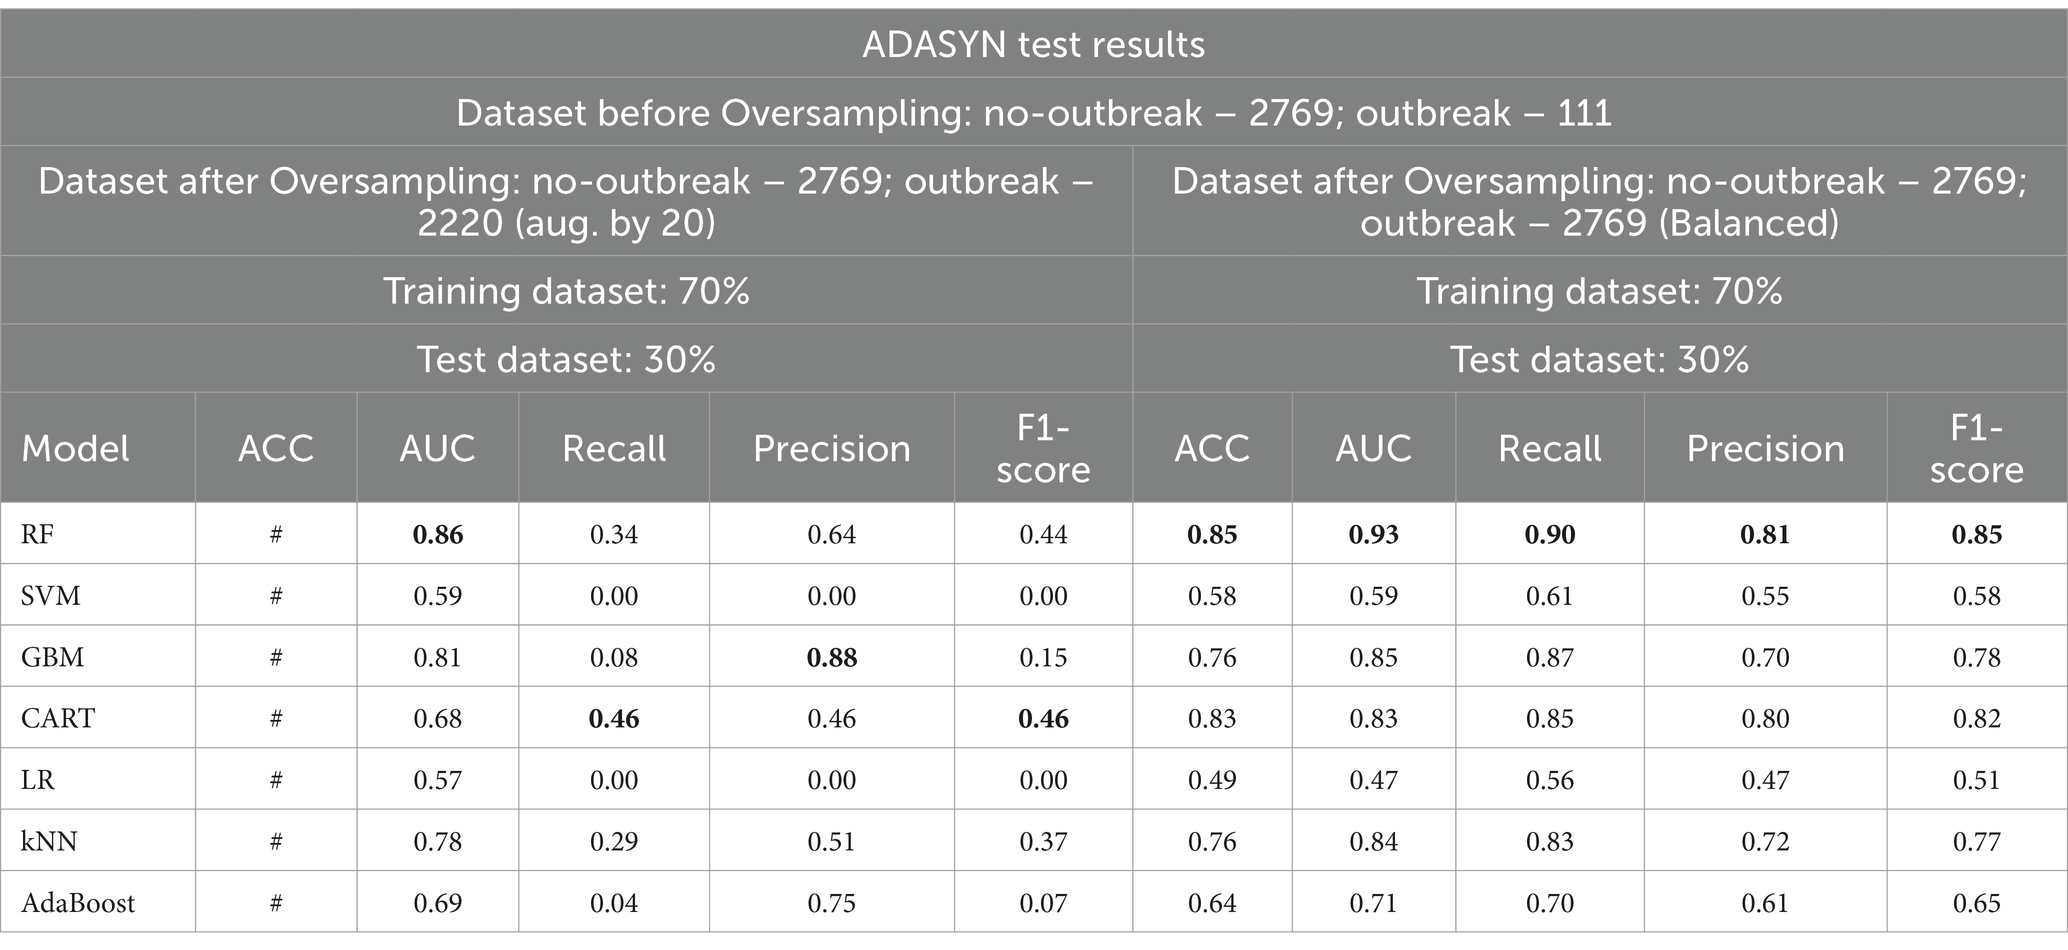
Table 8. Comparative analysis of baseline model performance with minority class oversampled by a factor of 20 and balanced dataset using ADASYN.
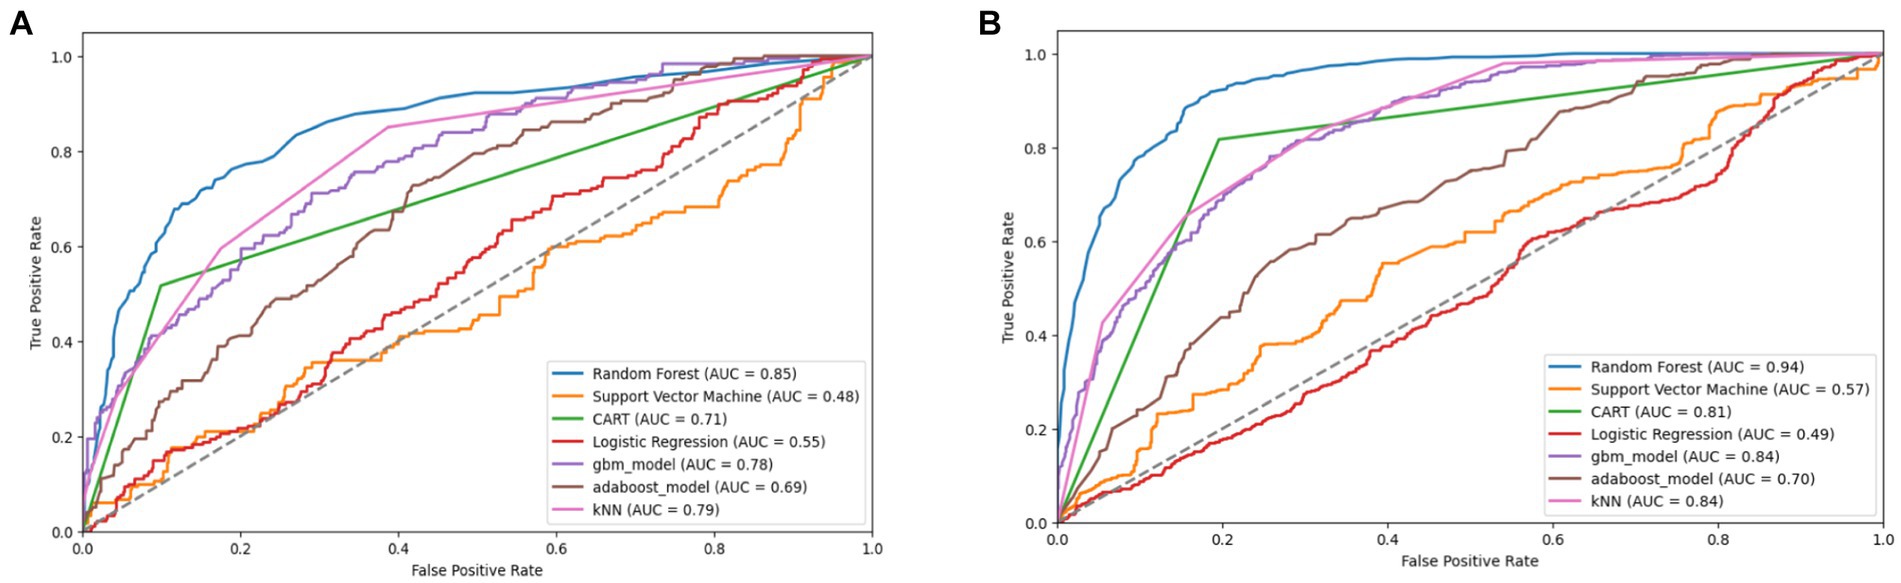
Figure 10. Combined AUC-ROC performance of baseline models with minority class oversampled by a factor of 20 (A) and balanced dataset (B) using SMOTE (original).
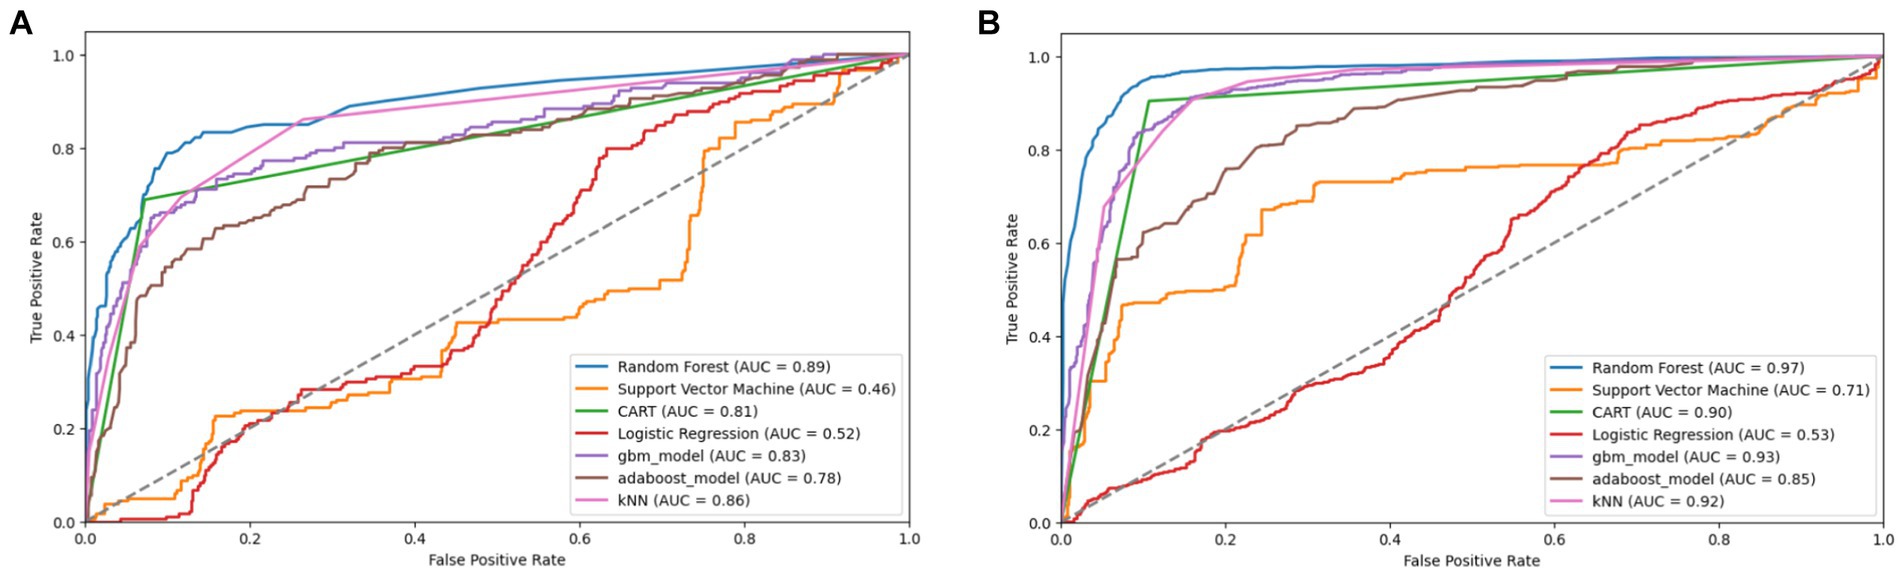
Figure 11. Combined AUC-ROC performance of baseline models with minority class oversampled by a factor of 20 (A) and balanced dataset (B) using borderline SMOTE.
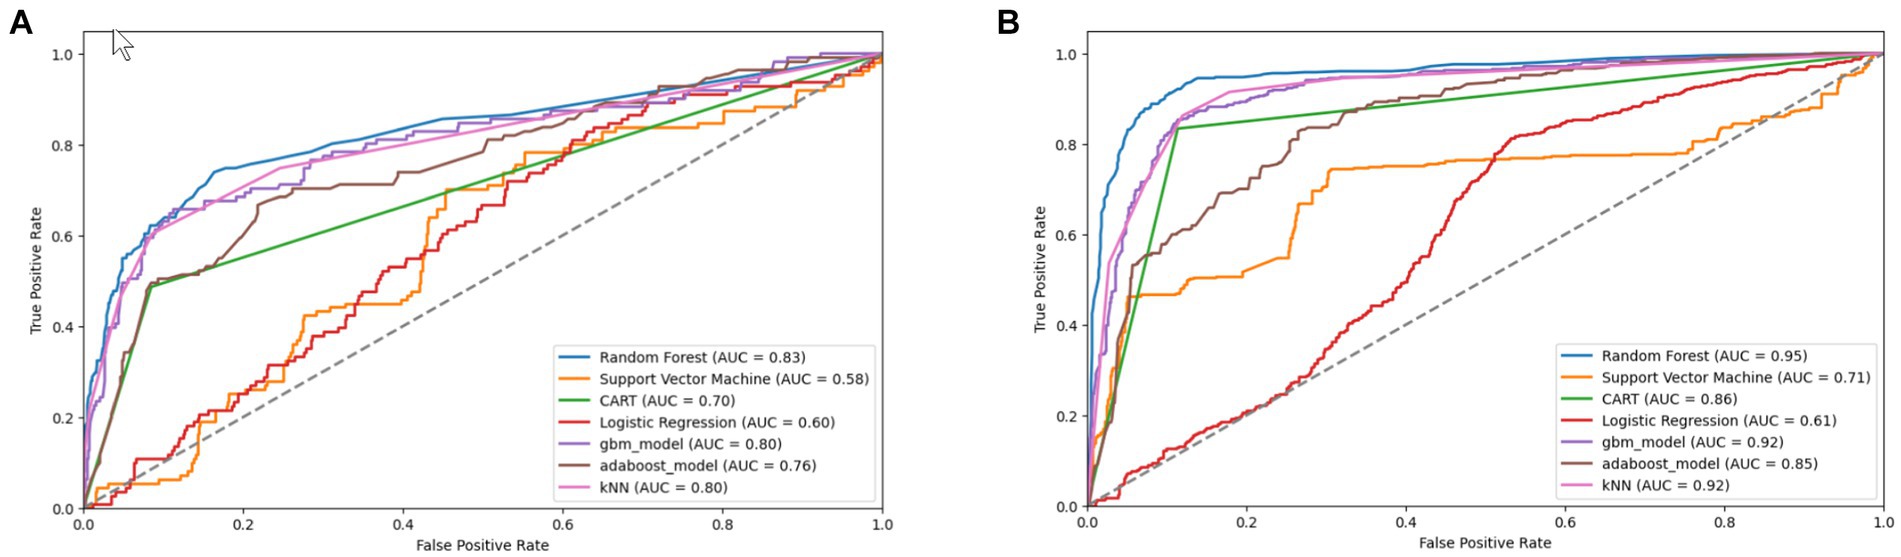
Figure 12. Combined AUC-ROC performance of baseline models with minority class oversampled by a factor of 20 (A) and balanced dataset (B) using SMOTE-SVM.
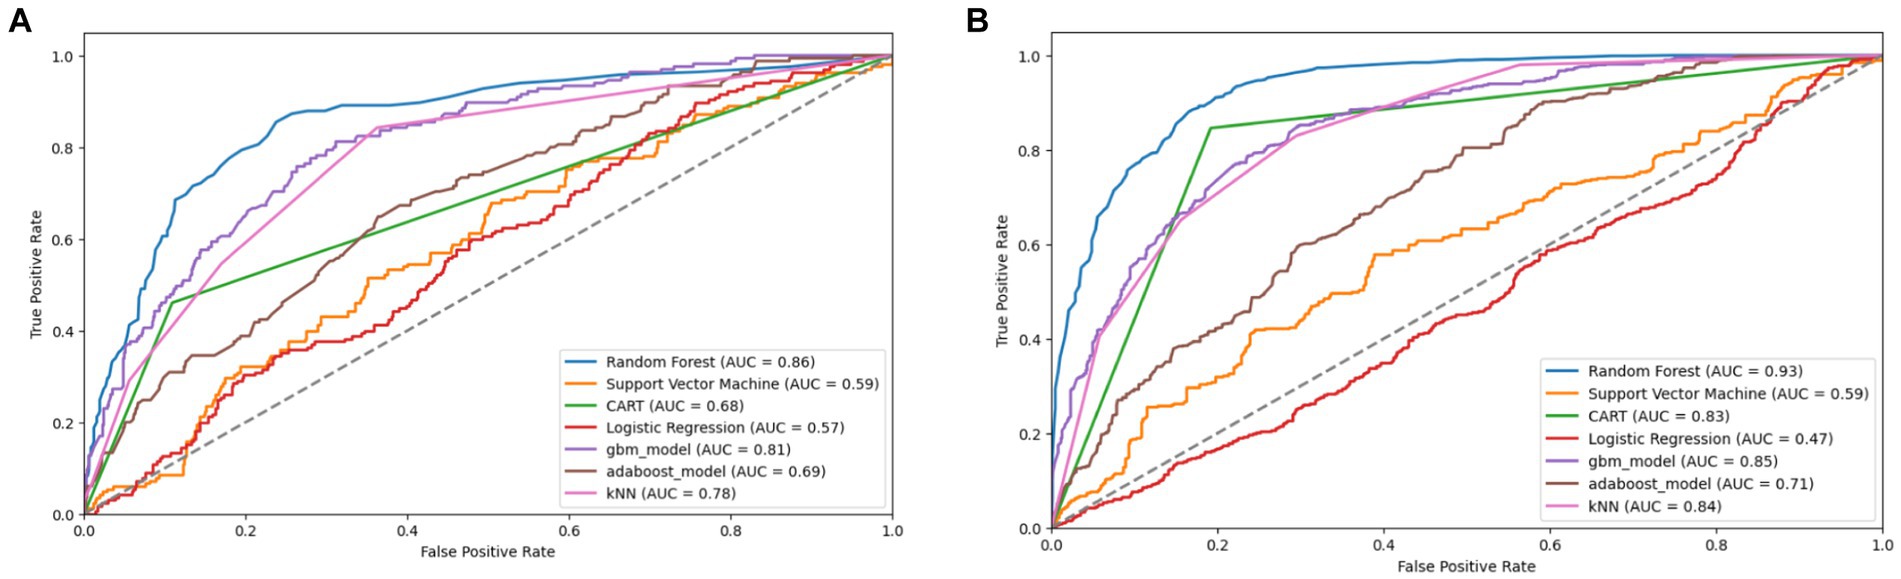
Figure 13. Combined AUC-ROC performance of baseline models with minority class oversampled by a factor of 20 (A) and balanced dataset (B) using ADASYN.
When considering the oversampled balanced dataset across all techniques, the Random Forest (RF) model consistently demonstrated the most impressive performance among the seven machine learning algorithms utilized in the study. Across all techniques where the classes were balanced, RF achieved an accuracy of 85% and above, indicating its high precision in making correct predictions. Moreover, RF showcased an AUC value of 0.93 and above, implying a strong ability to distinguish between positive and negative cases and offering excellent overall model performance. Additionally, RF attained high values for precision (0.81) and above, recall (0.88) and above, and F1 score (0.85) and above, signifying its balanced performance across various evaluation criteria (Supplementary Table 3 and Tables 5–7).
4.2.1.4 Optimal baseline model performance under stationary environment
To determine the most effective baseline model among the experimented oversampling techniques, the study calculated the weighted average scores, which were utilized to rank their performance, as illustrated in Table 9, with bold values showing the highest performance. Among all the experimented models, RF emerged as the best-performing model across the board, as depicted in Figure 14. Similarly, Borderline-SMOTE technique demonstrated superiority as the most effective oversampling technique for mitigating class imbalance and improving the prediction of FMD outbreaks in Uganda, as evidenced in Figure 14.
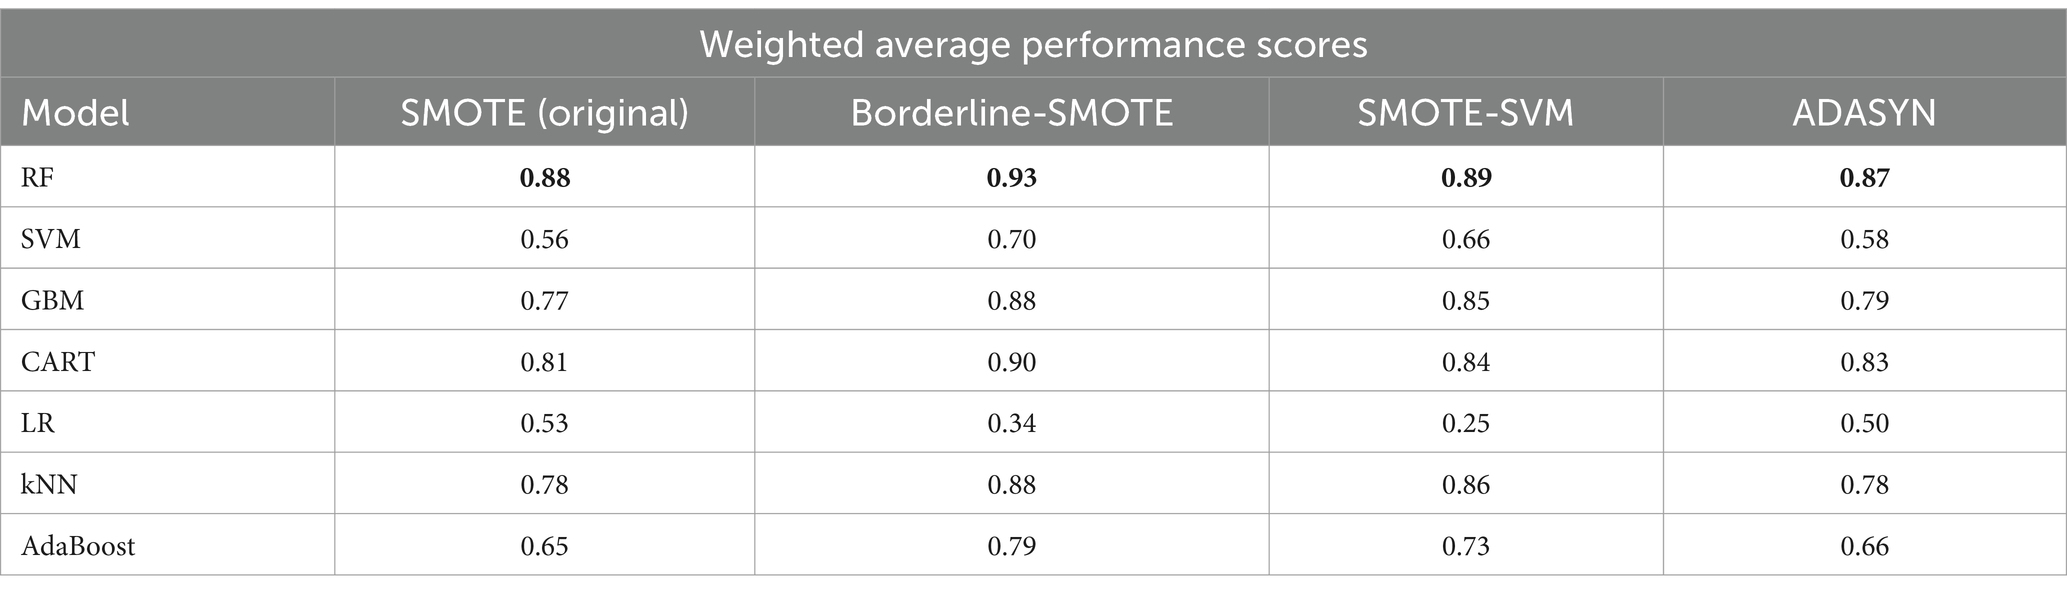
Table 9. Weighted average performance scores of baseline models across oversampling techniques.
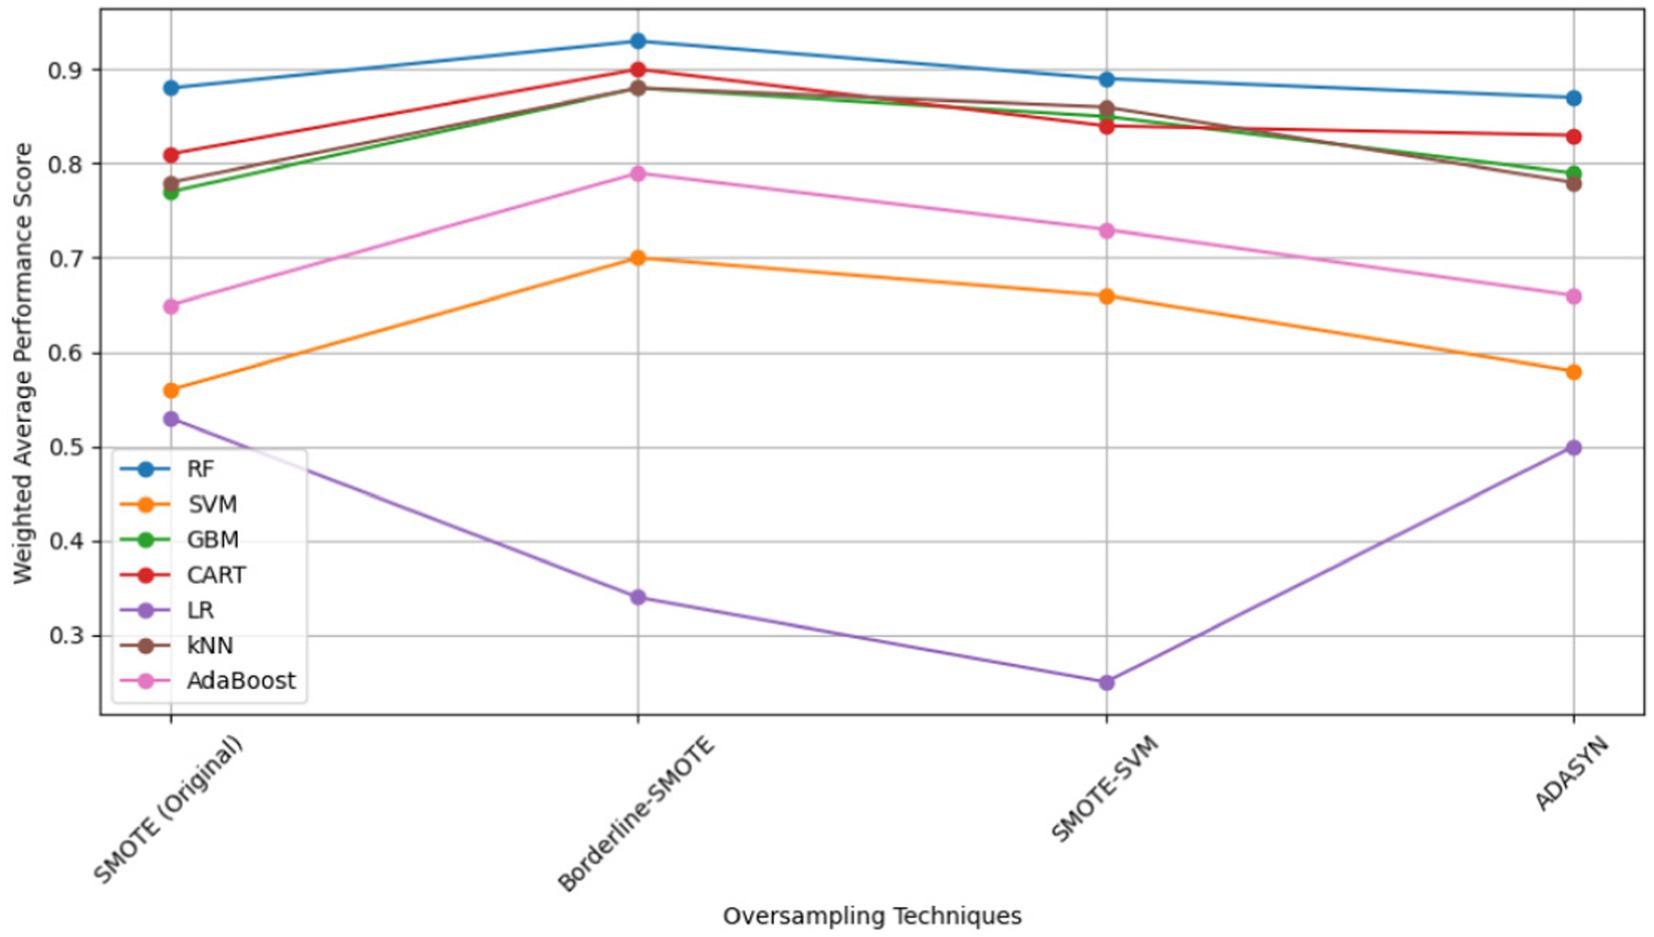
Figure 14. Visual overview of baseline model performance across oversampling techniques.
4.2.2 Baseline model validation performance under distribution shifts
In this section, the study presents the validation performance of the baseline models under varying distributions. It includes a comparative analysis of baseline model performance, highlighting the rates of performance degradation.
4.2.2.1 Phase 4: baseline model performance
Based on the results presented in Table 9, the Borderline SMOTE technique emerges as the most effective method for addressing class imbalance within the FMD dataset. Therefore, the baseline model test performances obtained under the Borderline SMOTE technique are considered as the reference results for evaluating the impact of distribution shifts on the predictive capability of the seven selected machine learning models for predicting FMD outbreaks in Uganda. In this section, the study presents findings that illustrate the influence of distribution shifts on the predictive performance of the baseline models, as depicted in Supplementary Table 4 and Table 10, with bold values showing the highest performance. The results indicate significant degradation rates across all models.
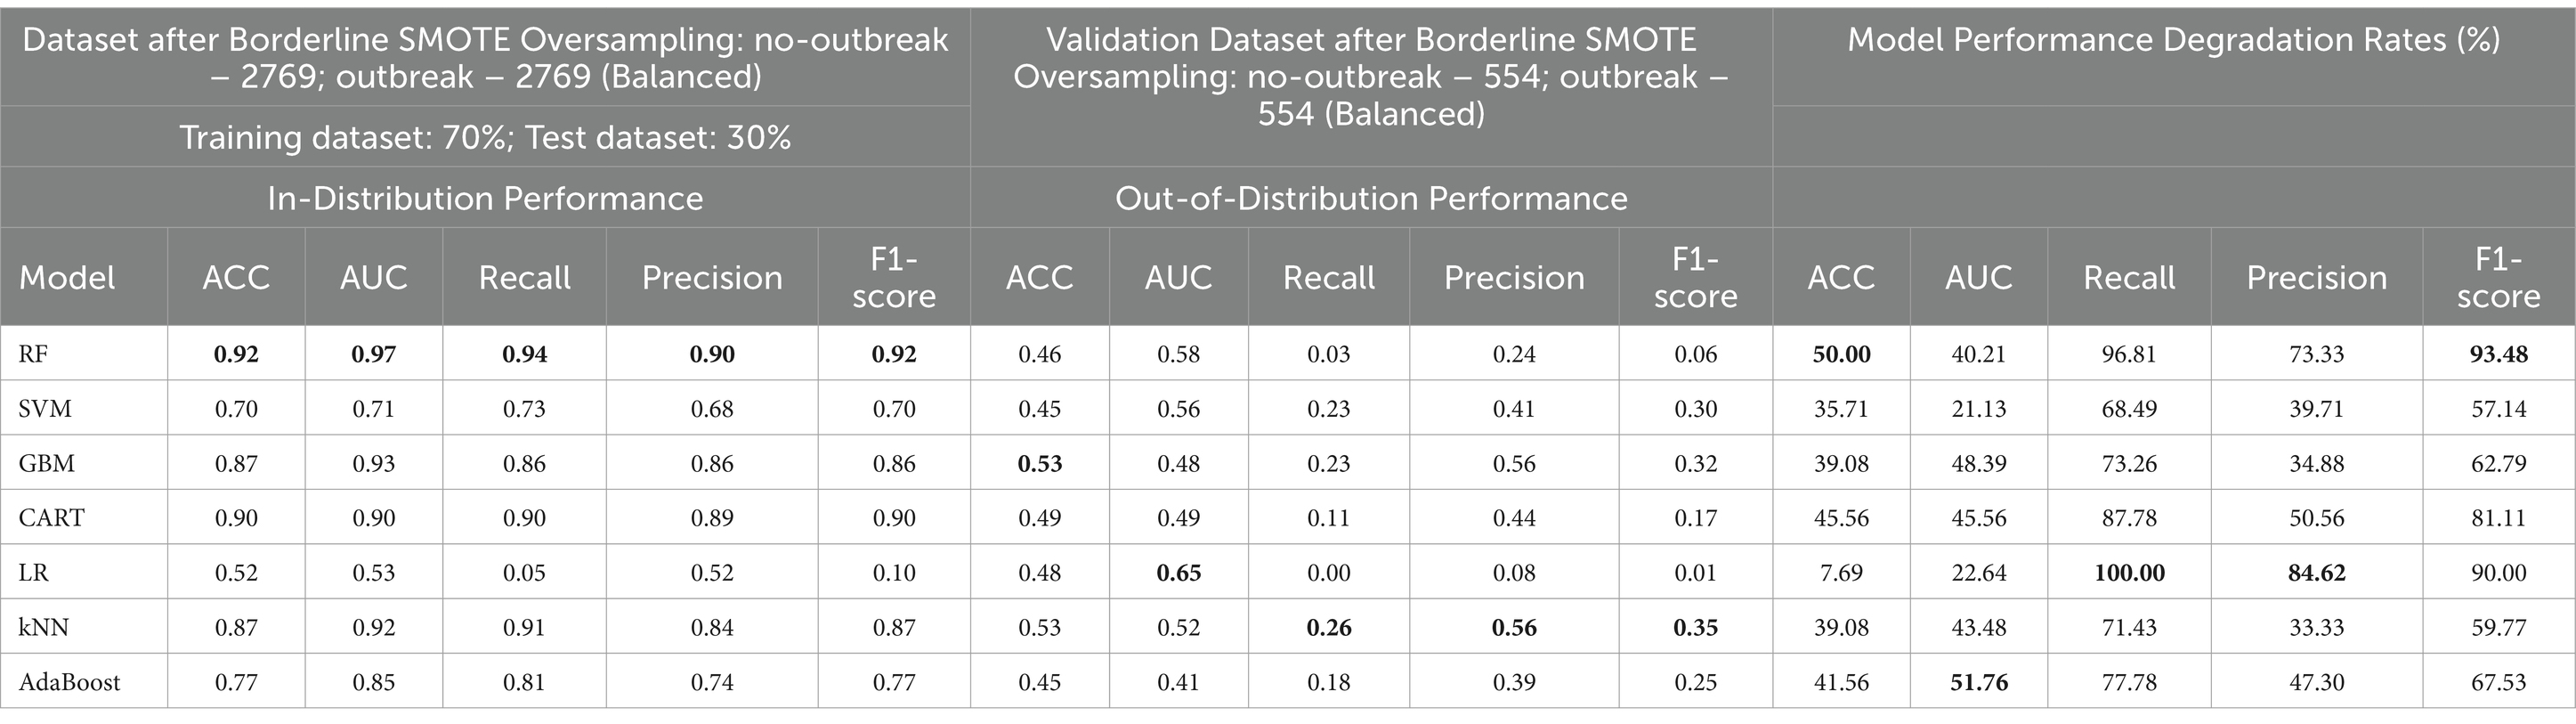
Table 10. Comparative model performance between in-distribution and out-of-distribution settings.
4.2.2.1.1 Baseline model performance degradation rates
When assessing the performance of the seven baseline models on the target (validation) dataset, the study noted varying degrees of performance, highlighting the impact of distribution shifts on model performances in predicting FMD outbreaks (Table 10). Each model displayed distinct characteristics concerning accuracy, sensitivity, precision, and specificity under these conditions.
Random Forest (RF), initially displaying superior overall performance in the absence of distribution shifts, saw a significant decrease in accuracy (ACC) by 50% and a notable decline of 40.21% in the Area Under the Curve (AUC) value of the Receiver Operating Characteristic (ROC) curve. Additionally, RF experienced reductions in Recall by 96.81%, Precision by 73.33%, and F1-score by 93.48%. Support Vector Machine (SVM) encountered reductions in accuracy (ACC) by 35.71%, AUC by 21.13%, Recall by 68.49%, Precision by 39.71%, and F1-score by 57.14%. Gradient Boosting Machine (GBM) saw decreases in accuracy (ACC) by 39.08%, AUC by 48.39%, Recall by 73.26%, Precision by 34.88%, and F1-score by 62.79%. Classification and Regression Trees (CART) experienced declines in accuracy (ACC) by 45.56%, AUC by 45.56%, Recall by 87.78%, Precision by 50.56%, and F1-score by 81.11%. Logistic Regression (LR) encountered reductions in accuracy (ACC) by 7.69%, Recall by 100.00%, Precision by 84.62%, and F1-score by 90.00%, yet LR demonstrated improved performance for AUC by 22.64%, attributed to its incorporation of regularization techniques including L1 and L2. k-Nearest Neighbors (kNN) experienced reductions in accuracy (ACC) by 39.08%, AUC by 43.48%, Recall by 71.43%, Precision by 33.33%, and F1-score by 59.77%. AdaBoost saw decreases in accuracy (ACC) by 41.56%, AUC by 51.76%, Recall by 77.78%, Precision by 47.30%, and F1-score by 67.53%. These findings underscore the considerable influence of distribution shifts on the predictive performance of ML-based algorithms across various evaluation metrics.
4.2.2.1.2 Feature importance
In predicting FMD outbreaks in Uganda, the importance of features played a pivotal role in enhancing the understanding and predictive capabilities of the models. Feature importance refers to the measure of how much each input feature contributes to the predictive power of a machine learning model (Kumar et al., 2020; Feng et al., 2021). It provides insights into which features have the most significant impact on the model’s performance and can help identify the key factors influencing the occurrence of FMD outbreaks. The study used the Random Forest (RF) model, which demonstrated superior predictive performance, and CART to assess feature importance (Figure 15). Based on the importance results, the following features were found to have the most significant impact on FMD outbreak prediction:
• Rainfall: This feature exhibited the highest level of importance, signifying its strong association with FMD outbreaks. Low rainfall may create conditions conducive to the disease’s transmission and, as such, serves as an essential early warning indicator.
• Max temperature: Max temperature was identified as the second most important feature. Temperature can influence disease vectors, animal behavior, and the survival of the virus, making it crucial in predicting outbreaks.
• Cattle density: The density of cattle populations was the third most important feature. High cattle density areas may experience a more rapid spread of FMD, making this a critical factor to consider in preventive measures.
• Proximity to adjacent parks: The proximity of areas to protected wildlife zones was identified as the fourth most important feature. These regions may serve as reservoirs for the disease, increasing the risk of outbreaks in nearby livestock populations.
• Proximity to international borders: Closeness to international borders rounded out the list of important features. Border areas may be more susceptible to the introduction of the virus through cross-border movements of animals.
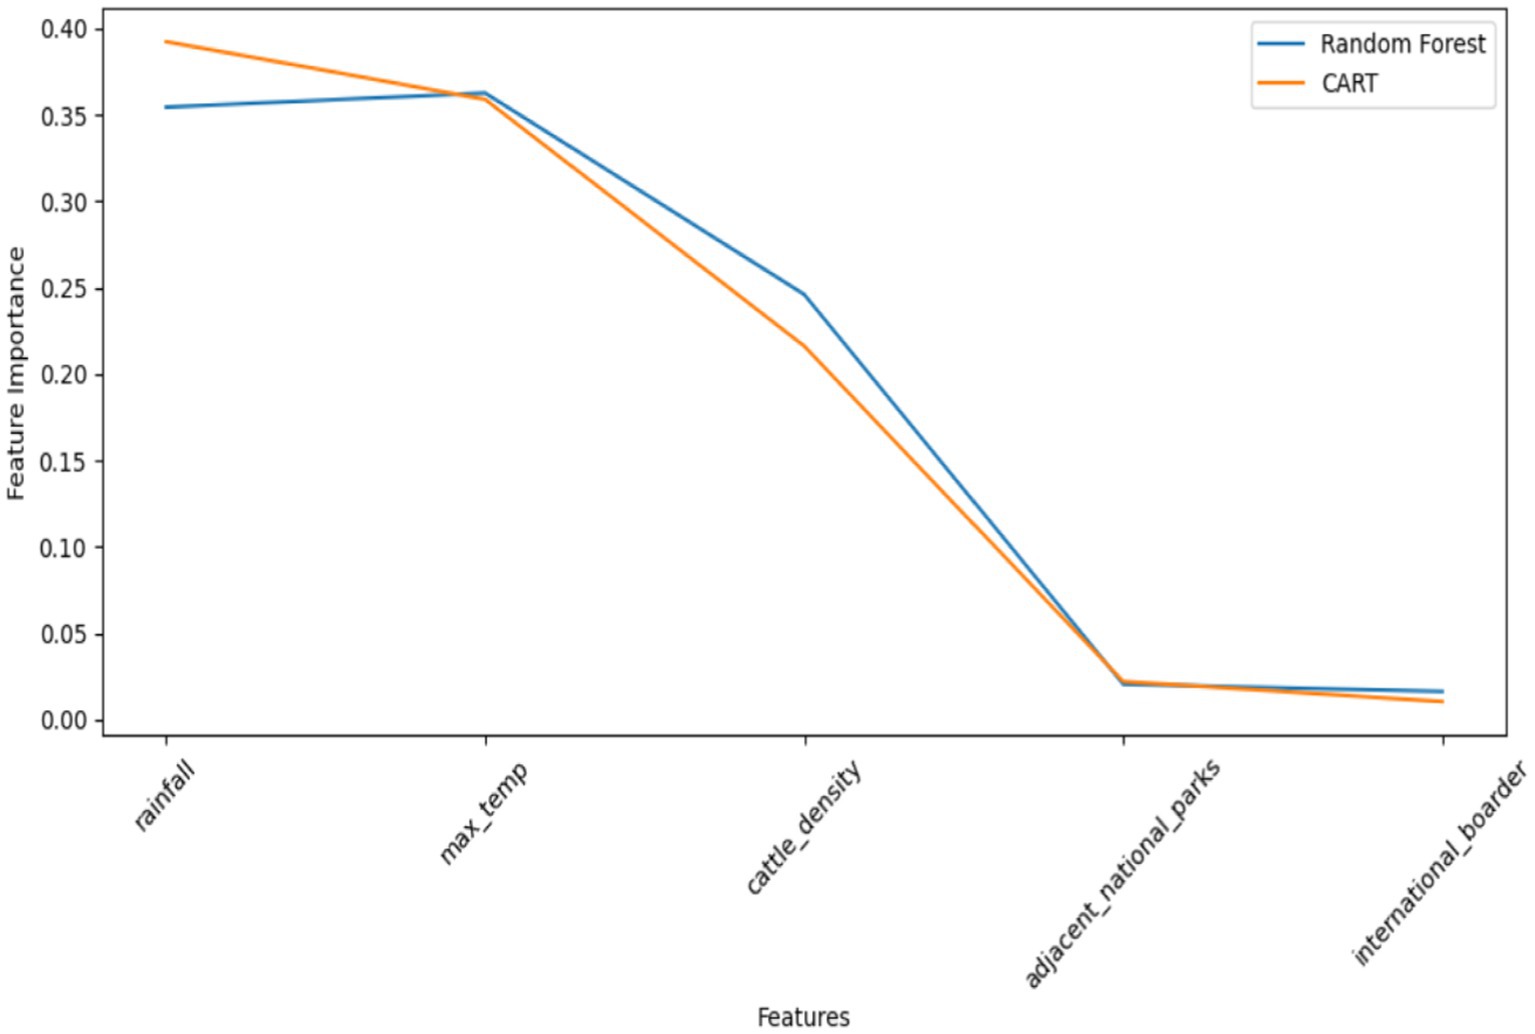
Figure 15. Comparison of feature importance for RF and CART models.
By recognizing the importance of these features, the study emphasizes the need to focus on these variables when implementing preventive strategies and early warning systems. It is clear that understanding the importance of features significantly contributes to developing effective measures for managing and controlling FMD outbreaks in Uganda.
As indicated, rainfall and maximum temperature contribute significantly to the predictive power of the models, followed by cattle density. Proximity to national parks and the international border contributes little to the predictive power.
5 Discussion of results
The study aimed, firstly, to create a unified and curated dataset for Foot-and-Mouth Disease (FMD) in Uganda. This was achieved by utilizing a retrospective approach to collect disparate datasets from various sources and conducting experiments to address missing data and outliers. Secondly, the study aimed to assess the performance degradation rates under varying distribution. This was accomplished by training machine learning models on the unified and curated FMD dataset, testing them, and evaluating their predictive performance on the holdout dataset to measure the impact of variability in the dataset. This section presents a discussion of the study’s findings, contributions, limitations, and recommendations.
5.1 A unified and curated dataset for FMD
The study retrospectively collected historical data on FMD outbreaks and the factors influencing their occurrences, disparate datasets were pre-processed to create a unified and curated dataset for FMD in Uganda. The statistical results provide significant evidence of class imbalance, which is known to impact performance in the ML domain. Predictions tend to be biased toward the majority class, as the number of FMD non-outbreaks were significantly greater than the number of outbreaks.
5.2 ML-based predictive performance degradation under varying distribution
The study investigated seven ML algorithms as baseline models for FMD outbreak prediction. Notably, significant impacts of class imbalance on the predictive performance of these algorithms were observed when using the randomly sampled test dataset. The poor performance was observed across multiple evaluation metrics, including area under the curve (AUC), recall, precision, and F1-score. Such consistent poor performance highlighted the critical need for addressing the class imbalance problem for improved performance in prediction of FMD outbreaks in Uganda. To mitigate class imbalance in the FMD dataset, various data augmentation techniques were explored, including random undersampling, SMOTE (Original), Borderline-SMOTE, SMOTE-SVM, and ADASYN.
The findings revealed that oversampling techniques led to substantial improvements in model performance, particularly when the classes were balanced. Among these techniques, Borderline-SMOTE emerged as the most effective, attributed to its superior handling of noise through synthetic sample generation. Additionally, among the seven models examined, random forest (RF) exhibited superior performance across all evaluation metrics including accuracy, AUC, recall, precision and F1-score on the test dataset. This can be attributed to its ensemble nature, where it combines various decision trees to enhance predictive accuracy. However, when validated with a target dataset exhibiting varying distributions, all models experienced significant degradation across all performance metrics. These findings underscore the significance of addressing distribution shifts in FMD outbreak prediction.
5.3 Limitations of the study
This section acknowledges the limitations encountered during the study and discusses their potential impact on the results:
a. While this study focused on five key risk factors including rainfall, temperature, proximity to international borders, proximity to national parks, and cattle density as predictors for FMD outbreaks, it acknowledges the potential importance of other factors. These include animal movement, animal trade, water sources, and breeding methods, which could further enhance the predictive performance of machine learning models.
b. The study was conducted within the endemic settings of Uganda. Consequently, the predictors identified may be unique to Uganda’s context, impacting the generalizability of the findings to other regions.
c. Variations in FMD outbreak reporting practices can lead to inconsistencies in the data. Some regions have better reporting mechanisms for FMD outbreaks, while others may underreport or overreport cases.
d. The use of performance degradation rates across metrics to detect distribution shifts in the FMD dataset is prone to trigger false alarms, prompting retraining which is time-consuming and costly.
6 Conclusion
This study aimed to explore the predictive capabilities of machine learning models for Foot and Mouth Disease outbreaks in Uganda by creating a unified dataset and evaluating model performance under varying distribution conditions. The unified dataset highlighted significant class imbalances in FMD outbreak data, a critical challenge for accurate predictive modeling. Various data augmentation techniques, including SMOTE, borderline-SMOTE, SMOTE-SVM, and ADASYN, were explored to mitigate these imbalances. In a stationary environment, where data distributions were consistent, models such as Random Forest (RF) with borderline-SMOTE excelled on the test dataset, showcasing robust predictive performance. However, when validated under scenarios of varying distributions, all models exhibited notable performance degradation. This highlighted a critical limitation: the current models are not sufficiently robust to reliably predict FMD outbreaks in Uganda when environmental conditions change. The findings underscore the need for future research to focus on advancing both data-centric and model-centric approaches. Specifically, efforts should explore advanced techniques in domain adaptation to effectively handle the challenges posed by varying distributions in FMD outbreak prediction. Furthermore, integrating additional predictors such as animal movement patterns, trade data, and ecological factors could enhance the predictive power of models. These enhancements are crucial for improving preparedness and response strategies against FMD outbreaks, not only in Uganda but also in other endemic regions globally.
Data availability statement
Publicly available datasets were analyzed in this study. This data can be found at: http://fleet.naro.go.ug/mileyplc/FMD_outbreaks_dataset_risk_current_1.csv; http://fleet.naro.go.ug/mileyplc/FMD_outbreaks_dataset_risk_reference_1.csv.
Author contributions
GK: Conceptualization, Data curation, Formal analysis, Funding acquisition, Investigation, Methodology, Project administration, Resources, Software, Supervision, Validation, Visualization, Writing – original draft, Writing – review & editing. FK: Writing – original draft, Writing – review & editing. SK: Writing – original draft, Writing – review & editing. DJ: Writing – original draft, Writing – review & editing. SB: Writing – original draft, Writing – review & editing. JR: Writing – original draft, Writing – review & editing. PS: Writing – original draft, Writing – review & editing. SM: Writing – original draft, Writing – review & editing. YK: Writing – original draft, Writing – review & editing.
Funding
The author(s) declare that no financial support was received for the research, authorship, and/or publication of this article.
Conflict of interest
The authors declare that the research was conducted in the absence of any commercial or financial relationships that could be construed as a potential conflict of interest.
Publisher’s note
All claims expressed in this article are solely those of the authors and do not necessarily represent those of their affiliated organizations, or those of the publisher, the editors and the reviewers. Any product that may be evaluated in this article, or claim that may be made by its manufacturer, is not guaranteed or endorsed by the publisher.
Supplementary material
The Supplementary material for this article can be found online at: https://www.frontiersin.org/articles/10.3389/frai.2024.1446368/full#supplementary-material
References
Abdela, N. (2017). Sero-prevalence, risk factors and distribution of foot and mouth disease in Ethiopia. Acta Trop. 169, 125–132. doi: 10.1016/j.actatropica.2017.02.017
Aghaei, S., Gómez, A., and Vayanos, P. (2021). Strong optimal classification trees. arXiv Preprint arXiv:2103.15965.
Ahn, H., Sun, K., and Kim, K. P. (2022). Comparison of missing data imputation methods in time series forecasting. Comput. Mater. Continua 70, 767–779. doi: 10.32604/cmc.2022.019369
Alexandersen, S., Knowles, N. J., Belsham, G. J., Dekker, A., Nfon, C., Zhang, Z., et al. (2019). Picornaviruses. Diseases of Swine, Chapter, 40, 641–684. doi: 10.1002/9781119350927.ch40
Ayebazibwe, C., Tjørnehøj, K., Mwiine, F. N., Muwanika, V. B., Ademun Okurut, A. R., Siegismund, H. R., et al. (2010). Patterns, risk factors and characteristics of reported and perceived foot-and-mouth disease (FMD) in Uganda. Trop. Anim. Health Prod. 42, 1547–1559. doi: 10.1007/s11250-010-9605-3
Bachanek-Bankowska, K., Di Nardo, A., Wadsworth, J., Mioulet, V., Pezzoni, G., Grazioli, S., et al. (2018). Reconstructing the evolutionary history of pandemic foot-and-mouth disease viruses: the impact of recombination within the emerging O/ME-SA/Ind-2001 lineage. Sci. Rep. 8:14693. doi: 10.1038/s41598-018-32693-8
Baluka, S. A. (2016). Economic effects of foot and mouth disease outbreaks along the cattle marketing chain in Uganda. Vet. World 9, 544–553. doi: 10.14202/vetworld.2016.544-553
Baluka, S. A., Hisali, E., Wasswa, F., Ocaido, M., and Mugisha, A. (2013). Socio-economic risk factors associated with foot and mouth disease, and contagious bovine pleuropneumonia outbreaks in Uganda. Livest. Res. Rural. Dev. 25:12.
Bansal, M., Goyal, A., and Choudhary, A. (2022). A comparative analysis of K-nearest neighbor, genetic, support vector machine, decision tree, and long short-term memory algorithms in machine learning. Decision Anal. J. 3:100071. doi: 10.1016/j.dajour.2022.100071
Bertram, M. R., Yadav, S., Stenfeldt, C., Delgado, A., and Arzt, J. (2020). Extinction dynamics of the foot-and-mouth disease virus carrier state under natural conditions. Front. Vet. Sci. 7:276. doi: 10.3389/fvets.2020.00276
Beyene, N., Campbell, R., Kalyanam, R., Kim, I. L., Song, C. X., and Zhao, L. (2022). Benefits and Limitations of Jupyter-based Scientific Web Applications, IEEE 18th International Conference on e-Science (e-Science), Salt Lake City, UT, USA. 542–550.
Bhardwaj, P. (2019). Types of sampling in research. J. Primary Care Special. 5, 157–163. doi: 10.4103/jpcs.jpcs_62_19
Brewer, N., Campbell, R., Kalyanam, R., Kim, I. L., Song, C. X., and Zhao, L. (2022). Benefits and limitations of Jupyter-based scientific web applications, 542–550. doi: 10.1109/eScience55777.2022.00094
Brown, E., Nelson, N., Gubbins, S., and Colenutt, C. (2022). Airborne transmission of foot-and-mouth disease virus: A review of past and present perspectives. Viruses 14:1009. doi: 10.3390/v14051009
Buda, M., Maki, A., and Mazurowski, M. A. (2018). A systematic study of the class imbalance problem in convolutional neural networks. Neural Netw. 106, 249–259. doi: 10.1016/j.neunet.2018.07.011
Carslake, C., Vázquez-Diosdado, J. A., and Kaler, J. (2020). Machine learning algorithms to classify and quantify multiple behaviours in dairy calves using a sensor: Moving beyond classification in precision livestock. Sensors, 21, 88. doi: 10.3390/s21010088
Cervantes, J., Garcia-Lamont, F., Rodríguez-Mazahua, L., and Lopez, A. (2020). A comprehensive survey on support vector machine classification: applications, challenges and trends. Neurocomputing 408, 189–215. doi: 10.1016/j.neucom.2019.10.118
Chang, V., Bhavani, V. R., Xu, A. Q., and Hossain, M. (2022). An artificial intelligence model for heart disease detection using machine learning algorithms. Healthc. Anal. 2:100016. doi: 10.1016/j.health.2022.100016
Chepkwony, E. C., Gitao, G. C., Muchemi, G. M., Sangula, A. K., and Kairu-Wanyoike, S. W. (2021). Epidemiological study on foot-and-mouth disease in small ruminants: sero-prevalence and risk factor assessment in Kenya. PLoS One 16:e0234286. doi: 10.1371/journal.pone.0234286
Chikodili, N. B., Abdulmalik, M. D., Abisoye, O. A., and Bashir, S. A. (2021). “Outlier Detection in Multivariate Time Series Data Using a Fusion of K-Medoid, Standardized Euclidean Distance and Z-Score,” in Information and Communication Technology and Applications - Third International Conference, ICTA 2020, Eds. S. Misra, and B. Muhammad-Bello. Revised Selected Papers. (Communications in Computer and Information Science; Vol. 1350). Springer Science and Business Media Deutschland GmbH, 259–271.
Childs, K., Jackson, B., Harvey, Y., and Seago, J. (2022). Trans-Encapsidation of foot-and-mouth disease virus genomes facilitates escape from neutralizing antibodies. Viruses 14:1161. doi: 10.3390/v14061161
Chimera, E. T., Fosgate, G. T., Etter, E. M., Jemberu, W. T., Kamwendo, G., and Njoka, P. (2022). Spatio-temporal patterns and risk factors of foot-and-mouth disease in Malawi between 1957 and 2019. Prev. Vet. Med. 204:105639. doi: 10.1016/j.prevetmed.2022.105639
Choudhury, P., Allen, R. T., and Endres, M. G. (2021). Machine learning for pattern discovery in management research. Strateg. Manag. J. 42, 30–57. doi: 10.1002/smj.3215
Clemmons, E. A., Alfson, K. J., and Dutton, J. W.III. (2021). Transboundary animal diseases, an overview of 17 diseases with potential for global spread and serious consequences. Animals 11:2039. doi: 10.3390/ani11072039
Dixit, R. R. (2022). Predicting fetal health using cardiotocograms: a machine learning approach. J. Adv. Anal. Healthc. Manag. 6, 43–57.
Dubie, T., and Negash, W. (2021). Seroprevalence of bovine foot and mouth disease (FMD) and its associated risk factors in selected districts of Afar region, Ethiopia. Vet. Med. Sci. 7, 1678–1687. doi: 10.1002/vms3.574
Dutta, A., Hasan, M. K., Ahmad, M., Awal, M. A., Islam, M. A., Masud, M., et al. (2022). Early prediction of diabetes using an ensemble of machine learning models. Int. J. Environ. Res. Public Health 19:12378. doi: 10.3390/ijerph191912378
El-Hasnony, I. M., Elzeki, O. M., Alshehri, A., and Salem, H. (2022). Multi-label active learning-based machine learning model for heart disease prediction. Sensors 22:1184. doi: 10.3390/s22031184
FAO (2018). The Progressive Control Pathway for FMD control (PCP-FMD): principles, stage descriptions and standards. Available at: https://www.fao.org/3/CA1331EN/ca1331en.pdf
Fasina, F. O., Connell, D. R., Talabi, O. A., Lazarus, D. D., Adeleke, G. A., Olusanya, T. P., et al. (2013). Foot-and-mouth disease virus strains and examination of exposure factors associated with seropositivity of cattle herds in Nigeria during 2007–2009. Prev. Vet. Med. 109, 334–342. doi: 10.1016/j.prevetmed.2012.10.004
Feng, D.-C., Wang, W.-J., Mangalathu, S., and Taciroglu, E. (2021). Interpretable XGBoost-SHAP machine-learning model for shear strength prediction of squat RC walls. J. Struct. Eng. 147:04021173. doi: 10.1061/(ASCE)ST.1943-541X.0003115
Ferri, C., Hernández-Orallo, J., and Modroiu, R. (2009). An experimental comparison of performance measures for classification. Pattern Recogn. Lett. 30, 27–38. doi: 10.1016/j.patrec.2008.08.010
Grafberger, S., Stoyanovich, J., and Schelter, S. (2021). Lightweight inspection of data preprocessing in native machine learning pipelines. Conf. Innov. Data Syst. Res.
Hamoonga, R., Stevenson, M., Allepuz, A., Carpenter, T., and Sinkala, Y. (2014). Risk factors for foot-and-mouth disease in Zambia, 1981–2012. Prev. Vet. Med. 114, 64–71. doi: 10.1016/j.prevetmed.2014.01.014
Hancock, J. T., and Khoshgoftaar, T. M. (2020). Survey on categorical data for neural networks. J. Big Data 7, 1–41. doi: 10.1186/s40537-020-00305-w
Hasahya, E., Thakur, K., Dione, M. M., Kerfua, S. D., Mugezi, I., and Lee, H. S. (2023). Analysis of patterns of livestock movements in the cattle corridor of Uganda for risk-based surveillance of infectious diseases. Front. Vet. Sci. 10:1095293. doi: 10.3389/fvets.2023.1095293
Hewage, N., and Meedeniya, D. (2022). Machine learning operations: a survey on MLOps tool support. arXiv Preprint arXiv:2202.10169.
Isaac, N. J., Jarzyna, M. A., Keil, P., Dambly, L. I., Boersch-Supan, P. H., Browning, E., et al. (2020). Data integration for large-scale models of species distributions. Trends Ecol. Evol. 35, 56–67. doi: 10.1016/j.tree.2019.08.006
Iwendi, C., Bashir, A. K., Peshkar, A., Sujatha, R., Chatterjee, J. M., Pasupuleti, S., et al. (2020). COVID-19 patient health prediction using boosted random forest algorithm. Front. Public Health 8:357. doi: 10.3389/fpubh.2020.00357
Jadhav, A., Pramod, D., and Ramanathan, K. (2019). Comparison of performance of data imputation methods for numeric dataset. Appl. Artif. Intell. 33, 913–933. doi: 10.1080/08839514.2019.1637138
Jamal, S. M., and Belsham, G. J. (2018). Molecular epidemiology, evolution and phylogeny of foot-and-mouth disease virus. Infect. Genet. Evol. 59, 84–98. doi: 10.1016/j.meegid.2018.01.020
Jemberu, W., Mourits, M., Sahle, M., Siraw, B., Vernooij, J., and Hogeveen, H. (2016). Epidemiology of foot and mouth disease in Ethiopia: a retrospective analysis of district level outbreaks, 2007–2012. Transbound. Emerg. Dis. 63, e246–e259. doi: 10.1111/tbed.12338
Jenbere, T. S., Manyahilishal, E., and Haileluel, N. (2011). Study on the risk factors of foot and mouth disease in selected districts of Afar pastoral area, Northeast Ethiopia. J. Anim. Vet. Adv. 10, 1368–1372. doi: 10.3923/javaa.2011.1368.1372
Jiao, Y., and Du, P. (2016). Performance measures in evaluating machine learning based bioinformatics predictors for classifications. Quantitative Biol. 4, 320–330. doi: 10.1007/s40484-016-0081-2
Jo, T. (2021). Machine learning foundations. Supervised, unsupervised, and advanced learning. Cham: Springer International Publishing.
Joshi, R. D., and Dhakal, C. K. (2021). Predicting type 2 diabetes using logistic regression and machine learning approaches. Int. J. Environ. Res. Public Health 18:7346. doi: 10.3390/ijerph18147346
Kamiri, J., and Mariga, G. (2021). Research methods in machine learning: a content analysis. Int. J. Comput. Inform. Technol. 10:2279–0764. doi: 10.24203/ijcit.v10i2.79
Kang, M., and Tian, J. (2018). Machine learning: data pre-processing. in Prognostics and Health Management of Electronics. Eds. G Michael and MK Pecht (USA: John Wiley et Sons), 111–130.
Karapapas, C., and Goumopoulos, C. (2021). Mild cognitive impairment detection using machine learning models trained on data collected from serious games. Appl. Sci. 11:8184. doi: 10.3390/app11178184
Kaur, I., Sandhu, A. K., and Kumar, Y. (2022). Artificial intelligence techniques for predictive modeling of vector-borne diseases and its pathogens: a systematic review. Arch. Comput. Methods Eng. 29, 3741–3771. doi: 10.1007/s11831-022-09724-9
Kerfua, S. D., Nantima, N., Ademun, R., Ayebazibwe, C., Okuthe, S., Sserugga, J., et al. (2021). Using participatory epidemiology tools to determine perceived risk factors for foot-and-mouth disease occurrence in selected sub-counties of Isingiro district in Uganda. J. Vet. Med. Anim. Health 13, 160–166. doi: 10.5897/JVMAH2020.0899
Kerfua, S. D., Shirima, G., Kusiluka, L., Ayebazibwe, C., Mwebe, R., Cleaveland, S., et al. (2018). Spatial and temporal distribution of foot-and-mouth disease in four districts situated along the Uganda-Tanzania border: implications for cross-border efforts in disease control. Onderstepoort J. Vet. Res. 85, 1–8. doi: 10.4102/ojvr.v85i1.1528
Khattak, A., Bukhsh, R., Aslam, S., Yafoz, A., Alghushairy, O., and Alsini, R. (2022). A hybrid deep learning-based model for detection of electricity losses using big data in power systems. Sustain. For. 14:13627. doi: 10.3390/su142013627
Kumar, I. E., Venkatasubramanian, S., Scheidegger, C., and Friedler, S. (2020). Problems with Shapley-value-based explanations as feature importance measures, Proceedings of the 37th International Conference on Machine Learning, in Proceedings of Machine Learning Research, 5491–5500.
Laila, U. E., Mahboob, K., Khan, A. W., Khan, F., and Taekeun, W. (2022). An ensemble approach to predict early-stage diabetes risk using machine learning: an empirical study. Sensors 22:5247. doi: 10.3390/s22145247
Maharana, K., Mondal, S., and Nemade, B. (2022). A review: data pre-processing and data augmentation techniques. Glob. Trans. Proc. 3, 91–99. doi: 10.1016/j.gltp.2022.04.020
Mehrabi, N., Morstatter, F., Saxena, N., Lerman, K., and Galstyan, A. (2021). A survey on bias and fairness in machine learning. ACM Comput. Surveys 54, 1–35. doi: 10.1145/3457607
Mienye, I. D., and Sun, Y. (2022). A survey of ensemble learning: concepts, algorithms, applications, and prospects. IEEE Access 10, 99129–99149. doi: 10.1109/ACCESS.2022.3207287
Miguel, E., Grosbois, V., Fritz, H., Caron, A., de Garine-Wichatitsky, M., Nicod, F., et al. (2017). Drivers of foot-and-mouth disease in cattle at wild/domestic interface: insights from farmers, buffalo and lions. Divers. Distrib. 23, 1018–1030. doi: 10.1111/ddi.12585
Mishra, S., Mallick, P. K., Tripathy, H. K., Bhoi, A. K., and González-Briones, A. (2020). Performance evaluation of a proposed machine learning model for chronic disease datasets using an integrated attribute evaluator and an improved decision tree classifier. Appl. Sci. 10:8137. doi: 10.3390/app10228137
Molla, B., Ayelet, G., Asfaw, Y., Jibril, Y., and Gelaye, E. (2013). Participatory epidemiology and associated risk factors of foot-and-mouth disease in cattle in South Omo zone, South-Western Ethiopia. J. Vet. Med. Anim. Health 5, 322–328. doi: 10.5897/JVMAH12.043
Munsey, A., Mwiine, F. N., Ochwo, S., Velazquez-Salinas, L., Ahmed, Z., Maree, F., et al. (2019). Spatial distribution and risk factors for foot and mouth disease virus in Uganda: opportunities for strategic surveillance. Prev. Vet. Med. 171:104766. doi: 10.1016/j.prevetmed.2019.104766
Mwiine, F. N., Velazquez-Salinas, L., Ahmed, Z., Ochwo, S., Munsey, A., Kenney, M., et al. (2019). Serological and phylogenetic characterization of foot and mouth disease viruses from Uganda during cross-sectional surveillance study in cattle between 2014 and 2017. Transbound. Emerg. Dis. 66, 2011–2024. doi: 10.1111/tbed.13249
Narayanan, S., Balamurugan, N., Maithili, K., and Palas, P. B. (2022). Leveraging machine learning methods for multiple disease prediction using Python ML libraries and flask. In 2022 International Conference on Applied Artificial Intelligence and Computing (ICAAIC). 694–701. doi: 10.1109/icaaic53929.2022.9792807
Nsubuga, F. W., and Rautenbach, H. (2018). Climate change and variability: a review of what is known and ought to be known for Uganda. Int. J. Clim. Change Strateg. Manag. 10, 752–771. doi: 10.1108/IJCCSM-04-2017-0090
Nusinovici, S., Tham, Y. C., Yan, M. Y. C., Ting, D. S. W., Li, J., Sabanayagam, C., et al. (2020). Logistic regression was as good as machine learning for predicting major chronic diseases. J. Clin. Epidemiol. 122, 56–69. doi: 10.1016/j.jclinepi.2020.03.002
Obubu, J. P., Mengistou, S., Fetahi, T., Alamirew, T., Odong, R., and Ekwacu, S. (2021). Recent climate change in the Lake Kyoga basin, Uganda: an analysis using short-term and long-term data with standardized precipitation and anomaly indexes. Climate 9:179. doi: 10.3390/cli9120179
Paton, D. J., Di Nardo, A., Knowles, N. J., Wadsworth, J., Pituco, E. M., Cosivi, O., et al. (2021). The history of foot-and-mouth disease virus serotype C: the first known extinct serotype? Virus Evol. 7:veab009. doi: 10.1093/ve/veab009
Paton, D. J., Gubbins, S., and King, D. P. (2018). Understanding the transmission of foot-and-mouth disease virus at different scales. Curr. Opin. Virol. 28, 85–91. doi: 10.1016/j.coviro.2017.11.013
Pisner, D. A., and Schnyer, D. M. (2020). “Chapter 6 - Support vector machine” in Machine Learning, eds A. Mechelli and S. Vieira (Austin, TX: Academic Press), 101–121. doi: 10.1016/B978-0-12-815739-8.00006-7
Poonsuk, K., Giménez-Lirola, L., and Zimmerman, J. J. (2018). A review of foot-and-mouth disease virus (FMDV) testing in livestock with an emphasis on the use of alternative diagnostic specimens. Anim. Health Res. Rev. 19, 100–112. doi: 10.1017/S1466252318000063
Powers, D. M. (2020). Evaluation: from precision, recall and F-measure to ROC, informedness, markedness and correlation. arXiv Preprint arXiv:2010.16061.
Punyapornwithaya, V., Klaharn, K., Arjkumpa, O., and Sansamur, C. (2022). Exploring the predictive capability of machine learning models in identifying foot and mouth disease outbreak occurrences in cattle farms in an endemic setting of Thailand. Prev. Vet. Med. 207:105706. doi: 10.1016/j.prevetmed.2022.105706
Rajamani, S. K., and Iyer, R. S. (2023). Machine learning-based mobile applications using Python and Scikit-Learn. in Designing and developing innovative Mobile applications. (Beijing, China: IGI Global), 282–306.
Reddy, G. T., Bhattacharya, S., Ramakrishnan, S. S., Chowdhary, C. L., Hakak, S., Kaluri, R., et al. (2020). An ensemble based machine learning model for diabetic retinopathy classification. 2020 International Conference on Emerging Trends in Information Technology and Engineering. 1–6.
Rodríguez-Habibe, I., Celis-Giraldo, C., Patarroyo, M. E., Avendaño, C., and Patarroyo, M. A. (2020). A comprehensive review of the immunological response against foot-and-mouth disease virus infection and its evasion mechanisms. Vaccine 8:764. doi: 10.3390/vaccines8040764
Rubin, D. B. (2018). Multiple imputation. in Flexible imputation of missing data. 2nd ed (Boca Raton, FL: Chapman and Hall/CRC), 29–62.
Sahin, E. K. (2020). Assessing the predictive capability of ensemble tree methods for landslide susceptibility mapping using XGBoost, gradient boosting machine, and random forest. SN Appl. Sci. 2:1308. doi: 10.1007/s42452-020-3060-1
Salem, S. A., Bazid, A.-H. I., and Abo El-Hassan, D. J. (2021). Molecular and serological typing of foot-and-mouth disease virus serotypes currently circulating in Egypt. Iraqi J. Vet. Sci. 35, 581–588. doi: 10.33899/ijvs.2020.127327.1495
Sarker, M., and Al-Muaalemi, M. A. (2022). Sampling techniques for quantitative research. in Principles of social research methodology, Eds. M. Islam, N. Khan, and R. Baikady, (Singapore: Springer) 221–234.
Schessner, J. P., Voytik, E., and Bludau, I. (2022). A practical guide to interpreting and generating bottom-up proteomics data visualizations. Proteomics 22:e2100103. doi: 10.1002/pmic.202100103
Sethuraman, R., Sellappan, S., Shunmugiah, J., Subbiah, N., Govindarajan, V., and Neelagandan, S. (2023). An optimized AdaBoost multi-class support vector machine for driver behavior monitoring in the advanced driver assistance systems. Expert Syst. Appl. 212:118618. doi: 10.1016/j.eswa.2022.118618
Shobana, G., and Umamaheswari, K. (2021). Prediction of liver disease using gradient boost machine learning techniques with feature scaling. International Conference on Computing Methodologies and Communication (ICCMC), 1223–1229. doi: 10.1109/ICCMC51019.2021.9418333
Singh, U., Rizwan, M., Alaraj, M., and Alsaidan, I. (2021). A machine learning-based gradient boosting regression approach for wind power production forecasting: a step towards smart grid environments. Energies 14:5196. doi: 10.3390/en14165196
Sinkala, Y., Simuunza, M., Muma, J. B., Mweene, A., Pfeiffer, D. U., and Kasanga, C. J. (2014). Foot and mouth disease in Zambia: spatial and temporal distributions of outbreaks, assessment of clusters and implications for control: proceedings. Onderstepoort J. Vet. Res. 81, 1–6. doi: 10.4102/ojvr.v81i2.741
Soklaski, R., Goodwin, J., Brown, O., Yee, M., and Matterer, J. (2022). Tools and practices for responsible AI engineering. arXiv Preprint arXiv:2201.05647.
Sueabua, W., and Seresangtakul, P. (2023). Predicting foot and mouth disease in Thailand’s Nakhon Ratchasima Province through machine learning. In Proceedings of the 19th International Conference on Computing and Information Technology (IC2IT 2023), Lecture Notes in Networks and Systems, Switzerland: Springer Nature. 53–62. doi: 10.1007/978-3-031-30474-3_5
Sumption, K., Domenech, J., and Ferrari, G. (2012). Progressive control of FMD on a global scale. Vet. Rec. 170, 637–639. doi: 10.1136/vr.e4180
Tae, K. H., Roh, Y., Oh, Y. H., Kim, H., and Whang, S. E. (2019). Data cleaning for accurate, fair, and robust models: a big data-AI integration approach. In Proceedings of the 3rd International Workshop on Data Management for End-to-End Machine Learning, DEEM’19. ACM: New York, NY, USA. 5:1–4. doi: 10.1145/3329486.3329493
Tharwat, A. (2020). Classification assessment methods. Appl. Comput. Informatics 17, 168–192. doi: 10.1016/j.aci.2018.08.003
Touzani, S., Granderson, J., and Fernandes, S. (2018). Gradient boosting machine for modeling the energy consumption of commercial buildings. Energ. Buildings 158, 1533–1543. doi: 10.1016/j.enbuild.2017.11.039
Tran, N., Chen, H., Jiang, J., Bhuyan, J., and Ding, J. (2021). Effect of class imbalance on the performance of machine learning-based network intrusion detection. Int. J. Performabil. Eng. 17:741. doi: 10.23940/ijpe.21.09.p1.741755
Uddin, S., Khan, A., Hossain, M. E., and Moni, M. A. (2019). Comparing different supervised machine learning algorithms for disease prediction. BMC Medical Informatics and Decision Making, 19, 1–16. doi: 10.1186/s12911-019-1004-8
Udahemuka, J. C., Aboge, G. O., Obiero, G. O., Lebea, P. J., Onono, J. O., and Paone, M. (2020). Risk factors for the incursion, spread and persistence of the foot and mouth disease virus in eastern Rwanda. BMC Vet. Res. 16, 1–10. doi: 10.1186/s12917-020-02610-1
Velazquez-Salinas, L., Mwiine, F. N., Ahmed, Z., Ochwo, S., Munsey, A., Lutwama, J. J., et al. (2020). Genetic diversity of circulating foot and mouth disease virus in Uganda cross-sectional study during 2014–2017. Front. Vet. Sci. 7:162. doi: 10.3389/fvets.2020.00162
Wang, X., Deng, X., Fu, Q., Zhou, Q., Feng, J., Ma, H., et al. (2020). A weakly-supervised framework for COVID-19 classification and lesion localization from chest CT. IEEE Trans. Med. Imaging 39, 2615–2625. doi: 10.1109/TMI.2020.2995965
Weiss, C. J. (2022). Visualizing protein big data using Python and Jupyter notebooks. Biochem. Mol. Biol. Educ. 50, 431–436. doi: 10.1002/bmb.21621
World Organization for Animal Health (2024). Available at: https://www.woah.org/en/disease/foot-and-mouth-disease/
Wu, G., Yang, P., Xie, Y., Woodruff, H. C., Rao, X., Guiot, J., et al. (2020). Development of a clinical decision support system for severity risk prediction and triage of COVID-19 patients at hospital admission: an international multicentre study. Eur. Respir. J. 56:2001104. doi: 10.1183/13993003.01104-2020
Wungak, Y., Olugasa, B., Ishola, O., Lazarus, D., and Ularamu, G. (2016). Foot-and-mouth disease (FMD) prevalence and exposure factors associated with seropositivity of cattle in north-central, Nigeria. Afr. J. Biotechnol. 15, 1224–1232. doi: 10.5897/AJB2016.15332
Yadav, M. P., Singh, R. K., and Malik, Y. S. (2020). Emerging and transboundary animal viral diseases: Perspectives and preparedness. in Emerging and transboundary animal viruses, Eds. Y. S. Malik, R. K. Singh, and M. P. Yadav (Singapore: Springer Nature).
Zafar, M. R., and Khan, N. (2021). Deterministic local interpretable model-agnostic explanations for stable explainability. Mach. Learn. Knowl. Extract. 3, 525–541. doi: 10.3390/make3030027
Zewdie, G., Akalu, M., Tolossa, W., Belay, H., Deresse, G., Zekarias, M., et al. (2023). A review of foot-and-mouth disease in Ethiopia: epidemiological aspects, economic implications, and control strategies. Virol. J. 20:299. doi: 10.1186/s12985-023-02263-0
Keywords: Foot and Mouth Disease, machine learning, distribution shifts, performance degradation rates, class imbalance
Citation: Kapalaga G, Kivunike FN, Kerfua S, Jjingo D, Biryomumaisho S, Rutaisire J, Ssajjakambwe P, Mugerwa S and Kiwala Y (2024) A unified Foot and Mouth Disease dataset for Uganda: evaluating machine learning predictive performance degradation under varying distributions. Front. Artif. Intell. 7:1446368. doi: 10.3389/frai.2024.1446368
Edited by:
Rashid Ibrahim Mehmood, Islamic University of Madinah, Saudi ArabiaReviewed by:
Lalit Garg, University of Malta, MaltaMiodrag Zivkovic, Singidunum University, Serbia
Boluwaji Ade Akinnuwesi, University of Eswatini, Eswatini
Copyright © 2024 Kapalaga, Kivunike, Kerfua, Jjingo, Biryomumaisho, Rutaisire, Ssajjakambwe, Mugerwa and Kiwala. This is an open-access article distributed under the terms of the Creative Commons Attribution License (CC BY). The use, distribution or reproduction in other forums is permitted, provided the original author(s) and the copyright owner(s) are credited and that the original publication in this journal is cited, in accordance with accepted academic practice. No use, distribution or reproduction is permitted which does not comply with these terms.
*Correspondence: Geofrey Kapalaga, Z2thcGFsYWdhQGdtYWlsLmNvbQ==