
95% of researchers rate our articles as excellent or good
Learn more about the work of our research integrity team to safeguard the quality of each article we publish.
Find out more
BRIEF RESEARCH REPORT article
Front. Artif. Intell. , 26 October 2022
Sec. Machine Learning and Artificial Intelligence
Volume 5 - 2022 | https://doi.org/10.3389/frai.2022.939967
This article is part of the Research Topic Deep Learning with Limited Labeled Data for Vision, Audio, and Text View all 4 articles
 D. E. Moreira da Silva1
 Lio Gonçalves1,2Pedro Franco-Gonçalo3,4
 Bruno Colaço4,5,6
 Sofia Alves-Pimenta4,5,6
 Mário Ginja3,4,6
 Manuel Ferreira7
 Vitor Filipe1,2*
X-ray bone semantic segmentation is one crucial task in medical imaging. Due to deep learning's emergence, it was possible to build high-precision models. However, these models require a large quantity of annotated data. Furthermore, semantic segmentation requires pixel-wise labeling, thus being a highly time-consuming task. In the case of hip joints, there is still a need for increased anatomic knowledge due to the intrinsic nature of the femur and acetabulum. Active learning aims to maximize the model's performance with the least possible amount of data. In this work, we propose and compare the use of different queries, including uncertainty and diversity-based queries. Our results show that the proposed methods permit state-of-the-art performance using only 81.02% of the data, with time complexity.
Image segmentation is one of the most important yet, challenging tasks in medical image analysis (Shah and Sharma, 2018). In recent years, Deep Learning's (DL) emergence has made it possible to build models that achieve human-like or superior performance in many medical imaging tasks, such as segmentation. However, the DL shortcoming is the need for large quantities of annotated data, often in the order of thousands (Ronneberger et al., 2015). Additionally, gathering such large and high-quality datasets, annotated by medical experts, is often very difficult (Kim et al., 2019; Nguyen et al., 2021) because segmentation requires thorough pixel-wise labeling, hence being a highly time-intensive procedure (Ozdemir et al., 2021). Additionally, collecting medical images might be financially expensive (Kim et al., 2019). Active Learning's (AL) goal is to identify which unlabeled samples are the most interesting to be labeled by a human expert. In other words, how to maximize the model's performance using the least possible amount of data (Ren et al., 2020). Without AL, this sampling is purely random, which might cause data redundancy. Hence, the use of AL enables the annotation process to be as time and financially efficient as possible.
In this work, we explore the use of AL methodologies in the context of the segmentation of dogs' femur and acetabulum bones in X-ray images. Dogs' coxofemoral joint radiographic examinations are used worldwide for screening hip dysplasia and to select better animals for breeding. Radiographic evaluation is performed by human observation, being considered a time-consuming, expensive and relatively subjective process due to differences in classification between evaluators. Precise segmentation of these bone structures is noteworthy as it allows further automated diagnosis of canine hip dysplasia (Moreira da Silva et al., 2021, 2022). However, the joint regions present high noise, low contrast, overlapping tissue, and a narrow gap between the femur and acetabulum (Lianghui et al., 2019). As such, the annotation of these regions requires increased attention, a greater level of medical specialization and knowledge of these anatomical structures. Consequently, this set of factors leads to an increased expenditure of veterinary medicine professionals' valuable time in the annotation process. Therefore, we aim to assemble and compare the effects of different AL queries to build a high performant U-Net model with low amounts of annotated data. The developed techniques will be integrated into the Dys4Vet1 web platform, a dedicated software for the automated canine hip dysplasia diagnosis.
The rest of this paper is organized as follows: Related work (Section 2); Methods (Section 3); Results and discussion (Section 4); Conclusions (Section 5).
There are two types of AL queries (Munro, 2021): uncertainty sampling; diversity sampling. The first aims to fix the model's currently known confusion by sampling data that the model presents low predictive confidence. Diversity sampling intends to provide the model with samples of unknown areas of the feature space, thus narrowing the model's knowledge gap. Mahapatra et al. (2018) used AL for X-Ray lung segmentation. The authors suggest generative adversarial networks (GANs) to generate diverse images. Then, using a Bayesian Neural Network, each generated sample's informativeness is calculated. The informativeness is calculated through the combination of epistemic and aleatoric uncertainties (Kendall and Gal, 2017). The most informative samples are added, at each iteration, to the labeled training data. With this method, the authors reach state-of-the-art performance by using only 35% of the full annotated dataset. Ozdemir et al. (2018) used Monte Carlo Dropout (Gal and Ghahramani, 2016) (MCD) to measure sample uncertainty based on inference variance. Then, content distance (Gatys et al., 2016) and layer entropy maximization are used to measure representativeness. The novelty of this work is that instead of applying uncertainty and then sampling for diversity, the authors propose a Borda count approach: samples are ranked for each metric, and sampling is carried out based on combined rank. On a similar note, in later works, Ozdemir et al. (2021) proposed a modification of MCD (Gal and Ghahramani, 2016), where instead of randomly dropping neuron connections, entire convolutional kernels are dropped. The uncertainty of each sample is calculated by averaging each pixel's variance over the multiple inferences. Additionally, a variational autoencoder is used to project gaussian distributions of labeled and unlabeled pools. With both distributions, the authors calculate underrepresented samples in the labeled dataset. By combining uncertainty and representativeness, the authors stay within 2% of the state-of-the-art performance using only 25% of the data. Zhao et al. (2020) modified a U-Net to extract and then upscale segmentation maps from deep and intermediate layers. Then, the authors calculate the dice coefficient between the model's final segmentation map and each upscaled map. The samples with the highest dice scores' average are selected to be labeled. This technique achieves comparable state-of-the-art performance with 43.16% of the data. However, the results do not differ much from random sampling, with a performance difference of <1%. Zhao et al. (2021) introduced DSAL through the reuse of the previously described technique. While high uncertainty samples are annotated by a human expert, in this work the samples with low uncertainty are also provided to weak labelers (i.e., dense conditional random fields) to generate pseudo labels. The authors state the incorporation of pseudo labels further boosts the results. Jin et al. (2022) proposed a one-shot active learning framework based on contrastive learning and diversity sampling. First, contrastive learning is used for feature extraction. Then, this new feature space is clustered using K-Means++ (Arthur and Vassilvitskii, 2007), and sampling is performed using farthest point sampling (FPS). While clustering guarantees inter-cluster diversity, FPS provides intra-cluster diversity. This method was validated in three different datasets, and it delivered dice score gains when compared to others.
This section describes the employed methodologies for the present study. Initially, the used dataset is presented in Section 3.1. Then, Section 3.2 describes the DL segmentation model used for the experiments. Lastly, Section 3.3 details the AL procedure and Section 3.4 details the proposed AL queries.
For this work, DICOM images were collected from Veterinary Teaching Hospital of the University of Trás-os-Montes and Alto Douro and from the Danish Kennel Club, totaling 202 images. Please note that each image corresponds to a unique patient, avoiding data correlation in subsequent splitting processes. Then, manual annotation was carried out for every DICOM. In detail, the acetabulum and femoral head acetabulum intersection were annotated (Figure 1). With these annotations, three-channel masks were generated, where each channel is a binary mask for each class: background, femur, and acetabulum. Then the images were resized to 544 × 448. The masks underwent the same resizing through nearest neighbor interpolation. Finally, a test (15%) and a validation set (15%) are created, which remain constant throughout the AL cycles. Additionally, 3% is used as initial training data and the remaining as the initial unlabeled pool .
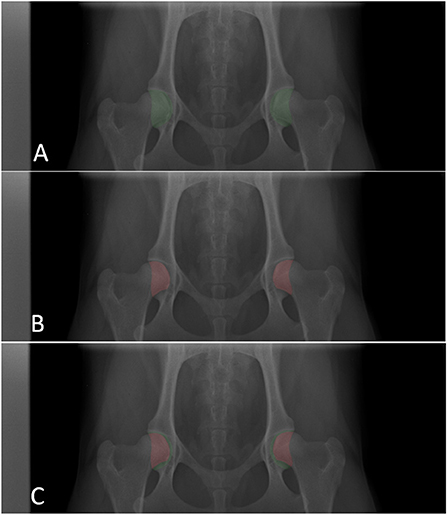
Figure 1. Example of annotations made for each image. (A) Acetabulum annotation. (B) Femoral head (that overlaps the acetabulum) annotation. (C) Combined femoral head and acetabulum annotations. The X-ray was cut on the y axis for better visualization. For model training, full images are used.
The DL segmentation model we use is the same we propose in previous works (Moreira da Silva et al., 2022), a U-Net with EfficientNet (Tan and Le, 2019) modules as the feature-extractor backbone.
For quantitative results we evaluated the dice score (Equation 1), as it is the common metric in medical image segmentation (Siddique et al., 2021).
where
P: Predicted Segmentation
G : Ground Truth
We also use the same loss function of the previous work (Moreira da Silva et al., 2022), a combination of dice and focal loss (Equation 2). For this work, we set α = 0.25 and γ = 2.
In this section, we present and explain our AL procedures. We define the unlabeled pool as , where is the available feature space to sample from, and the corresponding labels. Please note that we have because we generate the unlabeled pool artificially, as detailed in Section 3.1. In real-world AL, would not be present, so the labels would need to be provided by an oracle (i.e., human expert) in real-time.
Our AL cycle is formally defined as follows: Given the initial training data , and the initial unlabeled pool , at each AL iteration t, a given acquisition query Q will sample n images from and then this new subset is added to the training dataset , removed from the next iteration's unlabeled pool , and the model is re-trained. After training, the model is evaluated on the test dataset, and the resulting metrics are saved. The iteration is incremented t = t + 1, and this process repeats until the unlabeled pool is empty . For each query under study, this entire cycle is repeated 10 times. Later, we will provide each metric's average at each AL iteration t, for each query . This way our results are more statistically significant.
For this study, we employ and compare five different queries:
Randomly sampling n elements from the unlabeled pool . This query serves as a baseline.
First, the unlabeled pool is normalized according to (3):
Then the dimensionality of is reduced by applying Principal Component Analysis (PCA) (Pearson, 1901), with 99% explained data variance. We define the reduced pool as . Then, we use K-Means++ (Arthur and Vassilvitskii, 2007) to create n clusters inside . Then, for each centroid of , the closest element is found. The corresponding n elements in are sampled. Thus, this query ensures maximum diversity between the samples.
This query requires both the unlabeled pool and the training data . We then apply the same two initial steps of the previous query to both and . Then, also using K-Means++, two clusters are created: a training cluster , and an unlabeled cluster . For each item in it's representativeness is calculated according to (4):
where
μ: Cluster centroid
d: Euclidean distance
measures the difference between the training and the unlabeled data. The first n elements of that have the highest corresponding values are sampled. In short, we select the items that best represent the unlabeled pool population and look the most different from the current training data.
Monte Carlo Dropout (MCD) is a Bayesian ANN approximation of the Gaussian process, introduced by Gal and Ghahramani (2016). It uses the dropout layers (Srivastava et al., 2014) of a DL model to measure its predictive uncertainty. It works by turning on dropout during inference, and by running inference k times, each dropout configuration corresponds to a Monte Carlo sample from the available models' space. Thus, we obtain a predictive distribution enabling the inspection of the predictive uncertainty. For this study we set k = 30. Then we obtain each sample's average prediction according to (5):
where
г: DL model
Afterwards, each sample's uncertainty is calculated using Shannon's entropy (Shannon, 1948), according to Equation (6). Since the used model uses a sigmoid activation function, we calculate the entropy for the femur (output channel 1) and the acetabulum (output channel 2) class separately, averaging them thereafter.
The first n elements of that have the highest corresponding values are sampled. As such, we select the items that the model presents a higher level of uncertainty. We call this method CWE-MCD (Class-wise Entropy Monte Carlo Dropout).
All the previously mentioned queries sample from one of the following perspectives: uncertainty or diversity. This method proposes a combination of two techniques: Representative Sampling and CWE-MCD. To combine both queries, we adopt the Ozdemir et al. (2018)'s Borda count approach. In short, we separately calculate the and scores for each image in . Then each unlabeled image is ranked based on how high each score is. The final sampling is based on the 15 highest combined rank.
Initially (t = 0), the labeled dataset has six train images and the unlabeled pool has 131 images, and at each active learning iteration, a given query will select 15 images (n = 15). We repeat this procedure until we run out of images, resulting in nine AL iterations . Regarding the model, at each AL iteration, we train a model from scratch, using the Adam optimizer with a learning rate of 1e − 2 and a batch size of eight. Additionally, we use two callbacks that monitor the validation's data dice score. The first is a callback that reduces the learning rate by a factor of 0.1 if the metric does not improve after eight epochs. Secondly, a callback that halts the training if the metric does not improve by ten epochs (early stopping). Therefore, we set the number of epochs to 500.
Also, we train the U-Net with the entire unlabeled pool combined with the initial training data (), achieving a test dice score of 0.95. We denote this value as the model's Upper Bound (UB). The average dice score, for each AL iteration, for the proposed methods are described in Table 1, and illustrated in Figure 2. Noticeably, every query (Clustering, Representative, CWE-MCD, Representative CWE-MCD) performed better than the baseline (Random) in all iterations. Despite clustering being a simple technique, in the first iterations, it outperforms the baseline. As the size and diversity of the unlabeled pool decreases, the performance of the clustering query becomes identical to the baseline. Both the baseline and the clustering queries need the entire unlabeled pool as training data to reach the UB. Nonetheless, clustering still proves suitable in early AL iterations. The three more advanced methods we build (Representative, CWE-MCD, Representative CWE-MCD) show significant dice score gains compared to the baseline. In the first two iterations, these present closely the same performance. From the second, CWE-MCD and Representative CWE-MCD provide superior performance. This fact can corroborate (Ozdemir et al., 2021) statement that uncertainty may not be a sufficiently calibrated metric until the training data size is adequately large. Additionally, Representative CWE-MCD provides slightly better results over CWE-MCD and Representative until the sixth iteration. This is expected, as Representative CWE-MCD combines the best aspects of the diversity and uncertainty sampling, thus being a more powerful technique (Munro, 2021). Despite this slight performance superiority, these three queries can reach the UB at around 111 training images compared to the required 137 when using the baseline or the clustering methods. This means that using these queries allowed the same level of performance with ≈ 81.02% of the data, a saving of ≈ 18.98% (26 images).
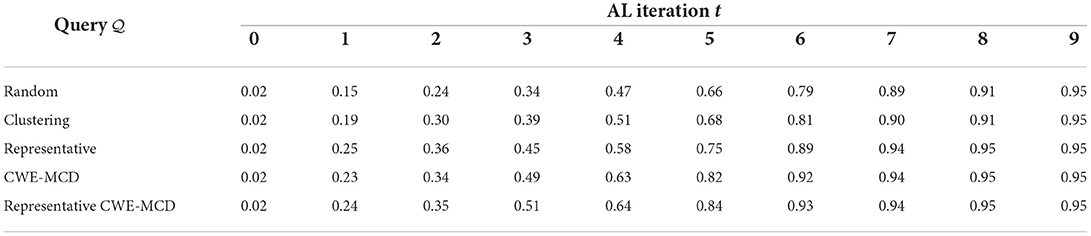
Table 1. Average dice score at each AL iteration for the proposed methods.
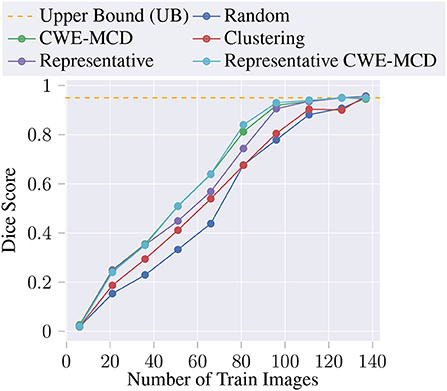
Figure 2. Average dice score at each AL iteration for the proposed methods.
Additionally, we decided to measure the average query time in seconds, at each AL iteration, for each of the proposed queries. Figure 3 depicts the results. As expected, the baseline is almost instant. The clustering technique is also pretty fast, decreasing times as the iterations increase. One of the best performing queries, CWE-MCD, presents a significantly higher time complexity , meaning that the required time scales linearly to the size of the unlabeled pool. In practice, this query might be unsuitable for large unlabeled pools. Thus, to offset the computation times, it might be required to tune the number of Monte Carlo samples (i.e., number of inferences). Notwithstanding, representative query presents a linear time complexity while still delivering noteworthy dice score gains, thus being suitable for large unlabeled pools. Lastly, Representative CWE-MCD presents the same behavior as CWE-MCD but with a significant additional time overhead due to representativeness and Borda count computations. In practice, the use of this query will be even more limited than the CWE-MCD due to the increased times. However, its use can still be advantageous in situations that demand maximum performance, situations where time is not a constraint, or when applied to a small subset of the unlabeled pool.
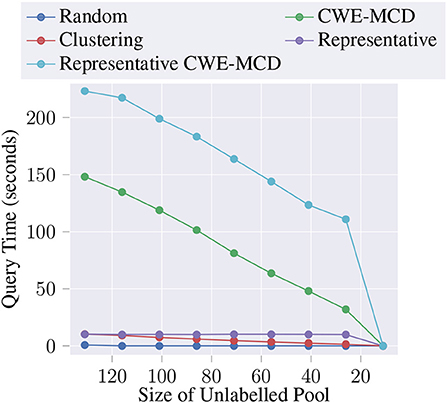
Figure 3. Average query time (in seconds) at each AL iteration for the proposed methods.
In this work, we study and compare the effectiveness of different AL query strategies in the ambit of the segmentation of dogs' femur and acetabulum bones in X-ray images. In detail, we suggest measuring the uncertainty by calculating class-wise entropy using Monte Carlo Dropout. Furthermore, we propose to combine this uncertainty metric with a representativeness method, inspired by the works of Ozdemir et al. (2018). This method is superior to the others, allowing an 18.98% reduction in the amount of required annotated data. Despite this method being in time complexity, representative sampling is time complex, with comparable performance levels, thus suitable for large unlabeled datasets. For future research, we intend to study other possible combinations of the entropy and representativeness methods presented in this paper. In addition, the creation of annotation software unified with an AL framework, equipped with automatic pre-annotation capabilities, would allow further time savings for veterinary professionals.
The raw data supporting the conclusions of this article will be made available by the authors, without undue reservation.
DM, LG, and VF contributed to conception and design of the study. PF-G, BC, SA-P, and MF organized the database. DM, LG, MF, and VF defined the methodology. DM, LG, MG, and VF performed validation and data analysis. DM wrote the first draft of the manuscript. All authors contributed to manuscript revision, read, and approved the submitted version.
This work was financed by project Dys4Vet (POCI-01-0247-FEDER-046914), co-financed by the European Regional Development Fund (ERDF) through COMPETE2020—the Operational Programme for Competitiveness and Internationalization (OPCI). The authors are also grateful for all the conditions made available by FCT—Portuguese Foundation for Science and Technology, under the projects UIDB/04033/2020, UIDB/CVT/00772/2020, and Scientific Employment Stimulus—Institutional Call—CEECINST/00127/2018 UTAD.
The authors acknowledge Prof. Fintan McEvoy, University of Copenhagen who is a collaborator on this project and the Danish Kennel Club for allowing access to images from their data archive.
Author MF was employed by Neadvance Machine Vision SA.
The remaining authors declare that the research was conducted in the absence of any commercial or financial relationships that could be construed as a potential conflict of interest.
All claims expressed in this article are solely those of the authors and do not necessarily represent those of their affiliated organizations, or those of the publisher, the editors and the reviewers. Any product that may be evaluated in this article, or claim that may be made by its manufacturer, is not guaranteed or endorsed by the publisher.
Arthur, D., and Vassilvitskii, S. (2007). “K-means++: the advantages of careful seeding,” in Proceedings of the Annual ACM-SIAM Symposium on Discrete Algorithms (New Orleans, LA), 1027–1035.
Gal, Y., and Ghahramani, Z. (2016). “Dropout as a Bayesian approximation: representing model uncertainty in deep learning,” in 33rd International Conference on Machine Learning, ICML 2016, Vol. 3 (New York, NY: International Machine Learning Society (IMLS)), 1651–1660.
Gatys, L. A., Ecker, A. S., and Bethge, M. (2016). “Image style transfer using convolutional neural networks,” in Proceedings of the IEEE Conference on Computer Vision and Pattern Recognition (CVPR) (Las Vegas, NV). doi: 10.1109/CVPR.2016.265
Jin, Q., Yuan, M., Qiao, Q., and Song, Z. (2022). One-shot active learning for image segmentation via contrastive learning and diversity-based sampling. Knowledge-Based Syst. 241:108278. doi: 10.1016/j.knosys.2022.108278
Kendall, A., and Gal, Y. (2017). “What uncertainties do we need in Bayesian deep learning for computer vision?” in Advances in Neural Information Processing Systems (Long Beach, CA), 5575–5585.
Kim, M., Yun, J., Cho, Y., Shin, K., Jang, R., Bae, H. J., et al. (2019). Deep learning in medical imaging. Neurospine 16, 657–668. doi: 10.14245/ns.1938396.198
Lianghui, F., Gang, H. J., Yang, J., and Bin, Y. (2019). “Femur segmentation in X-ray image based on improved U-Net,” in IOP Conference Series: Materials Science and Engineering, Vol. 533 (Guangzhou). doi: 10.1088/1757-899X/533/1/012061
Mahapatra, D., Bozorgtabar, B., Thiran, J. P., and Reyes, M. (2018). “Efficient active learning for image classification and segmentation using a sample selection and conditional generative adversarial network,” in Lecture Notes in Computer Science (including subseries Lecture Notes in Artificial Intelligence and Lecture Notes in Bioinformatics), Vol. 11071 (Granada), 580–588. doi: 10.1007/978-3-030-00934-2_65
Moreira da Silva, D. E., Alves-Pimenta, S., Gonçalo, P. F., Colaço, B., Santana, A., Ferreira, M., et al. (2021). “Relationship between the hip congruence index and hip FCI categories in dogs,” in 46th Word Small Animal Veterinary Association World Congress, WSAVA 2021. Available online at: https://wsava2021.com/wp-content/uploads/sites/48/2021/11/WSAVA21-Abstracts-Nov-15-by-topic.pdf
Moreira da Silva, D. E., Filipe, V., Franco-Gonçalo, P., Colaço, B., Alves-Pimenta, S., Ginja, M., et al. (2022). “Semantic segmentation of dog's femur and acetabulum bones with deep transfer learning in X-ray images,” in Intelligent Systems Design and Applications. ISDA 2021. Lecture Notes in Networks and Systems, eds A. Abraham, N. Gandhi, T. Hanne, T. P. Hong, T. Nogueira Rios, and W. Ding (Cham: Springer), 461–475. doi: 10.1007/978-3-030-96308-8_43
Nguyen, C. D. T., Huynh, M.-T., Quan, T. M., Nguyen, N. H., Jain, M., Ngo, V. D., et al. (2021). GOAL: gist-set online active learning for efficient chest X-ray image annotation. Proc. Mach. Learn. Res. 143, 545–553.
Ozdemir, F., Peng, Z., Fuernstahl, P., Tanner, C., and Goksel, O. (2021). Active learning for segmentation based on Bayesian sample queries. Knowl. Based Syst. 214:106531. doi: 10.1016/j.knosys.2020.106531
Ozdemir, F., Peng, Z., Tanner, C., Fuernstahl, P., and Goksel, O. (2018). “Active learning for segmentation by optimizing content information for maximal entropy,” in Lecture Notesin Computer Science (Including Subseries Lecture Notes in Artificial Intelligence and Lecture Notes in Bioinformatics), Vol. 11045 (Granada), 183–191. doi: 10.1007/978-3-030-00889-5_21
Pearson, K. (1901). On lines and planes of closest fit to systems of points in space. Lond. Edinb. Dublin Philos. Mag. J. Sci. 2, 559–572. doi: 10.1080/14786440109462720
Ren, P., Xiao, Y., Chang, X., Huang, P. Y., Li, Z., Gupta, B. B., et al. (2020). A survey of deep active learning. ACM Comput. Surveys 54, 1–40. doi: 10.1145/3472291
Ronneberger, O., Fischer, P., and Brox, T. (2015). “U-Net: convolutional networks for biomedical image segmentation,” in Medical Image Computing and Computer-Assisted Intervention MICCAI 2015, Vol. 9351 (Cham: Springer) 234–241. doi: 10.1007/978-3-319-24574-4_28
Shah, R., and Sharma, P. (2018). “Bone segmentation from X-ray images: challenges and techniques,” in Advances in Intelligent Systems and Computing, Vol. 672 (Singapore: Springer), 853–862. doi: 10.1007/978-981-10-7512-4_84
Shannon, C. E. (1948). A mathematical theory of communication. Bell Syst. Techn. J. 27, 379–423. doi: 10.1002/j.1538-7305.1948.tb01338.x
Siddique, N., Paheding, S., Elkin, C. P., and Devabhaktuni, V. (2021). U-net and its variants for medical image segmentation: a review of theory and applications. IEEE Access 9, 82031–82057. doi: 10.1109/ACCESS.2021.3086020
Srivastava, N., Hinton, G., Krizhevsky, A., Sutskever, I., and Salakhutdinov, R. (2014). Dropout: a simple way to prevent neural networks from overfitting. J. Mach. Learn. Res. 15, 1929–1958. doi: 10.5555/2627435
Tan, M., and Le, Q. V. (2019). “EfficientNet: rethinking model scaling for convolutional neural networks,” in 36th International Conference on Machine Learning, ICML 2019 (Long Beach, CA), 10691–10700.
Zhao, Z., Yang, X., Veeravalli, B., and Zeng, Z. (2020). “Deeply supervised active learning for finger bones segmentation,” in Proceedings of the Annual International Conference of the IEEE Engineering in Medicine and Biology Society, EMBS (Montreal: Institute of Electrical and Electronics Engineers Inc.), 1620–1623. doi: 10.1109/EMBC44109.2020.9176662
Keywords: X-ray image analysis, deep learning, active learning, cluster based sampling, representative sampling, Monte Carlo Dropout sampling, Shannon's entropy
Citation: Moreira da Silva DE, Gonçalves L, Franco-Gonçalo P, Colaço B, Alves-Pimenta S, Ginja M, Ferreira M and Filipe V (2022) Active learning for data efficient semantic segmentation of canine bones in radiographs. Front. Artif. Intell. 5:939967. doi: 10.3389/frai.2022.939967
Received: 09 May 2022; Accepted: 07 October 2022;
Published: 26 October 2022.
Edited by:
Leslie N. Smith, Navy Center for Applied Research in AI, United StatesReviewed by:
Tereza Cristina Cardoso, Universidade Estadual de São Paulo, BrazilCopyright © 2022 Moreira da Silva, Gonçalves, Franco-Gonçalo, Colaço, Alves-Pimenta, Ginja, Ferreira and Filipe. This is an open-access article distributed under the terms of the Creative Commons Attribution License (CC BY). The use, distribution or reproduction in other forums is permitted, provided the original author(s) and the copyright owner(s) are credited and that the original publication in this journal is cited, in accordance with accepted academic practice. No use, distribution or reproduction is permitted which does not comply with these terms.
*Correspondence: Vitor Filipe, dmZpbGlwZUB1dGFkLnB0
Disclaimer: All claims expressed in this article are solely those of the authors and do not necessarily represent those of their affiliated organizations, or those of the publisher, the editors and the reviewers. Any product that may be evaluated in this article or claim that may be made by its manufacturer is not guaranteed or endorsed by the publisher.
Research integrity at Frontiers
Learn more about the work of our research integrity team to safeguard the quality of each article we publish.