 Thomas Amlie
 David Persson
 Simen Foyn Nørstebø
 Asgeir Østvik
 Marit Stormoen
 Øystein Evensen
95% of researchers rate our articles as excellent or good
Learn more about the work of our research integrity team to safeguard the quality of each article we publish.
Find out more
ORIGINAL RESEARCH article
Front. Aquac. , 29 January 2025
Sec. Production Biology
Volume 4 - 2025 | https://doi.org/10.3389/faquc.2025.1479875
Introduction: In aquaculture, clinical chemistry can be used pre-emptively to manage fish health and for early disease intervention. While less established in farmed fish compared to farmed terrestrial animals, it has been used for salmonid cage farming but is almost non-existent in recirculation aquaculture systems (RAS) for Atlantic salmon (Salmo salar L.). In this descriptive study, the level and distribution of selected biochemical plasma analytes from different weight classes of Atlantic salmon reared in commercial RAS facilities maintained in either freshwater or saltwater were determined.
Methods: Facility 1 focused on the production of fry to smolt at a salinity of 0.5-2 ppt, and Facility 2 produced fish from smolt to market size. Four fish groups (FG) were included: FG 1-2 in Facility 1 and FG 3-4 in Facility 2. Fish in Facility 1 were sampled monthly, while fish in Facility 2 were sampled at varying intervals (between 4 and 19 weeks) to determine selected biochemical analytes. The study spanned 100-250 days, depending on the fish group. Biochemical analyses included sodium, chloride, potassium, osmolality, calcium, magnesium, total protein, albumin, and globulin. In addition, water quality parameters measured included temperature, salinity, NH4-N, NO2, NO3, color, turbidity, alkalinity, CO2, H2S, and gas pressure.
Results: Results indicated that selected blood analytes of Atlantic salmon were influenced by the production environment (freshwater or saltwater). In addition, there was an effect of fish weight, but variable for the different analytes. Water quality parameters varied with time and system; however, were within acceptable ranges in both production environments. No clear impact biochemical values were found from variations in water quality parameters.
Discussion: These results underscore the need for future research into system/environment-specific reference intervals and a better understanding of how fish weight impacts clinical chemical parameters. Factors that encompass water quality, management practices, fish strain/batch (i.e., stress tolerance), and the physiological status of the fish need to be considered and can influence obtained reference intervals. A threshold for acceptable prevalence and degree of exterior deviations should be defined. Reference values should then be compared to analyte levels in fish with known diseases to assess the diagnostic value of blood sampling.
The application of clinical chemistry in aquaculture is less established (Groff and Zinkl, 1999; Campbell, 2012; Braceland et al., 2017) than in terrestrial animal farming despite its potential to contribute to disease diagnosis and health monitoring in farmed fish (Harbell et al., 1979; Barham et al., 1980; Byrne et al., 1991; Řehulka, 2003; Hvas et al., 2017; Klykken et al., 2022; Esposito et al., 2024), and the fact it can be used pre-emptively in disease control. Variability in blood analytes can reflect changes due to varying environmental conditions, stress, and exposure to toxins (Förlin et al., 1986; Bonga and Lock, 1992; Folmar, 1993), thereby providing a tool for assessing the welfare and health of fish.
However, the interpretation of these results hinges on the availability of species-specific reference values, which can vary significantly due to genetic makeup, age and sex of the fish, nutritional factors, methodological factors, environmental conditions, and in the case of salmonids, smoltification (McDonald and Robinson, 1993; Groff and Zinkl, 1999; Hrubec et al., 2001; Fazio et al., 2015). Further, differences in aquaculture settings, such as freshwater and saltwater production environments, have been shown to impact critical metrics including hematocrit, hemoglobin, and various electrolytes and enzymes (Casanovas et al., 2021). In addition to environmental factors and production environments, fish size may influence obtained values (Pastorino et al., 2020; Casanovas et al., 2021; Fazio et al., 2021), underscoring the complexity of the physiological regulation of biochemical plasma analytes in fish. It should be noted that these studies were conducted in flow-through systems, and few studies have addressed the potential impact of other production systems such as recirculating aquaculture systems (RAS) (Timmons et al., 2018). RAS technologies have been shown to optimize production environments and minimize freshwater usage in smolt production of salmonids, with recent innovations allowing growth of fish to market size in land-based facilities (Dalsgaard et al., 2013; Davidson et al., 2016; Crouse et al., 2021). RAS production can occur in both fresh- and saltwater environments, each which represent distinct differences in water quality. Under either production environment, proper management ensures reducing exposure to accumulated and potentially harmful substances such as suspended solids, ammonia (NH3), nitrite (NO2), or hydrogen sulfide (H2S) that can impact fish health (Chen et al., 1993; Martins et al., 2010; Li et al., 2023). Thus, regular monitoring and adjustments of operation parameters are needed to optimize production. Given these circumstances, early detection of health disturbances is essential, whereby timely interventions can be initiated to curb disease outbreaks pre-emptively (MacAulay et al., 2022). While guidelines are available for setting reference intervals for clinical chemistry in veterinary practice (Friedrichs et al., 2012), a standardized protocol has yet to be established. Thus, there is a need to understand the nuances of critical clinical chemical analyte levels under different production environments and development stages of fish to be able to spot early-stage deviations from normal levels.
This descriptive study aimed to measure selected blood analytes over time for Atlantic salmon (Salmo salar L.) reared in freshwater and saltwater RAS facilities, thereby contributing to establishing reference values for these biochemical analytes. Of particular interest was identifying variations in measured variables with fish size and possible environment-specific differences (freshwater vs. saltwater).
This descriptive study was conducted under commercial conditions and as such experimental replicates of treatments could not be implemented. Instead, this study was focused on evaluating plasma analytes of Atlantic salmon of varying sizes reared under differing environmental conditions (salinities) in two commercial RAS facilities. Each of the two facilities (Facility 1 and Facility 2) had distinct differences in fish weight and water salinity and the study spanned 100-250 days depending on fish group (Table 1). Facility 1 was focused on the production of fry to smolt at a salinity of 0.5-2 ppt and Facility 2 was focused on the production of fish from smolt to market (target weight >5 kg) at a salinity of 29 ppt. Temperature in each facility were kept close to 13°C. Four fish groups (FG) were included – FG 1-2 in Facility 1 and FG 3-4 in Facility 2 (Table 1).
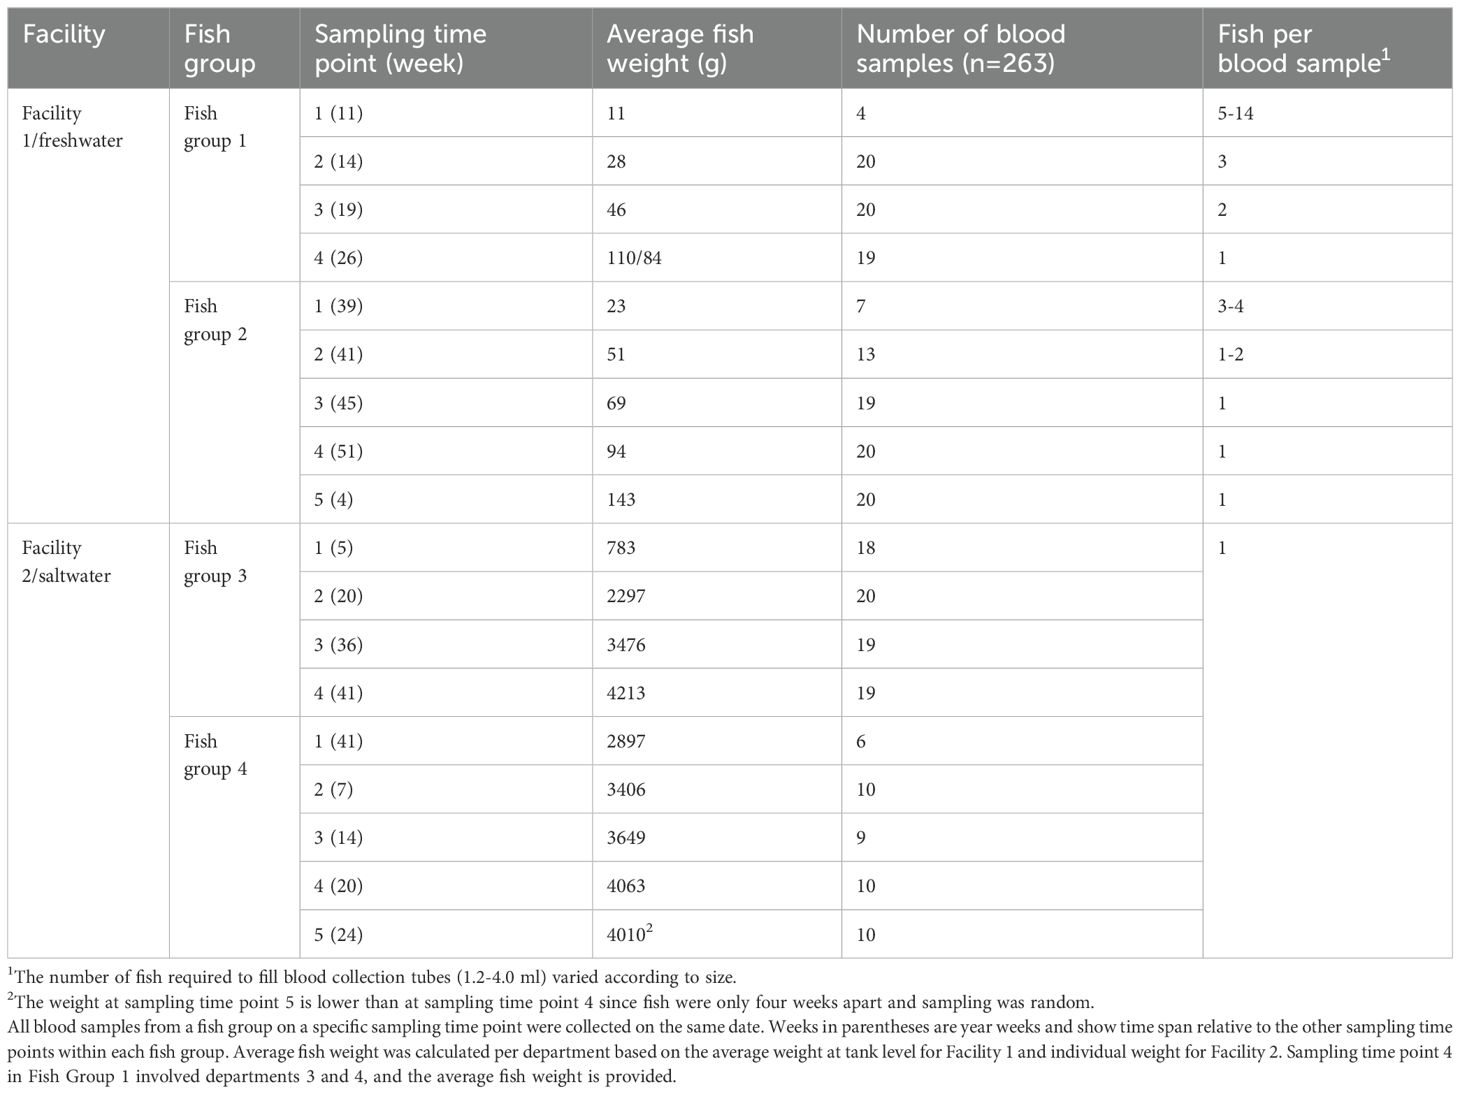
Table 1. Sampling per facility/production environment.
The facilities were not connected, i.e., Facility 2 did not receive smolt from Facility 1. A total of 378 healthy salmon were sampled. Fish with minor external signs such as scale loss, skin hemorrhage, and fin erosion were treated as healthy and included in the study, while fish with wound score 3 (i.e. large/open wounds) were excluded (Noble et al., 2018). In facility 1 the fish were fed 24/7 with commercial feed, except for feed withdrawal 1 day prior to grading/pumping, and 2-3 days prior to vaccination. In Facility 2, feeding was also 24/7 using automatic feeders and commercial feed based on tables provided by the feed supplier. In Facility 1, vaccination was performed once per group at fish size about 55 grams in department 2. The vaccine was delivered by intraperitoneal injection using commercially available vaccines. Fish in Facility 2 were vaccinated using the same routines as for Facility 1, one injection at pre-smolt stage where onset of immunity was reached before arrival to the facility.
Blood sampling was performed longitudinally following a repeated cross-sectional protocol, i.e., there was several sampling time points within each fish group, but the individual fish were only sampled once, in contrast to a cohort study. The number of fish, blood samples, and pooled blood samples obtained at each collection time is provided in Table 1. Pooled samples were prepared from smaller fish present in Facility 1 (due to small blood volumes obtained per individual fish). Sampling was conducted monthly in Facility 1, with varying intervals in Facility 2 (between 4 and 19 weeks). This resulted in 4 or 5 unique sampling time points for each fish group (Table 1; Figure 1).
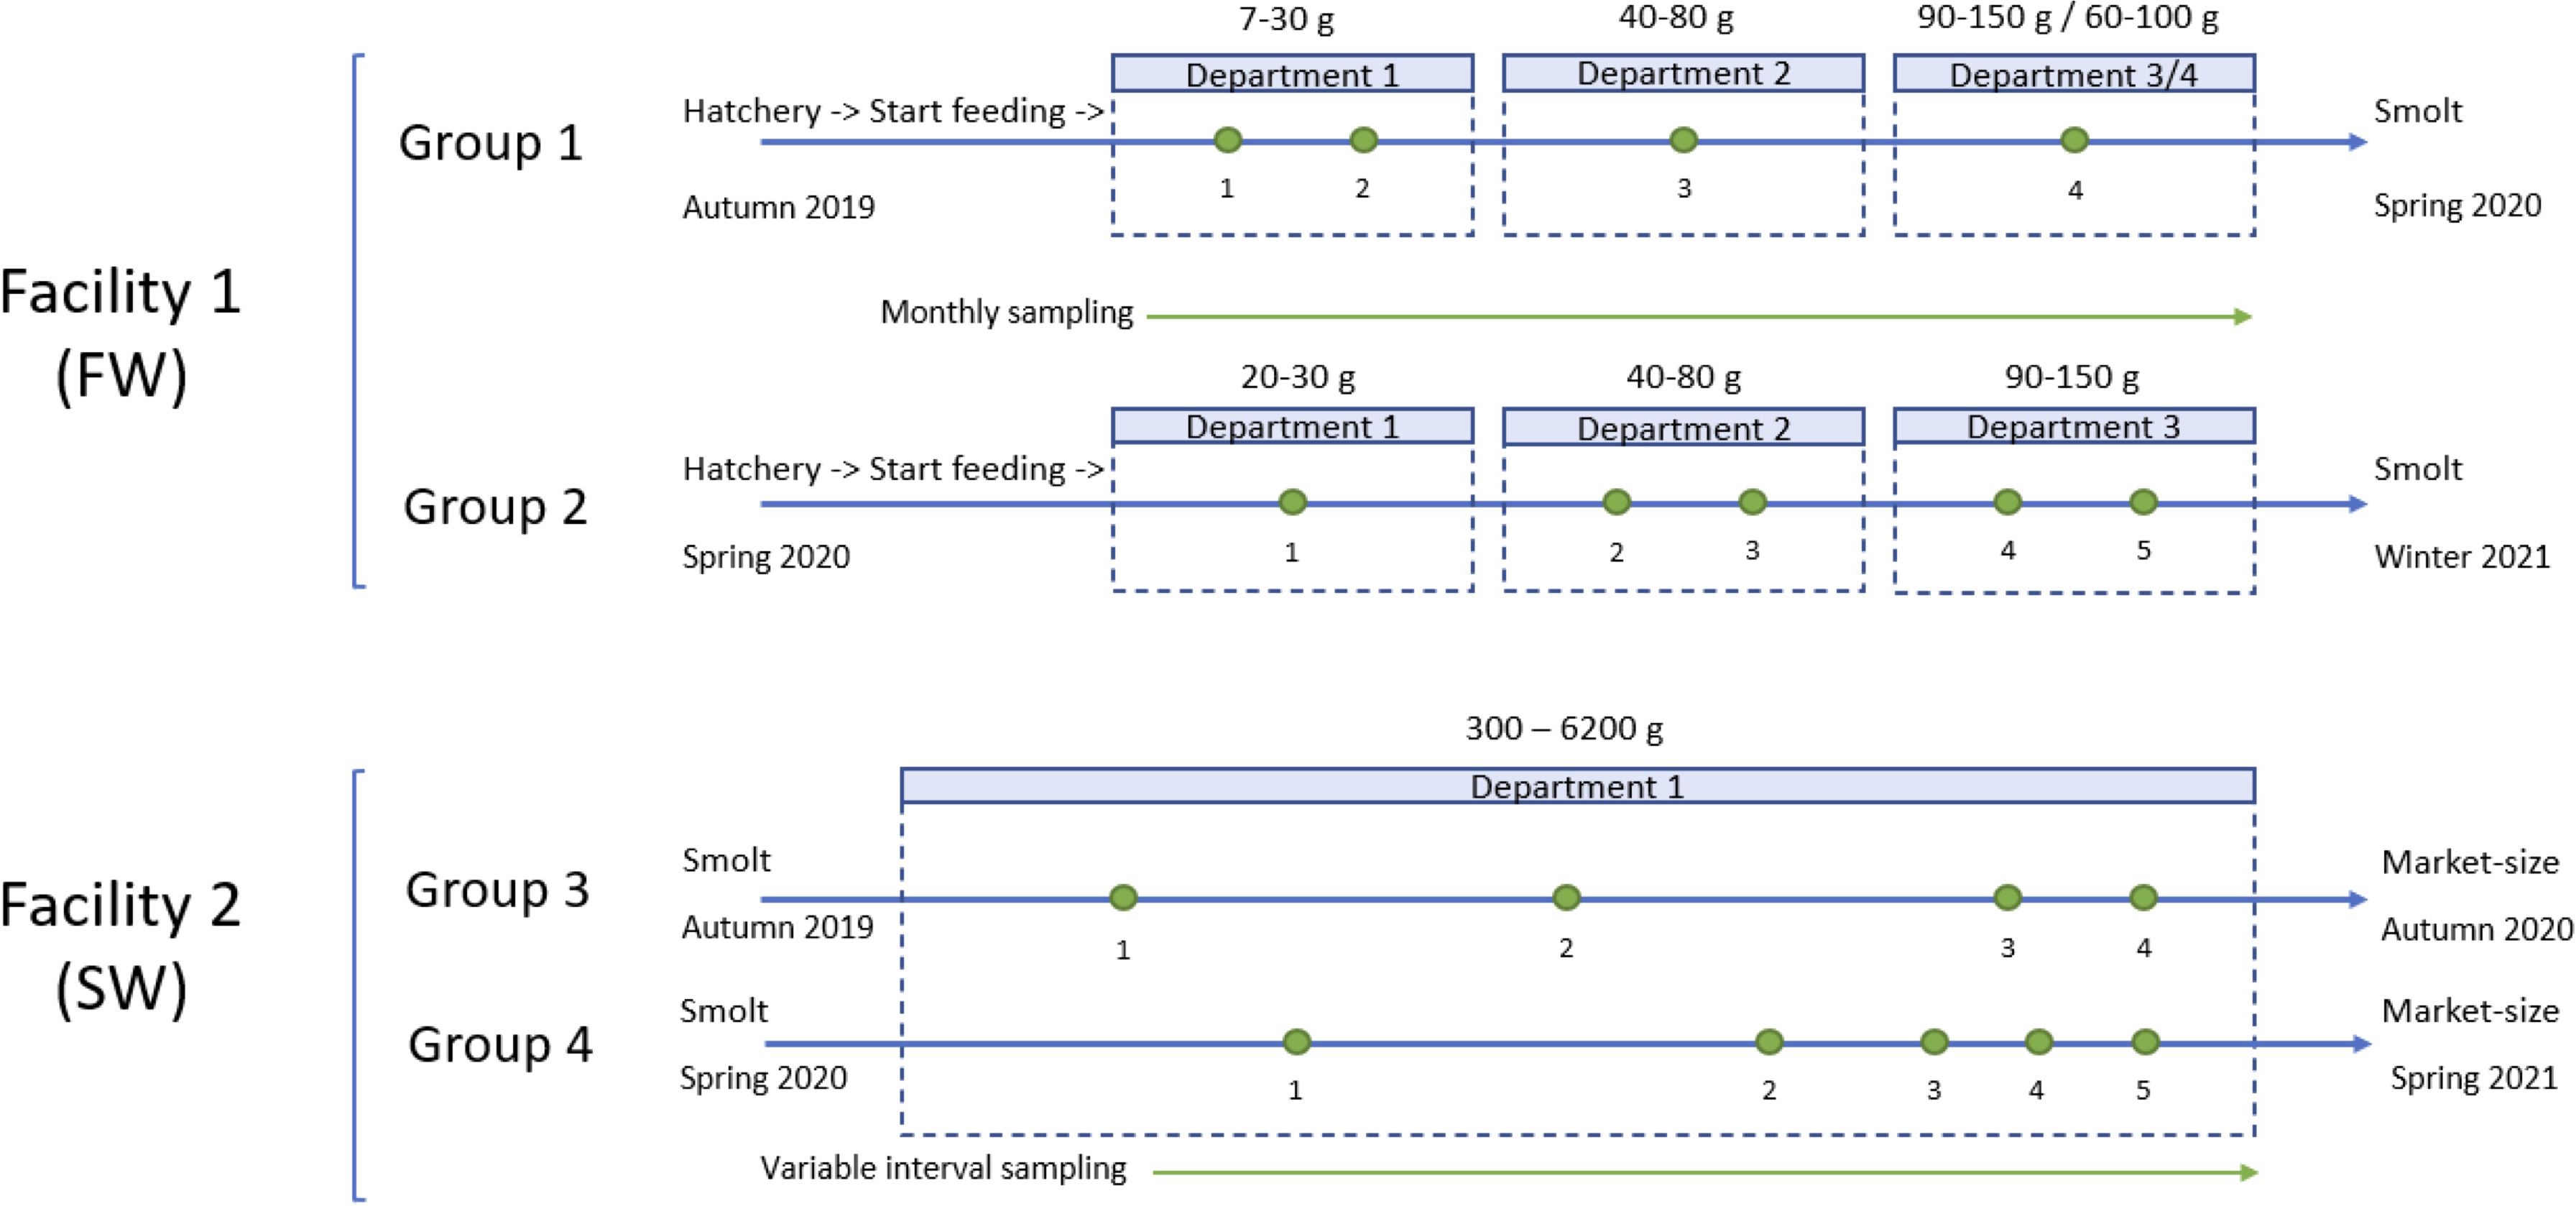
Figure 1. Simplified overview of the production lines and sampling. Green dots indicate sampling. Each department within Facility 1 covers a weight interval/class, while the weight interval in Facility 2 is further divided across sampling time points, see text. In Facility 2, one sampling time point is shared (sampling time points 4 and 1 for fish groups 3 and 4, respectively). FW (freshwater environment) and SW (saltwater environment).
Facility 1 consisted of four departments, each with its own RAS housing between 6 to 10 tanks. Department is defined as a separate area within the facility housing a specific fish group within a certain weight interval, and with its own RAS. As the fish grow, they are moved and sorted into new tanks in a «higher» department.
Facility 1 used freshwater with seawater added to reach a salinity of 0.5-2 ppt for operational purposes. The fish groups in Facility 1 were moved through the different departments. At each sampling point, sampling was randomized using Microsoft Excel based on how many tanks were used and which tanks to sample from. FG1 originated from two different roe batches, while all fish in FG2 were from one roe batch (Figure 1). In both groups, the mortality was low over the production period.
Facility 2 consisted of one RAS using saltwater (29 ppt). The two fish groups from which samples were obtained were from the same roe batch, but the batch was transferred to the facility at three separate time points (Figure 1). FG3 consisted of the first transfer, which included the largest fish from the second transfer. FG4 consisted of the third transfer, which was comprised of the smallest fish from transfer two. The mixing of fish from transfer two was due to size sorting during normal production activities. Fish were kept in the same tank but in segments that were physically separated into sections using a grid partition, allowing water to flow through while keeping fish in separate areas/segments. The cumulative mortality over the production period for FG3 and FG4 was 3-5% (fish in the sampling groups were moved/sorted and slaughtered over the sampling period, so an exact figure is difficult to obtain).
In Facility 1, fish weight classes were based on average weight per department: 20-30 g, 40-80 g, 60-100 g, and 90-150 g. Due to the high sample pooling, four samples from the smallest fish in department 1 were assigned to a separate group, 7-15 g. Fish weight was estimated based on feeding rate, fish growth, and regular weight measurements according to internal production protocols. In Facility 2, the individual fish weight at sampling was divided into weight classes: 300-1000 g, 1000-2500 g, 2500-3500 g, and 4500-6200 g (Table 2).
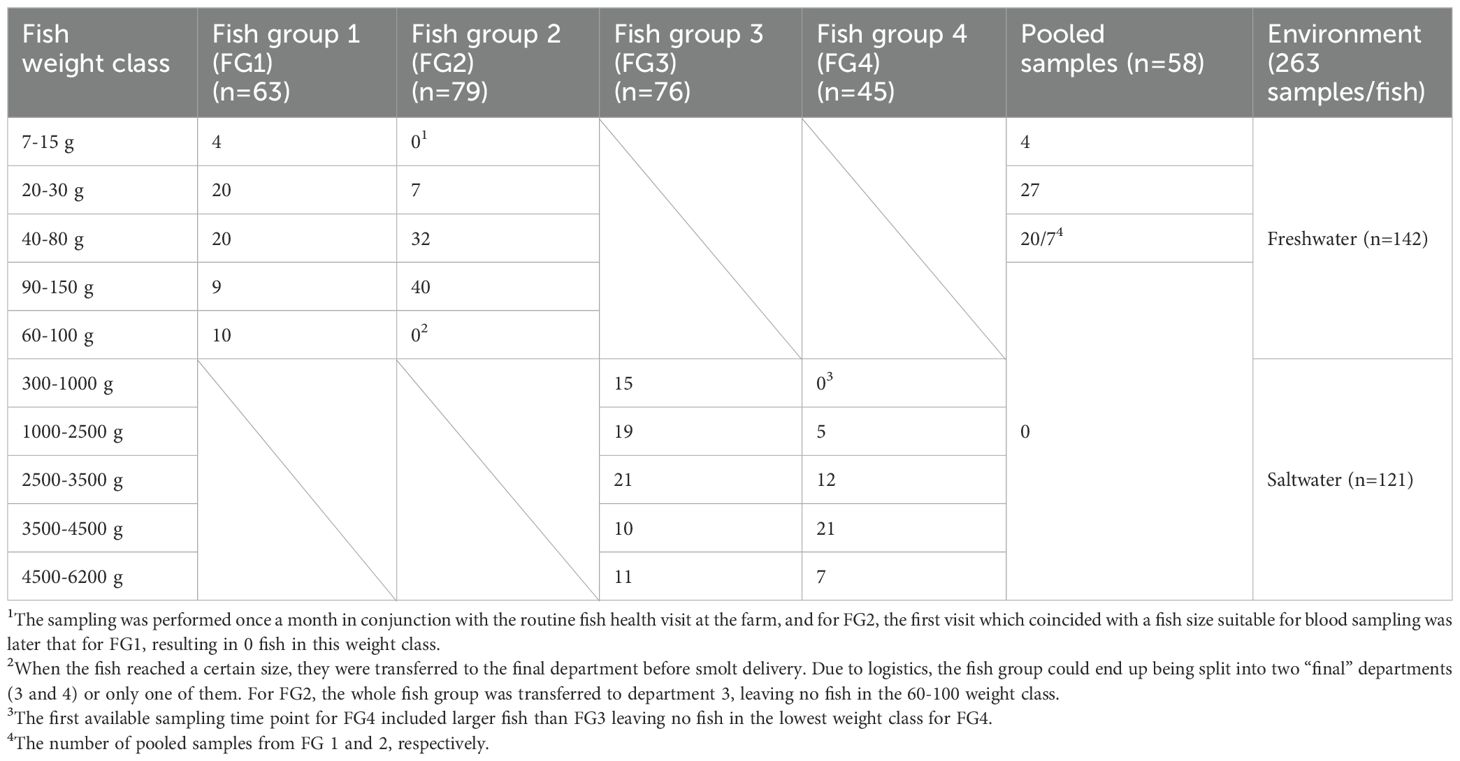
Table 2. Blood samples per fish group within each weight class.
Fish were randomly netted for sampling and euthanized with an overdose of benzocaine. The time from fish confinement to euthanasia and blood sampling differed between facilities.
This was mainly due to that smaller fish in Facility 1 were euthanized as a group, while larger fish in Facility 2 were crowded before netting at specific time points for operational purposes. Most sampling was conducted on fed fish, but if a sampling time point coincided with large operations (e.g. vaccination for FG1 and FG2 and grading for FG3 and FG4), fish were starved before sampling. Fish in FG3 and FG4 in facility 2 came from the same tank but were kept in different segments, which made the groups identifiable and allowed targeted sampling over time possible.
Blood was collected from the caudal vasculature. The volume of blood collection tubes was adapted to fish size (1.2-4.0 ml), and blood was collected using a heparinized (Li-Hep) syringe container (S-Monovette, Sarstedt) or vacuum container (Vacuette, Greiner Bio-One).
Pooling of blood samples occurred for smaller fish, restricted to fish within the same tank and department (2-3 time points for each group in facility 1). Needle size varied according to fish size using 20-23G (0.6 x 25 – 0.9 x 40 mm).
Blood samples were centrifuged at 1500-2500 x g for 5-10 minutes within 4 hours after sampling except for the shared sampling time point for FG 3 and 4 for Facility 2 (up to 6 hours for logistical reasons). After centrifugation, plasma samples were stored at ≤-18°C until analyzed. Cooling packs were used when transporting plasma samples to the lab but were not used regularly between sampling and centrifugation. The sampler and the laboratory registered the occurrence of hemolysis, and one sample was deemed unsuitable for analysis due to the degree of hemolysis.
Blood samples were analyzed at The Clinical Chemistry Laboratory at NMBU (Ås, Norway).
Plasma chemistry analyses (Supplementary Table S1) were conducted on either Siemens Advia 1800 or Siemens Atellica CH 930 (Siemens Healthcare Diagnostics, USA). Osmolality was measured using a Fiske 210 micro osmometer. If necessary, samples were diluted to fit the analytical range. In the remainder of the text, plasma sodium, chloride, potassium, calcium, and magnesium refer to their corresponding electrolytes in the blood.
Fish were fed according to standard feeding tables/protocols provided by the feed supplier, with regard to amount fed daily and pellet size used for the different fish.
Water sampling and analyses were performed regularly by facility staff. Sample location and interval between measurements were set according to production protocols in each facility and matched with blood sampling time points if practically feasible. Most water samples were collected at the outlet when water was returned from fish tanks to the RAS unit. An exception was gas pressure, measured in the water entering the tanks. The two facilities’ personnel and monitoring equipment differed, as did which water quality parameters to monitor (Supplementary Table S2) as this depends on several factors, e.g., system-build, facility-specific experience, quality of intake water and risk assessment. Dissolved oxygen (O2) and pH were measured systematically in both facilities, but these parameters were also controlled tightly, and as such they were not assessed in detail in this study. The operational pH-set points were 7.2-7.5. In the remainder of the text, the water measurements NH4-N, NO2-N, and NO3-N are referred to as ammonium, nitrite, and nitrate, respectively. Most emphasis was placed on water measurement results close to each blood sampling event in the study.
Descriptive statistics and correlation analyses were performed in Stata 16/18 (StataCorp. 2019/2023. Stata Statistical Software: Release 16/18. College Station, TX: StataCorp LLC.).
The median value was used for evaluating the correlation between blood analytes and water parameters and calculated for each sample time point as follows: for all blood samples at the time of sampling and on all the water measurements performed over eight days ahead and including that sample time point using Stata 16. Descriptive statistics included mean, median, maximum, and minimum values, and kernel density plots were generated using Stata18. A principal component analysis (PCA) was performed to identify principal components and display the results as biplots using Stata18.
Mean, median, and nonparametric 95% reference intervals (2.5/97.5 percentiles) were calculated for the different plasma analytes. The 90% confidence intervals (CI) for the lower and upper limits of the reference intervals were determined (CLSI Guidelines: Defining, Establishing, and Verifying Reference Intervals in the Clinical Laboratory; Approved Guideline-third edition. 2008). Kruskal-Wallis test was used to test for differences in reference values by system, and a p-value < 0.05 was considered statistically significant.
Table 2 shows the distribution of samples across different fish weight classes and groups. The number of fish sampled in fresh- and saltwater is nearly the same. In FG1, the mean weight was lower than in FG2 (p=0.0001, Supplementary Table S3), and the mean weight in FG3 (xavg=2712g) was lower (p=0.0001) than in FG4 (avg =3667g, Supplementary Table S3). The fish weights for the different FGs were based on tank weights for FG1 and 2 and individual weights for FG3 and 4 (Supplementary Table S3).
Before conducting inferential data analysis, an exploratory data analysis was performed to understand the distribution of the different variables and the potential factors that influenced the values obtained for the different analytes. Starting with fish weight, Supplementary Table S3 shows the mean weights with standard deviation (SD), skewness, and kurtosis. Skewness and kurtosis values did not indicate any particular concerns for any groups regarding left or right skewness or tails in the different FGs, apart from the FG3 group that had a broader weight distribution for fish below mean weight (Supplementary Figure S1). The smaller fish (FG1 and FG2) were grouped by tank weight, while individual weights were recorded for FG3 and FG4. FG3 had a broader weight range than FG4. Outliers (above and below spikes) are noted in all groups.
Values for the different biochemical variables are summarized in Table 3. The mean value was close to the median for all variables except potassium, explained by the high number (146/263) of samples giving a value below the detection limit (1.0 mmol/L), which was set at 0.5 mmol/L. The highest proportion was for FG1 (46/63), FG2 (64/79), and FG4 (20/45), and the lowest for FG3 (16/76). The values for the different variables indicated that mean, median, and quantiles were close for FG1 and FG2 (Table 3). The mean values were relatively close to the median for most variables. Skewness gave negative values between -1 to -0.5 or positive values of 0.5 – 1.0 for all analytes in FG1, except potassium, all but potassium, magnesium, and osmolality in FG2, all but magnesium in FG3, and all analytes in FG4 (Table 3). Potassium was notable due to the number of samples given a value of 0.5 mmol/L (below the detection limit).
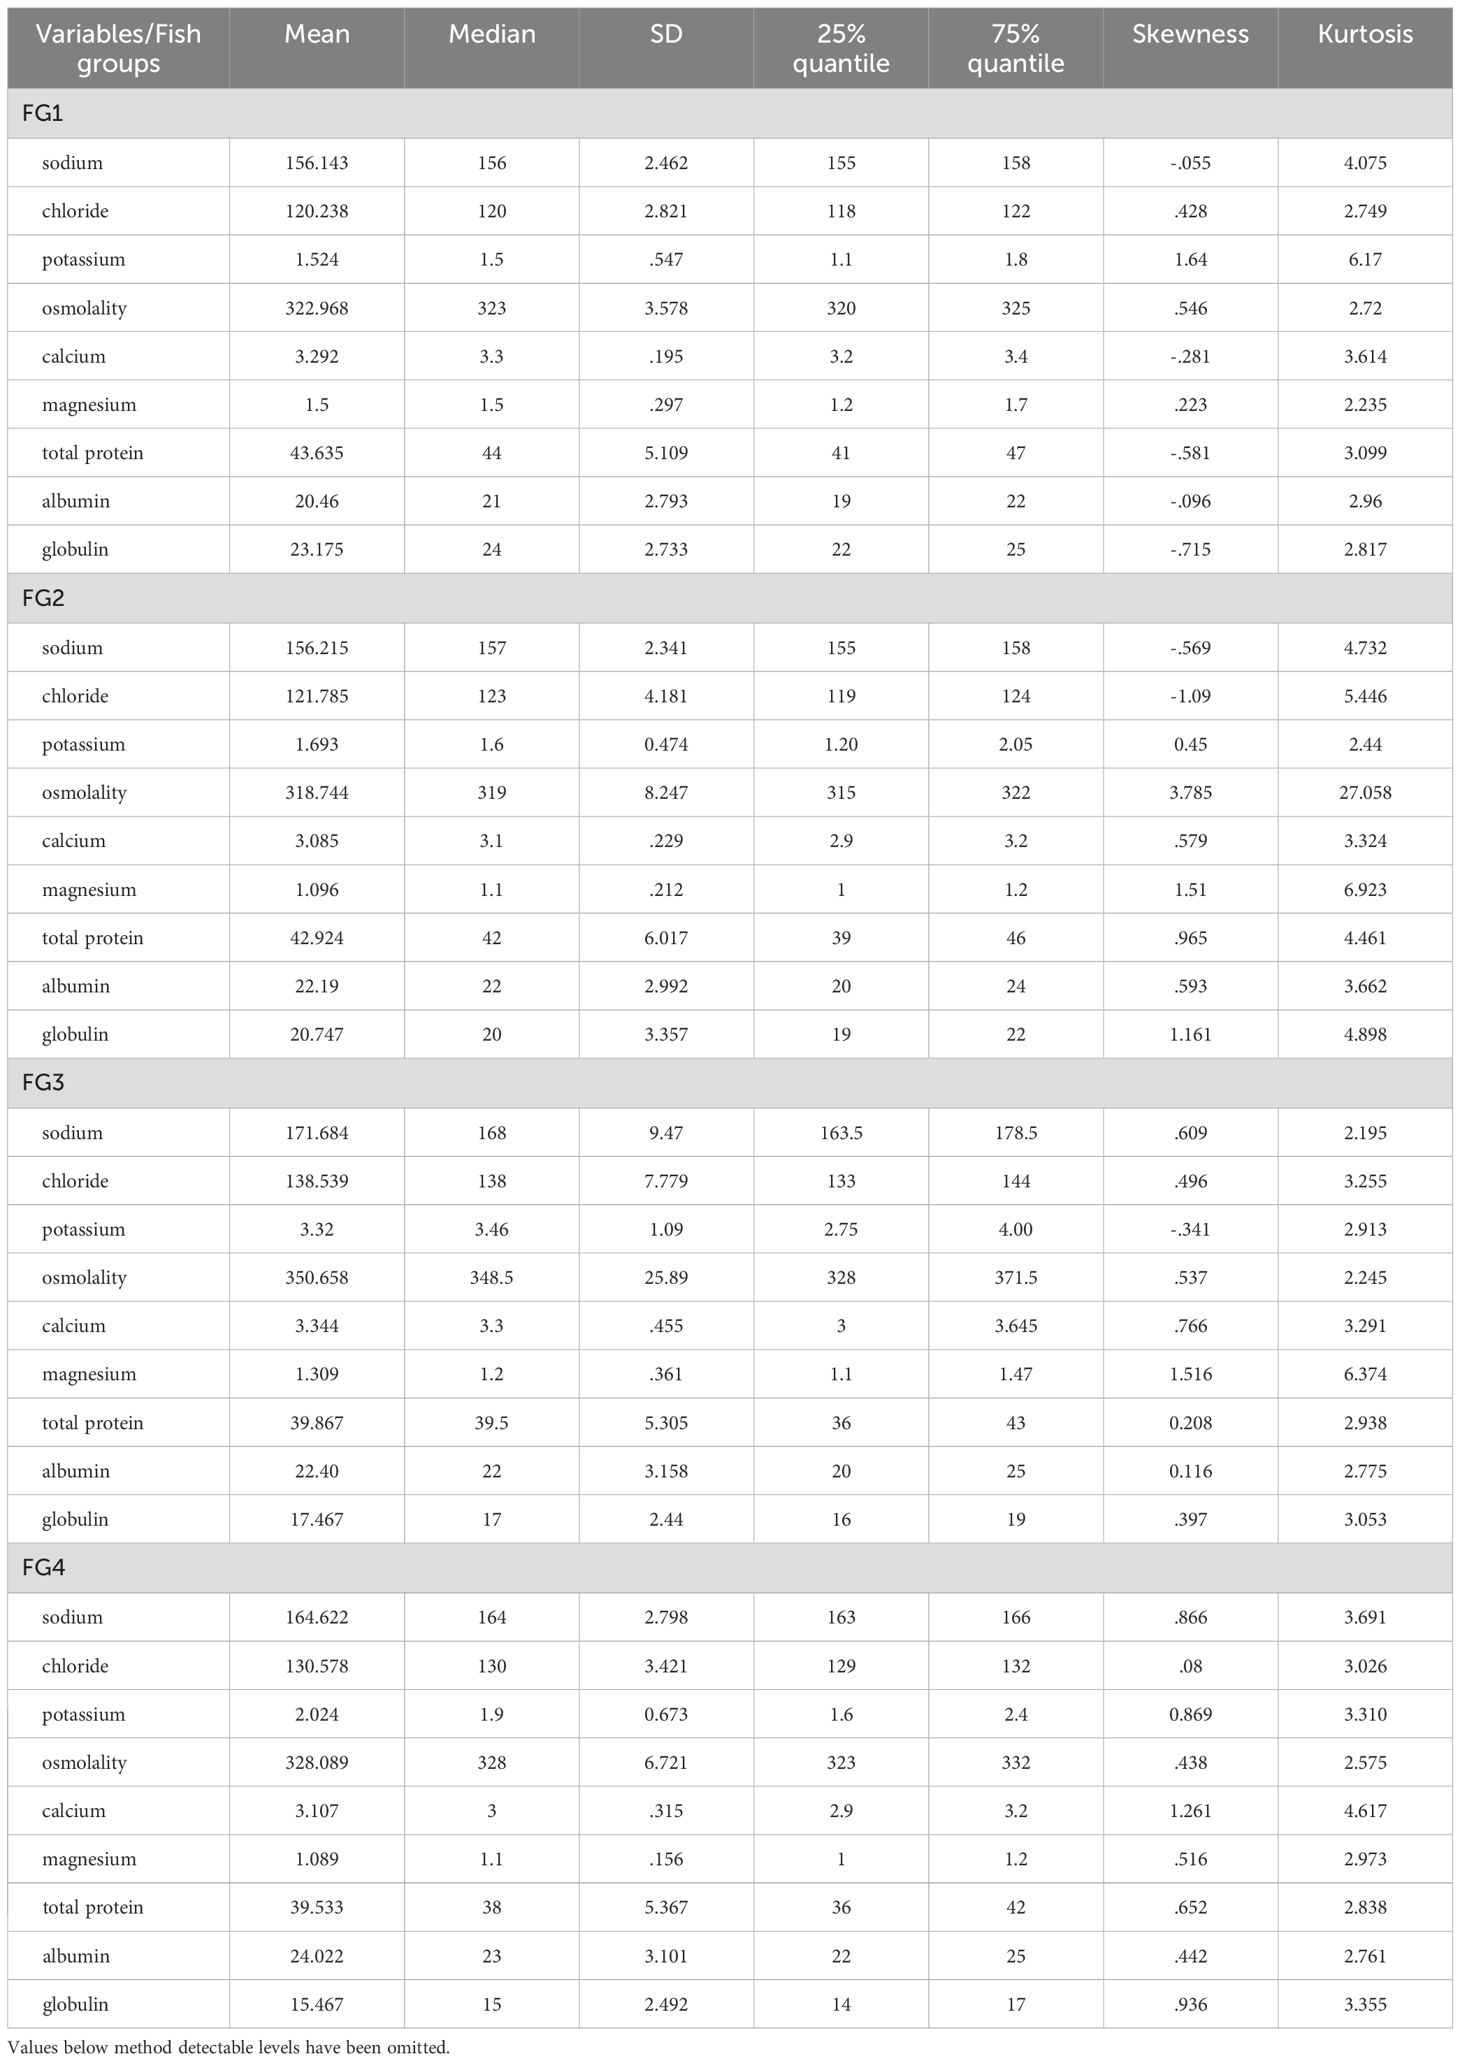
Table 3. Mean and median values for the different biochemical variables, standard deviation, 25%/75% quantiles, skewness, and kurtosis per fish group (FG).
The Kurtosis value ≈3 indicated a distribution around the mean for many analytes, but there was variation between fish groups. For FG1, sodium showed a kurtosis value >4; for FG2, several analytes had values >4, and calcium and albumin were the only analytes with values <3. For FG3, magnesium, total protein, and albumin had values >4, and for FG4, only calcium was above 4.
Kernel density plots, and monovalent and divalent ions revealed multimodality in the saltwater FGs, distinctly for sodium and chloride, and magnesium in all FGs, both more distinct in freshwater (Supplementary Figure S2). Total protein levels showed multimodality for the smallest fish (FG1), but also among the largest fish group (FG4) (Supplementary Figure S2). Several variables tended to have a tail in the kernel density plots, as read from Table 3, where skewness values >0.5 or <-0.5 were equal to right or left skewness.
Distributional diagnostic plots using qnorm include quantiles plotted against the quantiles of a normal distribution. Mono- (Na+, Cl-), divalent (Ca2+, Mg2+) ions, and osmolality had a distribution that deviated from the quantiles of a normal distribution (deviated from the straight line, Supplementary Figure S3). In contrast, ‘total protein’, ‘albumin’, and ‘globulin’ all showed an almost perfect linear distribution (Supplementary Figure S3). Potassium deviated from the other variables since a high proportion (146 of 263) of fish were below the detection limit (1.0 mmol/L), all set at 0.5 mmol/L. The qnorm plot is shown excluding the set numbers (Supplementary Figure S3).
A distribution plot (stripplot in Stata) for the different variables for each fish group was conducted. FG3 had the broadest distribution for Na+, Cl-, and osmolality (Figure 2).
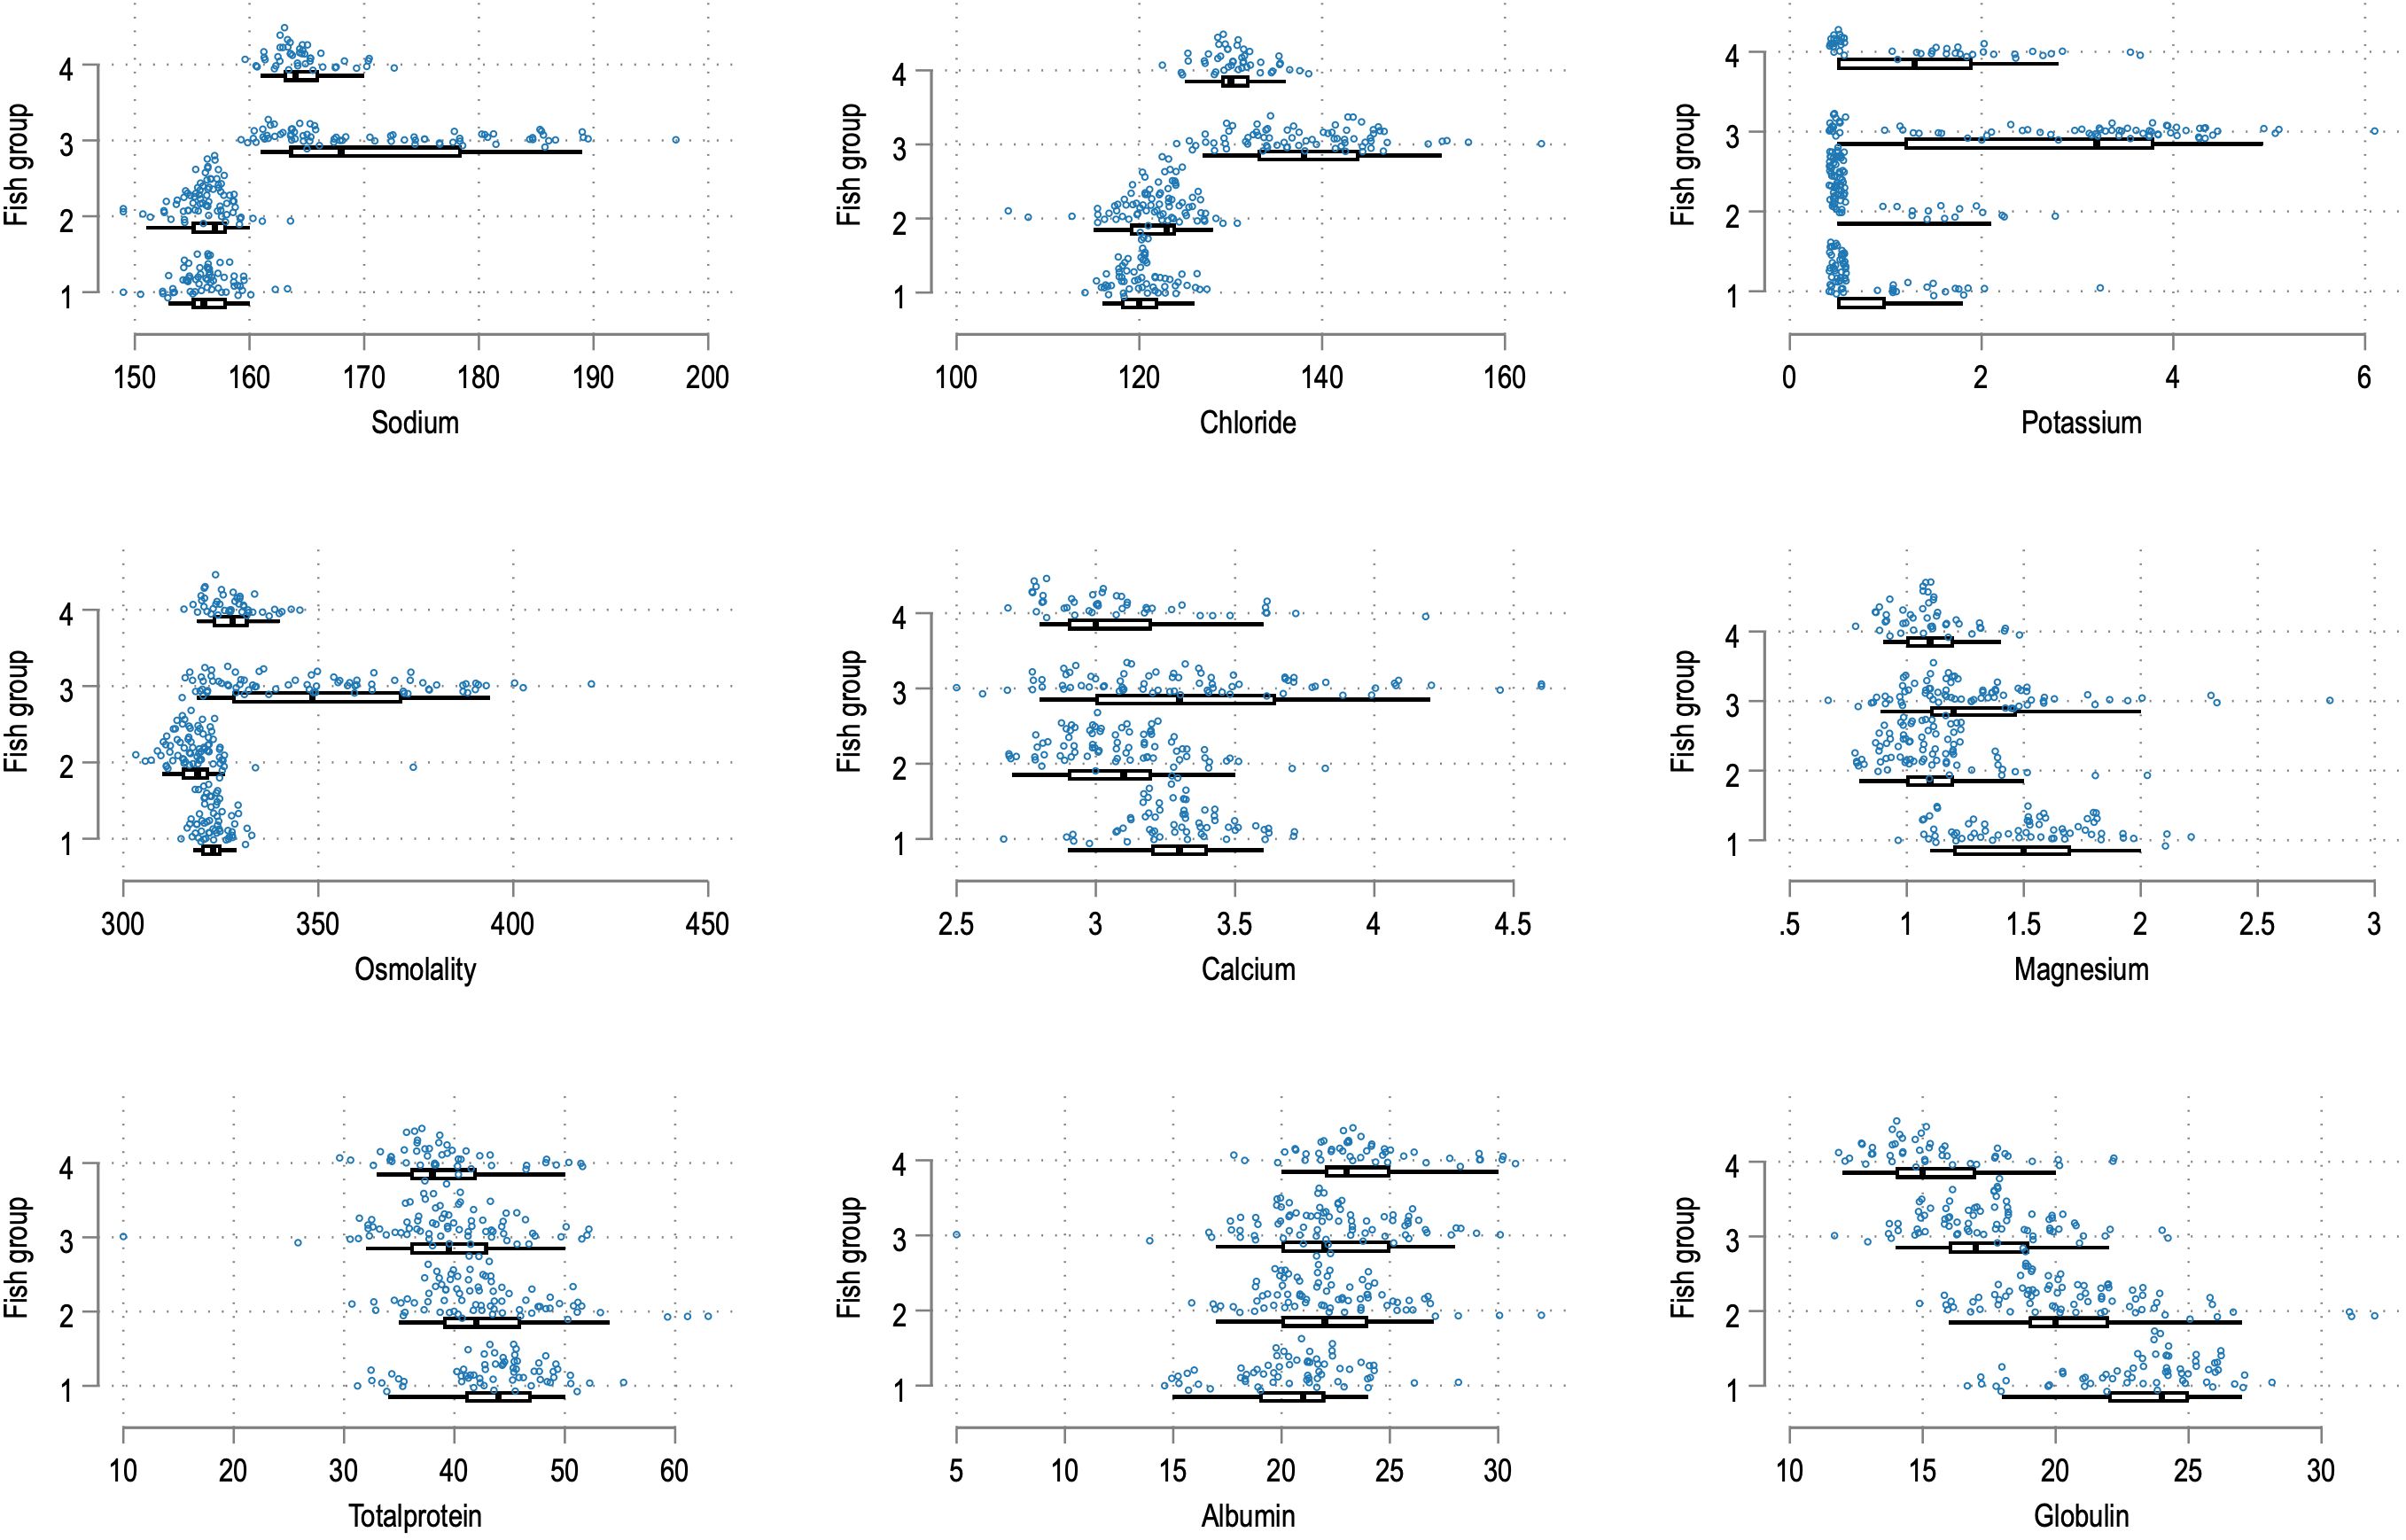
Figure 2. Stripplots for the variables indicated for individual fish for FG1-4. For the monovalent ions and osmolality, FG3 stands out with values different from the other groups.
For Ca2+ and Mg2+, there was a less obvious pattern, but FG3 showed a broader distribution than the other groups (Figure 2). These findings impact the levels to be expected for different biochemical analytes, as will be discussed later. For potassium, 110 of 146 samples with values below the detection limit originated from FG1 and FG2, reflected as a cluster around x=0.5 in Figure 2, potassium and FG1/2.
In the interest in observing any underlying correlations for the different variables, a matrix plot was created, including fish weights (Figure 3), as outlined in Table 2. Weights were transformed to a logarithmic scale (to allow better separation of small and large fish weights), and there were two clusters (on the y-axis) per biochemical variable for the ‘weight’ row representing values for freshwater fish reared in Facility 1 in the lowest cluster and saltwater fish reared in Facility 2 in the upper (Figure 3, fish weights). The positioning of the two clusters on the x-axis showed some variation for the different biochemical analytes: skewed right for sodium, chloride, and osmolality, indicating increased values in saltwater, lesser for the other analytes, and globulin was skewed left (Figure 3). Further, the upper clusters have more variation (wider) for the different monovalent ions plus osmolality and less for the other analytes (Figure 3). From this, the correlation coefficients (heat map) between the different variables were determined (Figure 4). The correlation between fish weight and sodium, chloride, and osmolality was positive in freshwater and negative in saltwater. For divalent ions, there was no apparent difference between the two production systems (Figure 4). Plasma proteins (total, albumin, and globulin) also showed the same pattern in fresh- and saltwater. Sodium and chloride were positively correlated in fresh- and saltwater (r2 = 0.79 and r2 = 0.83, respectively), and both ions correlated positively with osmolality in saltwater [0.97 (Na+) and 0.81 (Cl-)] but not in freshwater (r2 ≈ 0), concordant with the scatterplots (Figure 3).
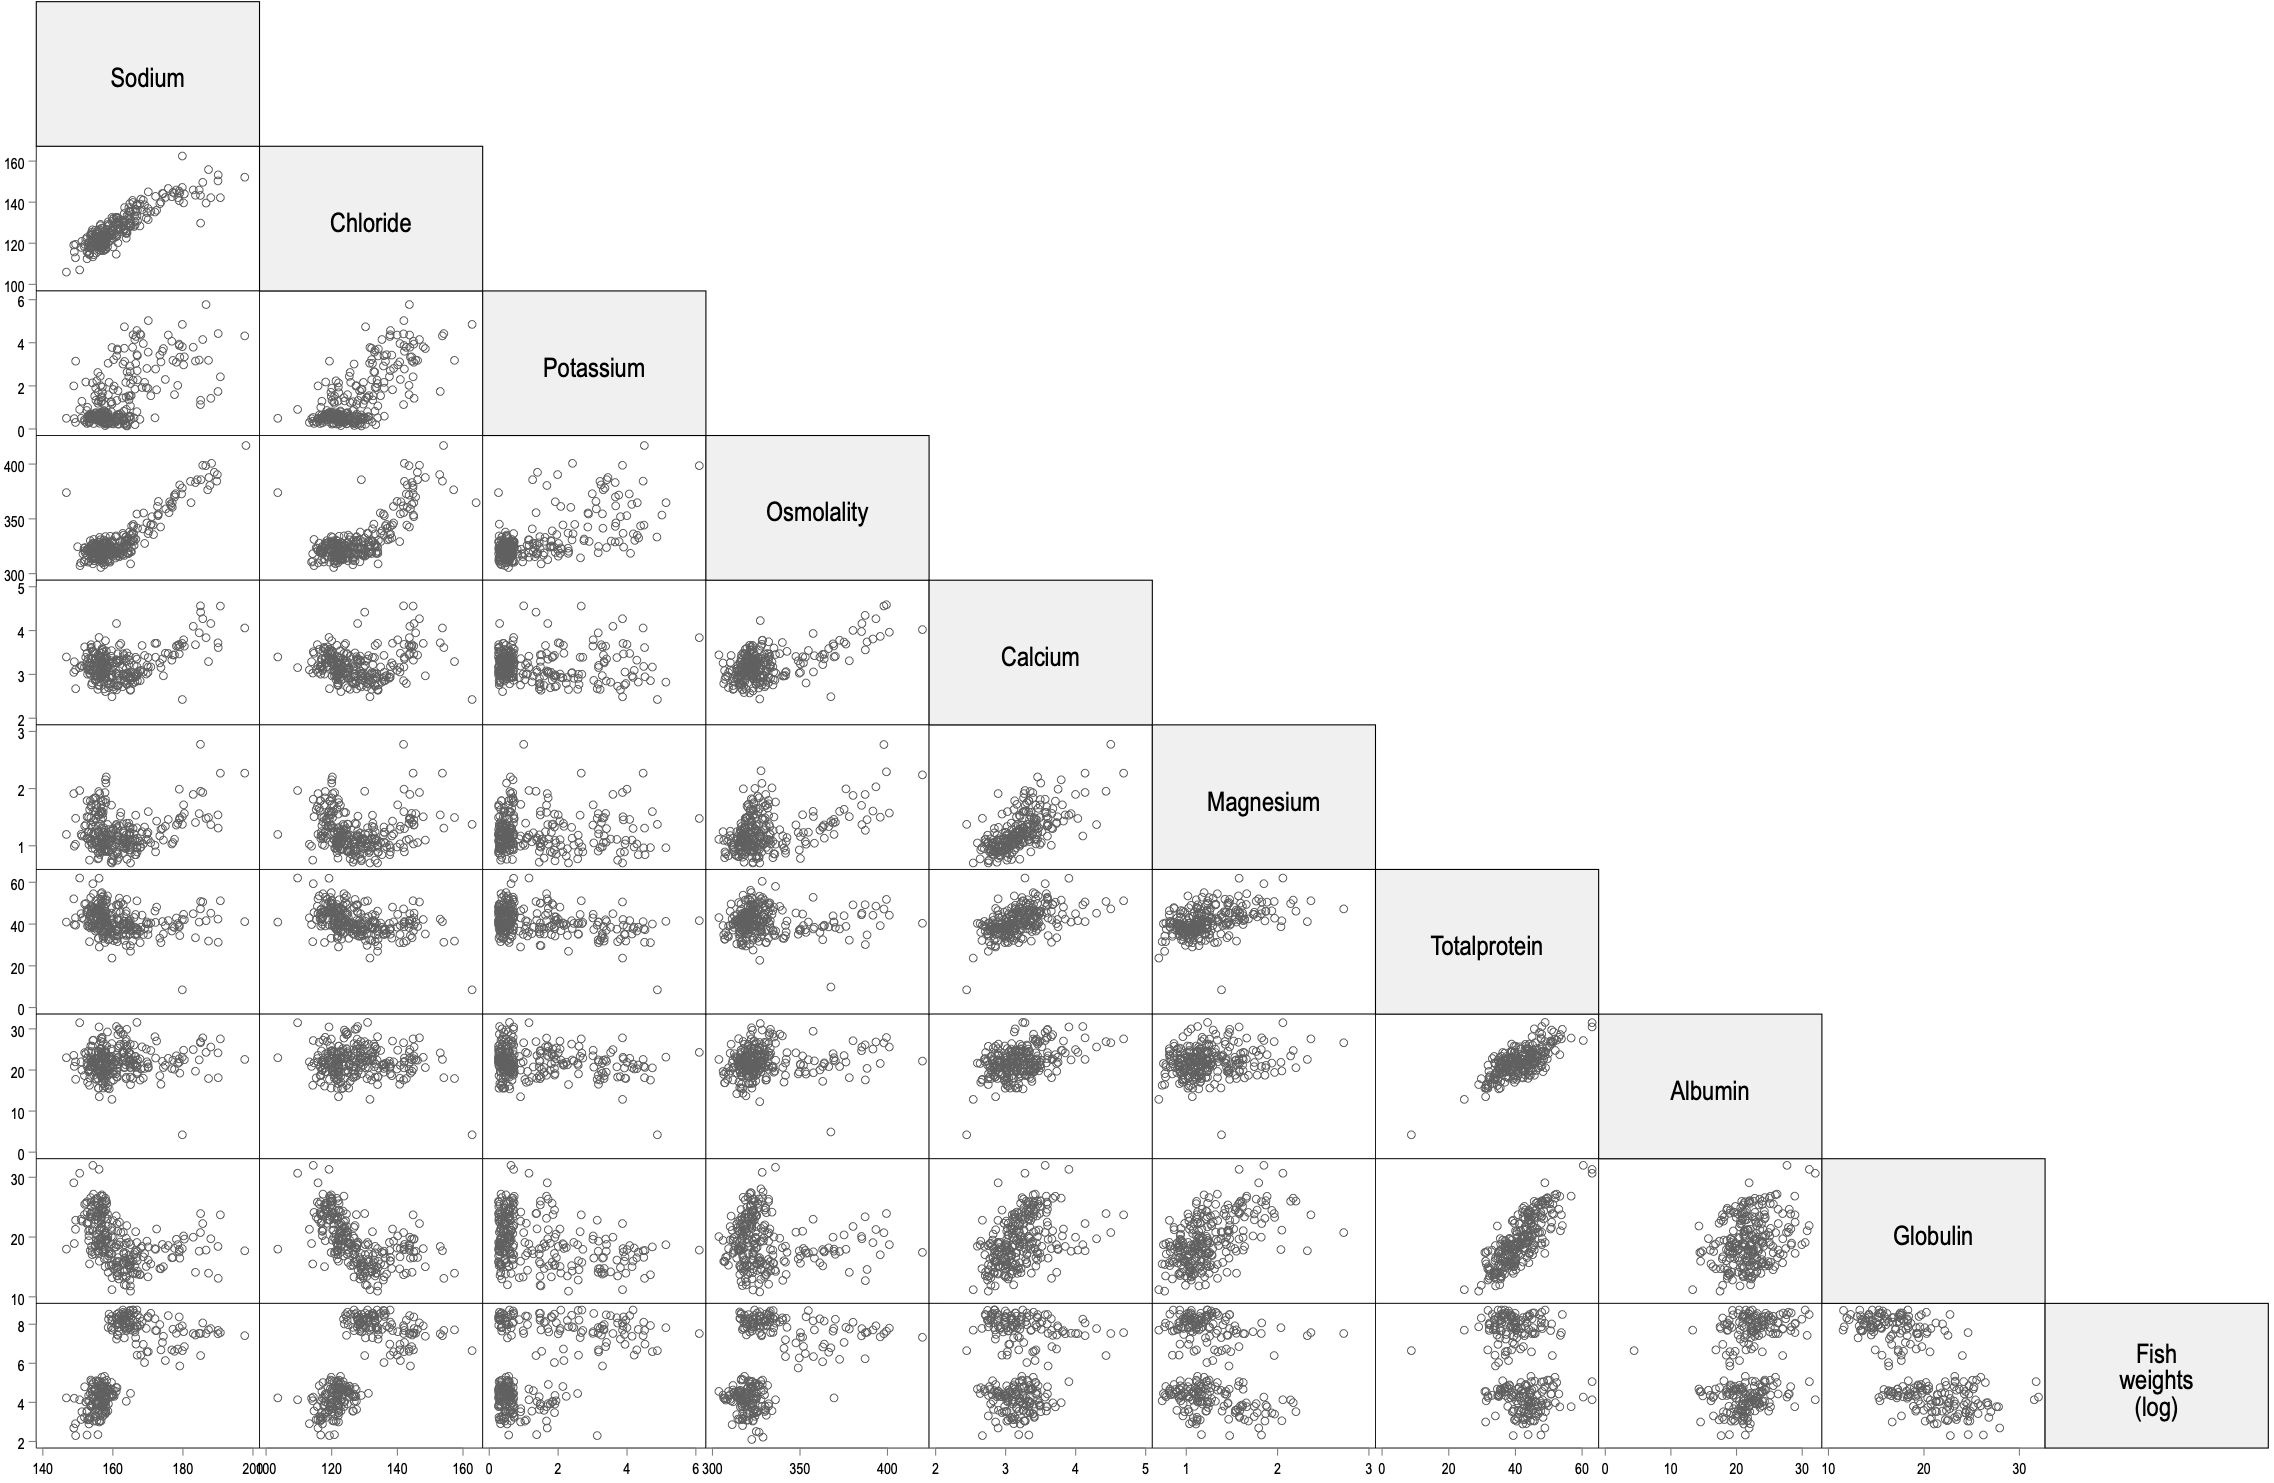
Figure 3. Matrix plot for all variables, with fish weights presented on a logarithmic scale. Lower weight clusters represent the fish collected in freshwater, and upper clusters represent the fish collected in saltwater.
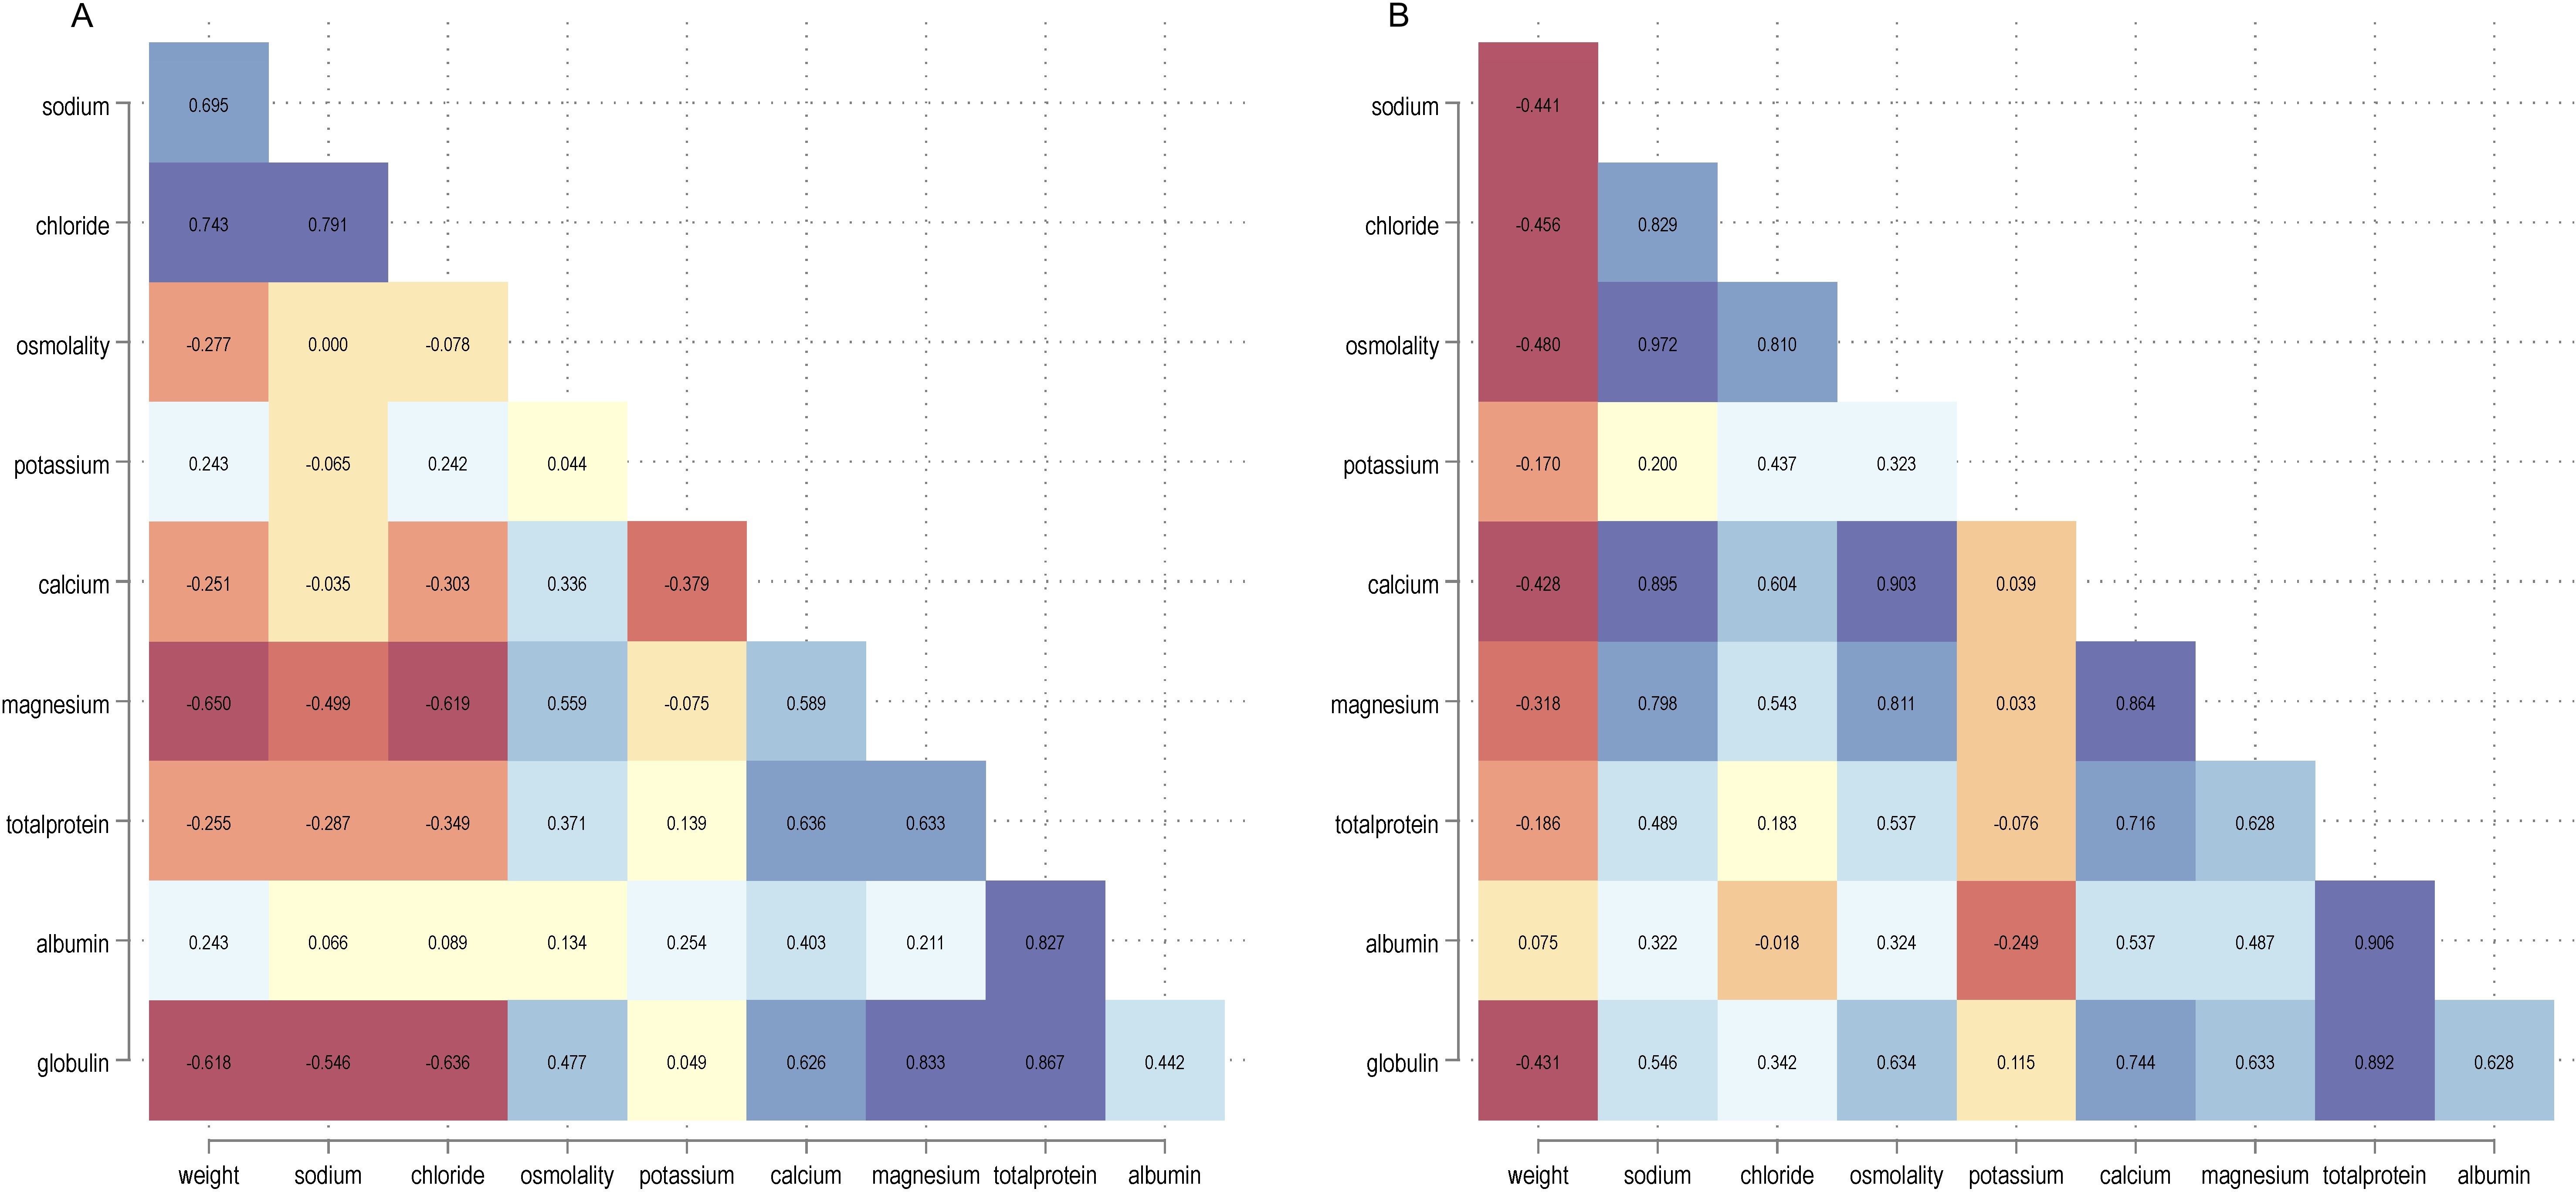
Figure 4. Heat plot for the correlation matrix for the different variables for fish kept in freshwater (A) and saltwater (B). Potassium values included are for those individuals above the detection limit.
The final descriptive analysis included a PCA-biplot that displayed the observations (rows) and the relative positions of the variables (analytes). Marker symbols are shown for the observations, and arrows are displayed for the variables. There was a separation into two groups based on production environment (freshwater or saltwater, Figure 5), with minimal overlap between observations. The two dimensions capture 80% of the variation in the data.
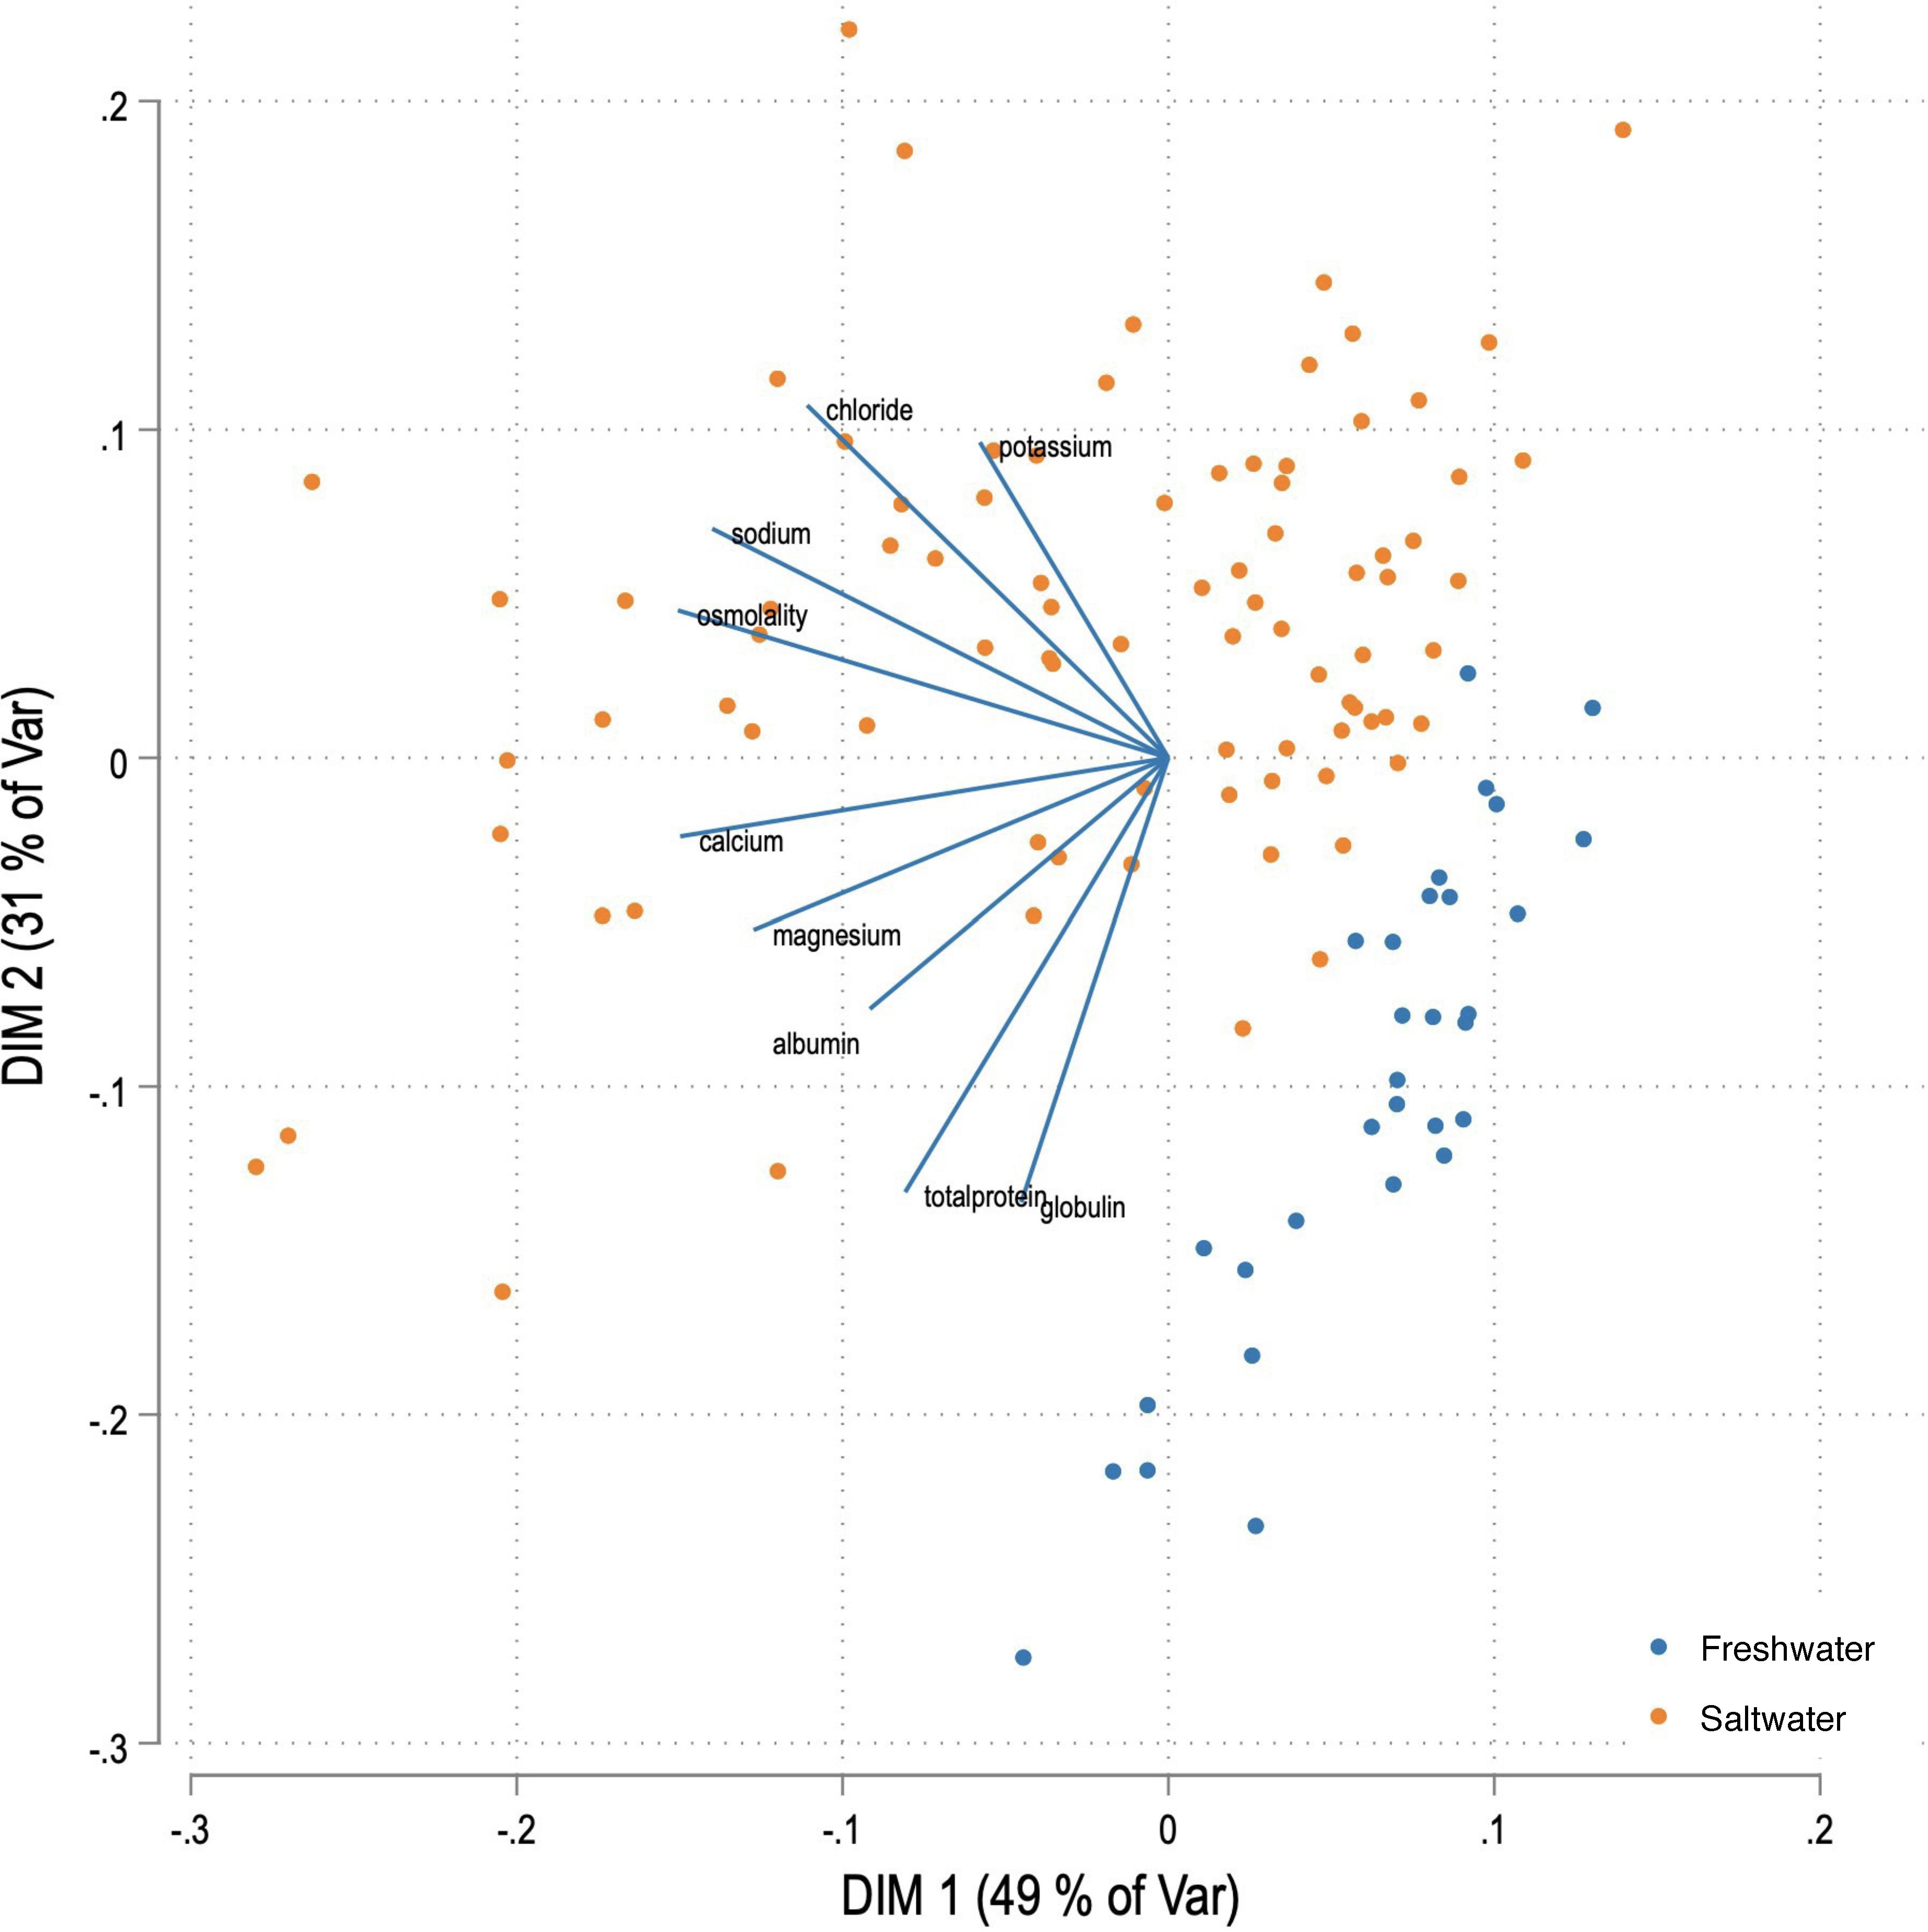
Figure 5. Biplot for serum analytes (as displayed) of fish reared in freshwater and saltwater production environments, showing separation into two distinct groups for the two production environments.
Similarly, an analysis was carried out for fish weights using the same weight intervals as in Table 2, which gave no distinct separation between weight intervals for the larger fish ≥300g (Supplementary Figure S4), but larger fish separate from the smaller fish (<300g). Fish of weight intervals 1000-2500g and 2500-3500g show high dispersion (Supplementary Figure S4).
Based on the initial analyses above, results for plasma proteins were grouped by production environments (Table 4). In addition to mean and median values, 95% reference intervals (RI) and 95% CI for all analytes, were also included, as well as 90% CI for upper and lower 95% CI limits. Results from statistical analysis (non-parametric) for environmental differences were also included (Table 4). Total protein, albumin, and globulin were all significantly different between freshwater and saltwater (Table 4), and interestingly, total protein and globulin was higher in freshwater reared fish than saltwater reared fish, while albumin was lower in freshwater reared fish.
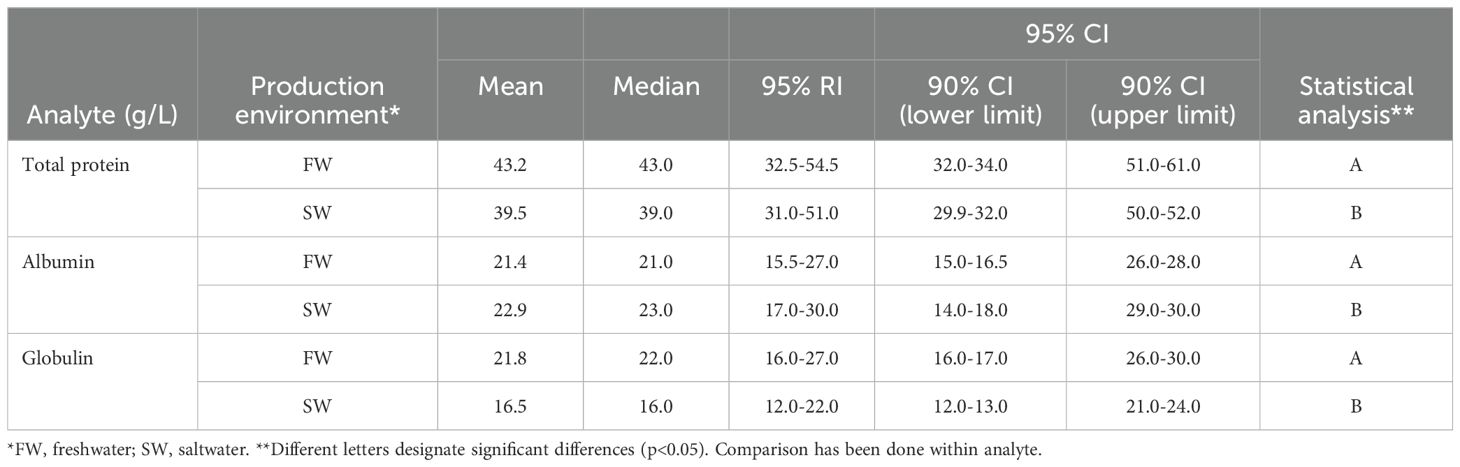
Table 4. Mean and median of total protein, globulin, and albumin of fish by production environment, with 95% reference intervals (RIs) and 90% CIs for the upper and lower 95% CI limits.
Results for plasma ions, sodium, chloride, and potassium and osmolality (Table 5), and reference intervals were different for freshwater and saltwater, and were most similar in the case of potassium. Osmolality of fish had a higher mean and median in saltwater than in freshwater, and also a wider reference interval. Values for calcium and magnesium were calculated and presented as for the other components (Table 6), with no differences found for values obtained in different environments.
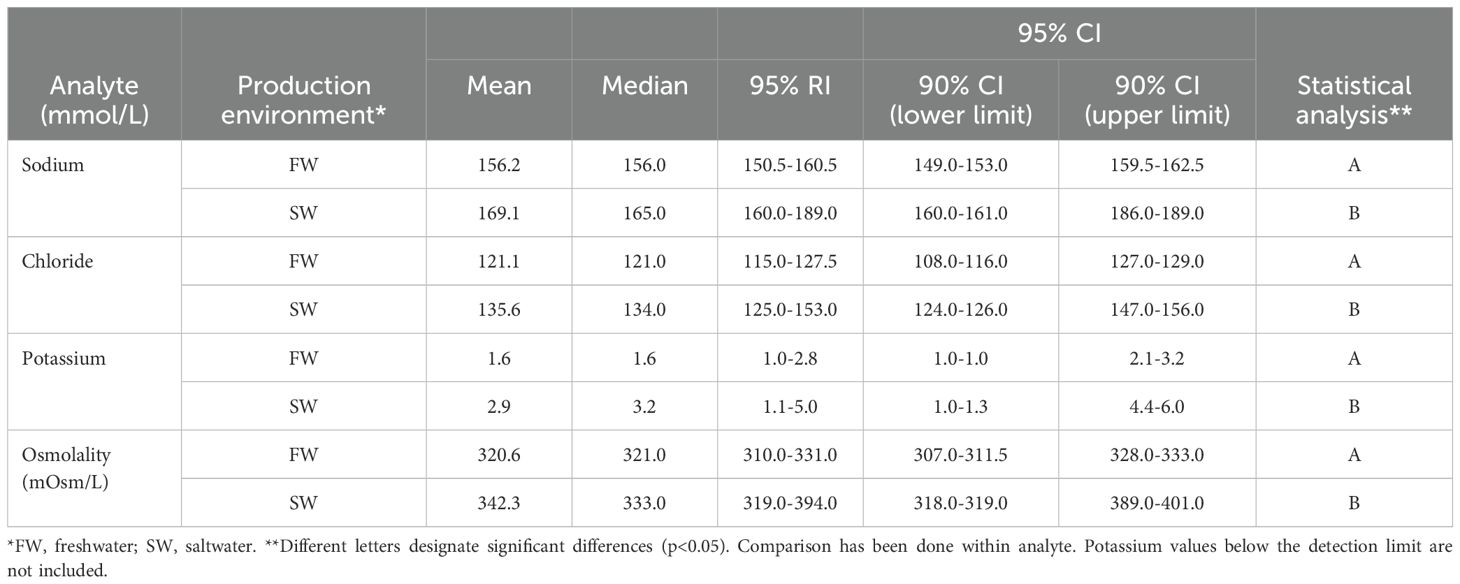
Table 5. Mean and median values for sodium, chloride, potassium, and osmolality by production environment, with 95% reference intervals (RIs) and 90% CIs for the upper and lower 95% CI limits.
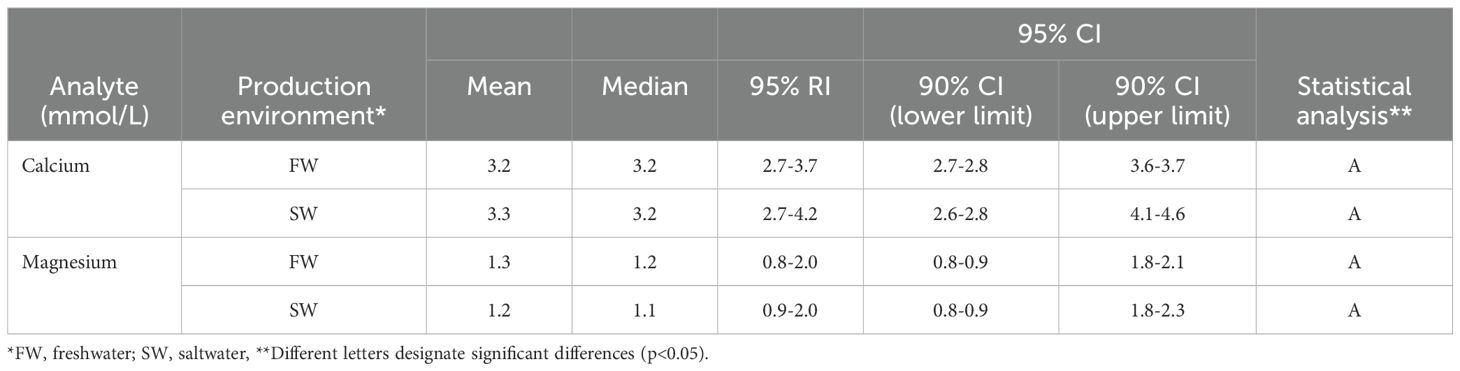
Table 6. Mean and median values for calcium and magnesium by production environment, with 95% reference intervals (RIs) and 90% CIs for the upper and lower 95% CI limits.
Water parameters were generally within recommended limits during the study period for both RAS systems, except for a small supersaturation (N2/TGP) in both facilities, with a median of 103%. The number of N2/TGP measurements was low compared to the other parameters, reflecting an ad hoc sampling approach for this parameter. The maximum levels were 105.8% and 103.8% for facilities 1 and 2, respectively (Table 7). Mean salinity for the whole period differs slightly from measurements before sampling due to inmixing of some freshwater occurring naturally at water intake.
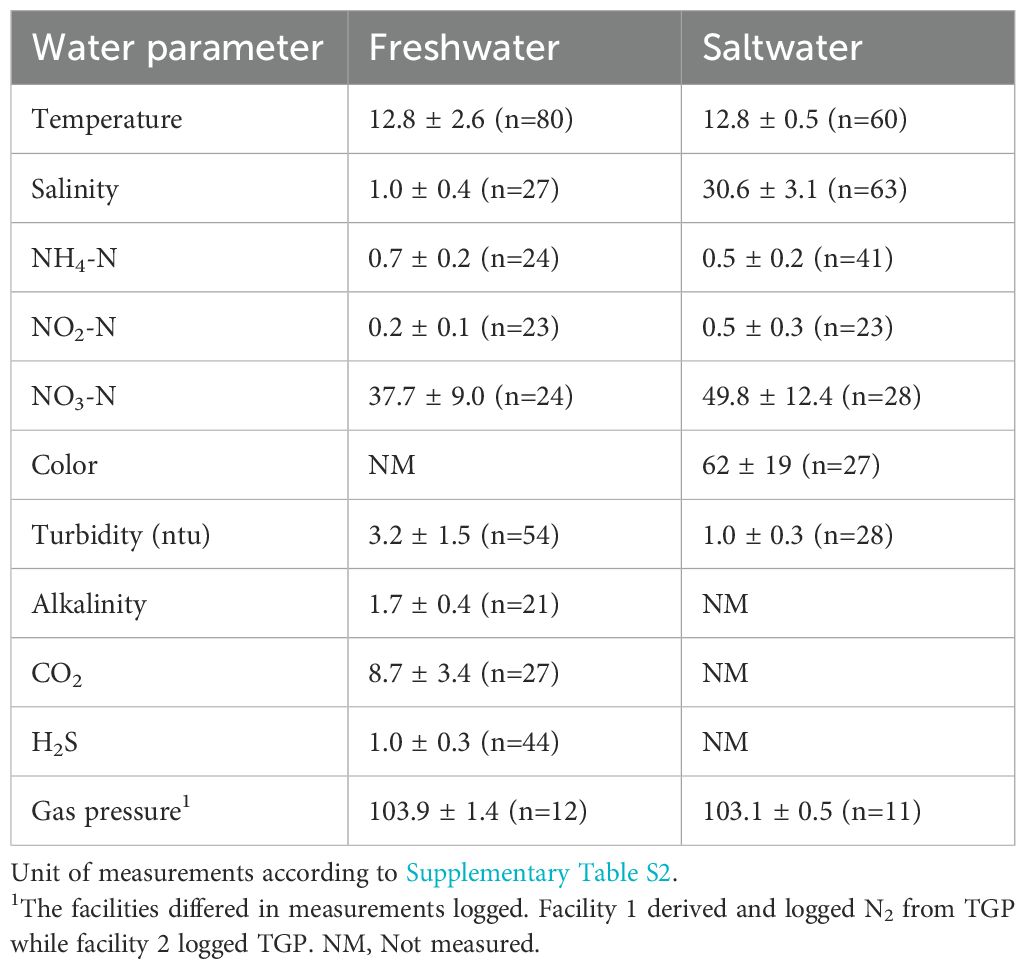
Table 7. Mean measurements 7 days ahead sampling and the sampling time point.
Plasma magnesium was higher in fish exposed to high nitrate levels and correspondingly low at low nitrate levels in freshwater (Figure 6). Alkalinity before sampling was higher for FG1 than FG2, with 1.85 and 1.42 mmol/l respectively. Daily H2S and turbidity data were available for departments 2-4 (Facility 1) and showed that fish in FG2 were exposed to higher H2S levels and more fluctuating turbidity than FG1 (Figure 7), and turbidity levels varied more than H2S. H2S showed a negative correlation with plasma calcium, magnesium, and osmolality. Turbidity was generally low in both freshwater and saltwater environments.
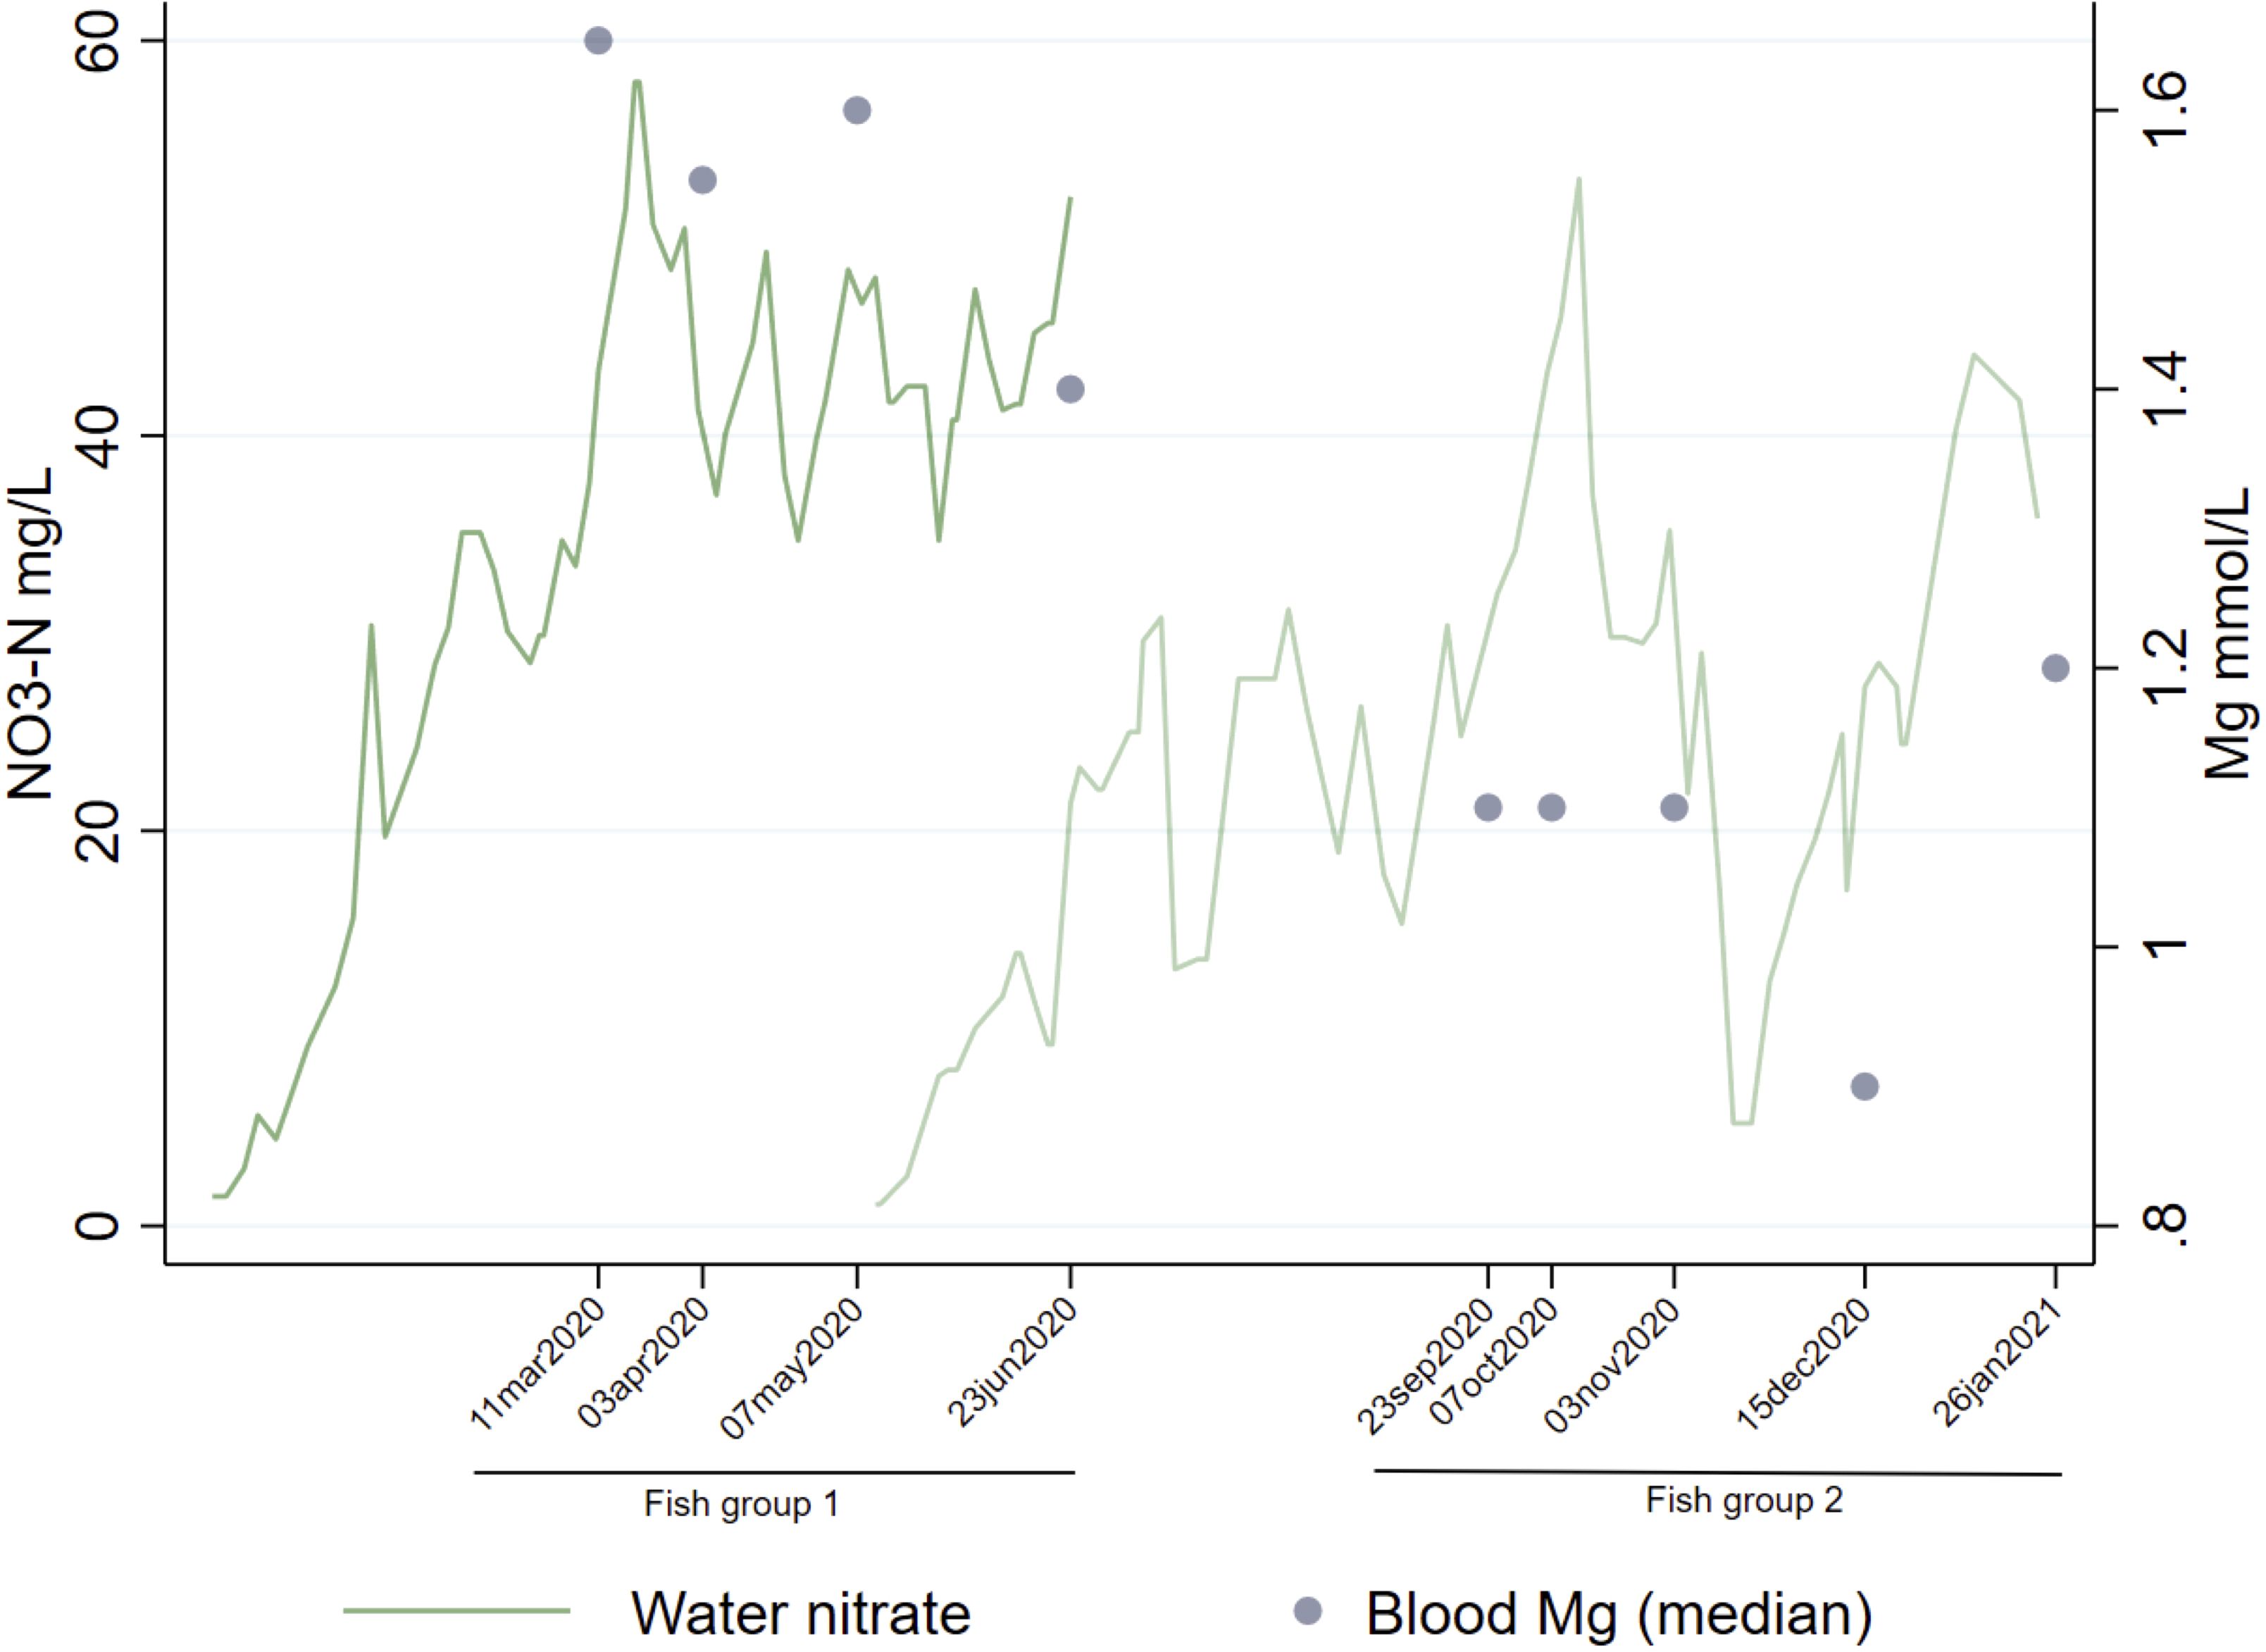
Figure 6. Regular nitrate measurements through the entire production cycle for FG1 and FG2 relative to the sampling time points indicated by median plasma magnesium concentration.
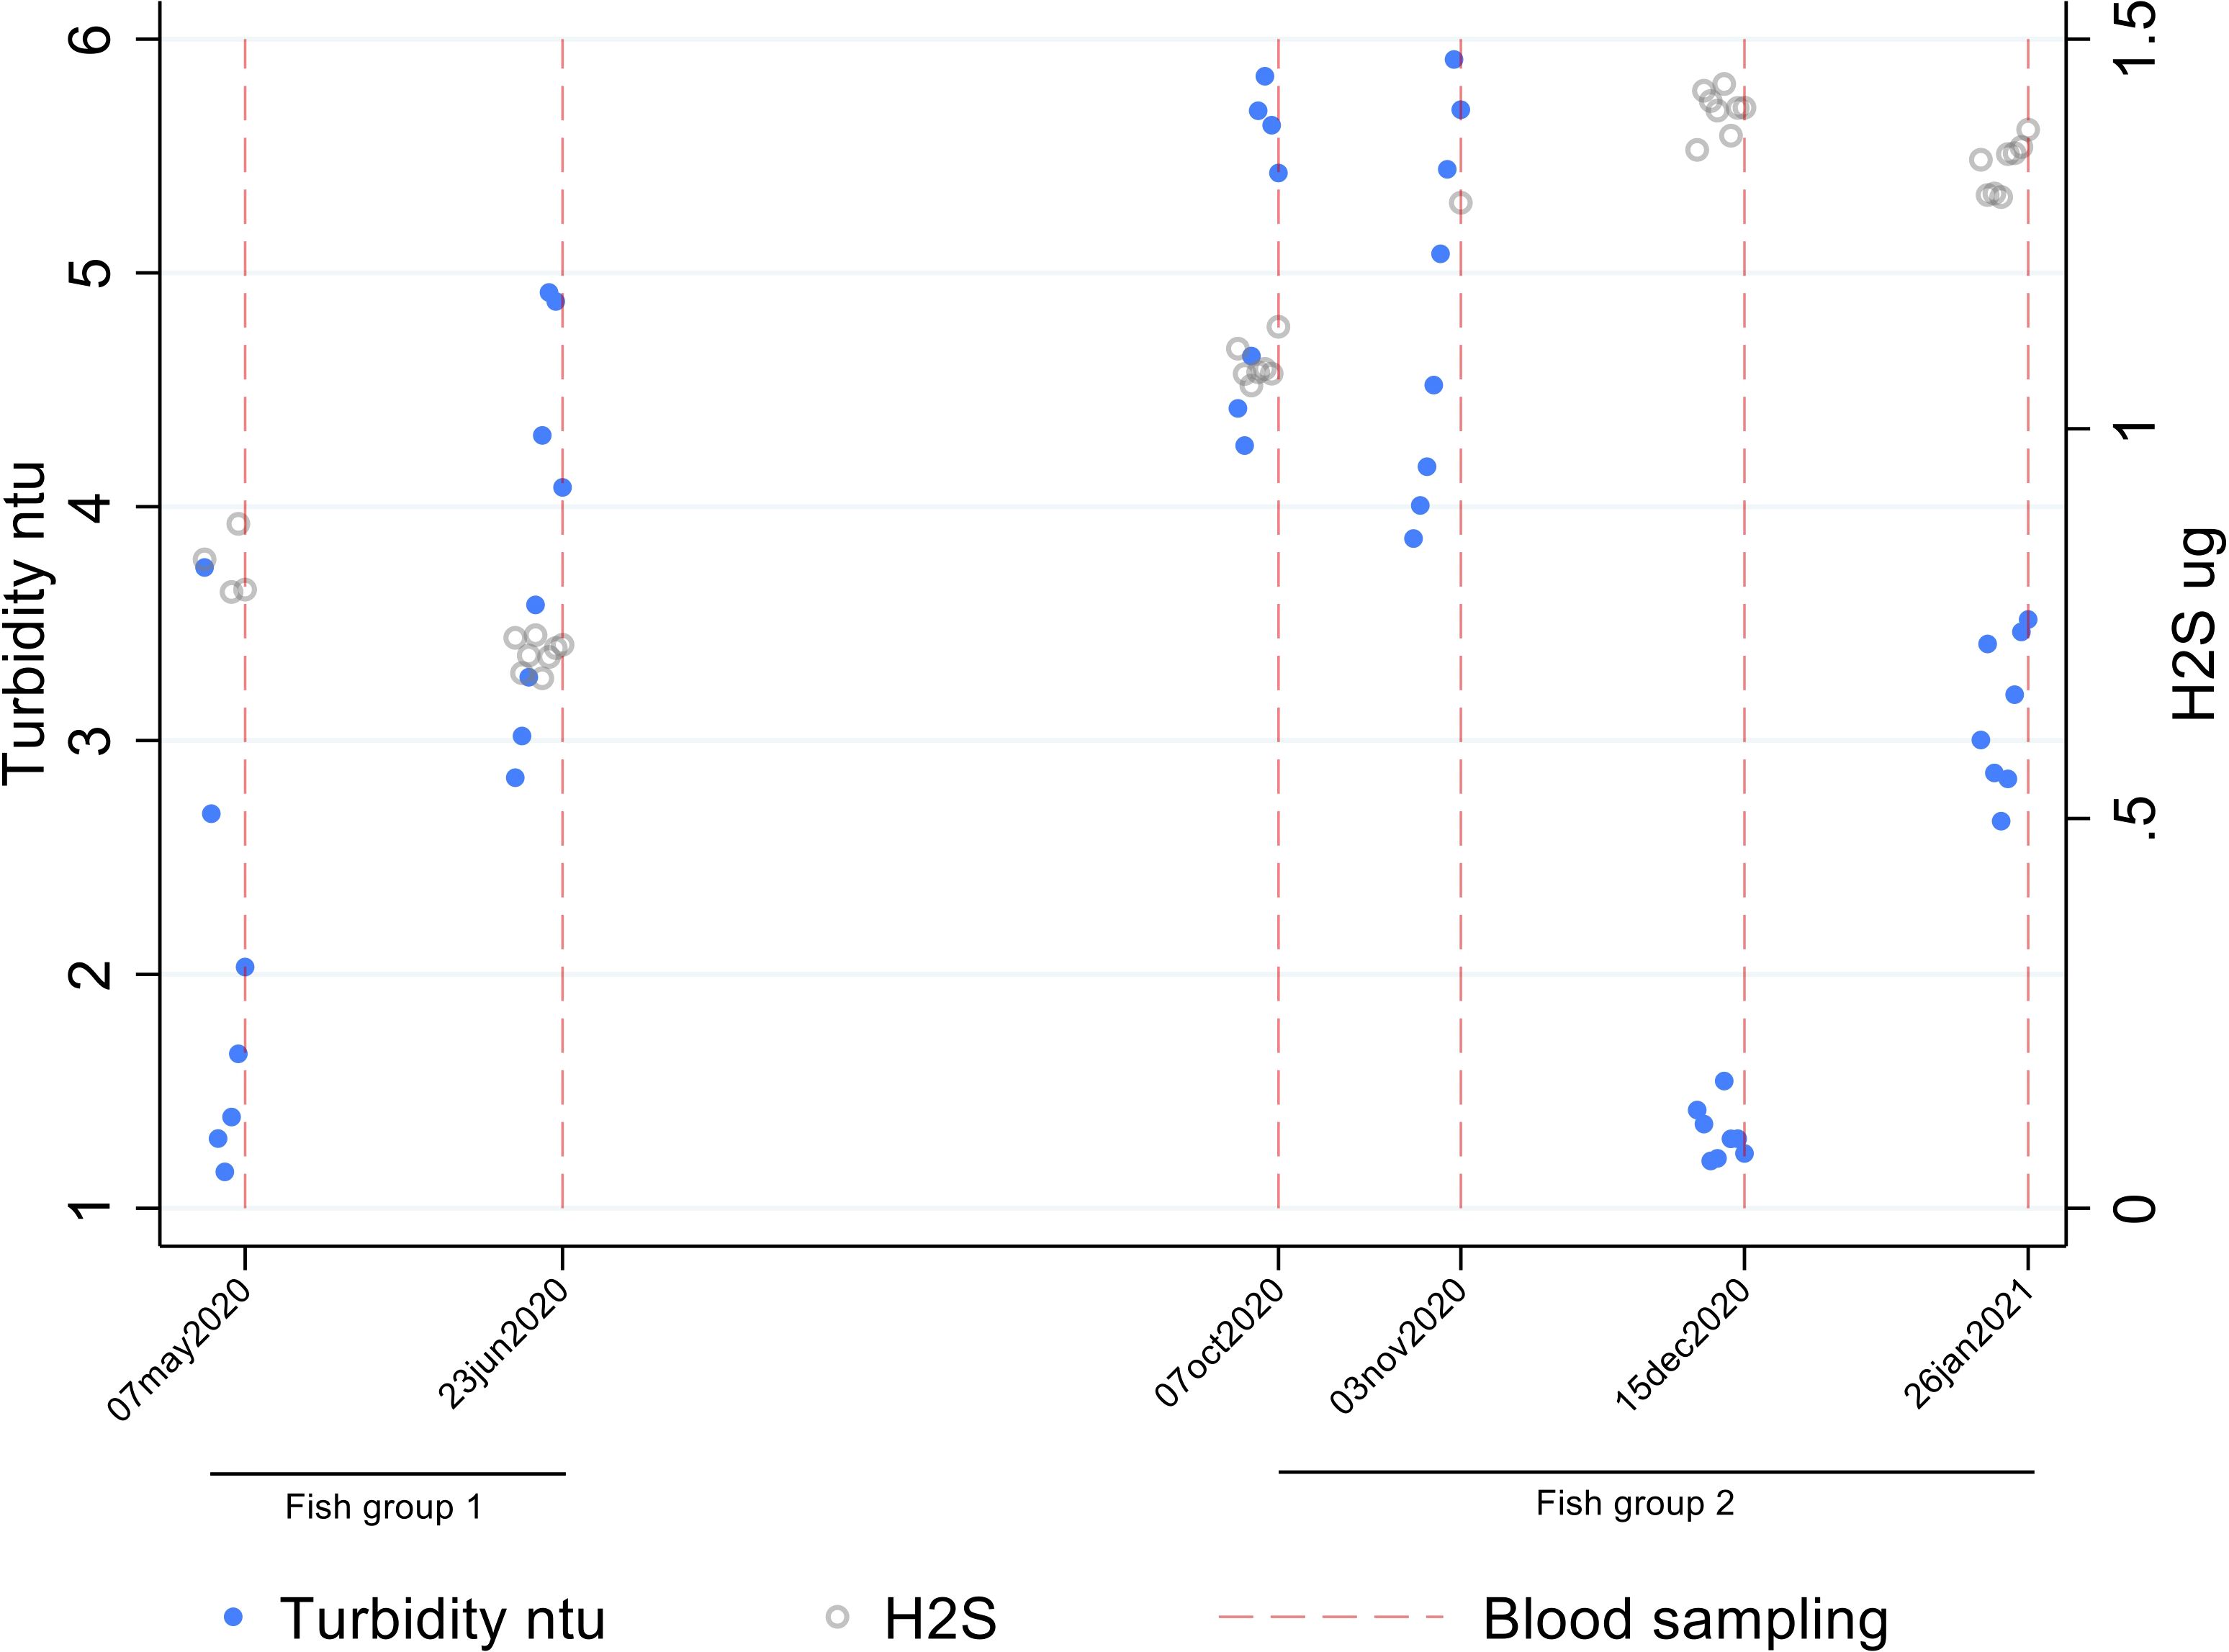
Figure 7. Daily hydrogen sulfide (H2S) and turbidity before and at the sampling time points in departments 3 and 4 in Facility 1.
Saltwater color measurements varied (37-94 CU) before sampling time points. The color and nitrate measurements correlated positively, as did the turbidity- and color measurements (Supplementary Figure S5).
The main conclusion from this study is that selected blood analytes of Atlantic salmon reared under commercial RAS conditions were influenced by the production environment (freshwater vs. saltwater). Further, there was an effect of fish weight, but this effect was variable for the different analytes. Water quality parameters varied with time and system, however, most parameters were within acceptable ranges in both production environments, and no clear impact on variation in biochemical values was found from variations in water quality parameters.
Blood samples were collected from randomly sampled and seemingly healthy fish farmed in commercial aquaculture systems, allowing the reporting of values for examined blood analytes that can be used as reference levels for Atlantic salmon of different life stages under RAS conditions in fresh- and saltwater. Findings support system-specific reference intervals for plasma constituents in Atlantic salmon, as discussed for other fish species (Hrubec et al., 1996), but fish weight also seemed to have some impact. It cannot be concluded with certainty to what extent fish weight affects measured biochemical values since fish weights were not recorded individually for the smaller fish (only at tank level). Weights of larger fish were however recorded, which creates challenges for the statistical assessment of the relative impact of fish weight versus system-specific values, and more detailed studies should be implemented in the future.
Fish in the FG1 group had higher levels of calcium and magnesium across all weight classes than FG2. The levels were below the reference intervals in the study of Rozas-Serri and colleagues (Rozas-Serri et al., 2022) but compared to other studies (Braceland et al., 2017; Fazio et al., 2021), they are similar. Magnesium levels were lower in the present study compared to the latter two publications. Still, calcium and magnesium levels in FG1 were above the reference intervals reported by Klykken and colleagues (Klykken et al., 2022). Calcium plasma levels are influenced by the calcium concentration in water (Campbell, 2012), and a plausible explanation for the group difference is differing alkalinity levels, as calcium hydroxide was used to control alkalinity/pH in Facility 1. Differences in water hardness or stocking density have been proposed as possible causes for differences in plasma calcium in tilapia (Oreochromis hybrid) from the same stock receiving the same feed (Hrubec et al., 2000) with higher levels in high-density reared fish. In this study, the inverse was seen, as FG2 generally was kept at higher stocking densities and had the lowest calcium plasma levels. Additionally, plasma calcium levels correlated poorly with alkalinity in this study, suggesting other influential factors.
As fish sampled and included in this study were considered normal, no necropsy was performed at sampling. However, in FG1, the kidney was inspected before smolt delivery (outside scheduled sampling), and low-grade nephrocalcinosis was present in 1/3 of the fish examined. The relationship between plasma calcium and nephrocalcinosis has been addressed in different studies. There was no association between plasma calcium levels and nephrocalcinosis in tilapia (Chen et al., 2003), while an association was found in Atlantic salmon (Klykken et al., 2022). Further, increased magnesium plasma levels might indicate nephrocalcinosis and renal dysfunction (Campbell, 2012; Klykken et al., 2022). Importantly, elevated calcium levels in plasma do not necessarily reflect the presence of nephrocalcinosis (Klykken et al., 2022). However, the increase in plasma calcium in the FG1 fish is interesting in light of macroscopic nephrocalcinosis scores from FG1 before smolt delivery.
The intracellular concentration of magnesium in erythrocytes is >= 10 times the plasma concentration (Houston, 1985), and hemolysis might introduce artificially high plasma values (Mcdonald and Milligan, 1992; Groff and Zinkl, 1999). Still, this would be less likely since hemolysis was absent in general. Magnesium levels increase due to stress in fish in saltwater (Arends et al., 1999; Iversen et al., 2009) and freshwater (Björnsson et al., 1989), and variation in individual stress levels could contribute to the observed differences between FG1 and FG2. Findings are contradictory between studies, as magnesium levels also have been reported not to change in conjunction with stress in freshwater (Liebert and Schreck, 2006). Furthermore, magnesium has been. reported to increase with time in euthanasia baths (Stewart et al., 2016) and with time from sampling to centrifugation (Braceland et al., 2017). As the same protocol was used for FG1 and FG2, this is less likely to explain the differences in magnesium levels between the groups.
As expected, plasma sodium, chloride, and osmolality were higher in seawater-adapted salmon than in pre-smolt stages, concordant with previous studies (Parry, 1961; Folmar and Dickhoff, 1980; Finstad et al., 1988; Damsgaard et al., 2020; Casanovas et al., 2021). Plasma sodium and chloride increase with weight in freshwater, in conformity with earlier studies describing higher levels in smolt than pre-smolt (Chen et al., 2003) (Houston and Threadgold, 1963). Salt feed was used to stimulate smoltification in Facility 1. In Facility 2, the ion concentrations were decreasing and seem to stabilize at a lower level in larger fish, and variation was reduced as the fish grew. Sodium and chloride are the main blood electrolytes in fish, and combined, these electrolytes constitute >75% of the plasma osmolarity (Mcdonald and Milligan, 1992). Sodium and chloride levels in both production environments were within reported reference intervals for Atlantic salmon (Bergheim et al., 1990; Klykken et al., 2022), and osmolality in the freshwater groups were within ranges for Atlantic salmon (Klykken et al., 2022) and rainbow trout (Wedemeyer and Nelson, 1975). That said, a high proportion of fish in FG3 had chloride levels above 140 mmol/L, the upper range of what would be considered normal for Atlantic salmon in saltwater, also reflected by osmolality values (Bergheim et al., 1990; Arnesen et al., 1998; Urke et al., 2014).
Several factors may have contributed to the observed differences between FG3 and 4 within weight classes 1000-3500 g. The difference in the number of fish sampled could be one such factor. Plasma sodium- and chloride levels are affected by stress (Mcdonald and Milligan, 1992), and different handling methods before sampling, such as crowding or not, may alter the levels, reflecting differences in stress. Increased stocking density is not synonymous with a high stress level (Kjartansson et al., 1988), but stocking density has been associated with increased sodium levels, possibly caused by reduced feed intake and skin lesions (Calabrese et al., 2017). Smoltification in salmonids alters electrolyte levels (Folmar and Dickhoff, 1980), and variation in the time since fish are smoltified could influence groups of fish transferred to the tanks at different time points. Environmental factors cannot be ruled out as contributing even though no noticeable difference in water quality was found between fish groups in the present study. FG4 was the last group to be transferred, and a more stable/conditioned RAS systems could contribute to the lower osmolality seen in this group. Yet another factor could be the genetic makeup of the fish, how long the fish have been in the RAS unit, and water parameters not analyzed for.
Total plasma protein is a collective measure of albumin and globulin fractions in plasma, and the globulin fraction consists of several types of acute-phase proteins and immunoglobulins (Cray et al., 2009). Fish capillaries are highly permeable to proteins, resulting in an isotonic extracellular milieu (Hargens et al., 1974), and set the premises for the relatively large tolerance of plasma protein fluctuations in fish species (Roberts and Ellis, 2012). The albumin levels were relatively similar in both production environments, but contrast findings in Pacific salmon where higher levels were found in freshwater (Casanovas et al., 2021). The levels measured exceeded the upper reference limit reported by Rozas-Serri and colleagues (Rozas-Serri et al., 2022) in both systems but were within ranges described by others (Treasurer and Laidler, 2001) for saltwater. The observed higher plasma globulin levels in salmon raised in freshwater compared to saltwater agree with a previous study (Casanovas et al., 2021), which also applies to total protein. In the present study, there was more variation in plasma protein levels in fish raised in freshwater, and group differences within the smallest fish (20-80g) were observed; that said, levels in the freshwater groups are within the published reference intervals for presmolt while levels in FG3 and FG4 are lower than reported in previous studies (Treasurer and Laidler, 2001; Braceland et al., 2017; Rozas-Serri et al., 2022). Plasma albumin, globulin, and total protein concentrations have been reported to increase in association with increased stocking density in tilapia (Hrubec et al., 2000).
In contrast, high stocking density has also been proposed to result in stress causing decreased globulin levels in salmonids (Liu et al., 2015; Yarahmadi et al., 2016), and reduced immunoglobulin M (IgM) levels have been linked to the immunosuppressive effect of increased blood cortisol levels (Nagae et al., 1994) in stocking density studies (Iguchi et al., 2003; Liu et al., 2015). RAS productions operate at high stocking density (Li et al., 2023), which might play a role in the present study. At the same time, RAS provides a more stable and protected culture environment. As an analog to the tendency of higher Ig levels in wild-caught fish (Olesen and Jørgensen, 1986; Klesius, 1990; Mcdonald and Milligan, 1992), the lower globulin fractions reported for fish in saltwater in the present study may also indicate less immune system “triggering” from the water environment in RAS compared to traditional seawater pens. Hosfeld and colleagues (Hosfeld et al., 2009) found no adverse density effects of 86kg/m3 on Atlantic salmon parr when maintaining good water quality, but globulins were not measured in the referred study. Since immunoglobulins constitute only a fraction of the globulins and there is interindividual variation in the distribution of the different fractions (Manera and Britti, 2008), fraction-specific investigations are warranted for future research (Řehulka and Minařik, 2007).
Although plasma electrolytes are generally less influenced by fish weight and sex, diet, and season than hematological parameters (Groff and Zinkl, 1999), the sampling technique and -processing are critical for keeping preanalytical factors at a minimum. Sampling techniques on fish have recently been covered (Duman et al., 2019; Lawrence et al., 2020). Sampling of FG3 had to be coordinated with other activities in the unit, making it necessary to withdraw feed for 3-4 days ahead of sampling. In a study by Waagbø and colleagues (Waagbø et al., 2017), no significant effect of 14 days of starvation was seen on osmolarity in Atlantic salmon, and as such in the present study a few days of starvation would not likely have had any impact on plasma sodium and chloride levels.
During sampling, external surfaces of fish were examined for wounds category 3 (Noble et al., 2018) and any observations resulted in omittance of said fish from the study. However, differences in occurrence/degree of skin- and fin deviations, which did not result in fish being omitted from the study, may account for some variation observed in the electrolyte levels (Stien et al., 2013). Approximately half of the blood samples had potassium levels below the analytical range for the instrument used in the study, 75% of which originated from fish raised in freshwater, and most were non-pooled samples. Some published reference intervals for potassium include values < 1 mmol/L for salmonids (Braceland et al., 2017; Rozas-Serri et al., 2022), whereas others do not (Casanovas et al., 2021; Klykken et al., 2022). The values below range in this study could represent actual values limited by instrumental analytical range, or they may be artificially low due to preanalytical factors. Only a tiny fraction of total potassium is found extracellularly (Eddy, 1985), and time from sampling to centrifugation and storage temperature are known to influence potassium measurements, with an initial decrease followed by an increase in plasma levels (Soivio et al., 1975; Korcock et al., 1988; Groff and Zinkl, 1999; Braceland et al., 2017). It cannot be ruled out that a share of the below-range values in the present study is related to a delay of centrifugation combined with suboptimal storage temperature, and a mean value < 1 mmol/L for the shared-sampling time point in saltwater may indicate this. The centrifugation was done consecutively after drawing blood for the first three sampling time points for FG3. These samples had no below-range potassium values compared to sampling points with delayed time to centrifugation. Thus, time is a critical factor for analysis and interpretation. Low potassium concentrations in blood samples collected from the field for flounder (Pseudopleuronectes americanus) have earlier been attributed to a storage time of 2-3 hours (Fletcher, 1975). In field scenarios where delays between sampling and centrifugation are more common, cooling the samples could be a preventive measure against preanalytical bias (Korcock et al., 1988).
Evaluating the impact of environmental conditions on blood analytes involved determining the median levels of various parameters from water samples. This approach was driven by the logic that perturbations in water quality would have a delayed effect on the fish kept under these conditions. This approach found a positive correlation between ammonia, nitrite, nitrate, alkalinity levels, and globulin and magnesium plasma levels in freshwater. No harmful effects of nitrate have been seen on Atlantic salmon post-smolt raised in freshwater with nitrate levels up to 100 mg/L (Davidson et al., 2017; Good et al., 2017). Still, it is necessary to evaluate the long-term effects of nitrate and how it influences the different life stages of Atlantic salmon (Freitag et al., 2015). Overall, in the present study turbidity was low, and turbidity did not influence the blood analytes studied. However, it was determined in the present study that turbidity and color correlated partly over the observation period in Facility 2, which indicated interference of color compounds on turbidity measurements. The correlation between color and nitrate indicates nitrate is a possible contributor to color (Hirayama et al., 1988).
To assess the variability in selected blood analytes over time in a typical aquaculture production setting, in the present study four fish groups were monitored throughout a production cycle at two RAS facilities with distinct differences in fish weight and production environments. Generally, analyte levels aligned with reference intervals reported from other production systems. However, observed differences between and within the farms among healthy salmon, and with water quality within recommended levels, suggest that normal ranges and distributions vary between systems, and fish size should also be considered. This underscores the need for future research into system/environment-specific reference intervals, and a better understanding as to how fish size/weight impact clinical chemical parameters.
Multiple fish groups should be included to establish such intervals, and various influential factors must be considered. Factors that encompass water quality, management practices, fish strain/batch (i.e., stress tolerance), and the physiological status of the fish need to be considered and are factors that can influence obtained reference intervals. A threshold for acceptable prevalence and degree of exterior deviations should be defined. Reference values should then be compared to analyte levels in fish with known diseases to assess the diagnostic value of blood sampling.
The raw data supporting the conclusions of this article will be made available by the authors, without undue reservation.
Ethical approval was not required for the studies involving animals in accordance with the local legislation and institutional requirements because Ethical approval from the Food Inspection Agency is not required for sampling of material from fish held under normal or standard production environment. Written informed consent was obtained from the owners for the participation of their animals in this study.
TA: Data curation, Formal analysis, Investigation, Methodology, Resources, Visualization, Writing – original draft, Writing – review & editing. DP: Formal analysis, Resources, Writing – review & editing. SN: Data curation, Formal analysis, Investigation, Writing – review & editing. AØ: Funding acquisition, Methodology, Writing – review & editing. MS: Data curation, Investigation, Project administration, Resources, Writing – review & editing. ØE: Conceptualization, Data curation, Formal analysis, Funding acquisition, Project administration, Supervision, Visualization, Writing – review & editing.
The author(s) declare financial support was received for the research, authorship, and/or publication of this article. The Research Council of Norway funded this study, project no. 298906, to Åkerblå.
The assistance from Barbo Klakegg DVM during the planning and the administrative support is appreciated.
TA and AØ are employed with Åkerblå AS, and the company provides scientific support to one of the facilities from which the samples have been collected. ØE is the supervising veterinarian at one of the facilities from which the samples have been collected. The remaining authors declare that the research was conducted in the absence of any commercial or financial relationships that could be construed as a potential conflict of interest.
The author(s) declared that they were an editorial board member of Frontiers, at the time of submission. This had no impact on the peer review process and the final decision.
All claims expressed in this article are solely those of the authors and do not necessarily represent those of their affiliated organizations, or those of the publisher, the editors and the reviewers. Any product that may be evaluated in this article, or claim that may be made by its manufacturer, is not guaranteed or endorsed by the publisher.
The Supplementary Material for this article can be found online at: https://www.frontiersin.org/articles/10.3389/faquc.2025.1479875/full#supplementary-material
Supplementary Figure 1 | Weight distribution with 25/75 quartile (box), mean, and upper/lower quartile ± 1.5*iqr (spikes) for FG1-4. Fish in FG1 and FG2 are not individually weighed; the other groups are. The Y-axis is presented on a logarithmic scale to display all groups in one graph better. Outliers are noted in each group. FG1 and 2 are held in freshwater, and FG3 and 4 in saltwater.
Supplementary Figure 2 | Kernel density plots for all analytes per fish group (FG1-4). Kernel plots for potassium were prepared for values >0.5 mmol/L.
Supplementary Figure 3 | qnorm plots for the different biochemical analytes where the quantiles of the variables are plotted against the quantiles of the normal distribution.
Supplementary Figure 4 | Biplot for serum analytes (as displayed) for different fish groups, showing a distinct separation between groups.
Supplementary Figure 5 | Turbidity, nitrate, and color measurements over time in saltwater relative to blood sampling time points in FG3 and FG4.
Arends R. J., Mancera J. M., Muñoz J. L., Bonga S. E. W., Flik G. (1999). The stress response of the gilthead sea bream (Sparus aurata L.) to air exposure and confinement. J. Endocrinol. 163, 149–157. doi: 10.1677/joe.0.1630149
Arnesen A. M., Johnsen H. K., Mortensen A., Jobling M. (1998). Acclimation of Atlantic salmon (Salmo salar L.) smolts to ‘cold’ sea water following direct transfer from fresh water. Aquaculture 168, 351–367. doi: 10.1016/S0044-8486(98)00361-5
Barham W. T., Smit G. L., Schoonbee H. J. (1980). The haematological assessment of bacterial infection in rainbow trout, Salmo gairdneri Richardson. J. Fish Biol. 17, 275–281. doi: 10.1111/j.1095-8649.1980.tb02761.x
Bergheim A., Kroglund F., Vatne D. F., Rosseland B. O. (1990). Blood Plasma Parameters in Farmed Atlantic Salmon (Salmo salar L.) Transferred to Sea Cages at Age Eight to Ten Months. Aquaculture 84, 159–165. doi: 10.1016/0044-8486(90)90345-N
Björnsson B. T., Young G., Lin R. J., Deftos L. J., Bern H. A. (1989). Smoltification and seawater adaptation in coho salmon (Oncorhynchus kisutch): plasma calcium regulation, osmoregulation, and calcitonin. Gen. Comp. Endocrinol. 74, 346–354. doi: 10.1016/S0016-6480(89)80030-9
Bonga S. E. W., Lock R. (1992). Toxicants and osmoregulation in fish. Netherlands J. Zool. 42, 478–493.
Braceland M., Houston K., Ashby A., Matthews C., Haining H., Rodger H., et al. (2017). Technical pre-analytical effects on the clinical biochemistry of Atlantic salmon (Salmo salar L.). J. Fish Dis. 40, 29–40. doi: 10.1111/jfd.12476
Byrne P., Ferguson H. W., Lumsden J. S., Ostland V. E. (1991). Blood chemistry of bacterial gill disease in brook trout Salvelinus fontinalis. Dis. Aquat. Organ. 10, 1–6. doi: 10.3354/dao010001
Calabrese S., Nilsen T. O., Kolarevic J., Ebbesson L. O. E., Pedrosa C., Fivelstad S., et al. (2017). Stocking density limits for post-smolt Atlantic salmon (Salmo salar L.) with emphasis on production performance and welfare. Aquaculture 468, 363–370. doi: 10.1016/j.aquaculture.2016.10.041
Campbell T. W. (2012). “Clinical Chemistry of Fish and Amphibians,” in Veterinary Hematology and Clinical Chemistry, 2nd ed, vol. 607-614 . Eds. Thrall M. A., Weiser G., Allison R. W., Campbell T. W. (San Diego, California: John Wiley & Sons, Inc).
Casanovas P., Walker S. P., Johnston H., Johnston C., Symonds J. E. (2021). Comparative assessment of blood biochemistry and haematology normal ranges between Chinook salmon (Oncorhynchus tshawytscha) from seawater and freshwater farms. Aquaculture 537. doi: 10.1016/j.aquaculture.2021.736464
Chen C., Wooster G. A., Getchell R. G., Bowser P. R., Timmons M. B. (2003). Blood chemistry of healthy, nephrocalcinosis-affected and ozone-treated tilapia in a recirculation system, with application of discriminant analysis. Aquaculture 218, 89–102. doi: 10.1016/S0044-8486(02)00499-4
Chen S., Timmons M. B., Aneshansley D. J., Bisogni J. J. Jr (1993). Suspended solids characteristics from recirculating aquacultural systems and design implications. Aquaculture 112, 143–155. doi: 10.1016/0044-8486(93)90440-A
Cray C., Zaias J., Altman N. H. (2009). Acute phase response in animals: A review. Comp. Med. 59, 517–526.
Crouse C., Davidson J., May T., Summerfelt S., Good C. (2021). Production of market-size European strain Atlantic salmon (Salmo salar) in land-based freshwater closed containment aquaculture systems. Aquacult. Eng. 92. doi: 10.1016/j.aquaeng.2020.102138
Dalsgaard J., Lund I., Thorarinsdottir R., Drengstig A., Arvonen K., Pedersen P. B. (2013). Farming different species in RAS in Nordic countries: Current status and future perspectives. Aquacult. Eng. 53, 2–13. doi: 10.1016/j.aquaeng.2012.11.008
Damsgaard C., Mcgrath M., Wood C. M., Richards J. G., Brauner C. J. (2020). Ion-regulation, acid/base-balance, kidney function, and effects of hypoxia in coho salmon, Oncorhynchus kisutch, after long-term acclimation to different salinities. Aquaculture 528. doi: 10.1016/j.aquaculture.2020.735571
Davidson J., Good C., Williams C., Summerfelt S. T. (2017). Evaluating the chronic effects of nitrate on the health and performance of post-smolt Atlantic salmon Salmo salar in freshwater recirculation aquaculture systems. Aquacult. Eng. 79, 1–8. doi: 10.1016/j.aquaeng.2017.08.003
Davidson J., May T., Good C., Waldrop T., Kenney B., Terjesen B. F., et al. (2016). Production of market-size North American strain Atlantic salmon Salmo salar in a land-based recirculation aquaculture system using freshwater. Aquacult. Eng. 74, 1–16. doi: 10.1016/j.aquaeng.2016.04.007
Duman M., Saticioglu I. B., Suzer B., Altun S. (2019). Practices for drawing blood samples from teleost fish. North Am. J. Aquacult. 81, 119–125. doi: 10.1002/naaq.10077
Eddy F. B. (1985). Uptake and loss of potassium by rainbow trout (Salmo gairdneri) in fresh water and dilute sea water. J. Exp. Biol. 118, 277–286. doi: 10.1242/jeb.118.1.277
Esposito G., Bergagna S., Colussi S., Shahin K., Rosa R., Volpatti D., et al. (2024). Changes in blood serum parameters in farmed rainbow trout (Oncorhynchus mykiss) during a piscine lactococcosis outbreak. J. Fish Dis. 47, e13994. doi: 10.1111/jfd.13994
Fazio F., Saoca C., Capillo G., Iaria C., Panzera M., Piccione G., et al. (2021). Intra-variability of some biochemical parameters and serum electrolytes in rainbow trout (Walbaum 1792) bred using a flow-through system. Heliyon 7. doi: 10.1016/j.heliyon.2021.e06361
Fazio F., Saoca C., Casella S., Fortino G., Piccione G. (2015). Relationship between blood parameters and biometric indices of Sparus aurata and Dicentrarcus labrax cultured in onshore tanks. Mar. Freshw. Behav. Physiol. 48, 289–296. doi: 10.1080/10236244.2015.1041239
Finstad B., Staurnes M., Reite O. B. (1988). Effect of low temperature on sea-water tolerance in rainbow trout, salmo gairdneri. Aquaculture 72, 319–328. doi: 10.1016/0044-8486(88)90220-7
Fletcher G. L. (1975). The effects of capture, “stress,” and storage of whole blood on the red blood cells, plasma proteins, glucose, and electrolytes of the winter flounder (Pseudopleuronectes americanus). Can. J. Zool. 53, 197–206. doi: 10.1139/z75-024
Folmar L. C. (1993). Effects of chemical contaminants on blood chemistry of teleost Fish: A bibliography and synopsis of selected effects. Environ. Toxicol. Chem. 12, 337–375. doi: 10.1002/etc.5620120216
Folmar L. C., Dickhoff W. W. (1980). The parr-Smolt transformation (smoltification) and seawater adaptation in salmonids: A review of selected literature. Aquaculture 21, 1–37. doi: 10.1016/0044-8486(80)90123-4
Förlin L., Haux C., Andersson T., Olsson P., Larsson Å. (1986). “Physiological Methods in Fish Toxicology: Laboratory and Field Studies,” in Fish Physiology: Recent Advances. Eds. Nilsson S., Holmgren S. (Springer, Dordrecht), 158–169.
Freitag A. R., Thayer L. R., Leonetti C., Stapleton H. M., Hamlin H. J. (2015). Effects of elevated nitrate on endocrine function in Atlantic salmon, Salmo salar. Aquaculture 436, 8–12. doi: 10.1016/j.aquaculture.2014.10.041
Friedrichs K. R., Harr K. E., Freeman K. P., Szladovits B., Walton R. M., Barnhart K. F., et al. (2012). ASVCP reference interval guidelines: determination of de novo reference intervals in veterinary species and other related topics. Vet. Clin. Pathol. 41, 441–453. doi: 10.1111/vcp.12006
Good C., Davidson J., Iwanowicz L., Meyer M., Dietze J., Kolpin D. W., et al. (2017). Investigating the influence of nitrate nitrogen on post-smolt Atlantic salmon Salmo salar reproductive physiology in freshwater recirculation aquaculture systems. Aquacult. Eng. 78, 2–8. doi: 10.1016/j.aquaeng.2016.09.003
Groff J. M., Zinkl J. G. (1999). Hematology and clinical chemistry of cyprinid fish: common carp and goldfish. Vet. Clinics North America: Exotic Anim. Pract. 2, 741–776. doi: 10.1016/S1094-9194(17)30120-2
Harbell S. C., Hodgins H. O., Schiewe M. H. (1979). Studies on the pathogenesis of vibriosis in coho salmon Oncorhynchus kisutch (Walbaum). J. Fish Dis. 2, 391–404. doi: 10.1111/j.1365-2761.1979.tb00391.x
Hargens A. R., Millard R. W., Johansen K. (1974). High capillary permeability in fishes. Comp. Biochem. Physiol. Part A: Physiol. 48, 675–680. doi: 10.1016/0300-9629(74)90610-0
Hirayama K., Mizuma H., Mizue Y. (1988). The accumulation of dissolved organic substances in closed recirculation culture systems. Aquacult. Eng. 7, 73–87. doi: 10.1016/0144-8609(88)90006-4
Hosfeld C. D., Hammer J., Handeland S. O., Fivelstad S., Stefansson S. O. (2009). Effects of fish density on growth and smoltification in intensive production of Atlantic salmon (Salmo salar L.). Aquaculture 294, 236–241. doi: 10.1016/j.aquaculture.2009.06.003
Houston A. H., Threadgold L. T. (1963). Body fluid regulation in smolting Atlantic salmon. J. Fish. Res. Board Canada 20, 1355–1369. doi: 10.1139/f63-093
Hrubec T. C., Cardinale J. L., Smith S. A. (2000). Hematology and plasma chemistry reference intervals for cultured tilapia (Oreochromis hybrid). Vet. Clin. Pathol. 29, 7–12. doi: 10.1111/j.1939-165X.2000.tb00389.x
Hrubec T. C., Smith S. A., Robertson J. L. (2001). Age-Related Changes in Hematology and Plasma Chemistry Values of Hybrid Striped Bass (Morone chrysops × Morone saxatilis). Vet. Clin. Pathol. 30, 8–15. doi: 10.1111/j.1939-165X.2001.tb00249.x
Hrubec T. C., Smith S. A., Robertson J. L., Feldman B., Veit H. P., Libey G., et al. (1996). Blood biochemical reference intervals for sunshine bass (Morone chrysops × Morone saxatilis) in three culture systems. Am. J. Vet. Res. 57, 624–627. doi: 10.2460/ajvr.1996.57.05.624
Hvas M., Karlsbakk E., Mæhle S., Wright D. W., Oppedal F. (2017). The gill parasite Paramoeba Perurans compromises aerobic scope, swimming capacity and ion balance in Atlantic salmon. Conserv. Physiol. 5. doi: 10.1093/conphys/cox066
Iguchi K., Ogawa K., Nagae M., Ito F. (2003). The influence of rearing density on stress response and disease susceptibility of ayu (Plecoglossus altivelis). Aquaculture 220, 515–523. doi: 10.1016/S0044-8486(02)00626-9
Iversen M., Eliassen R. A., Finstad B. (2009). Potential benefit of clove oil sedation on animal welfare during salmon smolt, Salmo salar L. transport and transfer to sea. Aquacult. Res. 40, 233–241. doi: 10.1111/j.1365-2109.2008.02091.x
Kjartansson H., Fivelstad S., Thomassen J. M., Smith M. J. (1988). Effects of different stocking densities on physiological parameters and growth of adult Atlantic salmon (Salmo salar L.) reared in circular tanks. Aquaculture 73, 261–274. doi: 10.1016/0044-8486(88)90060-9
Klesius P. H. (1990). Effect of size and temperature on the quantity of immunoglobulin in channel catfish, ictalurus punctatus. Vet. Immunol. Immunopathol. 24, 187–195. doi: 10.1016/0165-2427(90)90021-J
Klykken C., Reed A. K., Dalum A. S., Olsen R. E., Moe M. K., Attramadal K. J. K., et al. (2022). Physiological changes observed in farmed Atlantic salmon (Salmo salar L.) with nephrocalcinosis. Aquaculture 554. doi: 10.1016/j.aquaculture.2022.738104
Korcock D. E., Houston A. H., Gray J. D. (1988). Effects of sampling conditions on selected blood variables of rainbow trout, Salmo gairdneri Richardson. J. Fish Biol. 33, 319–330. doi: 10.1111/j.1095-8649.1988.tb05474.x
Lawrence M. J., Raby G. D., Teffer A. K., Jeffries K. M., Danylchuk A. J., Eliason E. J., et al. (2020). Best practices for non-lethal blood sampling of fish via the caudal vasculature. J. Fish Biol. 97, 4–15. doi: 10.1111/jfb.14339
Li H., Cui Z., Cui H., Bai Y., Yin Z., Qu K. (2023). Hazardous substances and their removal in recirculating aquaculture systems: A review. Aquaculture 569. doi: 10.1016/j.aquaculture.2023.739399
Liebert A. M., Schreck C. B. (2006). Effects of acute stress on osmoregulation, feed intake, IGF-1, and cortisol in yearling steelhead trout (Oncorhynchus mykiss) during seawater adaptation. Gen. Comp. Endocrinol. 148, 195–202. doi: 10.1016/j.ygcen.2006.03.002
Liu B., Liu Y., Wang X. (2015). The effect of stocking density on growth and seven physiological parameters with assessment of their potential as stress response indicators for the Atlantic salmon (Salmo salar). Mar. Freshw. Behav. Physiol. 48, 177–192. doi: 10.1080/10236244.2015.1034956
MacAulay S., Ellison A. R., Kille P., Cable J. (2022). Moving towards improved surveillance and earlier diagnosis of aquatic pathogens: From traditional methods to emerging technologies. Rev. Aquacult. 14, 1813–1829. doi: 10.1111/raq.12674
Manera M., Britti D. (2008). Assessment of serum protein fractions in rainbow trout using automated electrophoresis and densitometry. Vet. Clin. Pathol. 37, 452–456. doi: 10.1111/j.1939-165X.2008.00070.x
Martins C. I. M., Eding E. H., Verdegem M. C. J., Heinsbroek L. T. N., Schneider O., Blancheton J. P., et al. (2010). New developments in recirculating aquaculture systems in Europe: A perspective on environmental sustainability. Aquacult. Eng. 43, 83–93. doi: 10.1016/j.aquaeng.2010.09.002
Mcdonald D. G., Milligan C. L. (1992). “Chemical Properties of the Blood,” in Fish Physiology. Eds. Hoar W. S., Randall D. J., Farrell A. P. (San Diego, California: Elsevier), 55–133.
McDonald D. G., Robinson J. G. (1993). Physiological responses of lake trout to stress: effects of water hardness and genotype. Trans. Am. Fish. Soc. 122, 1146–1155. doi: 10.1577/1548-8659(1993)122<1146:PROLTT>2.3.CO;2
Nagae M., Fuda H., Ura K., Kawamura H., Adachi S., Hara A., et al. (1994). The effect of cortisol administration on blood plasma immunoglobulin M (IgM) concentrations in masu salmon (Oncorhynchus masou). Fish Physiol. Biochem. 13, 41–48. doi: 10.1007/BF00004118
Noble C., Gismervik K., Iversen M. H., Kolarevic J., Nilsson J., Stien L. H., et al. (Eds.) (2018). Welfare Indicators for farmed Atlantic salmon: tools for assessing fish welfare (San Diego, California: Nofima).
Olesen N. J., Jørgensen P. E. V. (1986). Quantification of serum immunoglobulin in rainbow trout Salmo gairdneri under various environmental conditions. Dis. Aquat. Organ. 1, 183–189. doi: 10.3354/dao001183
Parry G. (1961). Osmotic and ionic changes in blood and muscle of migrating salmonids. J. Exp. Biol. 38, 411–427. doi: 10.1242/jeb.38.2.411
Pastorino P., Bergagna S., Dezzutto D., Barbero R., Righetti M., Pagliasso G., et al. (2020). Long-Term Assessment of Baseline Blood Biochemistry Parameters in Rainbow Trout (Oncorhynchus mykiss) Maintained under Controlled Conditions. Animals 10. doi: 10.3390/ani10091466
Řehulka J. (2003). Haematological analyses in rainbow trout Oncorhynchus mykiss affected by viral haemorrhagic septicaemia (VHS). Dis. Aquat. Organ. 56, 185–193. doi: 10.3354/dao056185
Řehulka J., Minařik B. (2007). Blood parameters in brook trout Salvelinus fontinalis (Mitchill 1815), affected by columnaris disease. Aquacult. Res. 38, 1182–1197. doi: 10.1111/j.1365-2109.2007.01786.x
Roberts R. J., Ellis A. E. (2012). “The Anatomy and Physiology of Teleosts,” in Fish Pathology, 4th ed. Ed. Roberts R. J. (Wiley Blackwell, Chichester, England), 17–61.
Rozas-Serri M., Correa R., Walker-Vergara R., Coñuecar D., Barrientos S., Leiva C., et al. (2022). Reference intervals for blood biomarkers in farmed Atlantic salmon, Coho salmon and rainbow trout in Chile: promoting a preventive approach in aquamedicine. Biology 11. doi: 10.3390/biology11071066
Soivio A., Nyholm K., Huhti M. (1975). Concentrations of K +, Na + and Mg ++ in blood plasma of Salmo gairdneri Richardson inrelation to the increase of haematocrit value in vitro. Annales Zool. Fennici 12, 141–142. Available online at: https://www.jstor.org/stable/23731749
Stewart H. A., Noakes D. L. G., Cogliati K. M., Peterson J. T., Iversen M. H., Schreck C. B. (2016). Salinity effects on plasma ion levels, cortisol, and osmolality in Chinook salmon following lethal sampling. Comp. Biochem. Physiol. Part A 192, 38–43. doi: 10.1016/j.cbpa.2015.11.011
Stien L. H., Bracke M. B. M., Folkedal O., Nilsson J., Oppedal F., Torgersen T., et al. (2013). Salmon Welfare Index Model (SWIM 1.0): a semantic model for overall welfare assessment of caged Atlantic salmon: review of the selected welfare indicators and model presentation. Rev. Aquacult. 5, 33–57. doi: 10.1111/j.1753-5131.2012.01083.x
Timmons M. B., Guerdat T., Vinci B. J. (2018). Recirculating Aquaculture (Ithaca, NY: Ithaca Publishing Company).
Treasurer J., Laidler L. A. (2001). Temporal and spatial variation of plasma biochemistry in farmed Atlantic salmon salmo salar L. and determination of normal ranges. Bull. Eur. Assoc. Fish Pathol. 21, 178–185.
Urke H. A., Arnekleiv J. V., Nilsen T. O., Nilssen K. J. (2014). Development of seawater tolerance and subsequent downstream migration in wild and stocked young-of-the-year derived Atlantic salmon Salmo salar smolts. J. Fish Biol. 84, 178–192. doi: 10.1111/jfb.12276
Waagbø R., Jørgensen S. M., Timmerhaus G., Breck O., Olsvik P. A. (2017). Short-term starvation at low temperature prior to harvest does not impact the health and acute stress response of adult Atlantic salmon. PeerJ 5. doi: 10.7717/peerj.3273
Wedemeyer G. A., Nelson N. C. (1975). Statistical methods for estimating normal blood chemistry ranges and variance in rainbow trout (Salmo gairdneri), shasta strain. J. Fish. Res. Board Canada 32, 551–554. doi: 10.1139/f75-069
Yarahmadi P., Miandare H. K., Fayaz S., Caipang C. M. A. (2016). Increased stocking density causes changes in expression of selected stress- and immune-related genes, humoral innate immune parameters and stress responses of rainbow trout (Oncorhynchus mykiss). Fish Shellf. Immunol. 48, 43–53. doi: 10.1016/j.fsi.2015.11.007
Keywords: Atlantic salmon, clinical chemical blood plasma values, recirculation aquaculture system (RAS), freshwater, seawater, fish size, water quality parameters, biochemistry
Citation: Amlie T, Persson D, Nørstebø SF, Østvik A, Stormoen M and Evensen Ø (2025) System- and fish-size-specific reference intervals for plasma analytes in Atlantic salmon (Salmo salar L.) reared in commercial fresh- and saltwater recirculating aquaculture systems: a descriptive study. Front. Aquac. 4:1479875. doi: 10.3389/faquc.2025.1479875
Received: 12 August 2024; Accepted: 06 January 2025;
Published: 29 January 2025.
Edited by:
Charles Weirich, NOAA National Sea Grant Office, United StatesReviewed by:
Margarita Smirnov, Ministry of Agriculture and Rural Development (Israel), IsraelCopyright © 2025 Amlie, Persson, Nørstebø, Østvik, Stormoen and Evensen. This is an open-access article distributed under the terms of the Creative Commons Attribution License (CC BY). The use, distribution or reproduction in other forums is permitted, provided the original author(s) and the copyright owner(s) are credited and that the original publication in this journal is cited, in accordance with accepted academic practice. No use, distribution or reproduction is permitted which does not comply with these terms.
*Correspondence: Øystein Evensen, b3lzdGVpbi5ldmVuc2VuQG5tYnUubm8=
Disclaimer: All claims expressed in this article are solely those of the authors and do not necessarily represent those of their affiliated organizations, or those of the publisher, the editors and the reviewers. Any product that may be evaluated in this article or claim that may be made by its manufacturer is not guaranteed or endorsed by the publisher.
Research integrity at Frontiers
Learn more about the work of our research integrity team to safeguard the quality of each article we publish.