 Jordi Guillen1*
 Frank Asche2,3
 Natacha Carvalho4
 Jean-Noël Druon1
 Ignacio Llorente5
 Andrew Sciberras6
 Svjetlana Višnić Novaković7
 Ivana Vukov7
- 1Joint Research Centre, European Commission, Ispra, Italy
- 2School of Forest, Fisheries and Geomatics Science, University of Florida, Gainesville, FL, United States
- 3Department of Safety, Economics and Planning, University of Stavanger, Stavanger, Norway
- 4Health and Resources Programme, European Environment Agency (EEA), Biodiversity, Copenhagen, Denmark
- 5Business Administration Department, Universidad de Cantabria, Santander, Spain
- 6Department of Fisheries and Aquaculture, Ministry for Agriculture, Fisheries and Animal Rights, Marsa, Malta
- 7Directorate of Fisheries, Ministry of Agriculture, Zagreb, Croatia
Introduction: Considering the need to feed the increasing world population, it is essential to ensure that food production systems are sustainable. Aquaculture has been identified as a potential crucial source of sustainable food with its significant potential for future growth, notably by the recent EU regulations aiming at boosting food security and sustainable food systems. In this context, it is important to reflect on how the aquaculture of carnivorous species, which are exhibiting the highest growth rates, stands in respect of environmental impacts and contribution to the overall food supply. In particular, tuna aquaculture has been largely criticized for its high environmental impacts and general low sustainability.
Methods: Here, we present a methodology to assess the sustainability of seafood production systems, with a first analysis applied to Atlantic bluefin tuna (BFT) aquaculture, detailed for both BFT fattening and farming.
Results: Results suggest that the limited economic and social contributions of BFT aquaculture do not currently compensate its environmental impacts with an estimate of a 3.4-fold higher long-term social cost than the short-term economic gain.
Discussion: However, it is also a species where the production cycle is not closed in commercial operation, and with a significant potential for further improvement as the control of the production process increases.
1 Introduction
The world’s human population reached 8 billion people in November 2022 and is expected to continue growing to 8.5 billion in 2030 and about 9.7 billion by 2050 (United Nations, 2022). Such a rapid population growth is and will give rise to a fast increase in the global food demand, and especially for protein-rich foods (Duarte et al., 2009; Godfray et al., 2010; Garcia and Rosenberg, 2010; Béné et al., 2015; King et al., 2017). This increase in global food demand may easily intensify the pressure on food safety, food security and the ecological footprint. Hence, it is essential that food production systems are sustainable (Godfray et al., 2010).
Aquaculture has been identified as a crucial sustainable food source to feed the increasing global population (Asche, 2008; Garlock et al., 2020; Henriksson et al., 2021). Total production of seafood by capture fisheries and aquaculture was estimated at 182 million tonnes in 2021 (FAO, 2024)1. Capture fisheries production has been rather stable at around 90 million tonnes since mid-1990s; therefore, a significant sustainable production increase from capture fisheries is rather unlikely (Garcia and Grainger, 2005; Guillen et al., 2016). Aquaculture production, on the other hand has been rapidly increasing since the mid 1980’s and surpassed the capture fisheries as a source of food in 2014, and aquaculture is set to soon overtake capture fisheries in total production (Garlock et al., 2020; Asche et al., 2022; Garlock et al., 2023). Moreover, aquaculture production is expected to continue to grow rapidly as the control of the production process allows continued innovation that reduces production costs and improves competitiveness (Asche, 2008). There are concerns that this rapid expansion of aquaculture can impact mainly its environmental and social sustainability; however, this process often leads to a reduced environmental footprint, although it is largely dependent on the governance system (Asche et al., 2022; Naylor et al., 2023; Partelow et al., 2023; Garlock et al., 2024).
EU regulations recognize aquaculture as a major potential contributor to enhance food security and sustainable food systems. The European Union (EU)’s Common Fisheries Policy (CFP) sets the rules for managing EU fisheries and aquaculture. The latest reform of the CFP highlights the need of aquaculture to be environmentally sustainable and to contribute to ensuring food security by increasing food production (European Commission, 2013; Guillen et al., 2019a)2.
Moreover, the EU aims to cut pollution and carbon emissions, boost the efficient use of resources and restore biodiversity (European Commission, 2019). The European Green Deal (European Commission, 2019), the Farm to Fork Strategy (European Commission, 2020), the Sustainable Blue Economy Communication (European Commission, 2021a), and the Strategic Guidelines for a more sustainable and competitive EU aquaculture (European Commission, 2021b) emphasize the potential of aquaculture as a key sustainable food production source. As such, these EU regulations aim to boost low environmental impact aquaculture, which is identified as the production of low trophic species (micro and macro-algae, non-fed such as filter feeders like mollusks), organic aquaculture and integrated multi-tropic aquaculture (IMTA).
In this context, it is important to reflect on how the aquaculture of carnivorous species stands with respect to environmental impacts and contribution to the overall food supply, recognizing that the impact varies by species (Gephart et al., 2021; Koehn et al., 2022). In 2020, the main finfish aquaculture species produced in the EU (rainbow trout, gilthead seabream, European seabass, and Atlantic bluefin tuna) accounted for more than 50% of the total EU aquaculture production in value, all of them being carnivorous species (STECF, 2023a). Feed determines the growth and quality of the fish, but also generates the greatest environmental impact (Luna et al., 2019). In the last two decades, the aquaculture industry and the scientific community, with the support of public institutions, have developed significant improvements in feed formulations with the replacement of fishmeal and fish oil with alternative ingredients mainly derived from commodity agricultural crop (Da et al., 2012; Tacon, 2020; Pelusio et al., 2022), and some carnivorous species like salmon are now net providers of marine protein (Ytrestøyl et al., 2015). Fed-aquaculture currently produces three to four times as much fish as it consumes (Kok et al., 2020). However, these improvements in feed formulations have been applied with different degrees of success depending on the species and the stage in the development cycle. Tuna aquaculture, which involves a group of species whose production cycles have not yet been closed at a commercial level and which still do not use formula based feeds that would allow an easy substitution of ingredients, may be the most controversial type of aquaculture taking place in European waters.
Atlantic bluefin tuna (BFT) is the only tuna species farmed in EU waters, and the sustainability of tuna aquaculture in Mediterranean European countries is frequently questioned due to its impact on both wild stock categories, the harvested tuna used as livestock and the small pelagic species used as tuna feed that could be used directly for human consumption (Mylonas et al., 2010). Despite scientific advances in the reproduction of bluefin tuna in captivity, currently its cultivation still consists of capturing individuals in the wild and transferring them to floating cages where they are fed with fat-rich low-cost species such as sardines or mackerel (Mylonas et al., 2010; Fernandez-Polanco and Llorente, 2016)3.
In the early 2000’s, BFT aquaculture was largely criticized not only for its environmental impacts and use of subsidies, but also as a cause of the overexploitation of BFT stocks4. The rise of tuna aquaculture, and the associated demand increase for live tuna, was linked to the high prices tuna reached in the Japanese market (Deere, 2000; Carroll et al., 2001). Tuna aquaculture allows producers to fatten the tuna, thereby fetching higher prices, as well as to regulate the fresh tuna meat market and avoid oversupplying it in the short-term.
A 15-year recovery plan resulted in increased BFT stock size allowing for higher Total Allowable Catch (TACs) quotas in recent years within sustainable harvest levels (ICCAT, 2008; Selles et al., 2018; Nøttestad et al., 2020). Despite the recovery of stocks, the debate on the sustainability of tuna aquaculture persists. Tuna aquaculture continues to face criticism for its high environmental impact and resulting negative overall food supply, especially when most of the BFT production is exported.
This paper aims to make a multi-disciplinary assessment of the sustainability of Atlantic bluefin tuna (BFT) aquaculture, detailed for both BFT fattening and farming. Our method involved estimating and comparing the environmental, economic and social contributions and impacts of BFT aquaculture, measured in economic terms. Such a methodology and its outcomes can be applied to other aquaculture and food production systems.
We structured the manuscript to be self-sufficient for the reader, beginning with, a section on recent trends in BFT aquaculture and the difference between tuna fattening and farming. The materials and methods section provides an overview of the indicators for this proposed methodology and main data sources used in this study. Subsequent results and discussion sections detail the economic and food production contribution of BFT aquaculture, comparing these to BFT fishing, as well as their environmental impacts. The manuscript concludes with a research findings and remarks section and conclusions that put the study’s results into perspective.
2 Atlantic bluefin tuna aquaculture
Three species of tuna are farmed, all of them being bluefin tuna of the Thunnus genus. Atlantic bluefin tuna (BFT, Thunnus thynnus) represents 49% in weight and 40% in value of the global farmed tuna in 2021, while Pacific Bluefin tuna (Thunnus orientalis) represents 40% in weight and 50% in value (FAO, 2024). Atlantic bluefin tuna is mainly cultivated in the Mediterranean Sea, and Pacific bluefin tuna in Japan and Mexico. The third species is the Southern bluefin tuna (Thunnus maccoyii), cultivated in Australia.
More than 80% of the BFT aquaculture in both weight and value takes place in the EU (FAO, 2024). The only European countries involved are Croatia, Malta and Spain. In 2021, Malta produced 42% of the weight and 44% of the value of the total BFT aquaculture production, Spain produced 26% of the weight and 30% of the value, while Croatia produced 13% of the weight and 10% of the value (see Figure 1).
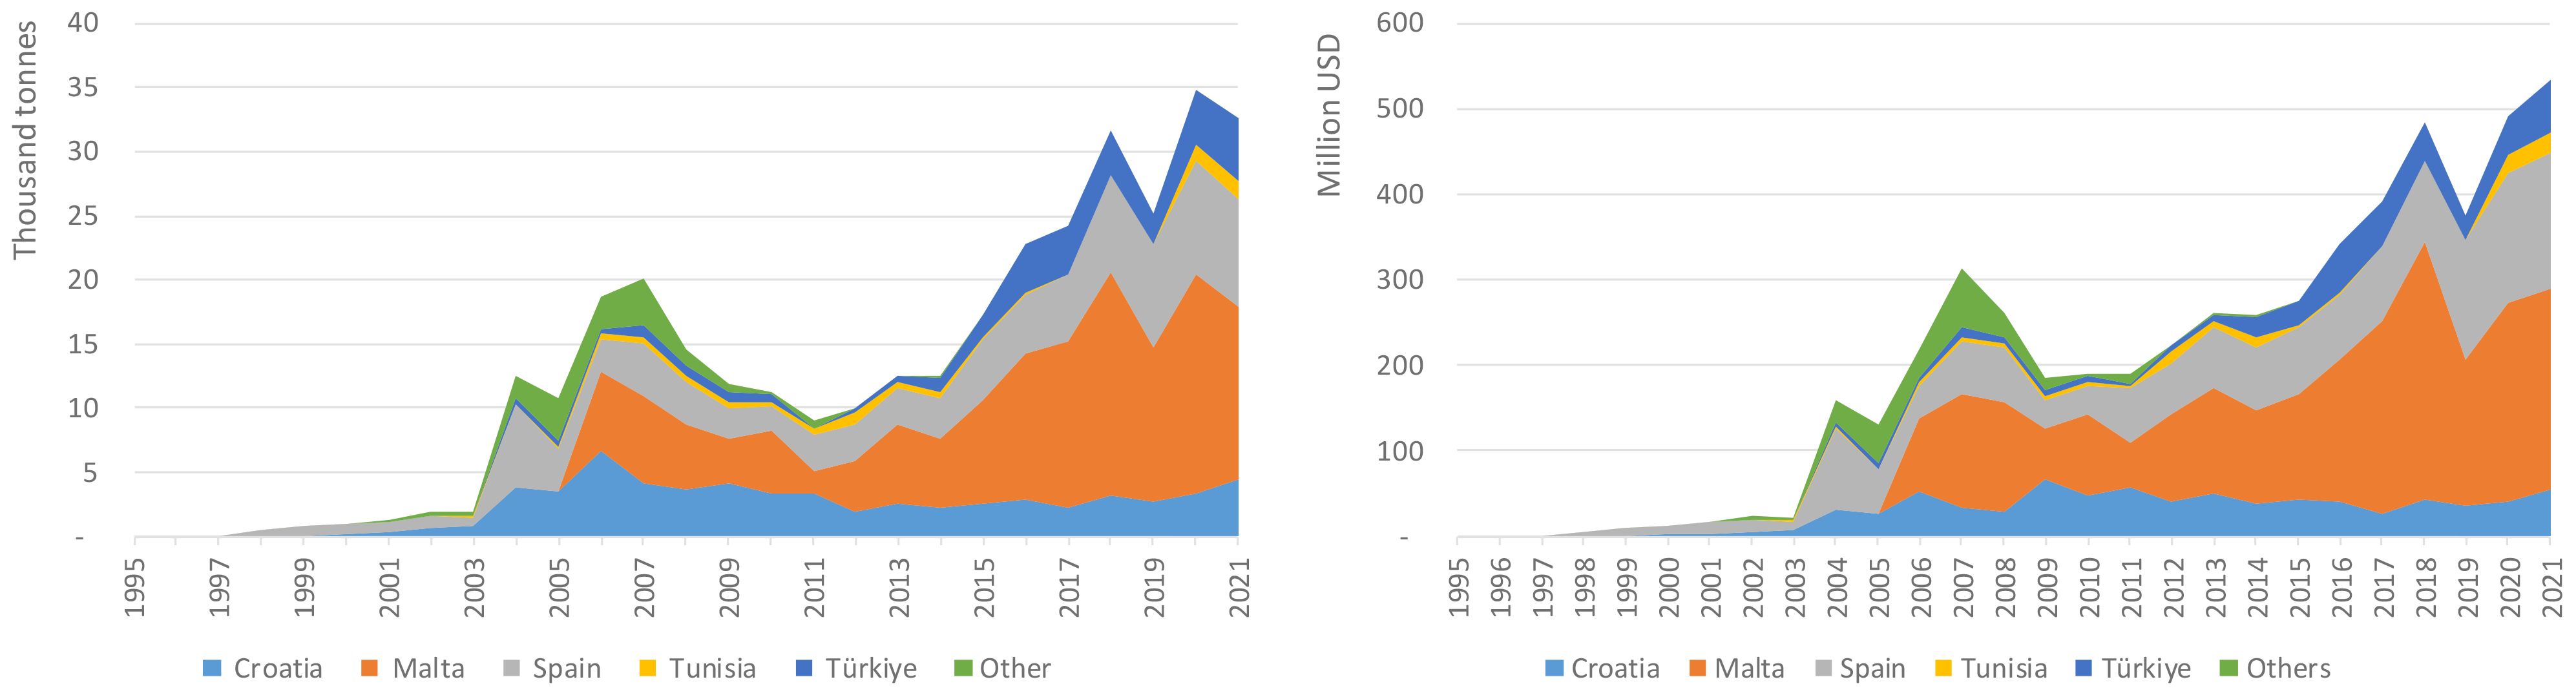
Figure 1. BFT aquaculture production (1995-2021). Source: Own elaboration from FAO (2024) data.
BFT aquaculture relies on capturing live tuna individuals and their rearing in sea cages. The International Commission for the Conservation of Atlantic Tunas (ICCAT, 2008) classifies BFT aquaculture into two types depending on the size of the wild individuals captured and the rearing time:
● Fattening when mature individuals (>30 kg in body weight) are reared between 2–7 months;
● Farming when juvenile individuals (8–30 kg in body weight) are reared for a longer period (up to 2 years).
According to data from the 2023 Annual Economic Report of the EU fishing fleet (AER; STECF, 2023b), about 90% of the EU catches of BFT take place in the Mediterranean Sea. Here, the BFT fishing season is between June and July during their reproductive migration and often in their spawning areas.
About 85% of the BFT is currently caught using purse seines. The importance of purse seiners has been increasing as this fishing method captures the BFT alive, so that BFT can be supplied to the aquaculture sites (Ottolenghi, 2008; Druon, 2009; STECF, 2023b). Nearly all the BFT purse seiner catch is sold to aquaculture sites in the Mediterranean Sea. Only individuals that die accidentally during the fishing operations or transport to the sites are sold directly to the market (Mylonas et al., 2010).
Most of the BFT migrating are mature spawners with body weights between 40 and 400 kg, as 25 kg corresponds to the mean weight at first maturity in the Mediterranean Sea and East Atlantic Ocean (Druon et al., 2016). At this time of the year, BFT have spent a large amount of energy building their gonads (Mourente et al., 2001), resulting in a significant reduction of their muscle fat content, while the sushi and sashimi market appreciate more fatty fish (Ticina et al., 2007). Unlike the tuna steak and canned tuna markets, the tuna sushi and sashimi market, mainly located in Japan, is highly selective, only accepting the three bluefin tuna species and prices are very dependent on the meat quality (Martı́nez-Garmendia and Anderson, 2005; Miyake et al., 2010; Metian et al., 2014).
Contrary to most farmed carnivorous fish species that are fed with formulated feed with varying levels of marine ingredient content in the form of fishmeal and fish oil (Tacon, 2020), BFT is mostly fed with small pelagic fishes, which are fat-rich and low-cost species (Belmonte and de la Gándara, 2008). This includes sardinella (Sardinella aurita), European pilchard (Sardina pilchardus), herring (Clupea harengus), mackerel (Scomber scombrus), horse mackerel (Trachurus spp.), chub mackerel (Scomber japonicus), bogue (Boops boops), and some cephalopods (Vita et al., 2004). Hence, BFT fattening, which is primarily done to obtain a greater body fat content and overall weight, results in higher prices and enhanced by regulating the supply beyond the fishing season.
BFT farming only takes place in Croatia, since only Croatia has a derogation allowing the harvest of individuals smaller than 30 kg, but bigger than 8 kg, because of historical reasons and the small number of tunas involved. These juvenile tunas are reared in captivity for up to 2 years until they reach between 30 to 50 kg (Ticina et al., 2007). Thus, farming is done to increase weight and reach the minimum requirement of the Japanese market, reaching relatively low prices as this market prefers 150– 250 kg tunas. Maintaining the tuna for longer in cages increases the financial risk (Mylonas et al., 2010) and overall costs.
3 Materials and methods
3.1 Methodology
According to the CFP (European Commission, 2013), aquaculture activities should be i) environmentally sustainable in the long-term, ii) provide economic, social and employment benefits, and iii) contribute to the availability of food supplies. Hence, to assess the sustainability and benefits of the EU’s BFT aquaculture, the environmental, social, and economic impacts, as well as its contribution to the overall food supply should be evaluated.
The economic, social and employment benefits reflect the contribution of the BFT aquaculture to the EU citizens’ welfare. To measure the extent of the economic positive impacts, we analyze economic performance indicators such as the gross value added (GVA) and operating profits. The GVA represents the contribution of the sector to society in terms of private profits and labor remuneration, as typically included in the GDP numbers. GVA therefore signals if the economic activity is desirable. The operating profits are calculated by subtracting the labor costs and the consumption of fixed capital (i.e., depreciation) from the GVA, and so by accounting for the cost of capital investments, it shows the long-term private gains (Guillen et al., 2023).
Regarding social benefits, it is important to focus on labor remuneration and therefore on the quality and attractiveness of jobs rather than just employment in numbers as a social objective in developed economies (Hilborn, 2007).
Food security relates to ensuring availability and access to a sufficient amount of food that can be used to meet nutritional needs, as well as to maintain an active and healthy lifestyle over time (Mc Carthy et al., 2018). Here, we analyze the contribution of BFT to food security from a food supply perspective. For the aquaculture of carnivorous species, such as BFT, it is necessary to go beyond aquaculture production to determine their contribution to overall food supplies. Estimating the contribution of BFT aquaculture to the overall food supply requires considering the use of feed fish, since carnivorous species feed on other fish (directly or indirectly through fishmeal and fish oil), potentially reducing the overall food supply.
The fish in/fish out ratio (FIFO) expresses the dependency of farmed fish on feed originating from wild-capture fisheries. It is calculated as the amount of fish feed measured in live weight equivalents needed to produce one weight equivalent of farmed fish.
Food sovereignty refers to the capacity of a country to produce the food its population needs (Jarosz, 2014). This aspect is investigated by looking at external trade; in particular, whether the EU is exporting most of its BFT production.
BFT aquaculture has been largely criticized for its environmental and ecological impacts; however, these impacts are the most complex and challenging to estimate.
BFT aquaculture and associated profits can have negative impacts on the species because the required wild BFT can lead to the overexploitation of wild BFT stocks in the absence of quotas, or can favour illegal fishing. On the other hand, BFT aquaculture can help regulate the overall supply of BFT over the year since the fishing season is highly restricted.
BFT aquaculture can also have negative ecological impacts on other species since it also requires capturing wild fish for feed. BFT is a carnivorous species with a low Fish Conversion Rate (FCR), i.e. requires large amounts of wild fish as feed. Thus, BFT aquaculture can lead to increased pressure on forage fish stocks, which can disrupt local marine ecosystems or even direct human food supply if forage stocks are not properly managed.
Furthermore, the discharge of this uneaten excess feed from BFT aquaculture results in emissions that worsen water quality in addition to fish excrement. Waste from feeding and its accumulation on the seafloor has been identified as one of the main negative environmental impacts of aquaculture (Karakassis et al., 2000).
Escapees from aquaculture farms can potentially interbreed with wild populations, leading to genetic dilution and a loss of genetic diversity5. However, since BFT aquaculture involves growing local (i.e., non-alien) BFT individuals that have not been bred in captivity and their genetic materials have not been altered, this genetic pollution risk is non-existent.
Similarly, intensive aquaculture is susceptible to disease outbreaks and parasite infestations that can spread to local fish populations. However, this risk is rather limited since BFT aquaculture grows local BFT individuals, the densities in cages are relatively low, these cages are located in exposed areas, and mature BFT individuals have well-developed immune systems.
Hence, in this study, we will focus on the impacts generated by the BFT and forage fish fishing activities, as well as by the uneaten feed and waste taking place in the aquaculture farms. In particular, we will investigate the emissions of carbon (CO2), nitrogen (N) and phosphorous (P) generated by the BFT aquaculture and their social costs.
For the direct CO2 emissions of the BFT aquaculture, we will consider: 1) average emissions to catch the BFT livestock, 2) average emissions from feed, and 3) emissions from aquaculture production as estimated from its energy costs. Thus, we exclude from the analysis emissions taking place after the slaughtering; e.g. the air transport to Japan.
More controversial and uncertain is the estimation of the social costs of these carbon, nitrogen and phosphorous emissions. The social cost is a measure that quantifies the economic costs associated with an additional tonne of emissions to the atmosphere and considers both the private costs and the externalities. However, there is a high degree of variability in the social cost estimates found in the literature, partly due to different assumptions and methodologies (see for example the social costs of carbon, van den Bergh and Botzen, 2015; Nordhaus, 2017; Ricke et al., 2018; Pindyck, 2019). This would allow to estimate the negative environmental impacts of BFT aquaculture in economic terms and compare them with its socio-economic contributions, mainly in terms of GVA.
Hence to assess the economic, social, and environmental impacts and the contribution to the overall food supply, the indicators reported in Table 1 are used.
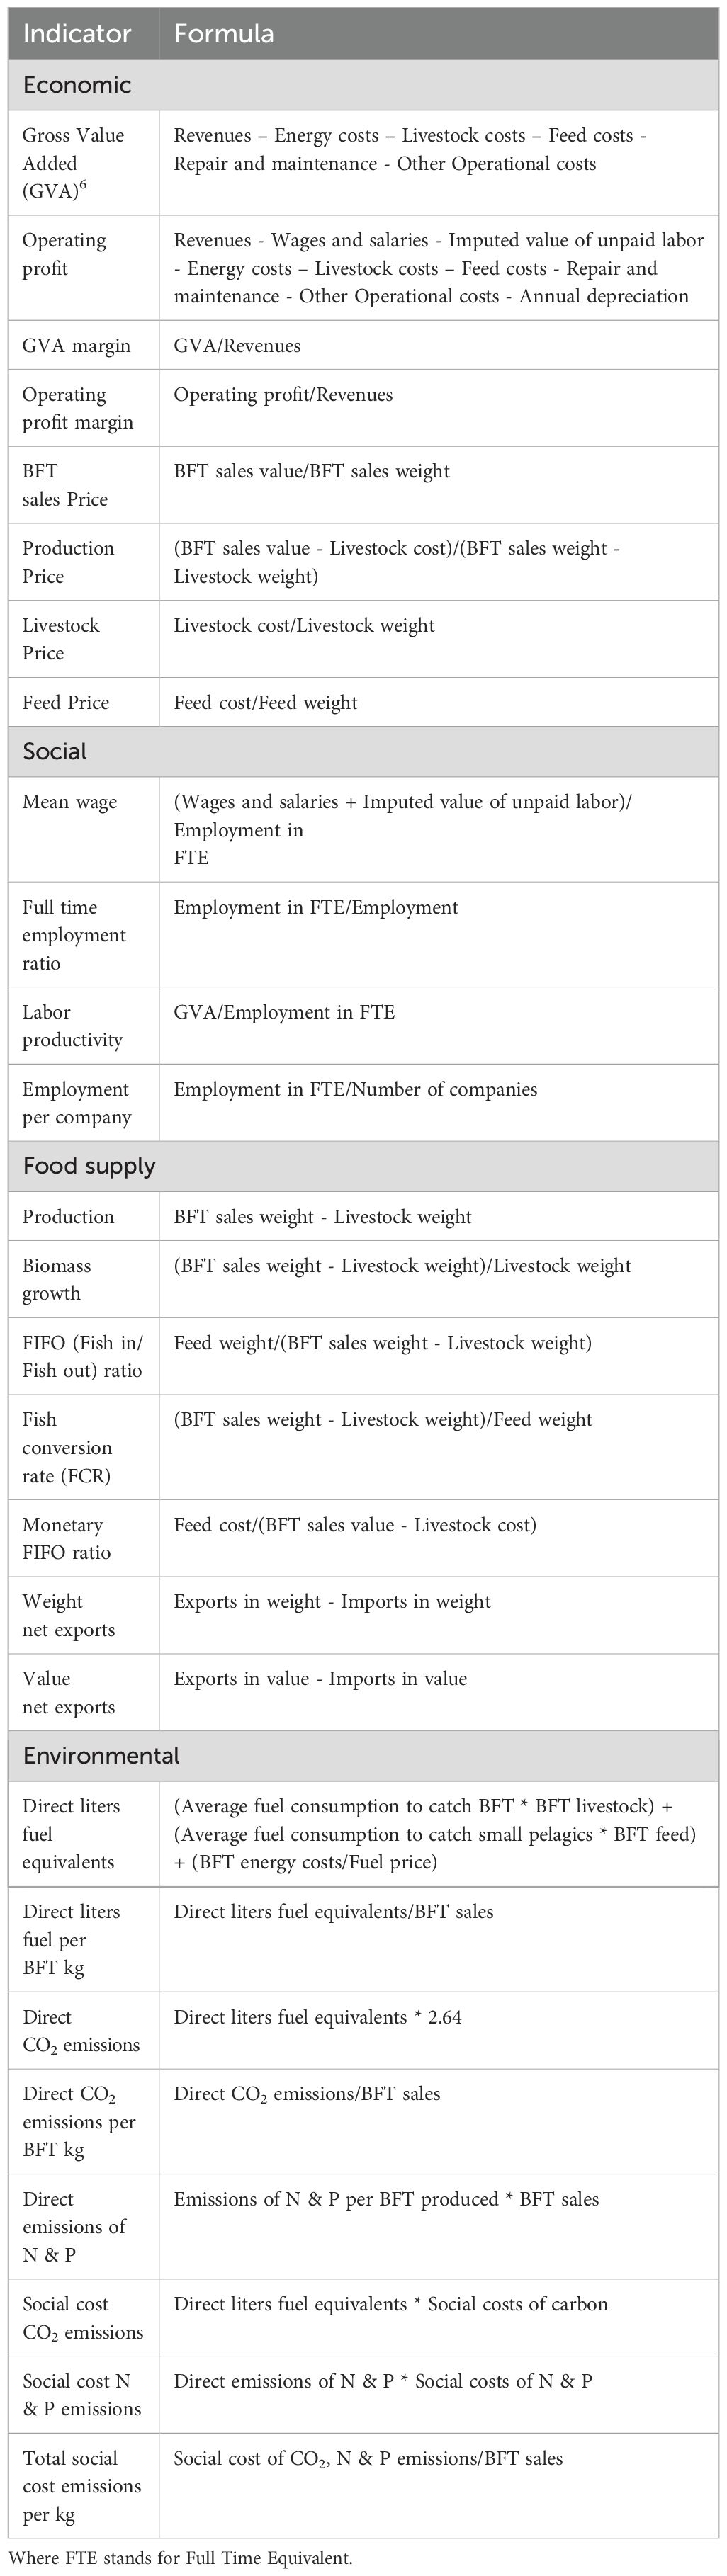
Table 1. Indicators used to assess the economic, social and environmental impacts and the contribution to the overall food supply.
3.2 Data
The aquaculture data by EU country used for this study have been extracted from the 2022 economic report of the EU aquaculture sector (STECF, 2023a). The STECF report provides data at the overall national level and by segment. An aquaculture segment consists of a group of companies whose main activity is specific to a species and culture technique. To analyze the BFT aquaculture, we focus on the segment “Tuna cages”, since BFT is the only tuna species farmed in Europe.
The STECF aquaculture production data confirms that BFT aquaculture takes place in Croatia, Malta and Spain. All three countries are operating in the Mediterranean Sea and using the same production method of trapping, on-growing and enhancing in sea cages. The average annual tuna production reached 26 thousand tonnes worth €340 million during the period 2019-2020 (STECF, 2023a) (see Table 2).
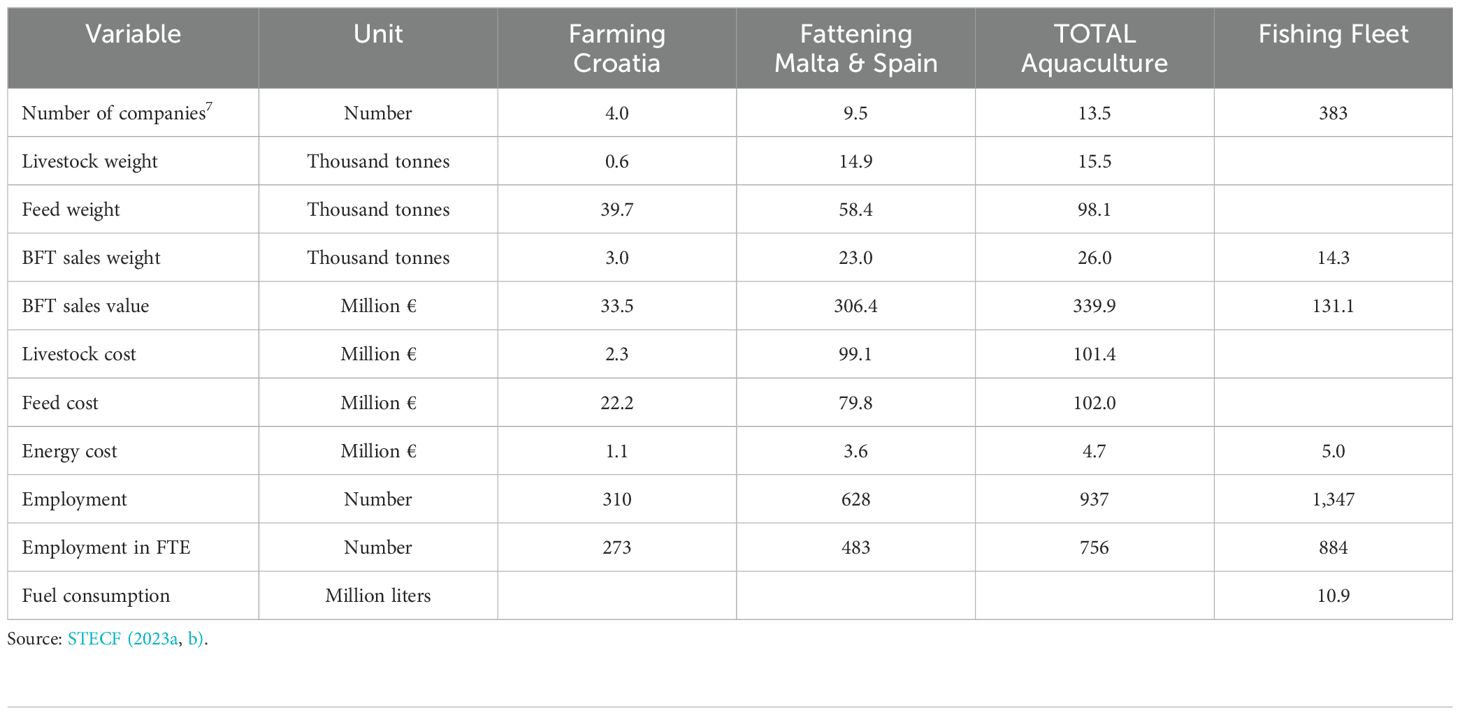
Table 2. Main Economic indicators for EU tuna aquaculture: Average 2019-2020.
The data on the EU fishing fleet targeting BFT have been assembled from the 2023 Annual Economic Report of the EU fishing fleet (AER; STECF, 2023b). These data are also reported at the national level and by fleet segment. Large French, Spanish and Italian purse seiners account for around ¾ of the EU’s BFT landings; while other fleets, including smaller vessels, account for the remaining ¼ of the BFT landings. Given the different contribution of BFT landings to each fleet’s overall landings, the variables for each fleet targeting BFT have been weighted by their share of BFT landings value in their own overall landings value. This way, if BFT represents 50% of the value of landings of a fleet, 50% of the costs, employment, etc. have been allocated to the overall BFT fishing fleet reported in Table 2.
4 Results and related discussion
4.1 Economic contribution
The main operational costs of the EU BFT aquaculture sector are the feed and livestock costs, together with the other operational costs. For BFT fattening (large fish), the main cost is the tuna livestock while feed cost is the most important for BFT farming (small fish). In BFT farming, the livestock cost is lower because the tuna are smaller (i.e., juveniles) and cheaper by weight when they are bought as livestock than the livestock for fattening that requires larger individuals. While the feed cost is higher for BFT farming because the small tunas are fed for a much longer time than the large individuals in the BFT fattening (see Figure 2).
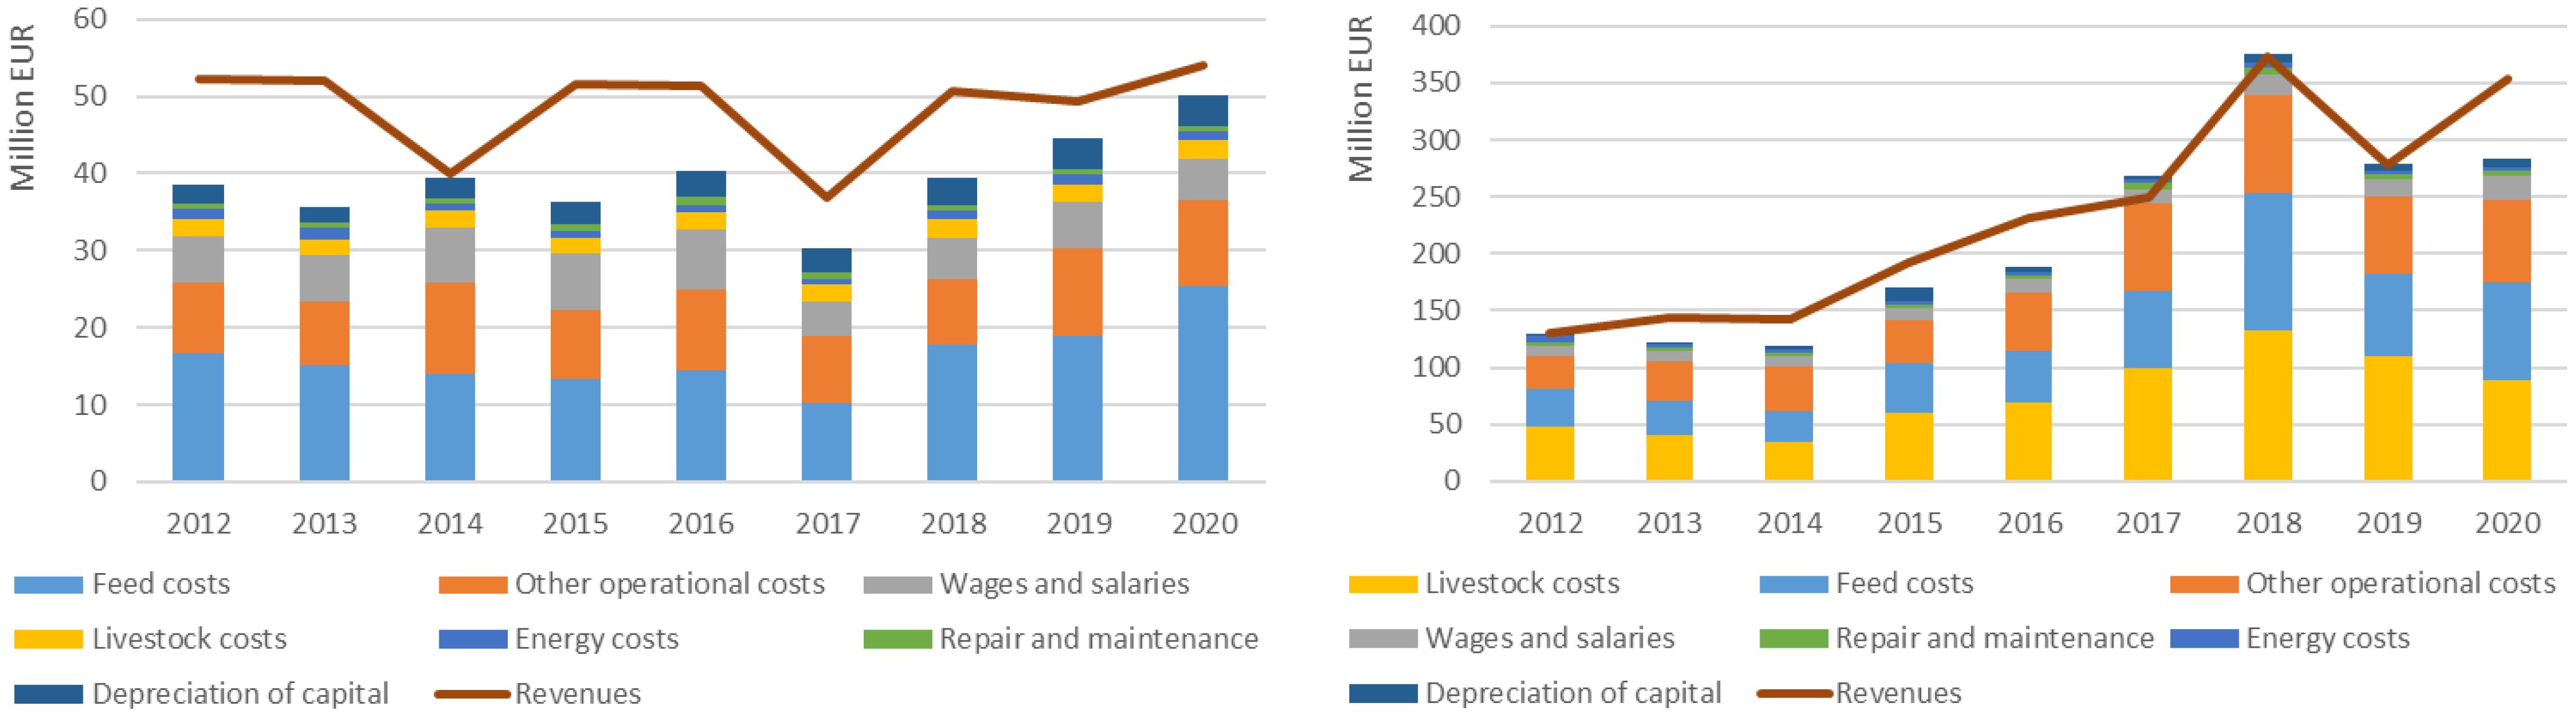
Figure 2. Revenues and costs breakdown for the EU tuna farming (left) and fattening (right) for the period 2012-2020. Source: own elaboration from STECF (2023a) data.
Other operational costs represents 25% and 26% of the BFT farming and fattening costs, which include significant expenses such as contractual work and services (e.g. transport services, telecommunications and postal services, legal services, advertising, etc.), generally forming the largest share. This is followed by ‘other overheads’, processing expenses of fish, and insurance coverage on fish. Additionally, costs like sea freight contribute to these operational expenses, though to a lesser extent, each constituting at smaller contributions compared to the previous cost items. Beyond these, there are also a myriad of smaller costs, ranging from packaging and ice, rent on buildings such as warehouses, legal, and licensing fees, each incrementally impacting the financial structure of the operation, collectively shaping the cost framework that underpins the entire BFT farming and fattening process.
BFT aquaculture, including both farming and fattening, generated a GVA of €74 million and operating profits of almost €40 million, which are higher than the GVA and operating profits generated by the BFT fishing fleet.
Croatia sold about 3 thousand tonnes of farmed BFT at a price of €11.1 per kg; while the BFT livestock mean price was €3.7 per kg. BFT farming is quite profitable, with about 12% operating profit margin.
BFT fattening is also quite profitable, with about 11% operating profit margin. Malta and Spain sold about 23 thousand tonnes of fattened BFT, at a mean price of €13.3 per kg, while the BFT livestock mean price was €6.7 per kg (see Table 3).
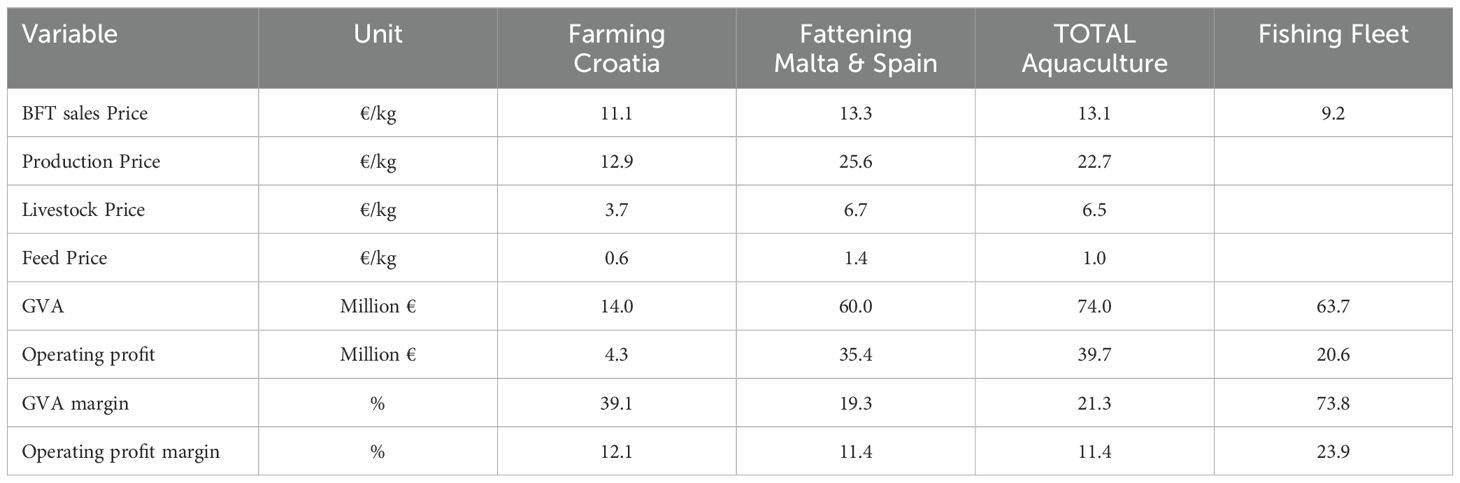
Table 3. Key economic impact indicators for EU tuna aquaculture: Average 2019-2020.
Hence, in addition to the increase in the availability of BFT meat, BFT aquaculture also increases the BFT value. The overall 26 thousand tonnes of BFT sales from fattening and farming, which include both the BFT produced and the BFT livestock, received an average price of €13.1 per kg while the initial BFT livestock mean price was €6.5 per kg.
4.2 Social contribution
BFT aquaculture is a relatively important source of employment and remuneration, nearly matching the levels generated by the BFT fishing fleet. During the 2019-2020 period, BFT farming employed 310 individuals while BFT fattening employed twice as many, with 628 individuals. Employment in full-time equivalents (FTE) amounted to 756 persons, which is just 14% less than that generated by the BFT fishing fleet (see Table 4).
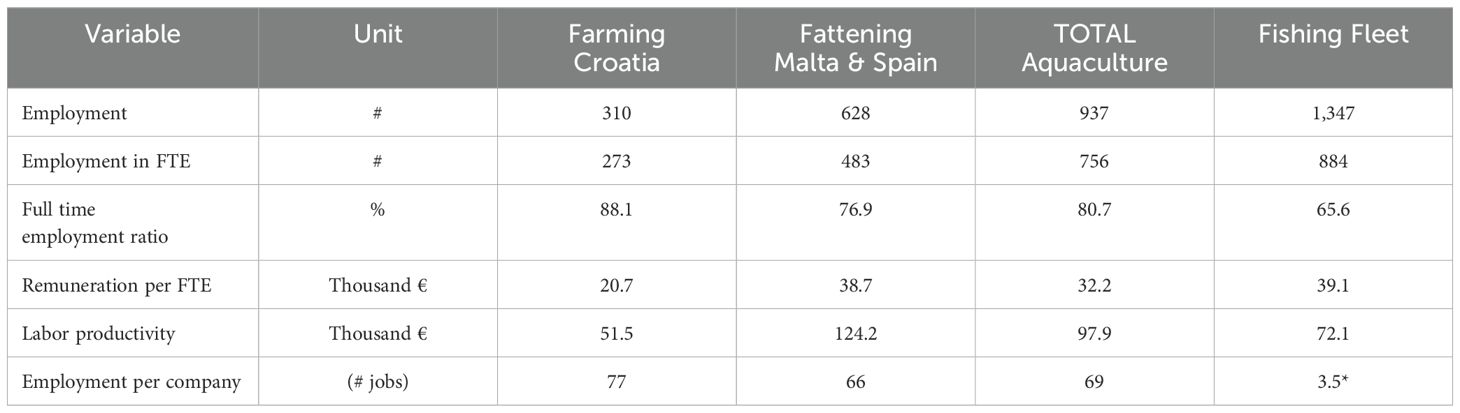
Table 4. Key social indicators for EU tuna aquaculture: Average 2019-2020.
The higher full-time employment ratio for the BFT aquaculture sector indicates less seasonality compared to the BFT fishing fleet. This is as expected as the main BFT fishing season is reduced to just a few months, even if the full-time employment ratio for the BFT fishing fleet may be overestimated since some vessels target other species during the rest of the year.
Remuneration per FTE shows that the BFT fishing fleet overall pays its workers better than the BFT aquaculture sector (+21%), with an average of €39.1 thousand per year compared to €32.2 thousand. However, workers in BFT fattening receive similar remunerations to the BFT fishing fleet, at €38.7 thousand per year, whereas BFT farming remunerations are substantially lower (about -47%) (see Table 4). It should be noted that since these figures represent average remunerations, they may conceal large differences in pay between employees, depending on their skills and tasks.
4.3 Food supply contribution
BFT aquaculture increased availability of BFT meat by 10.5 thousand tonnes over the 2019-2020 period. Even if BFT aquaculture sales amounted to 26 thousand tonnes, the actual net production was 10.5 thousand tonnes after deducting the 15.5 thousand tonnes of BFT livestock. Thus, the overall BFT biomass increased by 68%, with expected large differences between tuna farming (400%) and fattening (54%) (Table 5).
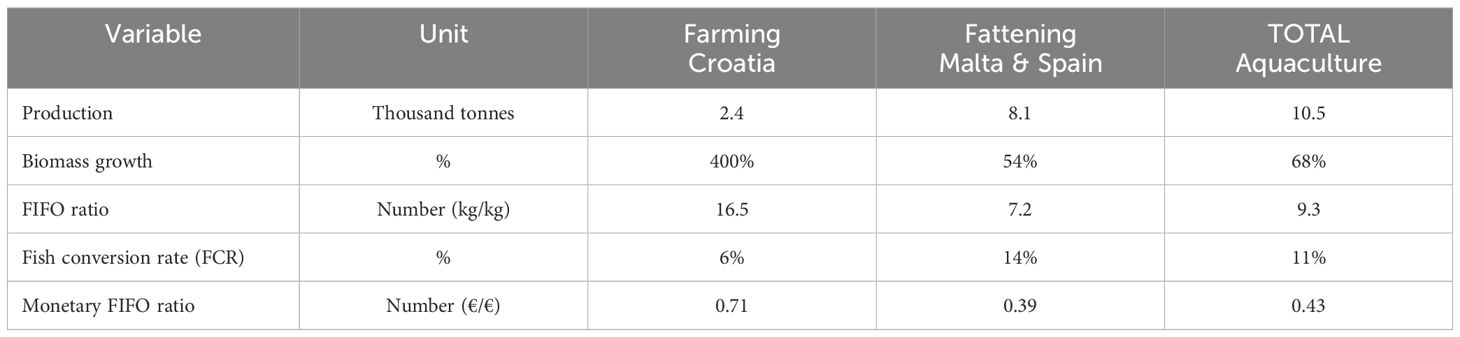
Table 5. Key food supply indicators for EU tuna aquaculture: Average 2019-2020.
The 15.5 thousand tonnes of BFT livestock used exceed the 14.3 thousand tonnes of EU BFT landings, as the EU imports live BFT to serve as livestock for its aquaculture sector (see Table 6).
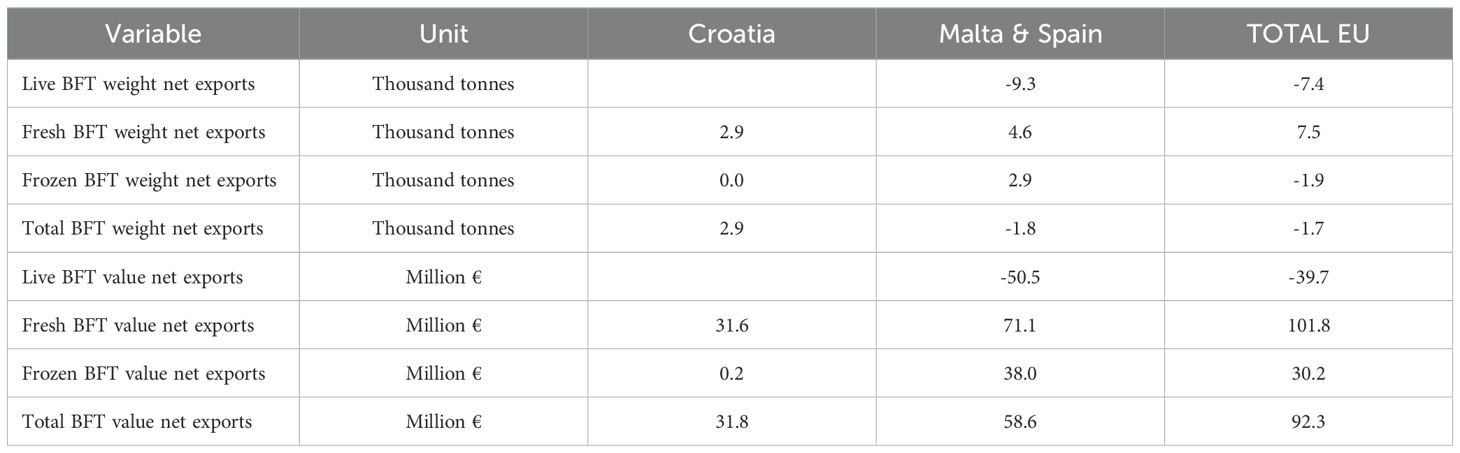
Table 6. Key food security indicators for EU tuna aquaculture: Average 2019-2020 (source: own elaboration from FAO, 2024).
The FIFO ratio shows that 9.3 kg of forage fish are needed to produce 1 kg of BFT, resulting in a conversion rate of 0.11 kg of BFT for each kg of feed (11%). The poor FIFO ratio is because of the use of forage fish as feed, resulting in values in line with other species whose production cycles have not been closed and where limited R&D has been invested in exploring feed composition and digestibility (Klinger et al., 2013).
To determine whether aquaculture leads to an overall increase in food supply, it is important to take into account the fact that some fish caught in the wild - used directly as feed or processed into fishmeal and fish oil - would not be used for human consumption, either because the fish species has no demand for human consumption (industrial-grade forage fish), or because its demand is low (food-grade forage fish), and therefore fetch relatively low prices (Wijkström, 2013; Guillen et al., 2019b). This does not account for a share of prime food fish, like sardines, herring and mackerel that end up as feed or fishmeal (Wijkström, 2013). Wijkström (2013) estimated that using wild-captured fish to feed the overall aquaculture production resulted in a net addition of 7 to 8 million tonnes to the fish supply for human consumption. However, since most small pelagics used to feed the BFT are prime food fish, while few are food-grade forage fish, like sardinella, there is an actual loss in the supply of food for human consumption as a result of the BFT aquaculture, in line with Wijkström (2009, 2013).
Although specific aquafeeds for BFT have been produced, aquaculture producers do not use them because of their high cost and the fear of a negative effect of such feed on the quality of the BFT meat given the strict requirements of the sushi and sashimi market (Ottolenghi, 2008).
The estimated FIFO for BFT is rather high, while FCR is low (see Table 5). The FIFO levels are, on average, slightly lower than the initial range between 10–20 kg of feed to 1 kg of BFT reported in the literature (Mourente and Tocher, 2009; Farwell, 2003; Katavić et al., 2003). Tacon et al. (2006) reported FCRs varying from 1:7 to 1:20 for BFT, which aligns more closely with our findings. Given that these references are somewhat dated, it is likely that there has been some improvement over time, e.g. reduced feed wastage during the feeding process.
Norita (2003) estimated a weight increase of 40–50% for smaller BFT individuals compared to 10–30% for larger ones. Percin and Konyalioglu (2008) estimated an overall 25–35% weight increase after 8 months of fattening. Mylonas et al. (2010) suggested a range of 20–40% depending on initial size. Sun et al. (2019) estimated that six months of fattening could increase BFT weight by up to 60%. Our results show a 54% weight increase during fattening, in line with the most recent literature estimates and possibly confirming this improvement over time. It should be noted, however, that without precise initial weight measurements of the BFT captured and transferred into cages, the growth and feed conversion ratios remain approximations.
The high FIFO and low FCR values confirm that BFT aquaculture is rather inefficient, as increasing the weight of BFT requires a large amount of fish (about 7 to 16 times the weight of the BFT itself). The FIFO and FCR indicators for BFT are substantially higher than those for the most commonly farmed species in Europe (e.g. salmon, trout, seabream and seabass) and other fed aquaculture species, which have seen decreasing FIFO levels over the last three decades (Naylor and Burke, 2005; Kok et al., 2020). As shown in Kok et al. (2020), the fish conversion in fed-aquaculture has significantly improved over time, with most aquaculture species currently being net producers of fish (FIFO below 1, FCR above 100%), salmon and trout being almost net neutral (FIFO of almost 1), and eel being a net consumer of fish (FIFO of 1.7, FCR below 100%).
However, the monetary FIFO ratio indicates that when evaluating this conversion rate in value terms rather than weight, BFT aquaculture is rather efficient. This helps explain the economic viability of BFT aquaculture, with €0.43 of feed needed to produce €1 worth of BFT.
4.4 Food security contribution
Croatia relies on its national fleet to supply the BFT livestock for its farming activities. According to FAO (2024) and Eurostat (2024) data, Croatia exports nearly all of its BFT aquaculture output (97%), with 98% of these exports directed to Japan.
Malta and Spain rely on the imports of live BFT to meet just over 60% of their BFT fattening livestock needs, primarily from Italy, Libya, France, Tunisia and Algeria. FAO (2024) and Eurostat (2024) data indicate that Spain imported slightly more than 1 thousand tonnes of live BFT and exported a similar amount, mostly fresh and some frozen. The net exports balance was therefore positive but almost null in weight, while generating about €29 million in value.
However, for Malta, FAO (2024) and Eurostat (2024) data differ slightly. While Eurostat reports that Malta had a negative weight balance for live and fresh BFT due to imports of live BFT, this was fully offset by exports of frozen BFT, resulting in a net value of about €61.5 million. Conversely, FAO indicates that the exports of frozen BFT do not sufficiently offset the imports of live BFT, leading to a negative balance of 1.9 thousand tonnes. Table 6 uses FAO data since it makes the distinction between live and fresh BFT, which is important to differentiate the livestock from the final product.
According to the available FAO data, the EU BFT fishing fleet caught 14.3 thousand tonnes of BFT. The EU BFT aquaculture sector used 15.5 thousand tonnes of live BFT as livestock, including 7.4 thousand tonnes imported from non-EU countries, to produce a further 10.5 thousand tonnes of BFT. This resulted in the EU exporting 5.7 thousand tonnes of fresh and frozen BFT to non-EU countries, and approximately 26.5 thousand tonnes apparently consumed within the EU market. Using the Eurostat data would result in an apparent consumption of about 24.6 thousand tonnes of BFT in the EU. Therefore, resulting in an increase in the BFT available in the EU.
This divergence, together with the widespread belief and our data showing that most BFT aquaculture sales are directed to exports, which is not reflected in the FAO and Eurostat data sets for Malta and Spain, cautions us to interpret these results carefully and highlights the need for further review and harmonization of both data sets.
4.5 Environmental and ecological impacts
The average fuel consumption to catch the BFT livestock is estimated at 0.76 liters per kg, by dividing the BFT fleet fuel consumption by the BFT landings, both reported in Table 2. Similarly, using AER data (STECF, 2023b), we have estimated the average fuel consumption to catch small pelagics by the EU fishing fleet at almost 0.18 liters per kg, as an approximation for the BFT feed, without accounting for transportation emissions. Their total fuel consumption is therefore estimated by multiplying the respective consumption per kg by the BFT livestock weight and the feed weight from Table 2.
The aquaculture report (STECF, 2023a) contains energy costs data, but no data on energy consumption, while the AER (STECF, 2023b) publishes both energy costs and energy (fuel) consumption in liters data. Therefore, to estimate the CO2 emissions of the BFT aquaculture sector, we approximate the energy consumption of the aquaculture production (e.g. vessels) from their energy costs (see Table 2) divided by the average marine fuel costs, estimated at an average of €0.46 per liter for the period 2019-2020 according to the AER data.
The CO2 emissions are obtained by multiplying the energy consumption estimates by 2.64 constant value, since it has been estimated that 2.64 kg of CO2 are produced per liter of marine diesel consumed (Sala et al., 2022; Tyedmers, 2001). This results in BFT caught by the fishing fleet generating about 2 kg of CO2 per kg of BFT, and about 4 kg of CO2 per kg of BFT for aquaculture (see Table 7).
The estimation of the nitrogen and phosphorous emissions is more challenging. Here we follow Kušpilić et al. (2007), who estimated that there were 1,002 tonnes of nitrogen and 21 tonnes of total phosphorus generated per year to produce 4,000 tonnes of BFT. We understand that Kušpilić et al. (2007) refer to total production (i.e., sales) rather than the increase in biomass. Thus, with a total BFT aquaculture sales of 26 thousand tonnes, this leads to the estimated emission of 6,517 tonnes of nitrogen and 136.6 tonnes of phosphorous (see Table 7).
For the estimation of the social cost of carbon, we follow the US Environmental Protection Agency’s (EPA, 2022) latest central estimate at USD 190 per tonne of CO2. Considering that about 2.64 kg of CO2 are emitted per liter of consumed marine diesel, the social cost of burning marine gasoil is calculated at USD 0.50 per liter (about €0.48 per liter) to account for its externalities.
Similarly, Van Grinsven et al. (2013) estimate an average social cost of €18 per kg of nitrogen, in line with Birch et al. (2011). While Gourevitch et al. (2021) estimate an average social cost of $934 (€823) per kg of phosphorus for the period 2016-19.
Thus, when multiplying the carbon, nitrogen and phosphorous emissions from the BFT aquaculture by their respective social costs per unit, we obtain an estimate of their social costs (i.e., covering environmental and ecological impacts) of €248.6 million. The total social costs amount to about €9.55 per kg of BFT from aquaculture, in contrast with the social costs of €0.36 per kg of BFT from wild-capture fisheries, representing a significant 26-fold difference (see Table 7).
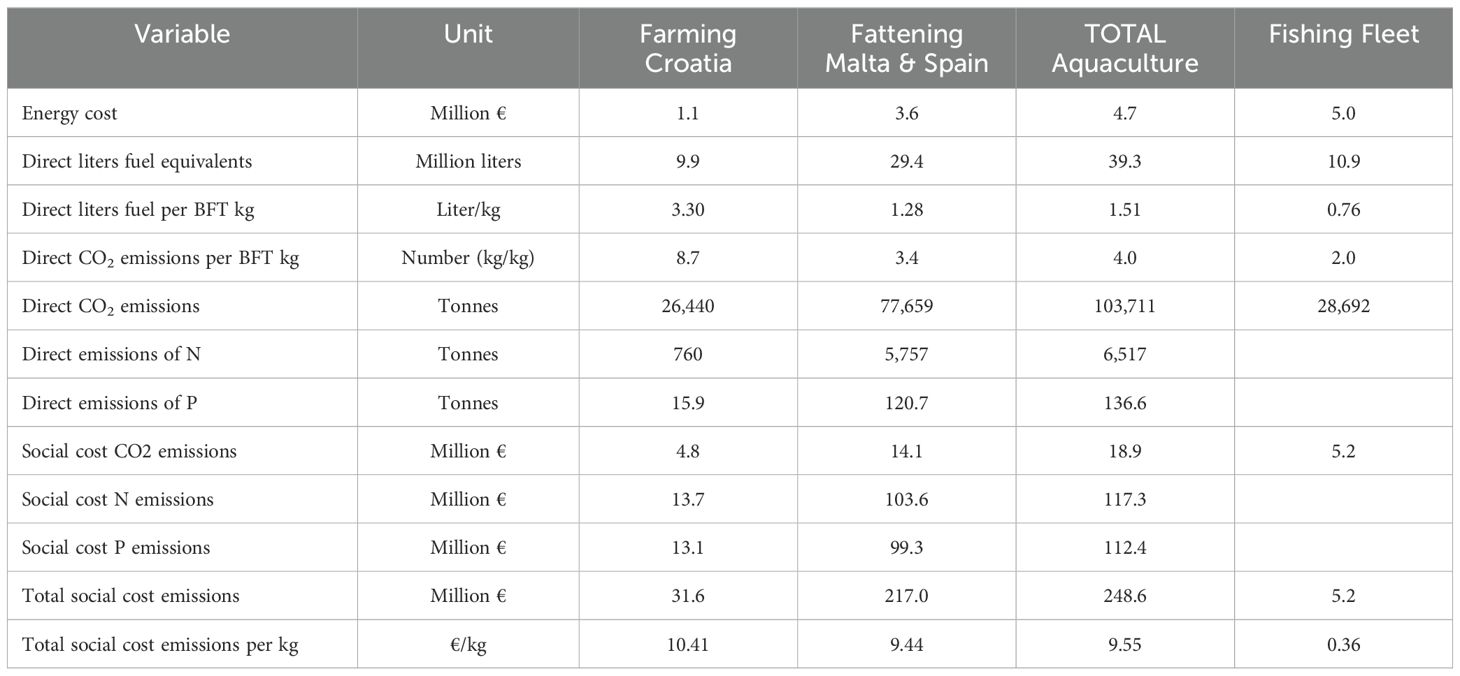
Table 7. Key Environmental indicators for EU tuna aquaculture: Average 2019-2020.
5 Research findings and remarks
The latest reform of the CFP highlights the need for aquaculture to be environmentally sustainable, provide economic and social benefits while contributing to food security through increased production8 (European Commission, 2013). The economic and social benefits derived from the BFT aquaculture are evident, despite representing less than 5% of the GVA (€74 million) and 2% of the FTEs (750 full-time equivalent jobs), generated by the overall EU aquaculture sector. Yet, it represents an important share for Croatia and Malta; in Croatia it accounts for about 25% of the total aquaculture employment and 21% of the GVA; and in Malta, it represents 68% of the employment and around 95% of the GVA. BFT aquaculture not only supports the livelihoods of aquaculture producers but also other stakeholders along the market chain. These benefits in terms of GVA, employment and remuneration are similar to the ones obtained from the BFT fishing sector with a GVA of €74 million for the BFT aquaculture compared to €63.7 million from BFT fisheries (see Table 3 for more details), so BFT aquaculture helps to double the benefits obtained from the BFT.
BFT aquaculture increased the available quantity of BFT by 10.5 thousand tonnes in 2019-2020, and its value as BFT livestock has a price of €6.5 per kg while it receives a sales price of €13.1 per kg. However, BFT aquaculture generates an actual loss in the supply of food for human consumption, since it requires 9.3 kg of forage fish to produce 1 kg of BFT, as can be seen from its FCR and FIFO ratio in 2019-2020. Moreover, the small pelagic species used to feed the BFT are mainly prime food fish and few food-grade forage fish, meaning they could be otherwise used as human food even though they appear to be more valuable as feed. The issue arises because consumers in developed economies are willing to pay significantly more for BFT than for small pelagic species, and these economies do not typically experience food scarcity9. However, if food scarcity becomes more prevalent in the future, e.g. driven by population growth and climate change, the relative price difference between BFT and small pelagic species might narrow, potentially making BFT aquaculture economically less advantageous unless formulated feeds using fewer marine ingredients are developed for BFT and accepted by producers and BFT consumers.
BFT aquaculture has been largely criticized for its environmental and ecological impacts. To determine whether the socio-economic contributions of BFT aquaculture are sufficient to offset these effects, robust estimates of carbon, nitrogen and phosphorous emissions along with their social costs are needed to economically quantify these impacts. Although we recognize that accurately estimating these social costs is complex, we argue that the estimates we provide represent a reasonable order of magnitude based on existing literature. This allows us to estimate that the environmental and ecological impacts (costs for the society) from BFT aquaculture are about €249 million, significantly exceeding the GVA generated by the sector. These social costs can be expressed per kg of BFT, obtaining a cost of about €9.6 per kg of BFT from aquaculture compared to an economic gain of about €2.8 per kg of BFT. This results in a social cost that is 3.4 times higher than the economic benefit.
Due to BFT’s carnivorous nature and high FIFO ratio, the chances of significantly improving the sustainability of BFT aquaculture are currently limited without substantial changes to the production process. The main challenge is the dependency on catching wild tuna BFT for stocking and wild small pelagics for feeding (Jelić Mrčelić et al., 2023). However, there is potential for significant environmental impact reduction through the transition to formulated aquafeeds and the replacement of marine ingredients similar to what has been achieved for other species (Tacon, 2020). This could be solved in the future by BFT aquaculture closing the production cycle at a commercial level and using cost-effective hatchery-produced juveniles and cost-effective, environmentally friendly formulated feeds (Jelić Mrčelić et al., 2023). This would also alleviate the dependency of the BFT aquaculture on the catch of wild BFT. Unfortunately, as of now the profitable production of BFT juveniles is still far from being commercially viable. Reasons include shortage of eggs, low larval and juvenile survival due to early floating and sinking death, sensitivity to environmental conditions, feeding problems, stress, collisions with walls, cannibalism, and the transfer mortality of fingerlings (Ćurić et al., 2021). This is also a potential barrier that can be overcome, as already a large number of farmed carnivore species have done with improved control of the production process and continued innovation, resulting now in net contributors to marine protein (Naylor and Burke, 2005; Asche, 2008; Ytrestøyl et al., 2015; Kok et al., 2020). Still, overcoming these barriers requires significant developments and the potential sustainability of the BFT sector remains a distant prospect, if achievable at all.
According to FAO data, more than half of the overall BFT aquaculture production is exported, with over 80% of these exports destined for Japan. About 70% of the exports comprise fresh BFT, followed by frozen BFT. However, these exports are compensated in weight by imports of mainly live BFT (often from companies with EU capital in third countries), used as livestock for the aquaculture sector (see Table 6). This results in about 26.5 thousand tonnes of BFT being consumed in the EU market, a quantity nearly twice that landed by the EU fishing fleet. This contradicts the general perception that most BFT aquaculture sales are directed to exports. Hence, there is a need for further review of trade data and harmonization between FAO and Eurostat data sets.
The BFT aquaculture uses about 9.3 kg of fish to produce one kg of BFT as shown in the FIFO values, resulting in an actual loss in the supply of food for human consumption, especially in the EU since most of the BFT is exported. This can be of concern especially when considering that the EU’s overall seafood self-sufficiency was about 38.2% in 2021 (EUMOFA, 2023). Self-sufficiency is the capacity of a country to meet their consumption from their own production, and can be calculated as the ratio of domestic production over domestic consumption. It is also worthwhile to note that while exports may impact food sovereignty, they contribute to economic growth and generate income that can be used for other purposes (Asche et al., 2015).
If trade data confirms that most of the BFT aquaculture is exported, this intensifies the need for a discussion on who should bear the costs of the environmental impacts of BFT aquaculture and how much they should pay. As it stands now, no one is paying for these emissions, resulting in EU citizens bearing the environmental costs of BFT aquaculture without substantially consuming its products, while only a few benefit from the profits. If the social costs were internalized, BFT aquaculture would not be so desirable from an economic point of view, as it incurs a social cost that is 3.4-fold higher than its economic benefit.
More generally, article 191(2) of the Treaty on the Functioning of the European Union enshrines the polluter pays principle10 (European Union, 2012). This principle implies that polluters should bear the costs of the pollution they cause, thereby creating an incentive to prevent environmental damage at its source and holding polluters accountable. Thus, following the polluter pays principle, imposing a tax to compensate for the environmental impacts would be fully justified as it would address the long-term social costs. Likewise, this tax, if applied to all seafood products, whether EU consumed or exported, should act as a strong incentive for sustainable production practices. If this tax aims to target emissions from the entire seafood sector, including aquaculture and wild-capture fisheries, and to internalize the pollution costs, robust estimates of the emissions and social costs are essential. Currently, there is a high degree of variability and uncertainty in these estimates, partly due to different assumptions and methodologies used in the literature, particularly for social costs. Furthermore, assuming a uniform social cost per emission is an oversimplification; the actual cost of the damage varies depending on factors such as the level of individual and overall emissions, the location, local population preferences, etc. Applying such a tax could lead to reductions in food production as production costs would increase, potentially creating economic losses. Moreover, to ensure fairness, this taxation would need to cover all food production systems, including imports, which would lead to an undesired increase in food prices.
Additionally, the relatively intensive farming of large species like BFT raises additional ethical dilemmas compared to other aquaculture species. These include concerns about animal welfare during the live capture, transport and confinement of a large wild animal in relatively small cages. Additionally, there are issues regarding the social acceptability of such practices given their long-term societal costs, as well as food security concerns associated with the use of marine feed. Addressing these challenges requires a holistic and consensual approach (Grigorakis, 2010).
6 Conclusions
Aquaculture has experienced rapid growth as a global food production system and economic activity, recently surpassing wild fisheries in terms of production in 2022 (FAO, 2024). As seafood consumption continues to rise, aquaculture plays a vital role in meeting the world’s food demands and combating malnutrition. However, the sustainability of aquaculture, especially its environmental aspect and social impacts, remains a cause for concern, partly due to this rapid expansion (Garlock et al., 2024).
In this article, we present a methodolody to assess the sustainability of seafood production systems, which could be easily applied to fishing and aquaculture. A first application has been carried out for the BFT aquaculture, which has been largely criticized for its high environmental impacts and general low sustainability. Results suggest that the economic and social contributions of BFT aquaculture do not currently compensate its environmental impacts. Considering that the three species of tuna farmed are all of them bluefin tuna from the Thunnus genus, and given their similarities (e.g. in terms of growth, feeding, etc.), we are quite confident that the outcomes of this study regarding the high environmental impacts of BFT aquaculture can be extrapolated to the other two Bluefin tuna species.
The main aim of this approach is to estimate in economic terms the negative environmental impacts of production systems, here mainly in terms of carbon (CO2), nitrogen (N) and phosphorous (P) emissions, and compare these values with their socio-economic contributions, mainly in terms of GVA11. However, a larger set of indicators is considered in order to provide a more comprehensive view of sustainability.
Taking into account that most fed-aquaculture species are currently net producers of fish protein (FIFO below 1), with eel and BFT being net consumers of fish (FIFO of 1.7 and 9.3, respectively), BFT aquaculture could be considered an extreme case, but still important to highlight the relevance of this approach. On the other extreme, algae and filter-feeders, such as mussels, are not only net producers of protein but also tend to produce positive environmental impacts since they assimilate carbon and nutrients (Troell et al., 2023; Macias et al., 2025).
As a final note, it is important to acknowledge that the sustainability challenges facing BFT aquaculture and aquaculture in general are not unique to this sector, but are common to many economic activities across the EU. While the sector remains profitable under the current governance structure, and thus, economically viable within the framework accepted by European society today, its significant environmental footprint and high estimated social costs make it particularly susceptible to change. Should societal preferences shift towards stronger enforcement of the polluter-pays principle, driven by demographic and climatic trends, the sector may come under greater scrutiny and face potential regulatory challenges.
Data availability statement
The original contributions presented in the study are included in the article/supplementary material. Further inquiries can be directed to the corresponding author.
Author contributions
JG: Conceptualization, Data curation, Formal analysis, Investigation, Methodology, Supervision, Writing – original draft, Writing – review & editing. FA: Formal analysis, Investigation, Writing – original draft, Writing – review & editing. NC: Conceptualization, Formal analysis, Investigation, Writing – original draft, Writing – review & editing. J-ND: Formal analysis, Investigation, Writing – original draft, Writing – review & editing. IL: Formal analysis, Investigation, Writing – original draft, Writing – review & editing. AS: Data curation, Formal analysis, Investigation, Writing – original draft, Writing – review & editing. SN: Data curation, Formal analysis, Investigation, Writing – original draft, Writing – review & editing. IV: Data curation, Formal analysis, Investigation, Writing – original draft, Writing – review & editing.
Funding
The author(s) declare that no financial support was received for the research, authorship, and/or publication of this article.
Acknowledgments
The authors wish to thank three anonymous referees and the editor for all their constructive comments. Any errors or views expressed in this paper are solely the responsibility of the authors.
Conflict of interest
The authors declare that the research was conducted in the absence of any commercial or financial relationships that could be construed as a potential conflict of interest.
Publisher’s note
All claims expressed in this article are solely those of the authors and do not necessarily represent those of their affiliated organizations, or those of the publisher, the editors and the reviewers. Any product that may be evaluated in this article, or claim that may be made by its manufacturer, is not guaranteed or endorsed by the publisher.
Footnotes
- ^ Including fish, crustaceans and mollusks, and not accounting for aquatic plants and other aquatic animals.
- ^ Article 2 of the latest reform of the CFP (European Commission, 2013) already highlights “The CFP shall ensure that fishing and aquaculture activities are environmentally sustainable in the long-term and are managed in a way that is consistent with the objectives of achieving economic, social and employment benefits, and of contributing to the availability of food supplies”.“Aquaculture should contribute to the preservation of the food production potential on a sustainable basis throughout the Union so as to guarantee long-term food security, including food supplies, as well as growth and employment for Union citizens, and to contribute to meeting the growing world demand for aquatic food”.
- ^ Aquaculture is in general defined as taking control of a part of the life cycle to enhance productivity (Klinger et al., 2013), and as producing juveniles is the most difficult part of the production process many species start the process towards domestication by harvesting juveniles in the wild (Pettersen et al., 2023).
- ^ A WWF report (Tudela and García, 2004) estimates that about 20 million of public funds have been allocated to the different stages of the tuna farming industry in EU Mediterranean waters between 1997-2004.
- ^ This is a major constraint for e.g. salmon aquaculture (Pincinato et al., 2021).
- ^ For the economic performance estimation of the fishing fleet, the costs Livestock costs, Feed costs and Other Operational costs are replaced by Other variable costs and Other non-variable costs, as in the AER (STECF, 2023).
- ^ For the fishing fleet, the number of companies refers to the number of vessels.
- ^ Article 2 of the latest reform of the CFP (European Commission, 2013) already highlights “The CFP shall ensure that fishing and aquaculture activities are environmentally sustainable in the long-term and are managed in a way that is consistent with the objectives of achieving economic, social and employment benefits, and of contributing to the availability of food supplies”.“Aquaculture should contribute to the preservation of the food production potential on a sustainable basis throughout the Union so as to guarantee long-term food security, including food supplies, as well as growth and employment for Union citizens, and to contribute to meeting the growing world demand for aquatic food”.
- ^ When small pelagics are used as food, this is to a significant extent in developing countries with Nigeria, the largest fish importer in Africa as a good example (Marin et al., 2024).
- ^ “Union policy on the environment shall aim at a high level of protection taking into account the diversity of situations in the various regions of the Union. It shall be based on the precautionary principle and on the principles that preventive action should be taken, that environmental damage should as a priority be rectified at source and that the polluter should pay".
- ^ This approach could be applied to other production systems, both food and non-food ones. For example, to try to mitigate the microplastic pollution at sea that is increasingly impacting aquaculture (Iheanacho et al., 2023).
References
Asche F., Bellemare M., Roheim C., Smith M. D., Tveteras S. (2015). Fair enough? Food security and the international trade of seafood. World Dev. 67, 151–160. doi: 10.1016/j.worlddev.2014.10.013
Asche F., Eggert H., Oglend A., Roheim C. A., Smith M. D. (2022). Aquaculture: externalities and policy options. Rev. Environ. Econ. Policy. 16, 282–305. doi: 10.1086/721055
Belmonte A., de la Gándara F. (2008). “El cultivo del atun rojo (Thunnus thynnus) [The culture of bluefin tuna (Thunnus thynnus)],” in Cuadernos de Acuicultura, vol. 2. (Fundacion Observatorio Español de Acuicultura, Madrid, Spain), 37.
Béné C., Barange M., Subasinghe R., Pinstrup-Andersen P., Merino G., Hemre G. I., et al. (2015). Feeding 9 billion by 2050–putting fish back on the menu. Food Sec. 7, 261–274. doi: 10.1007/s12571-015-0427-z
Birch M. B., Gramig B. M., Moomaw W. R., Doering III, O. C., Reeling C. J. (2011). Why metrics matter: evaluating policy choices for reactive nitrogen in the Chesapeake Bay Watershed. Environ. Sci. Technol. 45, 168–174. doi: 10.1021/es101472z
Carroll M., Anderson J., Martínez-Garmendia J. (2001). Pricing U.S. North atlantic bluefin tuna and implications for management. Agribusiness 17, 243–254. doi: 10.1002/agr.1014
Ćurić I., Grubišić L., Matanović K. (2021). Uzgoj tune (Thunnus thynnus Linnaeus 1758.): razvoj zaokruženoga proizvodnog ciklusa. Veterinar 59, 42–51. Available online at: https://hrcak.srce.hr/file/380415
Da C. T., Lundh T., Lindberg J. E. (2012). Evaluation of local feed resources as alternatives to fish meal in terms of growth performance, feed utilisation and biological indices of striped catfish (Pangasianodon hypophthalmus) fingerlings. Aquaculture 364, 150–156. doi: 10.1016/j.aquaculture.2012.08.010
Deere C. (2000). Net gains: Linking fisheries management international trade and sustainable development (Washington, D.C: International Union for Conservation of Nature and Natural Resources).
Druon J. N. (2009). Environmental analysis of Bluefin Tuna: Identifying its preferred habitat in the Mediterranean Sea. JRC Scientific and Technical Reports. Luxembourg: Office for Official Publications of the European Communities. pp. 20. doi: 10.2788/20881
Druon J. N., Fromentin J. M., Hanke A., Arrizabalaga H., Damalas D., Tičina V., et al. (2016). Habitat suitability of the Atlantic bluefin tuna by size class: an ecological niche approach. Prog. Oceanogr. 142, 30–46. doi: 10.1016/j.pocean.2016.01.002
Duarte C. M., Holmer M., Olsen Y., Soto D., Marbà N., Guiu J., et al. (2009). Will the oceans help feed humanity? BioScience 59, 967–976. doi: 10.1525/bio.2009.59.11.8
EPA (Environmental Protection Agency) (2022). Report on the social cost of greenhouse gases: Estimates incorporating recent scientific advances (Washington, USA). Available at: https://www.epa.gov/system/files/documents/2022-11/epa_scghg_report_draft_0.pdf.
EUMOFA (2023). The EU fish market. 2023 edition (Luxembourg: Publications Office of the European Union). doi: 10.2771/38507
European Commission (2019). Communication from the Commission to the European Parliament, the European Council, the Council, the European Economic and Social Committee of the Regions (The European Green Deal). Official Journal of the European Union. Luxembourg. Available online at: https://eur-lex.europa.eu/legal-content/EN/TXT/HTML/?uri=CELEX:52019DC0640.
European Commission (2020). Communication from the Commission to the European Parliament, the European Council, the Council, the European Economic and Social Committee of the Regions (A Farm to Fork Strategy for a fair, healthy and environmentally-friendly food system). Official Journal of the European Union. Luxembourg. Available online at: https://eur-lex.europa.eu/legal-content/EN/TXT/?uri=CELEX:52020DC0381.
European Commission (2021a). Communication from the Commission to the European Parliament, the European Council, the Council, the European Economic and Social Committee of the Regions in on a new approach for a sustainable blue economy in the EU Transforming the EU's Blue Economy for a Sustainable Future. Official Journal of the European Union. Luxembourg. Available online at: https://eur-lex.europa.eu/legal-content/EN/TXT/?uri=COM%3A2021%3A240%3AFIN.
European Commission (2021b). Communication from the Commission to the European Parliament, the European Council, the Council, the European Economic and Social Committee of the Regions in Strategic guidelines for a more sustainable and competitive EU aquaculture for the period 2021 to 2030. Official Journal of the European Union. Luxembourg. Available online at: https://eur-lex.europa.eu/legal-content/EN/TXT/?uri=COM:2021:236:FIN.
European Union (2012). Consolidated versions of the Treaty on European Union and the Treaty on the Functioning of the European Union. Off. J. C. 326, 0001–0390. Available at: https://eur-lex.europa.eu/eli/treaty/tfeu_2012/oj.
European Union (2013). Regulation (EU) No 1380/2013 of the European Parliament and of the Council of 11 December 2013 on the Common Fisheries Policy, amending Council Regulations (EC) No 1954/2003 and (EC) No 1224/2009 and repealing Council Regulations (EC) No 2371/2002 and (EC) No 639/2004 and Council Decision 2004/585/EC. Official Journal of the European Union. Luxembourg. Available online at: https://eur-lex.europa.eu/eli/reg/2013/1380/oj
Eurostat (2024). International Trade in Goods Database. Available online at: https://ec.europa.eu/eurostat/web/international-trade-in-goods/database (Accessed on December 8, 2023).
FAO (2024). FAO Fisheries and Aquaculture - FishStatJ - Software for Fishery and Aquaculture Statistical Time Series (Rome, Italy: FAO). Available at: https://www.fao.org/fishery/en/topic/166235?lang=en.
Farwell C. J. (2003). Management of captive tuna: Collection and transportation, holding facilities, nutrition, growth, and water quality. Cahiers Options Méditerranéennes 60, 65–68. http://om.ciheam.org/article.php?IDPDF=3600094.
Fernandez-Polanco J., Llorente I. (2016). Tuna economics and markets. In Advances in Tuna Aquaculture (San Diego, USA: Academic Press), 333–350.
Garcia S. M., Grainger R. J. R. (2005). Gloom and doom? The future of marine capture fisheries. Philos. Trans. R. Soc. B.: Biol. Sci. 360, 21–46. doi: 10.1098/rstb.2004.1580
Garcia S. M., Rosenberg. A. A. (2010). Food security and marine capture fisheries: characteristics, trends, drivers and future perspectives. Philos. Trans. R. Society B: Biol. Sci. 365, 2869–2880. doi: 10.1098/rstb.2010.0171
Garlock T., Asche F., Anderson J. L., Bjørndal T., Kumar G., Lorenzen K., et al. (2020). A global blue revolution: aquaculture growth across regions, species, and countries. Rev. Fisheries. Sci. Aquacult. 28, 107–116. doi: 10.1080/23308249.2019.1678111
Garlock T. M., Asche F., Anderson J. L., Eggert H., Anderson T. M., Che B., et al. (2024). Environmental, economic, and social sustainability in aquaculture: the aquaculture performance indicators. Nat. Commun. 15, 5274. doi: 10.1038/s41467-024-49556-8
Garlock T. M., Asche F., Anderson J. L., Hilsenroth J., Lorenzen K., Pincinato R. M., et al. (2023). Global and regional determinants of diversity in blue foods. Rev. Fisheries. Sci. Aquacult. 31, 523–534. doi: 10.1080/23308249.2023.2225627
Gephart J. E., Golden C. D., Asche F., Belton B., Brugere C., Froehlich H. E., et al. (2021). Scenarios for global aquaculture and its role in human nutrition. Rev. Fisheries. Sci. Aquacult. 29, 122–138. doi: 10.1080/23308249.2020.1782342
Godfray H. C. J., Beddington J. R., Crute I. R., Haddad L., Lawrence D., Muir J. F., et al. (2010). Food security: the challenge of feeding 9 billion people. Science 327, 812–818. doi: 10.1126/science.1185383
Gourevitch J. D., Koliba C., Rizzo D. M., Zia A., Ricketts T. H. (2021). Quantifying the social benefits and costs of reducing phosphorus pollution under climate change. J. Environ. Manage. 293, 112838. doi: 10.1016/j.jenvman.2021.112838
Grigorakis K. (2010). Ethical issues in aquaculture production. J. Agric. Environ. Ethics. 23, 345–370. doi: 10.1007/s10806-009-9210-5
Guillen J., Asche F., Carvalho N., Polanco J. M., Lloriente I., Nielsen R., et al. (2019a). Aquaculture subsidies in the European Union: Evolution, impact and future potential for growth. Mar. Policy. 104, 19–28. doi: 10.1016/j.marpol.2019.02.045
Guillen J., Calvo Santos A., Carpenter G., Carvalho N., Casey J., Lleonart J., et al. (2016). Sustainability now or later? Estimating the benefits of pathways to maximum sustainable yield for EU Northeast Atlantic fisheries. Mar. Policy 72, 40–47. doi: 10.1016/j.marpol.2016.06.015
Guillen J., Carvalho N., Carpenter G., Borriello A., Calvo Santos A. (2023). Economic impact of high fuel prices on the EU fishing fleet. Sustainability 15, 13660. doi: 10.3390/su151813660
Guillen J., Natale F., Carvalho N., Casey J., Hofherr J., Druon J. N., et al. (2019b). Global seafood consumption footprint. Ambio 48, 111–122. doi: 10.1007/s13280-018-1060-9
Henriksson P. J. G., Troell M., Banks L. K., Belton B., Beveridge M. C. M., Klinger D. H., et al. (2021). Interventions for improving the productivity and environmental performance of global aquaculture for future food security. One Earth 4, 1220–1232. doi: 10.1016/j.oneear.2021.08.009
Hilborn R. (2007). Defining success in fisheries and conflicts in objectives. Mar. Policy 31 (2), 153–158. doi: 10.1016/j.marpol.2006.05.014
ICCAT (2008). Recommendaton amending the recommendation by ICCAT to establish a multiannual recovery plan for bluefin tuna in the eastern Atlantic and Mediterranean. Madrid. Int. Committee. Conserv. Atlantic. Tuna. p, 28. Available online at: https://ttps://www.iccat.int/Documents/Recs/compendiopdf-e/2008-05-e.pdf.
Iheanacho S., Ogbu M., Bhuyan M. S., Ogunji J. (2023). Microplastic pollution: An emerging contaminant in aquaculture. Aquacult. Fisheries. 8, 603–616. doi: 10.1016/j.aaf.2023.01.007
Jarosz L. (2014). Comparing food security and food sovereignty discourses. Dialogues. Hum. Geogr. 4, 168–181. doi: 10.1177/2043820614537161
Jelić Mrčelić G., Nerlović V., Slišković M., Zubak Čižmek I. (2023). An overview of atlantic bluefin tuna farming sustainability in the mediterranean with special regards to the republic of Croatia. Sustainability 15, 2976. doi: 10.3390/su15042976
Karakassis I., Tsapakis M., Hatziyanni E., Papadopoulou K.-N., Plaiti W. (2000). Impact of cage farming of fish on the seabed in three Mediterranean coastal areas. ICES. J. Mar. Sci. 57, 1462–1471. doi: 10.1006/jmsc.2000.0925
Katavić I., Tičina V., Franičević V. (2003). “Bluefin tuna (Thunnus thynnus L.) farming on the Croatian coast of the adriatic sea—Present stage and future plan,” in Domestication of the bluefin tuna Thunnus thynnus thynnus. Cahiers Options Méditerranéennes, vol. 60 . Eds. Bridges C. R., García A., Gordin H. (CIHEAM, Zaragoza, Spain), 101–106.
King T., Cole M., Farber J. M., Eisenbrand G., Zabaras D., Fox E. M., et al. (2017). Food safety for food security: Relationship between global megatrends and developments in food safety. Trends Food Sci. Technol. 68, 160–175. doi: 10.1016/j.tifs.2017.08.014
Klinger D. H., Turnipseed M., Anderson J. L., Asche F., Crowder L. B., Guttormsen A. G., et al. (2013). Moving beyond the fished or farmed dichotomy. Mar. Policy 38, 369–374. doi: 10.1016/j.marpol.2012.06.015
Koehn J. S., Allison E. H., Golden C. D., Hilborn R. (2022). The role of seafood in sustainable diets. Environ. Res. Lett. 17, 035003. doi: 10.1088/1748-9326/ac3954
Kok B., Malcorps W., Tlusty M. F., Eltholth M. M., Auchterlonie N. A., Little D. C., et al. (2020). Fish as feed: Using economic allocation to quantify the Fish In: Fish Out ratio of major fed aquaculture species. Aquaculture 528, 735474. doi: 10.1016/j.aquaculture.2020.735474
Kušpilić G., Tičina V., Matijević S., Skejić S., Antolić B., Grubelić I., et al. (2007). “Impact of fish farming on marine ecosystems—Croatian experiences,” in Impact of Mariculture on Coastal Ecosystems: CIESM Workshop Monographs, vol. 32. (CIESM, Lisboa, Portugal), 29–34.
Luna M., Llorente I., Cobo A. (2019). Determination of feeding strategies in aquaculture farms using a multiple-criteria approach and genetic algorithms. Ann. Operations. Res. 314, 551–576. doi: 10.1007/s10479-019-03227-w
Macias D., Guillen J., Dutiel O., Garcia-Gorriz E., Ferreira-Cordeiro N., Miladinova S., et al. (2025). Macro-algae cultivation suitability assessment in EU marine regions. An integrated modelling approach. Aquaculture. 594, 41353. doi: 10.1016/j.aquaculture.2024.741353
Marin C. A., Adewumi O. M., Asche F., Garlock T. M., Kristofersson D. M., Lorenzen K., et al. (2024). Do Seafood Trade Enhance Seafood availability in Developing Countries? The case of Nigeria. Mar. Policy. 161, 106030. doi: 10.1016/j.marpol.2024.106030
Martínez-Garmendia J., Anderson J. L. (2005). Conservation, markets, and fisheries policy: the North Atlantic bluefin tuna and the Japanese sashimi market. Agribusiness 21, 17–36. doi: 10.1002/agr.20034
Mc Carthy U., Uysal I., Badia-Melis R., Mercier S., O'Donnell C., Ktenioudaki A. (2018). Global food security–Issues, challenges and technological solutions. Trends Food Sci. Technol. 77, 11–20. doi: 10.1016/j.tifs.2018.05.002
Metian M., Pouil S., Boustany A., Troell M. (2014). Farming of bluefin tuna–reconsidering global estimates and sustainability concerns. Rev. Fisheries Sci. Aquaculture 22 (3), 184–192. doi: 10.1080/23308249.2014.907771
Miyake M. P., Guillotreau P., Sun C. H., Ishimura G. (2010). Recent developments in the tuna industry. Stocks, fisheries, management, processing, trade and markets (Rome: FAO), 125. FAO Fisheries and Aquaculture Technical Paper. No. 543.
Mourente G., Megina C., Díaz-Salvago E. (2001). Lipids in female northern bluefin tuna (Thunnus thynnus thynnus L.) during sexual maturation. Fish. Physiol. Biochem. 24, 351–363. doi: 10.1023/A:1015011609017
Mourente G., Tocher D. R. (2009). Tuna nutrition and feeds: current status and future perspectives. Rev. Fisheries Sci. 17 (3), 373–390. doi: 10.1080/10641260902752207
Mylonas C. C., de la Gándara F., Corriero A., Ríos A. B. (2010). Atlantic bluefin tuna (Thunnus thynnus) farming and fattening in the Mediterranean Sea. Rev. Fisheries. Sci. 18, 266–280. doi: 10.1080/10641262.2010.509520
Naylor R., Burke M. (2005). Aquaculture and ocean resources: raising tigers of the sea. Annual Review of Environment and Resources 30, 185–218. doi: 10.1146/annurev.energy.30.081804.121034
Naylor R., Fang S., Fanzo J. (2023). A global view of aquaculture policy. Food Policy 116, 102422. doi: 10.1016/j.foodpol.2023.102422
Nordhaus W. D. (2017). Revisiting the social cost of carbon. PNAS 114 (7), 1518–1523. doi: 10.1073/pnas.1609244114
Norita T. (2003). “Feeding of bluefin tuna: Experiences in Japan and Spain,” in Cahiers Options Méditerranéennes, Domestication of the Bluefin Tuna Thunnus thynnus thynnus, vol. 60 . Eds. Bridges C., Gordin H., Garcia A. (CIHEAM, Instituto Agronomico de Zaragoza, Zaragoza, Spain), 153–156.
Nøttestad L., Boge E., Ferter K. (2020). The comeback of Atlantic bluefin tuna (Thunnus thynnus) to Norwegian waters. Fisheries. Res. 231, 105689. doi: 10.1016/j.fishres.2020.105689
Ottolenghi F. (2008). ). Capture-based aquaculture of bluefin tuna. Capture-based aquaculture. Global overview. FAO Fisheries. Tech. Paper. 508, 169–182. Available online at: https://www.fao.org/4/i0254e/i0254e00.htm.
Partelow S., Asif F., Béné C., Bush S., Manlosa A. O., Nagel B., et al. (2023). Aquaculture governance: five engagement arenas for sustainability transformation. Curr. Opin. Environ. Sustainabil. 65, 101379. doi: 10.1016/j.cosust.2023.101379
Pelusio N. F., Bonaldo A., Gisbert E., Andree K. B., Esteban M. A., Dondi F., et al. (2022). Different fish meal and fish oil dietary levels in European Sea bass: welfare implications after acute confinement stress. Front. Mar. Sci. 8, 779053. doi: 10.3389/fmars.2021.779053
Percin F., Konyalioglu S. (2008). Serum biochemical profiles of captive and wild northern bluefin tuna (Thunnus thynnus l. 1758) in the eastern mediterranean. Aquaculture Res. 39 (9), 945–953. doi: 10.1111/j.1365-2109.2008.01954.x
Pettersen I. K., Asche F., Bronnmann J., Sogn-Grundvåg G., Straume H.-M. (2023). Is capture-based aquaculture viable? The case of Atlantic cod in Norway. Aquaculture 572, 739520. doi: 10.1016/j.aquaculture.2023.739520
Pincinato R. B., Asche F., Roll K. H. (2021). Escapees in salmon aquaculture: A multi-output approach. Land. Econ. 97, 425–435. doi: 10.3368/le.97.2.425
Pindyck R. S. (2019). The social cost of carbon revisited. J. Environ. Econ. Manage. 94, 140–160. doi: 10.1016/j.jeem.2019.02.003
Ricke K., Drouet L., Caldeira K., Tavoni M. (2018). Country-level social cost of carbon. Nat. Clim Change 8, 895–900. doi: 10.1038/s41558-018-0282-y
Sala A., Damalas D., Labanchi L., Martinsohn J., Moro F., Sabatella R., et al. (2022). Energy audit and carbon footprint in trawl fisheries. Sci. Data 9 (1), 428. https://www.nature.com/articles/s41597-022-01478-0.
Selles J., Bonhommeau S., Guillotreau P. (2018). “Optimal bioeconomic management of the Eastern Atlantic Bluefin tuna fishery: where do we stand after the recovery plan?,” in FAERE Annual Conference, Aix-en-Provence, France. Available online at: https://hal.science/hal-02048714.
STECF (2023a). Economic Report on the EU aquaculture (STECF-22-17) (Luxembourg: Publications Office of the European Union). doi: 10.2760/51391
STECF (2023b). The 2023 Annual Economic Report on the EU Fishing Fleet (STECF 23-07) (Luxembourg: Publications Office of the European Union). doi: 10.2760/423534
Sun C.-H., Chiang F.-S., Squires D., Rogers A., Jan M.-S. (2019). More landings for higher profit? Inverse demand analysis of the bluefin tuna auction price in Japan and economic incentives in global bluefin tuna fisheries management. PloS One 14, e0221147. doi: 10.1371/journal.pone.0221147
Tacon A. (2020). Trends in global aquaculture. And aquafeed production: 2000-2017. Reviews in Fisheries. Sci. Aquacult. 28, 43–56. doi: 10.1080/23308249.2019.1649634
Tacon A. G. J., Hasan M. R., Subasinghe R. P. (2006). Use of fishery resources as feed inputs to aquaculture development: trends and policy implications (Rome: FAO), 99. FAO Fisheries Circular No. 1018.
Ticina V., Katavic I., Grubisic. L. (2007). Growth indices of small northern bluefin tuna (Thunnus thynnus, L.) in growth-out rearing cages. Aquaculture 269, 538–543. doi: 10.1016/j.aquaculture.2007.05.029
Troell M., Henriksson P. J., Buschmann A. H., Chopin T., Quahe S. (2023). Farming the ocean–seaweeds as a quick fix for the climate? Rev. Fisheries. Sci. Aquacult. 31, 285–295. doi: 10.1080/23308249.2022.2048792
Tudela S., García R. (2004). Tuna farming in the Mediterranean: the bluefin tuna stock at stake (Rome: WWF Mediterranean Program Office).
Tyedmers P. (2001). “Energy consumed by north atlantic fisheries,” in Fisheries impacts on north atlantic ecosystems: catch, effort, and national/regional data sets. fisheries centre research reports, vol. 9 . Eds. Zeller D., Watson R., Pauly D., 12–34. Available at: https://open.library.ubc.ca/media/stream/pdf/52383/1.0348130/5.
United Nations (2022). World population prospects 2022: Summary of results (United Nations Department of Economic and Social Affairs, Population Division). Available at: https://desapublications.un.org/publications/world-population-prospects-2022-summary-results.
van den Bergh J. C., Botzen W. J. W. (2015). Monetary valuation of the social cost of CO2 emissions: a critical survey. Ecol. Economics 114, 33–46. doi: 10.1016/j.ecolecon.2015.03.015
Van Grinsven H. J., Holland M., Jacobsen B. H., Klimont Z., Sutton M. A., Jaap Willems W. (2013). Costs and benefits of nitrogen for Europe and implications for mitigation. Environ. Sci. Technol. 47, 3571–3579. doi: 10.1021/es303804g
Vita R., Marín A., Jiménez-Brinquis B., Cesar A., Marín-Guirao L., Borredat M. (2004). Aquaculture of Bluefin tuna in the Mediterranean: evaluation of organic particulate wastes. Aquacult. Res. 35, 1384–1387. doi: 10.1111/j.1365-2109.2004.01155.x
Wijkström U. N. (2009). The use of wild fish as aquaculture feed and its effects on income and food for the poor and the undernourished. In Hasan M. R., Halwart M. (eds.). Fish as feed inputs for aquaculture: practices, sustainability and implications. Fisheries and Aquaculture Technical Paper (Rome: FAO). 518, 371–407. Available online at: https://www.fao.org/4/i1140e/i1140e.pdf.
Wijkström U. N. (2013). “Is feeding fish with fish a viable practice?,” in Proceedings of the Global Conference on Aquaculture 2010. Farming the waters for people and food (FAO, Rome and NACA, Bangkok), 33–55.
Keywords: Atlantic bluefin tuna (BFT), fattening, farming, carnivorous species, economic contribution, social contribution, food security, European Union (EU)
Citation: Guillen J, Asche F, Carvalho N, Druon J-N, Llorente I, Sciberras A, Višnić Novaković S and Vukov I (2024) How sustainable is tuna aquaculture? A methodology to assess the sustainability of seafood production systems. Front. Aquac. 3:1422372. doi: 10.3389/faquc.2024.1422372
Received: 23 April 2024; Accepted: 29 July 2024;
Published: 03 September 2024.
Edited by:
Max Fredrik Troell, Beijer Institute of Ecological Economics, SwedenReviewed by:
Chau Thi Da, Ton Duc Thang University, VietnamStanley Iheanacho, University of Kiel, Germany
Aubrey Lesperance, Seychelles Fishing Authority (SFA), Seychelles
Copyright © 2024 Guillen, Asche, Carvalho, Druon, Llorente, Sciberras, Višnić Novaković and Vukov. This is an open-access article distributed under the terms of the Creative Commons Attribution License (CC BY). The use, distribution or reproduction in other forums is permitted, provided the original author(s) and the copyright owner(s) are credited and that the original publication in this journal is cited, in accordance with accepted academic practice. No use, distribution or reproduction is permitted which does not comply with these terms.
*Correspondence: Jordi Guillen, Sm9yZGkuR3VpbGxlbkBlYy5ldXJvcGEuZXU=