 Su Yongzhang1,2
 Wu Xiao
94% of researchers rate our articles as excellent or good
Learn more about the work of our research integrity team to safeguard the quality of each article we publish.
Find out more
BRIEF RESEARCH REPORT article
Front. Appl. Math. Stat., 20 March 2025
Sec. Statistics and Probability
Volume 11 - 2025 | https://doi.org/10.3389/fams.2025.1556150
This study aims to construct a load spectrum that conforms to the actual working conditions, enabling an accurate fatigue life assessment of key components and enhancing the overall safety and reliability of the metro vehicle. A field test is first conducted on the mainline of a metro to collect the distribution of the random load data. Based on the load test data from the online operation of the test vehicle, the method of compiling the program load spectrum of the key components of the metro vehicle body is studied. The load data of the key components of the vehicle body are screened and interpreted to eliminate errors and peak disturbances in the signal. Using the rainflow counting method to analyze the time load series, the load data under actual road conditions are simplified and recorded. The probability distribution function of the load amplitude and load mean of the key components of the vehicle body is established using statistical methods. Based on its distribution characteristics, the frequency of rainflow counting is extrapolated. Combined with its joint probability distribution function, the load extreme value is obtained, and the 8-level two-dimensional load spectrum of the key components of the vehicle body is constructed. Furthermore, the variable mean method is used to simplify the two-dimensional load spectrum to obtain the one-dimensional load spectrum, and the HBM Ncode program is used to prepare the program load spectrum. The results show that the mean value of the load conforms to a Gaussian distribution with a mean value of 3.150 MPa and a standard deviation of 1.591 MPa. The load amplitude follows a two-parameter Weibull distribution, with a shape parameter of 1.882 and a scale parameter of 1.949. This provides a theoretical basis for the fatigue life assessment of the key components of the metro vehicle body.
Preparing the program load spectrum is an important part of fatigue analysis. The basic principle is to ensure that the loads applied by the load spectrum are consistent with the actual loads in the field and replicate the actual operating loads as closely as possible (1–3). The program load spectrum refers to the statistical description of the load variation law and frequency distribution of the structure or equipment within a certain time range. The real load data are obtained by monitoring and recording the load under actual working conditions, and then the program load spectrum is generated after processing and analysis. The preparation of the program load spectrum is a key step in ensuring the safe and reliable operation of the structure. It accurately simulates the load conditions under actual working conditions to evaluate its fatigue life and safety performance. This is vital for preventing accidents and improving equipment reliability (4, 5).
At present, the domestic mechanical equipment based on measured load data for preparing the bench simulation loading test program load spectrum has become relatively well-developed. Yu et al. (6) proposed compiling the program load spectrum by considering the strengthening effect of small amplitude load (SLAL) below the fatigue limit, based on the strengthening characteristics of small amplitude structural load under both constant load and random loads. Based on the load time history of the failure part of the torsion beam rear axle of a compact vehicle, Yang et al. (7) established a one-dimensional program load spectrum using Goodman’s equal life method, following the principle of damage equivalence. Du et al. (8) extensively discussed the compilation skills of the loading spectrum required for the bench test of the bucket rod of the hydraulic excavator under actual typical working conditions. Based on the analysis of operation time characteristics, the paragraph combination of the loading process is realized. The rainflow counting technology is used to analyze the load data, and a rainflow matrix frequency extrapolation method based on the non-parametric kernel function is established. In addition, Guo et al. (9) used a specific cargo vehicle as the research object. Starting from the measured random load spectrum, they employed non-parametric statistical inference and K.S. test technology to determine the distribution of equivalent stress amplitude under different road conditions. Using the estimated load extreme values and the fitted stress probability density function, the Conover method is applied to classify the load, resulting in an 8-level two-dimensional load spectrum under various conditions. Zou et al. also proposed a simplified method for compiling the load spectrum during the accelerated durability test of the transmission (10). The load spectrum of the transmission under actual road conditions is collected using a wireless telemetry system, and the frequency matrix of load distribution is determined through rainflow counting analysis. According to these load characteristics, the 8-level one-dimensional load spectrum is successfully compiled using the variable mean method.
While significant progress has been made in compiling program load spectra for fatigue analysis, existing methods still have notable limitations. Many conventional approaches depend on bench tests or simulated data, which fail to capture the complex, dynamic load conditions encountered in real metro operations, especially during peak rush hours when overcrowding causes operating loads to exceed design loads. Furthermore, these methods often lack comprehensive data preprocessing to filter out transient spikes and noise, ultimately compromising the accuracy of the resulting load spectrum.
To address these challenges, this study introduces an innovative methodology that leverages real-time load data collected from metro line test vehicles to analyze and process the dynamic load conditions of critical vehicle body components. By integrating a meticulous signal preprocessing strategy with the rainflow counting method and advanced statistical techniques, we first compile a two-dimensional program load spectrum that accurately represents field conditions. Subsequently, the variable mean method is applied to convert this two-dimensional spectrum into a one-dimensional representation, which is further transformed into a complete program load spectrum using professional analysis software. This refined approach not only enhances the precision of load spectrum generation but also provides a robust foundation for accelerated fatigue life testing and improved safety evaluations of metro vehicle bodies.
Aluminum alloy, as a renewable material, offers advantages such as lightweight, corrosion resistance, and environmental friendliness (11), making it the primary material for metro vehicle body components. The vehicle body, made from aluminum alloy, includes the chassis, side walls, roof, front end, and end walls, as shown in Figure 1.
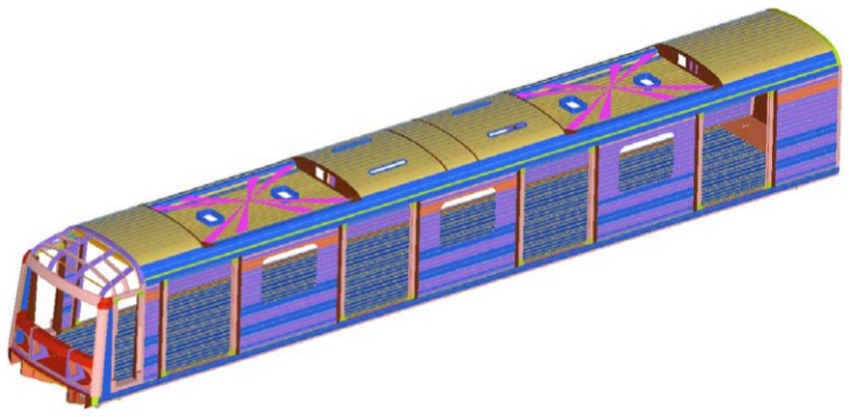
Figure 1. Test metro vehicle body.
The test vehicle is grouped within the regular operation of the whole train, with the trailing vehicle and the driving vehicle located at the ends. The test wheels are old and have not been reconditioned. Under regular operating conditions, the test is conducted in the overhaul workshop of the vehicle depot, with the vehicle operating as usual while carrying passengers. A total of six test personnel are involved. The arrangement of test points on the vehicle is shown in Figure 2.

Figure 2. The distribution position of metro car body testing points.
The list of data acquisition equipment is shown in Table 1. The dynamic stress test strain gauge is applied using the half-bridge temperature compensation method, and the acceleration sensor is fixed with high-strength adhesive. After fixing the sensor and connecting the signal line, debugging the test instrument is a very important step to ensure that the signal of each channel is normal (12). A pre-test is carried out on the test line of the vehicle section, and the test data of the test line are collected and analyzed to eliminate the faults and abnormal conditions in the test system.
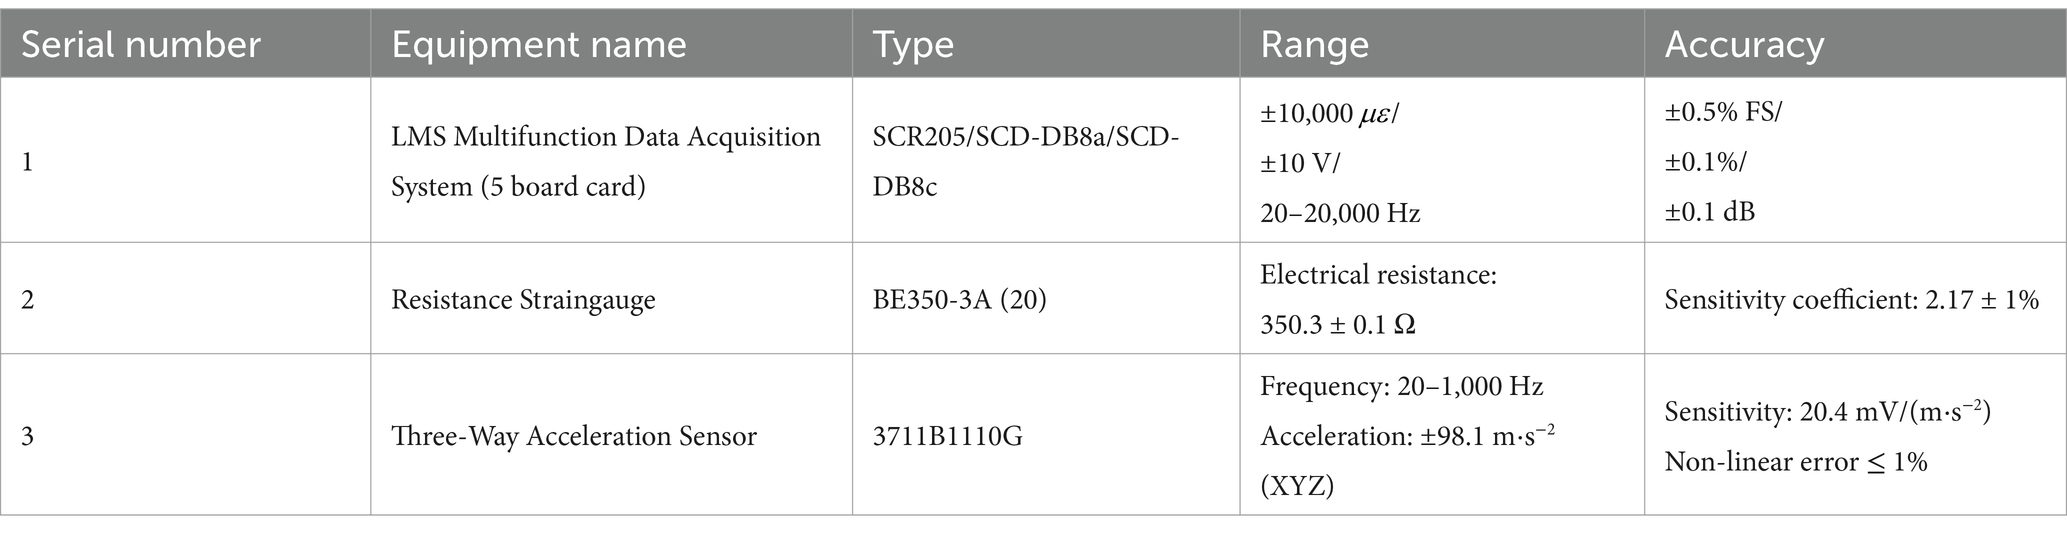
Table 1. List of data acquisition equipment.
The field test is conducted on the mainline, where load-running tests are performed with a sampling frequency of 1,024 Hz. The data are recorded throughout the entire test, along with the corresponding time stamps. The collected load data undergoes processing and analysis, which includes noise removal, filtering, and data smoothing (13–15). Subsequently, spectral analysis and statistical analysis are carried out to obtain the frequency distribution and variation patterns of the load. The distribution of the random load data collected during this test is shown in Figure 3. As shown in Figure 3, the load amplitude follows a Weibull distribution, with a maximum value of 3.115 MPa, a minimum of 0.175 MPa, a median of 1.515 MPa, and a range of 2.94 MPa. The load mean conforms to a normal distribution, with a maximum value of 5.88 MPa, a minimum of 0.49 MPa, a median of 3.26783 MPa, and a range of 5.39 MPa.

Figure 3. Characteristics of measured load data.
The rainflow counting method is a two-parameter approach that considers both dynamic strength (amplitude) and static strength (mean) as variables. It simplifies the load variations measured during loading cycles, correlating them with the inherent characteristics of fatigue loading itself (16–18), which is crucial in fatigue life assessment and fatigue test load spectrum generation. This method simplifies the measured load time history into a series of load cycles, which are then used for fatigue life estimation and to create fatigue test load spectra (19–21). After applying rainflow counting to the processed random load data, the classic From-To matrix cloud plot is obtained, as shown in Figure 4.
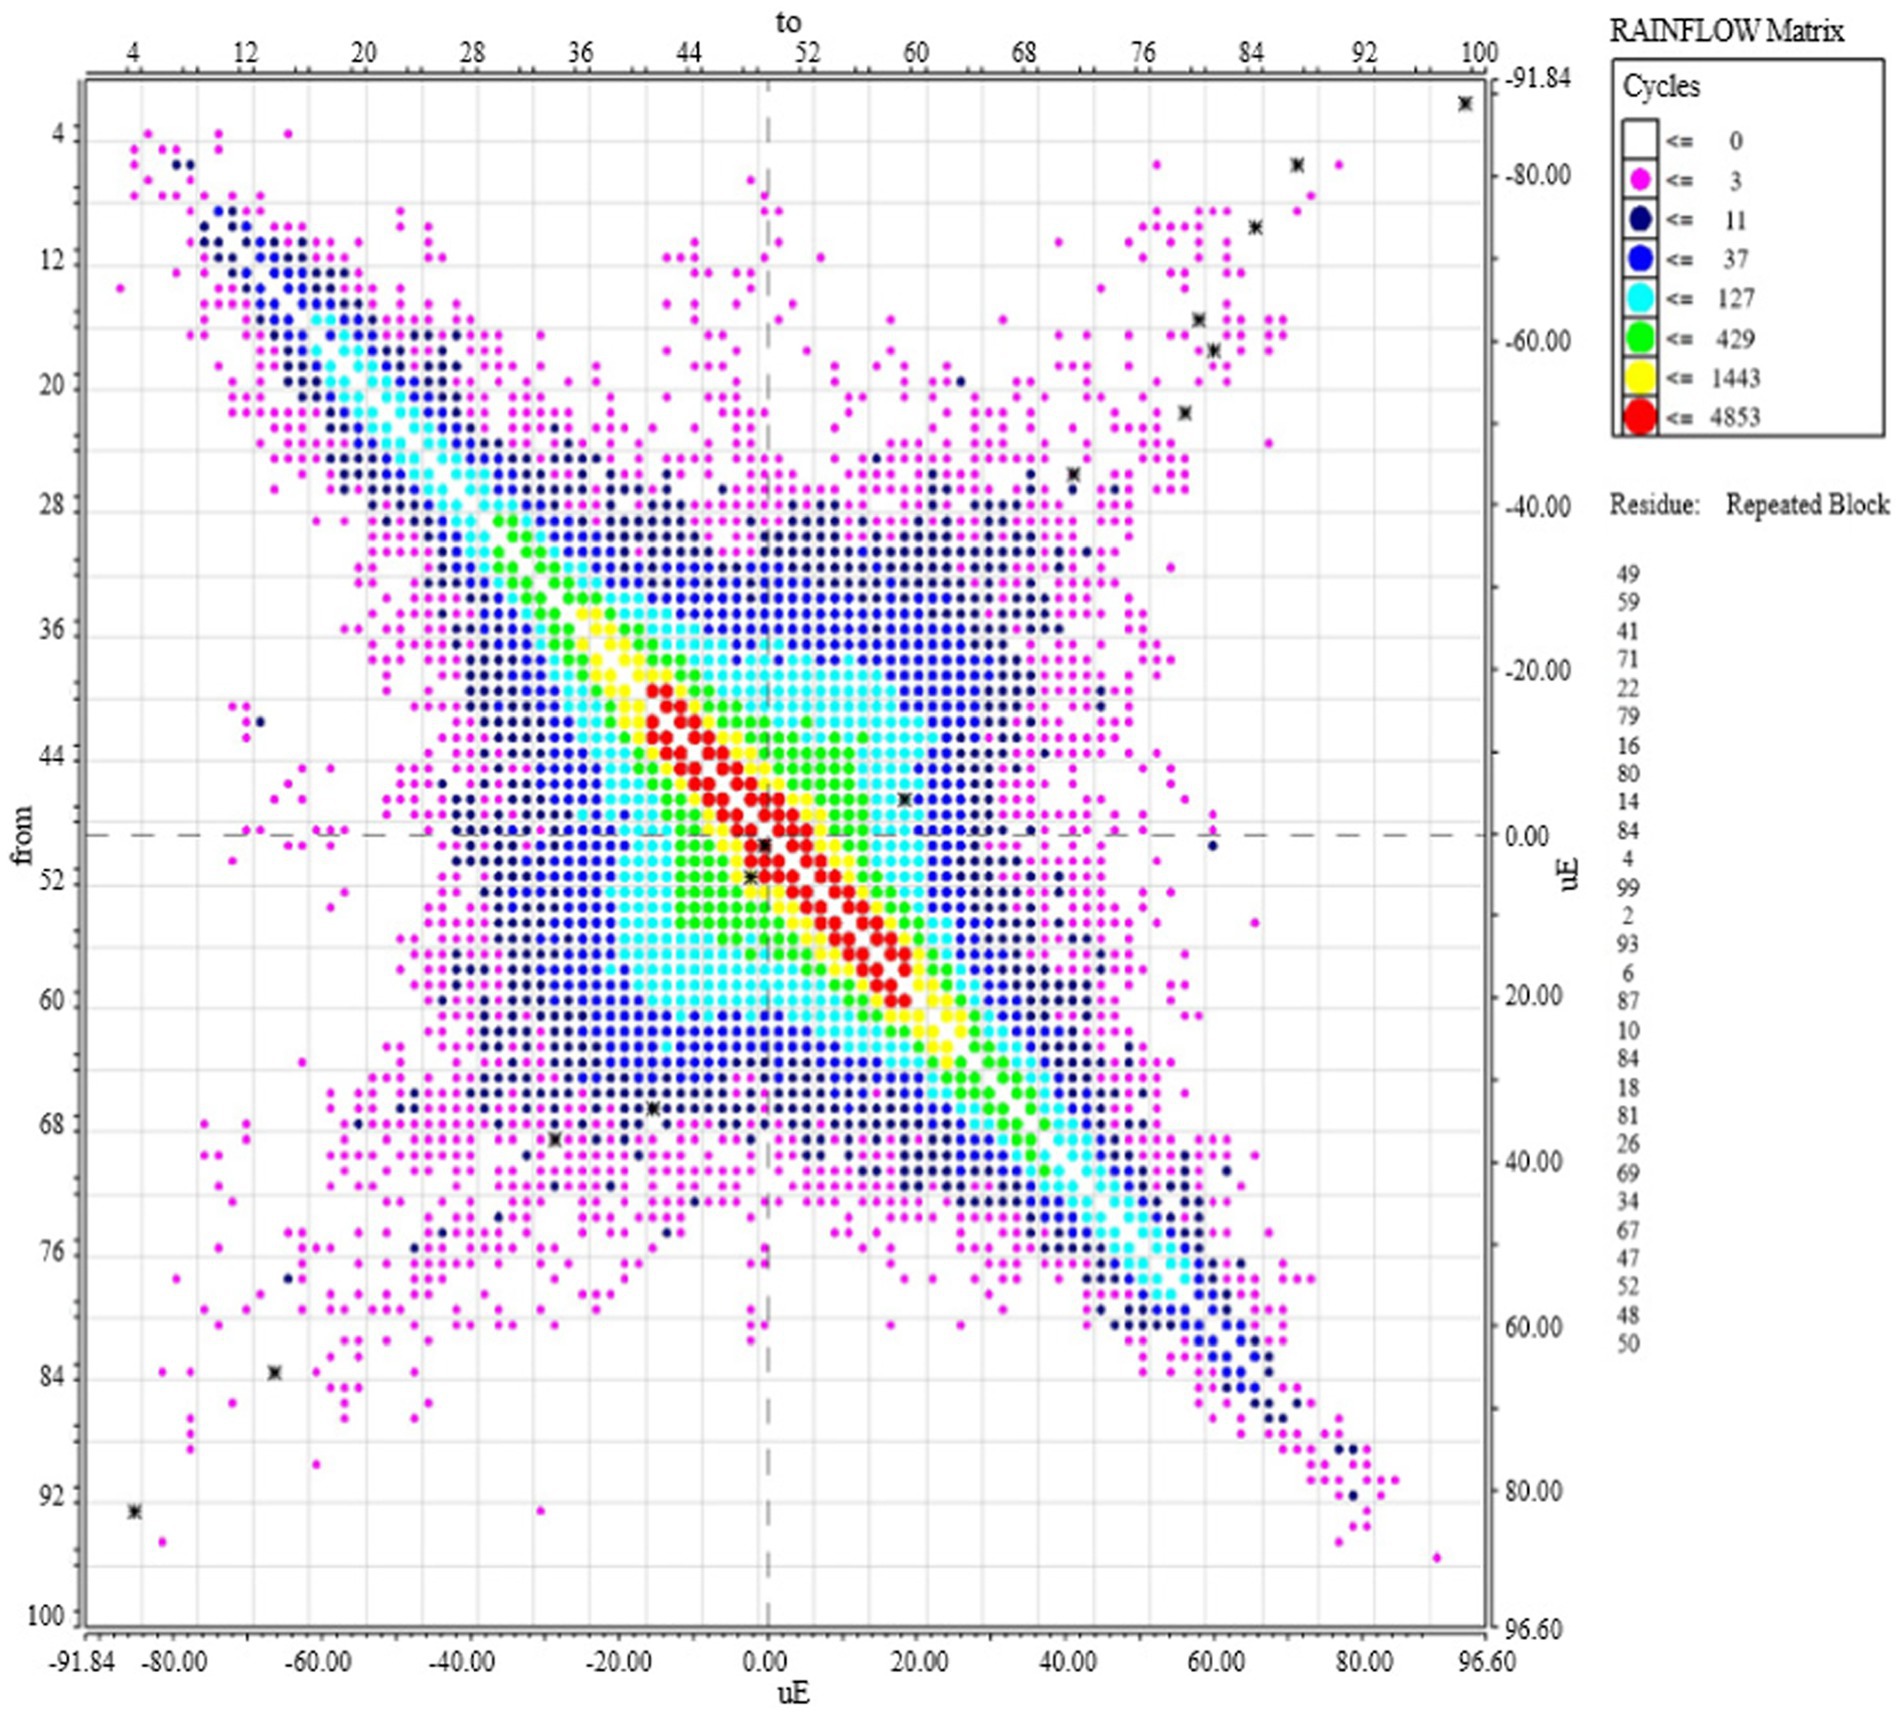
Figure 4. Rainflow matrix cloud diagram (rainflow counting results).
The matrix cloud diagram presented in Figure 4 indicates that the stress spectrum comprises both high- and low-amplitude stresses, with the majority of load cycles being of low amplitude, as evidenced by the red, yellow, and green regions. Since the material damage caused by small amplitude stresses is negligible, they are removed to save computational time (22). The rainflow matrix cloud plot and the statistical frequency distribution histogram after removing small amplitude stresses are shown in Figures 5, 6.
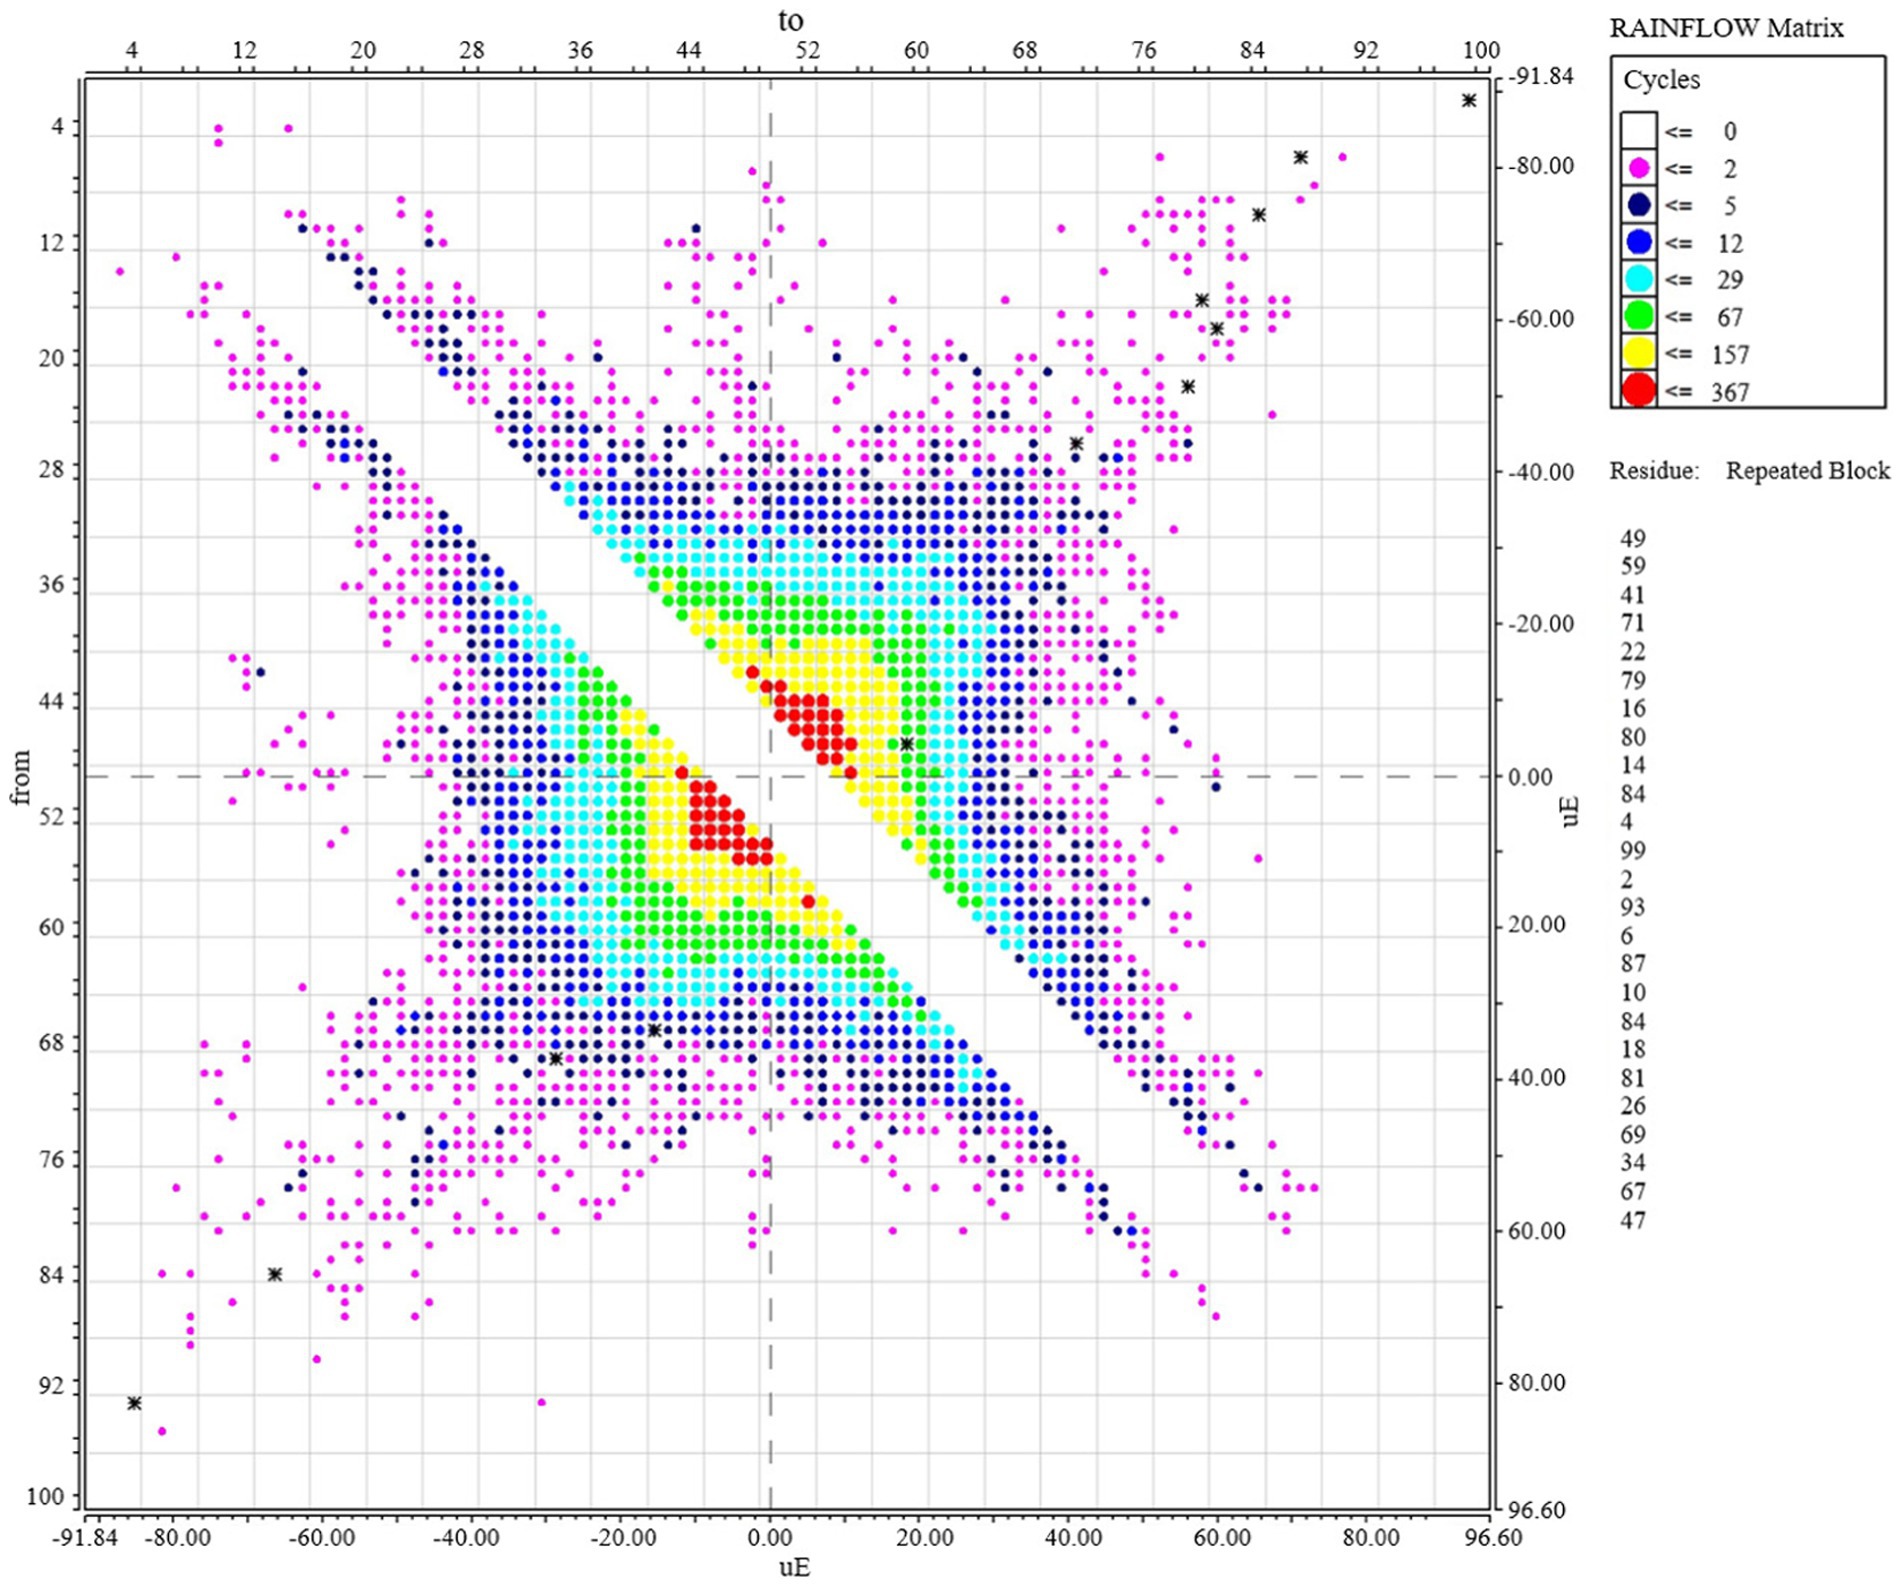
Figure 5. Rainflow matrix cloud diagram after removing low-amplitude stresses.
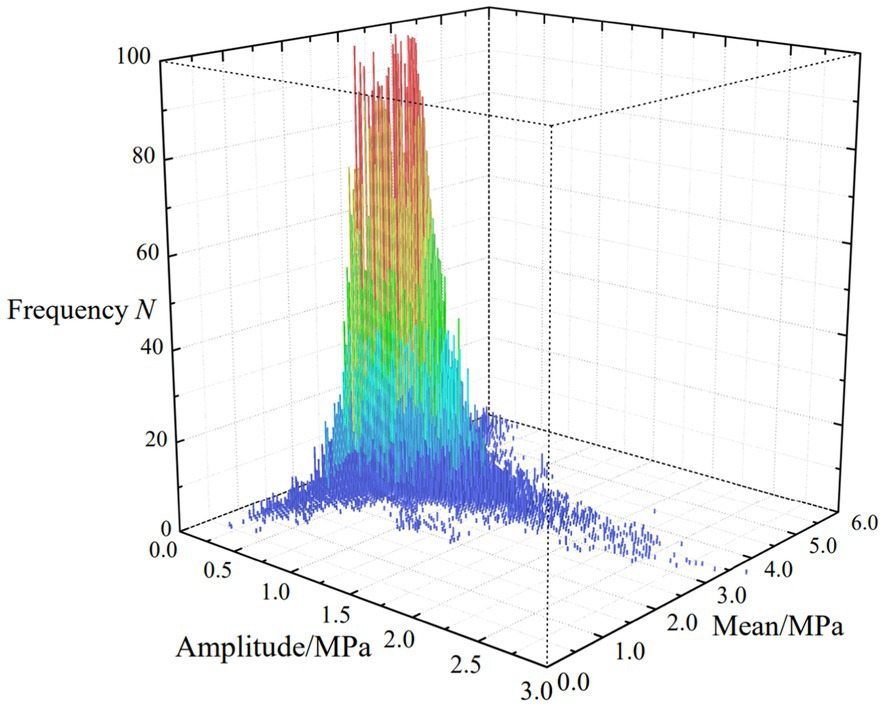
Figure 6. Frequency distribution histogram after removing low-amplitude stress.
Before extrapolating the stress spectrum, it is necessary to investigate the distribution characteristics of the stress amplitude and mean under full cycle conditions. This is typically achieved by applying statistical methods to analyze the counting results. Using statistical techniques to analyze the rainflow counting results is the primary approach to obtaining the distribution characteristics of the load spectrum. Numerous studies have shown that stress amplitudes follow a Weibull distribution, while stress means follow a Gaussian distribution (23, 24). The frequency histograms of stress amplitude and mean are shown in Figure 7.
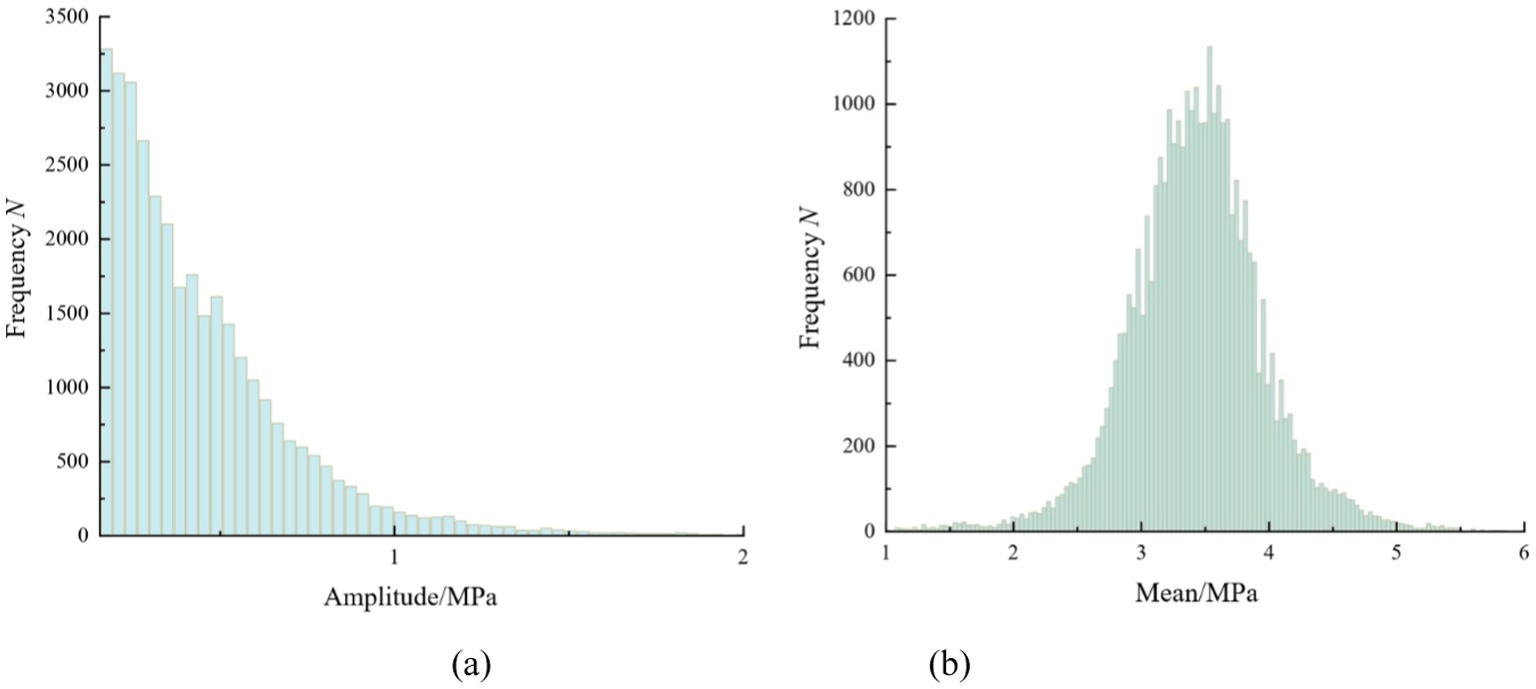
Figure 7. Frequency distribution histograms: (a) histogram of stress amplitude; (b) histogram of stress mean.
The data distribution is tested using probability plots, specifically a two-parameter Weibull probability plot for the stress amplitude and a normal probability plot for the stress mean. The test results are shown in Figure 8. It is found that the data closely follows the best-fit line, leading to the conclusion that the amplitude follows a Weibull distribution with a shape parameter of 1.980 and a scale parameter of 1.685. In addition, the mean follows a normal distribution, with a mean of 3.267 and a standard deviation of 1.480.

Figure 8. Probability map: (a) the two-parameter Weibull distribution of the stress amplitude; (b) the normal distribution for the stress mean.
Due to the small sample size of the measured load data, the fatigue test results and the statistical data derived from the stress amplitude may exhibit significant differences from the actual stress values. This makes it difficult to accurately simulate most of the stresses observed in actual field tests (25, 26). Therefore, before compiling the load spectrum, it is necessary to reasonably extrapolate the measured data to obtain representative and huge data. To ensure that the fatigue behavior of the generated stress spectrum better reflects actual conditions, it is necessary to remove the low-amplitude stresses before extrapolating the stress spectrum (27), according to the following formula:
where is the cumulative frequency after extrapolation; is the cumulative frequency of the original load cycle load; and k is the expansion factor.
The rainflow frequency is d by 100 times through Equation (1), the frequency histograms for both the amplitude and mean values are shown in Figure 9, and the stress spectrum rainflow matrix cloud plot is presented in Figure 10. From the analysis of Figure 9, it can be inferred that the extrapolated stress amplitudes still follow a Weibull distribution, and the stress means continue to follow a normal distribution. The hypothesis is confirmed through a probability plot data check, and the distribution parameters are listed in Table 2. Comparing the distribution parameters of load amplitude and load mean before and after extrapolation, it is found that the shape parameter of the load amplitude Weibull distribution decreases slightly, the scale parameter increases slightly, the mean value of the normal distribution of the load mean decreases slightly, and the variance increases slightly, which indicates the validity of the load data extrapolation. This is because the collected load data are dominated by low-amplitude loads. In the extrapolation process, low-amplitude loads get more extrapolation results, while a small amount of high-amplitude loads complement the extreme defects of the original data and increase the volatility of the data.
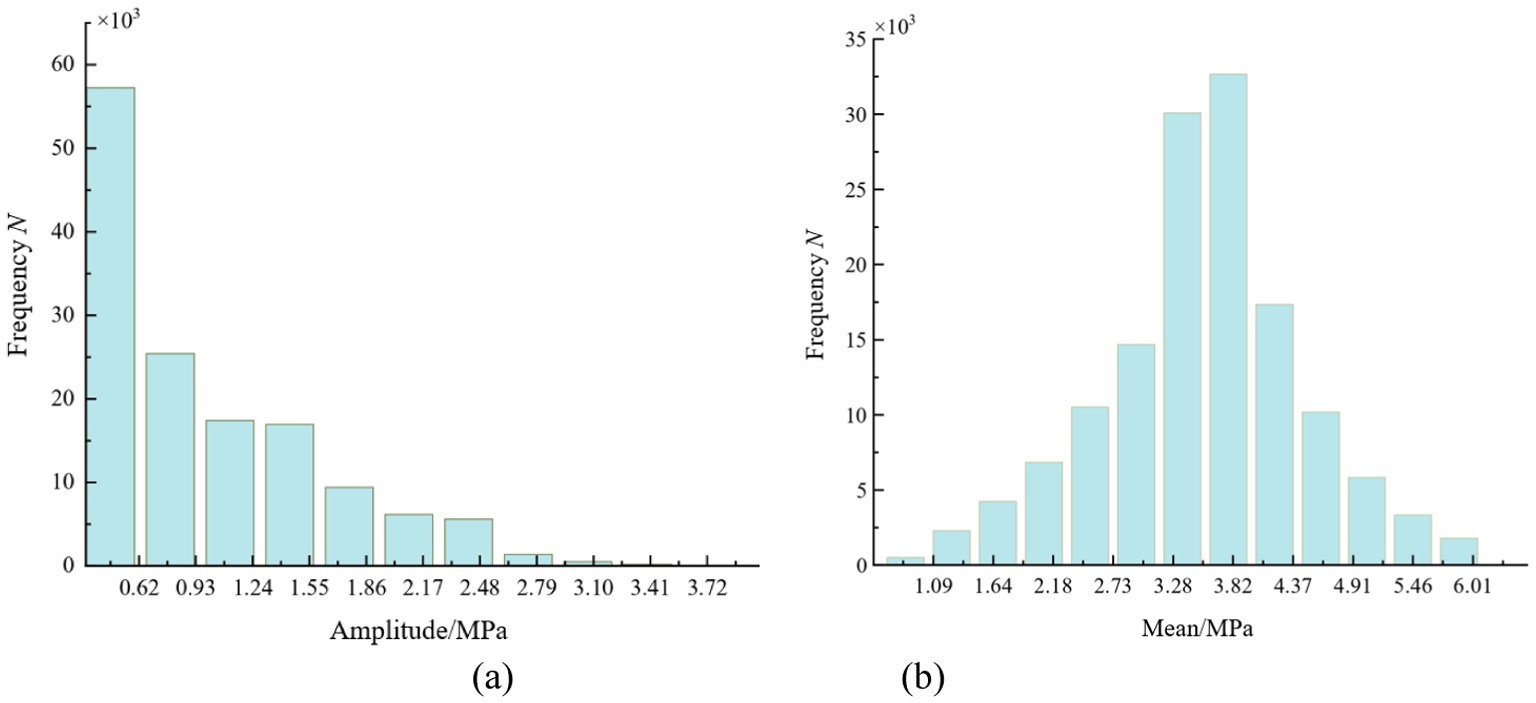
Figure 9. Frequency distribution histogram after extrapolation: (a) histogram of stress amplitude; (b) histogram of stress mean.
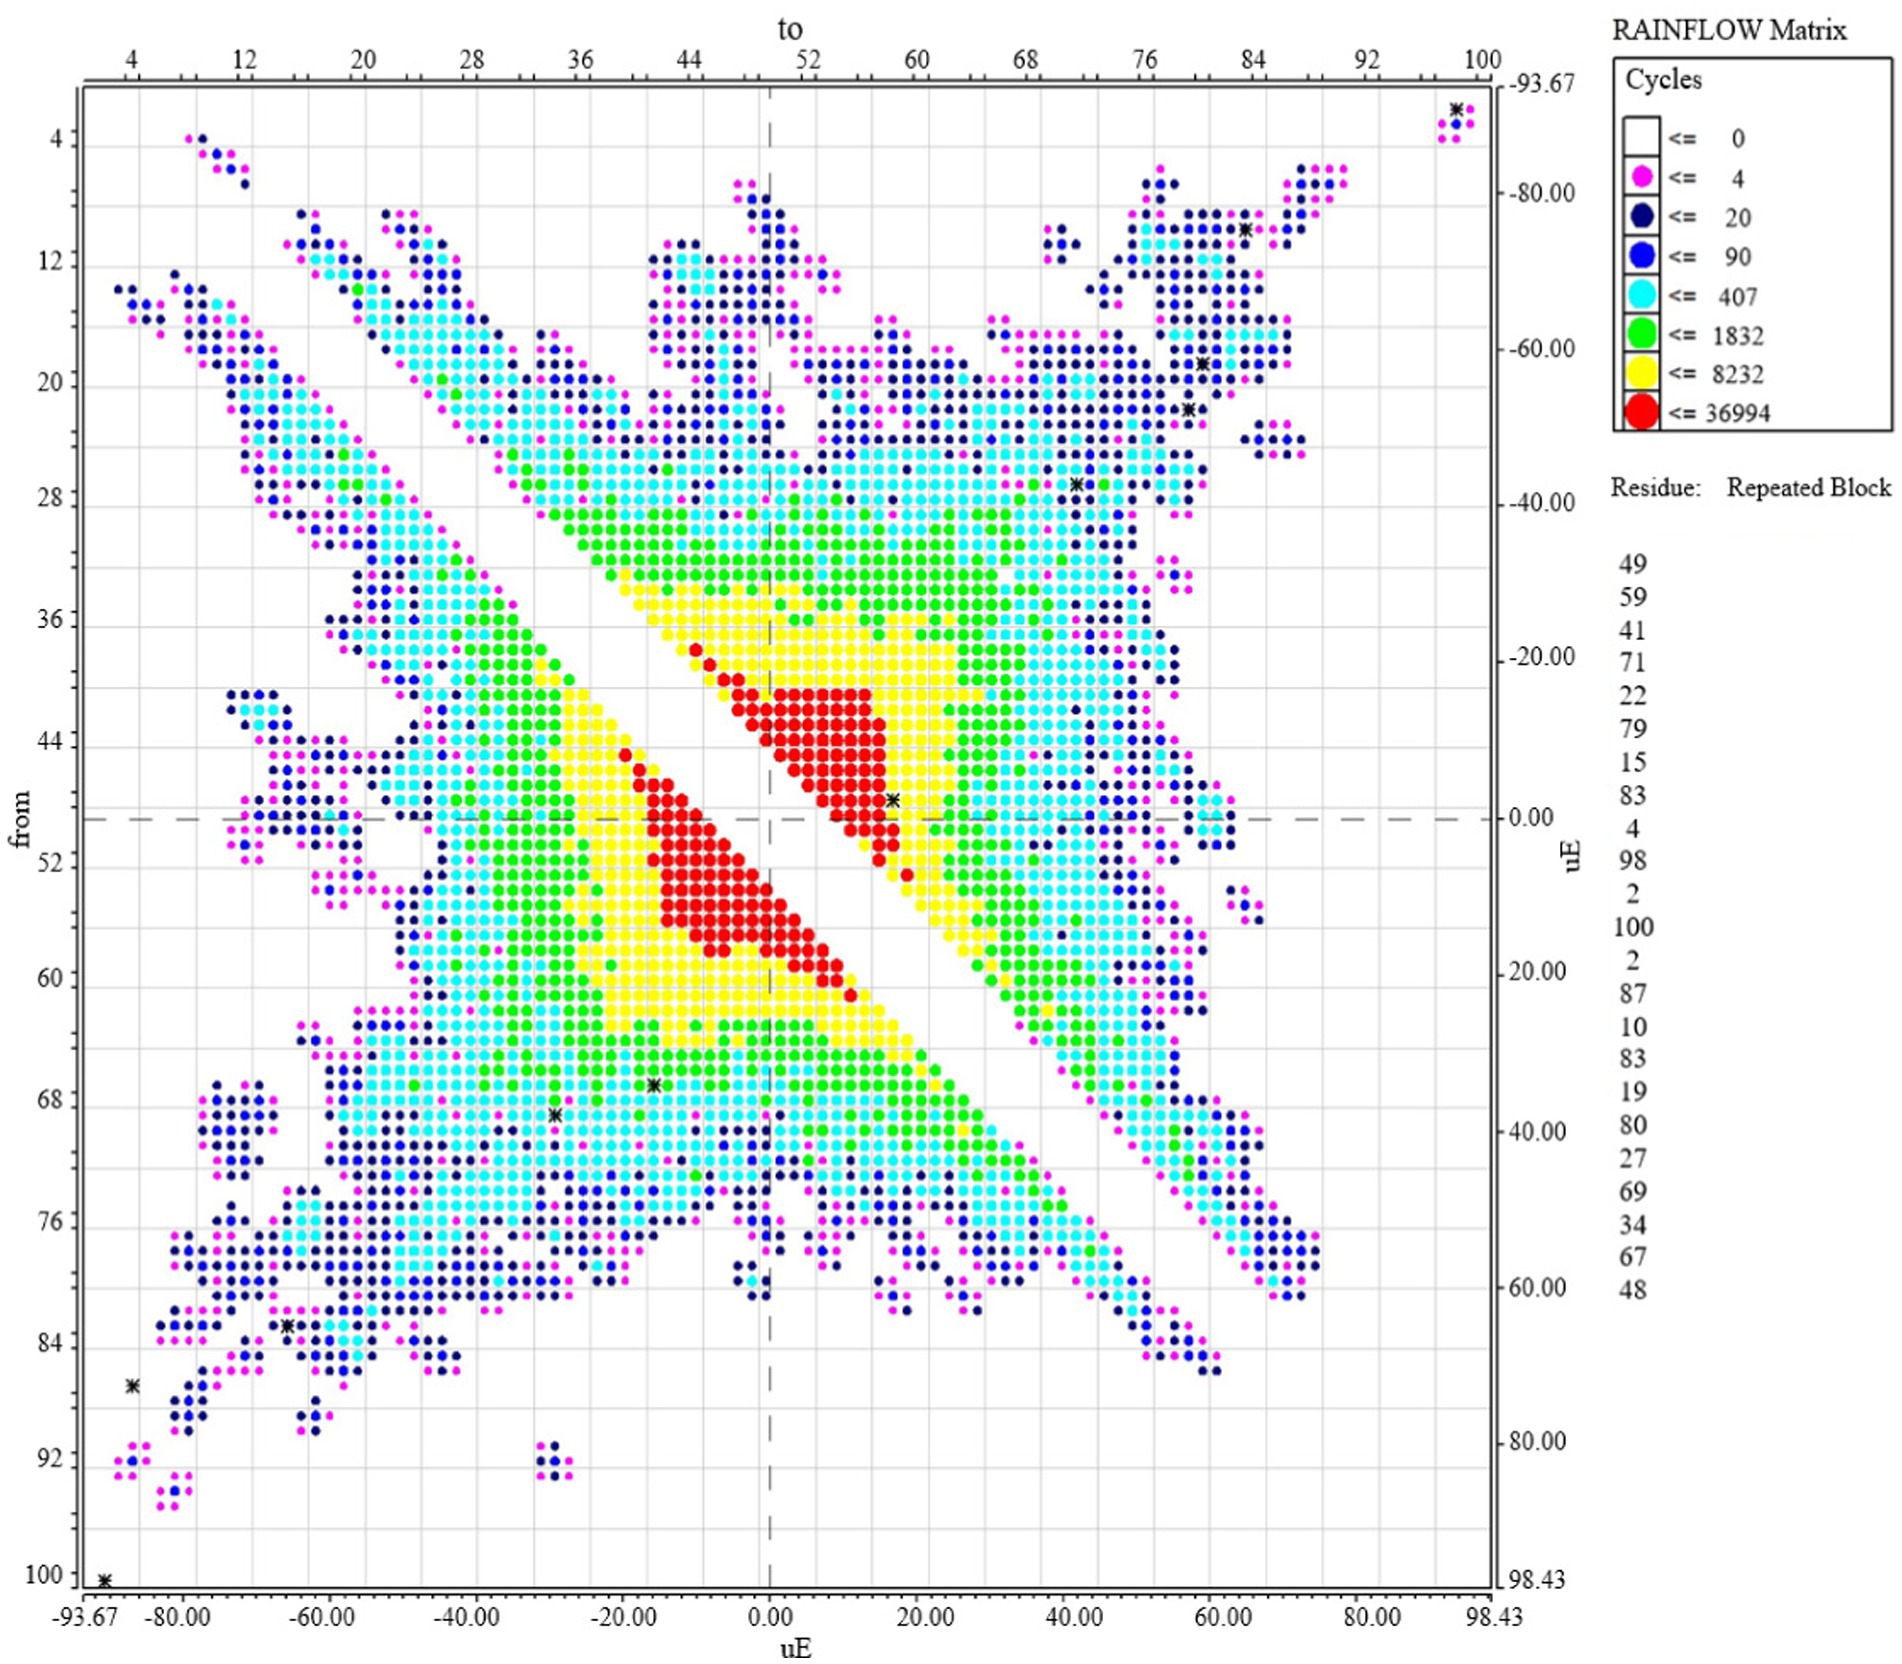
Figure 10. The rainflow matrix cloud diagram after extrapolation of 100 times.
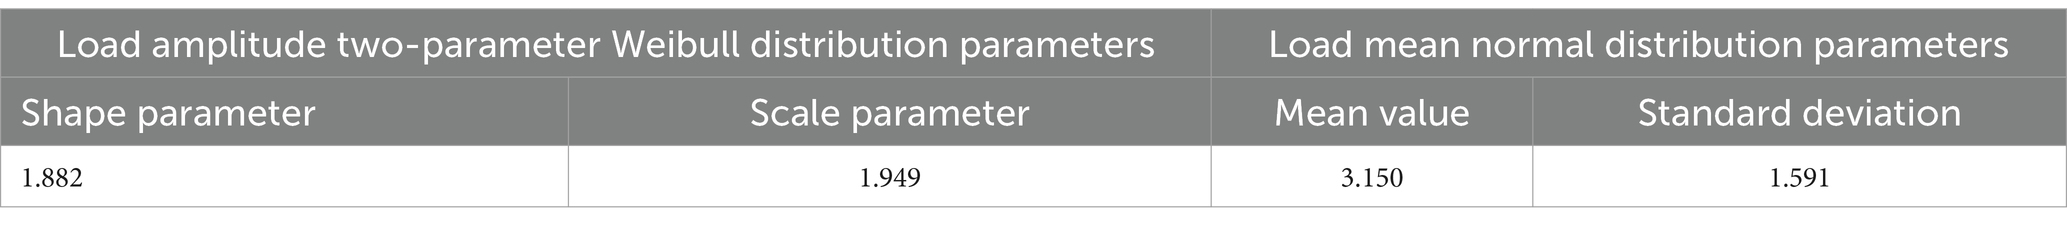
Table 2. Distribution parameters.
These results provide a deeper understanding of the load characteristics of key components of the metro vehicle body under different stress conditions. They contribute to further optimization of the design, enhancing structural reliability and safety, and offer important references and support for the performance improvement and safety assurance of metro vehicles.
Due to the inherent limitations of the measured load data, it is highly likely that extreme loads are not captured. Therefore, it is crucial to incorporate extreme loads using statistical theory. This ensures that the generated program load spectrum can fully reflect the distribution characteristics of the measured load data (28). Since the stress amplitude and mean stress in the vehicle load spectrum are independent and follow a two-parameter Weibull distribution and a normal distribution, respectively, the joint probability density function can be derived based on their individual probability density functions as:
where x is the random variable value of stress amplitude, y is the random variable value of the mean stress, is the joint probability density function of stress amplitude and stress mean, is the shape parameter of Weibull distribution, is the proportional factor of Weibull distribution, the mean value of the normal distribution is represented by , and the standard deviation of the normal distribution is represented by .
The maximum value of the mean and amplitude can be obtained by the probability density function of the stress mean and the stress amplitude:
where refers to the standard normal deviation and P denotes the probability of extreme value after extrapolation.
Based on the extrapolated rainflow counting results, it is known that the load cycle count is n = 140,301. The probability of extreme values after extrapolation is 1/140,301, which is approximately 7.128 × 10⁻⁶. According to Equations (3, 4), the amplitude extreme value is 7.248 MPa, and the mean extreme value is 10.056 MPa. To fully reflect the fatigue effects, the Conover ratio coefficient is applied to divide the load amplitude into eight levels, and the mean is equally divided into eight levels (29). The empirical proportional coefficient of the eight levels of the Conover coefficient is 1, 0.95, 0.85, 0.725, 0.575, 0.425, 0.275, and 0.125. The maximum value of the load cycle amplitude, 7.248 MPa, is multiplied by the ratio coefficient, resulting in the following load amplitudes for each level: 7.248 MPa, 6.885 MPa, 6.161 MPa, 5.255 MPa, 4.167 MPa, 3.080 MPa, 1.993 MPa, and 0.906 MPa, respectively. The number of cycles nij corresponding to the average amplitude of each stage can be obtained by integrating the following Equation (2):
in which and represent the lower and upper limits of the load cycle amplitude of group , respectively; and and denotes the lower and upper limits of the cyclic mean value of the load in group j, respectively.
The two-dimensional 8 × 8 load spectrum of the test car compiled by the frequency of each level is calculated by the Equation (5) as shown in Table 3.

Table 3. Two-dimensional 8 × 8 load spectrum.
To conduct simulated loading tests on the test bench, the load spectrum must be processed into a procedural load spectrum suitable for the test bench (1, 30). When the load amplitude and load mean are considered as bivariate random variables, the statistical analysis becomes very complex. Common methods, both domestically and internationally, to establish load spectra include the equivalent life conversion method, the variable mean method, and the fluctuation center method (20). For the same load amplitude in a group, the variable mean method is more reasonable and effective; that is, the load cycle mean of each level is weighted and averaged, and the weight is determined by the corresponding frequency to obtain the group average value of the load cycle mean and the curve change amplitude. The amplitude is superimposed on the average value of the curve group mentioned above, which can more accurately reflect the fluctuation of the actual load than the direct use of the overall mean. The group mean value of each load mean level can be calculated by:
where represents the average value of the load mean at the -th level; represents the load mean at the -th level; and represents the frequency of the -th level load amplitude and -th level load mean.
The one-dimensional program load spectrum compiled after calculating the average value of each group by Equation (6) is shown in Table 4.
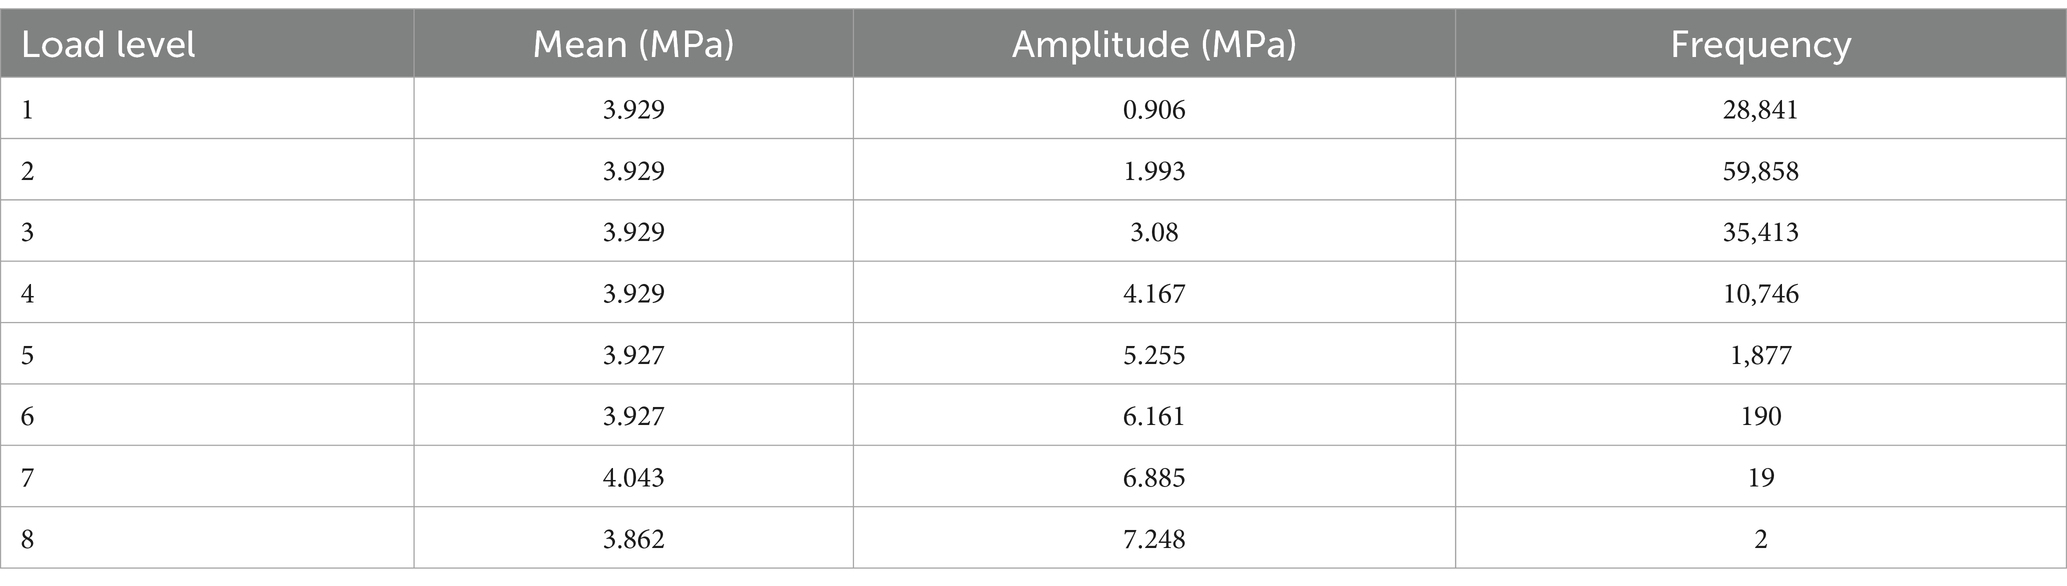
Table 4. Load spectrum of one-dimensional program prepared by the variable mean method.
Due to the influence of the loading sequence on the fatigue strength of mechanical structures (31), a low-high-low loading sequence is adopted, with short-cycle loading, to minimize the effects caused by the loading sequence. The program loading spectrum for the key components of the metro vehicle body is shown in Figure 11.

Figure 11. Program loading spectrum of key components of the vehicle body.
Through statistical analysis of the amplitude and mean values of the load rainflow count matrix obtained during the online operation of metro test vehicles, the data distribution before and after extrapolation was tested using probability graphs and goodness-of-fit tests. It is found that the load mean follows a normal distribution with a mean of 3.150 MPa and a standard deviation of 1.591 MPa. The load amplitude follows a two-parameter Weibull distribution, with a shape parameter of 1.882 and a scale parameter of 1.949. Based on the rainflow count results, the rainflow frequency is extrapolated by a factor of 100 to obtain the total data set representing the full life cycle. The extreme value of the mean load is determined using its distribution characteristics. The load amplitude is divided into eight levels using the Conover coefficient, and the mean is divided into eight equal intervals to create a two-dimensional load spectrum. This spectrum is then simplified using the variable mean method. Based on this, the program loading spectrum is generated using HBM Ncode software, providing a valuable reference for fatigue testing research on metro vehicle bodies. Future research can be further developed in the following aspects:
1. The limitations of linear extrapolation of rainflow frequencies still exist, such as an incomplete representation of impact loads during data collection and the inability to measure the effects of equipment aging, wear, and other issues on load distribution over a short period. Future studies could involve collecting load data covering typical operating conditions under peak and off-peak periods, different vehicle speeds, and varying weather conditions to improve the comprehensiveness of the load spectrum.
2. In actual operating conditions, the distribution of stress means is often not uniform. Using equally spaced intervals to divide the load cycle means may lead to an uneven distribution of data points in certain ranges, affecting the balance of the analysis and causing deviations in the life calculation. Further exploration of non-uniform interval methods could make the low-stress mean range wider to reduce redundant calculations for low-stress values and the high-stress mean range more concentrated to more accurately calculate the impact of high-mean loads.
3. Further integration of S-N curves and the Miner fatigue damage accumulation method to predict the fatigue life of critical parts of the vehicle body, and based on the fatigue life calculation results, developing scientifically tailored maintenance plans for the actual load conditions of different vehicles to reduce vehicle maintenance costs.
The original contributions presented in the study are included in the article/supplementary material, further inquiries can be directed to the corresponding author.
SY: Conceptualization, Formal analysis, Methodology, Resources, Validation, Writing – original draft. HW: Conceptualization, Data curation, Investigation, Validation, Writing – review & editing. DH: Software, Validation, Visualization, Writing – review & editing. WX: Funding acquisition, Project administration, Supervision, Validation, Writing – review & editing.
The author(s) declare that financial support was received for the research and/or publication of this article. This research was funded by the Natural Science Foundation of Sichuan Province, grant number 22NSFSC0120.
SY and HW were employed by CRRC Zhuzhou Locomotive Co., Ltd.
The remaining authors declare that the research was conducted in the absence of any commercial or financial relationships that could be construed as a potential conflict of interest.
The authors declare that no Gen AI was used in the creation of this manuscript.
All claims expressed in this article are solely those of the authors and do not necessarily represent those of their affiliated organizations, or those of the publisher, the editors and the reviewers. Any product that may be evaluated in this article, or claim that may be made by its manufacturer, is not guaranteed or endorsed by the publisher.
1. Zhang, J, Lu, J, Han, W, and Li, H. Program load spectrum compilation for accelerated life test of parabolic leaf spring. Int J Automot Technol. (2019) 20:337–47. doi: 10.1007/s12239-019-0033-8
2. Mei, G, Luo, Q, Qiao, W, Huang, Z, Lu, J, and Wang, J. Study of load spectrum compilation method for the pantograph upper frame based on multi-body dynamics. Eng Fail Anal. (2022) 135:106099. doi: 10.1016/j.engfailanal.2022.106099
3. Lu, Q, Sun, Z, Xu, C, Zhao, S, and Song, Y. A new compilation method of general standard test load spectrum for aircraft engine. Int J Turbo Jet Eng. (2022) 39:13–23. doi: 10.1515/tjj-2019-0002
4. Zhu, D, Yang, Z, Chen, C, Li, X, Du, X, and Li, G. Compilation of program-loading spectrum for milling of a motorized spindle based on cutting force model. J Braz Soc Mech Sci Eng. (2019) 41:1–14. doi: 10.1007/s40430-019-1686-y
5. Liu, X, Qian, X, and Xi, Y. Accelerated fatigue bench test method for rubber vibration isolators based on load spectrum compilation. Proc Inst Mech Eng Part D J Automob Eng. (2024) doi: 10.1177/09544070241256426
6. Yu, J, Zheng, S, Liang, G, and Feng, J. Development of a program-loading spectrum for the accelerated durability test of lower control arm. J Test Eval. (2016) 44:1307–18. doi: 10.1520/JTE20140092
7. Yang, X, Li, J, Lin, Y, and Zhang, Q. Rapid durability test of rear axle based on failure mode. Modern Manuf Eng. (2014) 12:37–40.
8. Du, M, Huang, X, Yang, Q, and Wang, Y. Load spectrum compilation of bucket rod program of hydraulic excavator based on extrapolation of rain flow frequency. Mech Des. (2019) 36:87–93.
9. Guo, H, Chen, W, Fan, X, Deng, Y, and Wu, H. Study on the strengthening coefficient of reliability test in automobile proving ground. J Mech Eng. (2004) 40:73–6. doi: 10.3901/JME.2004.10.073
10. Zou, X, Yang, Z, Yuan, D, Peng, J, and Zhou, Y. Development of transmission acceleration test spectrum considering low-load enhancement effect. Mech Transm. (2016) 40:4–9.
11. Shangguan, Y, Wang, W, He, A, Ma, W, and Tian, H. Lightweight design for the aluminum alloy-carbon fiber hybrid structure of the EMU car body. J Mech Sci Technol. (2023) 37:6441–52. doi: 10.1007/s12206-023-1116-z
12. Zheng, J, Tang, J, Zhou, Z, Heng, J, Chu, X, and Wu, T. Intelligent cognition of traffic loads on road bridges: from measurement to simulation–a review. Measurement. (2022) 200:111636. doi: 10.1016/j.measurement.2022.111636
13. Yu, J, Zhao, L, Ma, J, Zheng, S, and Yu, H. Load spectrum compilation for vehicle road simulation test by applying a new time domain threshold editing method. Proc Inst Mech Eng Part D J Automob Eng. (2024) 238:277–90. doi: 10.1177/09544070221118442
14. Yang, M, Sun, X, Deng, X, Lu, Z, and Wang, T. Extrapolation of tractor traction resistance load Spectrum and compilation of loading Spectrum based on optimal threshold selection using a genetic algorithm. Agriculture. (2023) 13:1133. doi: 10.3390/agriculture13061133
15. Wang, S, Liu, X, Jiang, C, Wang, X, and Wang, X. Prediction and evaluation of fatigue life for mechanical components considering anelasticity-based load spectrum. Fatigue Fract Eng Mater Struct. (2021) 44:129–40. doi: 10.1111/ffe.13340
16. Chen, Z, Long, K, Zhang, C, Yang, X, Lu, F, Wang, R, et al. A fatigue-resistance topology optimization formulation for continua subject to general loads using rainflow counting. Struct Multidiscip Optim. (2023) 66:210. doi: 10.1007/s00158-023-03658-x
17. Huang, W. The frequency domain estimate of fatigue damage of combined load effects based on the rain-flow counting. Mar Struct. (2017) 52:34–49. doi: 10.1016/j.marstruc.2016.11.004
18. Bibbo, ND, Larsen, ML, Baumgartner, J, and Arora, V. An improved rainflow counting method for multiaxial stress states using the minimum circumscribed circle method to identify shear stress ranges. Int J Fatigue. (2022) 163:106997. doi: 10.1016/j.ijfatigue.2022.106997
19. Jia, P, Liu, H, Zhu, C, Wu, W, and Lu, G. Contact fatigue life prediction of a bevel gear under spectrum loading. Front Mech Eng. (2020) 15:123–32. doi: 10.1007/s11465-019-0556-8
20. Wang, BJ, Li, Q, Ren, ZS, and Sun, SG. Improving the fatigue reliability of metro vehicle bogie frame based on load spectrum. Int J Fatigue. (2020) 132:105389. doi: 10.1016/j.ijfatigue.2019.105389
21. Liu, J, Liu, X, Zhang, M, and Wang, S. An improved fatigue life model for mechanical components considering load strengthening characteristics. Fatigue Fract Eng Mater Struct. (2022) 45:174–85. doi: 10.1111/ffe.13592
22. Joo, YS, Lee, WJ, Seo, BH, and Lim, SG. Introduction of developing fatigue load spectrum for full-scale fatigue test of composite aircraft. Int J Aeronaut Space Sci. (2020) 21:681–92. doi: 10.1007/s42405-020-00257-8
23. Xuming, NIU, Qi, LU, Zhigang, SUN, and Yingdong, SONG. A novel compilation method of comprehensive mission spectrum of aero-engine maneuvering load based on use-related mission segment. Chin J Aeronaut. (2023) 36:161–70. doi: 10.1016/j.cja.2022.09.016
24. Zhang, Q, Wan, J, and Xiong, Y. Study on load spectrum of fatigue test procedure for engineering mechanical transmission system. Constr Mach. (2021) 52:16–22.
25. Wu, Q, Zhao, Y, and Liu, X. Fatigue life prediction of metal materials under random loads based on load spectrum extrapolation. Int J Fatigue. (2024) 187:108473. doi: 10.1016/j.ijfatigue.2024.108473
26. Wei, H, Carrion, P, Chen, J, Imanian, A, Shamsaei, N, Iyyer, N, et al. Multiaxial high-cycle fatigue life prediction under random spectrum loadings. Int J Fatigue. (2020) 134:105462. doi: 10.1016/j.ijfatigue.2019.105462
27. Song, D, Wang, T, Zhu, S, and Liu, Z. Extrapolation framework and characteristic analysis of load Spectrum for agriculture general power machinery. PRO. (2024) 12:2078. doi: 10.3390/pr12102078
28. Zheng, G, Liao, Y, Chen, B, Zhao, S, and Wei, H. Multi-axial load spectrum extrapolation method for fatigue durability of special vehicles based on extreme value theory. Int J Fatigue. (2024) 178:108014. doi: 10.1016/j.ijfatigue.2023.108014
29. Liu, Z, and Yin, H. The program load spectrum of a passenger car subframe is compiled. Mech Des. (2020) 37:61–6.
30. Wang, P, Xiang, Q, Królczyk, G, Lu, P, Wang, B, and Li, Z. Dynamic modeling of a hydraulic excavator stick by introducing multi-case synthesized load Spectrum for bench fatigue test. Mach Des. (2022) 10:741. doi: 10.3390/machines10090741
Keywords: metro transportation, program load spectrum, rainflow counting method, vehicle fatigue, accelerated testing
Citation: Yongzhang S, Wenjia H, Honglin D and Xiao W (2025) Research on program load spectrum for key components of a metro vehicle body. Front. Appl. Math. Stat. 11:1556150. doi: 10.3389/fams.2025.1556150
Edited by:
Mrinal Bhowmik, Durham University, United KingdomReviewed by:
Sanchari Deb, VTT Technical Research Centre of Finland Ltd, FinlandCopyright © 2025 Yongzhang, Wenjia, Honglin and Xiao. This is an open-access article distributed under the terms of the Creative Commons Attribution License (CC BY). The use, distribution or reproduction in other forums is permitted, provided the original author(s) and the copyright owner(s) are credited and that the original publication in this journal is cited, in accordance with accepted academic practice. No use, distribution or reproduction is permitted which does not comply with these terms.
*Correspondence: Wu Xiao, d3V4aWFvQHN3anR1LmVkdS5jbg==
Disclaimer: All claims expressed in this article are solely those of the authors and do not necessarily represent those of their affiliated organizations, or those of the publisher, the editors and the reviewers. Any product that may be evaluated in this article or claim that may be made by its manufacturer is not guaranteed or endorsed by the publisher.
Research integrity at Frontiers
Learn more about the work of our research integrity team to safeguard the quality of each article we publish.