- 1Department of Mathematics and Applied Mathematics, Sefako Makgatho Health Sciences University, Pretoria, South Africa
- 2Department of Mathematics, Usmanu Danfodiyo University, Sokoto, Nigeria
Graphene, composed of a single layer of carbon atoms arranged in a hexagonal lattice pattern, has been the focus of extensive research due to its remarkable properties and practical applications. Topological indices (TIs) play a crucial role in studying graphene's structure as mathematical functions mapping molecular graphs to real numbers, capturing their topological characteristics. To compute these TIs, we employ the M-polynomial approach, an efficient method for deriving degree-based descriptors of molecular graphs. In this study, we analyze the neighborhood multiple M-polynomial of graphene's structure and use it to derive eleven neighborhood multiple degree-based TIs. These TIs allow us to predict various properties of graphene theoretically, bypassing the need for experiments or computer simulations. Furthermore, we showcase various numerical and graphical representations emphasizing the intricate connections between TIs and structural parameters. These computations were further employed to analyze the Quantitative Structure-Property Relationship (QSPR) between TIs and the mechanical properties of graphene, such as Young's Modulus, Poisson's Ratio, Shear Modulus, and Tensile Strength. The results showed strong correlations between neighborhood multiple TIs and Poisson's Ratio and Shear Modulus, underscoring their predictive power for these mechanical properties. These findings highlight the effectiveness of neighborhood multiple degree-based TIs in characterizing and predicting the mechanical properties of graphene structures, providing valuable insights for future applications in material science.
1 Introduction
The emergence of graphene, a nanomaterial with a two-dimensional structure, ignited enthusiasm for research in the realm of two-dimensional materials. It is the world's first two-dimensional material, isolated from graphite in 2004 by Professors Andre Geim and Kostya Novoselov [1]. It serves as the fundamental building block for various other carbon-based structures, such as graphite, charcoal, carbon nanotubes, and fullerenes. Additionally, it can be viewed as a huge aromatic molecule, representing the ultimate form of a class of planar polycyclic aromatic hydrocarbons. The discovery of graphene has significantly impacted the field of materials, greatly enhancing the utilization of two-dimensional materials across diverse fields and applications. Remarkably, graphene is 200 times stronger than steel and incredibly thin–one million times thinner than human hair. At present, numerous products available in the market leverage the prominent influence of graphene, which often plays a substantial or even primary role in enhancing the properties and functionalities of these products. For instance, graphene and other two-dimensional materials can be utilized to create microwave shields and absorbers with specific, predetermined properties [2]. Its unrivaled conductivity has sparked global interest among scientists, researchers, and industries. With its extraordinary properties, graphene holds immense promise across diverse fields, from electronics and optics to sensors and biomedical devices. Notably, it stands out as the top-performing material for shielding against electromagnetic interference (EMI) (see [3–6] for further details). Graphenes have been a subject of discussion in chemical graph theory over the years. The establishment of the fundamental principles of contemporary chemical graph theory (CGT) can be attributed to the groundbreaking contributions of mathematicians Arthur Cayley (1821–1895) and James Sylvester (1814–1897). In their effort to describe chemical structures using purely mathematical concepts, they determined that an isomorphism exists between chemical structures and mathematical graphs [7]. With the exception of certain mathematical disciplines, chemistry represents the primary domain where graph theory finds extensive application. The immense importance of graph theory in the field of chemistry has gained widespread recognition, particularly in the realm of CGT, where considerable attention is devoted to renowned topological indices (TIs) or index (TI). TIs are typically categorized into distance-based, entropy-based, spectral-based, and degree-based indices. TIs find extensive application in correlating and predicting a wide array of molecular properties through QSPR analysis (see [8–14] for further details). Harold Wiener introduced the initial distance-based TI known as the Wiener index in 1947. Wiener's index gained prominence when his experiment revealed a significant correlation between the boiling points of alkane molecules and the corresponding Wiener index values [9]. Since then, a multitude of degree-based TIs have been developed in the field of CGT, with numerous publications discussing these advancements with aid to create more TIs that accurately correlate with the structural properties of chemical compounds (see [12, 15–28] for more details).
In a graph ℌ = (V, E), with V(ℌ) representing the vertices (such as carbon atoms) and E(ℌ) representing the edges (such as bonds), the degree du of a vertex u ∈ V(ℌ) is the count of edges incident to it. The neighborhood of a vertex u, denoted by N(ℌ)u, refers to the set containing all vertices v that are directly connected to u. The neighborhood sum degree of a vertex u is defined as the sum of the degrees of the neighboring vertices connected to u, expressed as:
In recent years, researchers have increasingly focused on designing TIs that are based on the neighborhood degree of vertices. In 2019, Mondal et al. [29] introduced the first class of neighborhood versions of degree-based TIs, including the neighborhood second Zagreb index, the neighborhood forgotten index, the modified neighborhood forgotten index, and the neighborhood hyper-Zagreb index. For example, let ℌ be a graph. The first and second neighborhood Zagreb indices of ℌ are defined as follows:
In their QSPR analysis, Mondal et al. [29] observed that the newly introduced neighborhood TIs outperformed their degree-based TIs counterparts when applied to model the physicochemical properties of octane isomers. Subsequently, Mondal et al. [30] additionally proposed a range of neighborhood versions of the following degree-based TIs, specifically the second modified Zagreb index, the general Randić index, the harmonic index, and the inverse sum index, which were derived from the neighborhood M-polynomials of crystallographic structures. Further research into the extension of neighborhood degree-based TIs can be found in the following works [31–35].
TIs can be computed through direct computation or by using algebraic polynomials. However, employing direct computation to compute TIs can become cumbersome when deriving multiple TIs within a specific category. To address this issue, numerous algebraic polynomials [36–40] have been introduced, from which TIs can be derived by differentiation, integration, or a combination of both at an invariant point. Chemistry also benefits from the valuable applications of algebraic polynomials, such as the Hosoya polynomial (commonly referred to as the Wiener polynomial). For instance, evaluating the derivatives of the Hosoya polynomial at x = 1 yields both the Wiener index and the Hyper Wiener index [37]. This polynomial is considered instrumental in determining distance-based TIs. Among various algebraic polynomials, Deutsch and Klavžar [41] introduced the concept of the M-polynomial in 2015. The M-polynomial is the most versatile polynomial for generating a wide range of degree-based TIs, providing closed-form expressions for degree-based TIs. In 2017, Kwun et al. [42] derived degree-based TIs using the M-polynomial method for V-phenylenic nanotubes and nanotori. Since then, the versatility of the M-polynomial has attracted significant research attention, leading to the derivation of numerous TIs for diverse graph structures. These include line graphs of subdivision graphs [43], linear chains of aromatic hydrocarbons like benzene, naphthalene, and anthracene [44], antituberculosis drugs [45], and borophene nanosheets [14], among others. Every day, significant progress is made in the development of new TIs. One notable advancement is the concept of the neighborhood M-polynomial (NM), which emerges from the field of neighborhood degree-based TIs. This concept was initially introduced by Mondal et al. in their 2019 works [30]. The NM- polynomial stands out from the classical M-polynomial by employing a neighborhood edge partitioning system to divide the graph's edges. The NM-polynomial defined by Mondal et al. [30] for the graph ℌ is given by:
where rik(ℌ), i, k ≥ 1 denotes the total number of edges e = uv of ℌ such that {λu, λv} = {i, k}.
Several studies have explored the application of NM-polynomials to obtain neighborhood TIs for various molecular structures. Verma et al. [46] employed the NM-polynomial to investigate the topological properties of bismuth tri-iodide. In 2020, Mondal et al. [47] obtained TIs for chemical structures for the treatment of COVID-19 via M-polynomial and NM-polynomial. Shanmukha et al. [48] determined the M-polynomial and NM-polynomial to derive TIs of porous graphene. Molecular descriptors based on the neighborhood degree sum for fractal and Cayley tree dendrimers were obtained by Mondal et al. [49] via NM-polynomial. Present authors [50] obtained neighborhood TIs using NM-polynomial of graphene networks and their line graph of graphene networks. A recent study by Xavier et al. [51] conducted a comparative analysis of pent-heptagonal nanostructures using TIs derived from the NM-polynomial approach. Most recently in 2024, Abubakar et al. [38] explored the applications of NM-polynomials in characterizing oligothiophene dendrimers. This expanding area of research highlights the promise of NM-polynomials in characterizing different molecular structures. However, a thorough understanding of neighborhood TIs is still being developed, with ongoing efforts to enhance their efficiency. Addressing this gap, this paper introduces the neighborhood multiple M-polynomial, an extension of the NM-polynomials, which will be applied to characterize the structure of graphene. This approach will retrieve eleven neighborhood versions of multiple degree-based TIs listed in Table 1, utilizing neighborhood multiple-edge partition sets.
2 Preliminaries
Let ℌ = (V, E) be a graph. The following definitions are adaptations of the multiple degree TIs proposed by Gao et al. [52].
Definition 2.1. The neighborhood multiple degree function ξu = ∏v∈N(ℌ)u dv is defined as the product of the degrees of all vertices v in the neighborhood of vertex u.
Definition 2.2. In a graph ℌ, the neighborhood multiple-edge partition sets for all edges uv ∈ E(ℌ) are defined by the pairs (ξu, ξv), where ξu and ξv are the neighborhood multiple degree functions of the vertices u and v, respectively.
The following definitions are a reformulation of neighborhood M-polynomial and neighborhood sum degree-based TIs by Mondal et al. [30].
Definition 2.3. Let ℌ be a graph, the neighborhood multiple M-polynomial (NMM) is defined as,
where τik(ℌ), i, k ≥ 1 denotes the total number of edges e = uv of ℌv such that {ξu, ξv} = {i, k}, and p, q denotes the variables.
Neighborhood multiple degree-based TIs defined by using neighborhood multiple degree edge partition in an arbitrary graph ℌ can be defined as,
where f(ξu, ξv) represents the function of ξu and ξv employed in definition of neighborhood multiple degree-based TIs in Definition 2.4. An alternative way to represent the previous result is,
Now, let's provide an example to illustrate the previously mentioned definitions.
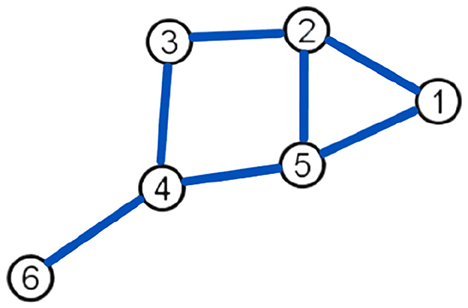
Example 2.1. Consider the undirected graph ℌ from Figure 1, such that |V(ℌ)| = 6 and |E(ℌ)| = 7.
By Definition 2.1, we have ξ1 = 9, ξ2 = 12, ξ3 = 9, ξ4 = 6, ξ5 = 18, and ξ6 = 3. Thus, by Definition 2.2, we partition the edge sets via the neighborhood multiple degrees of the end vertices for all τ(ξu, ξv): τ(9,12) = 2, τ(6,9) = 1, τ(6,18) = 1, τ(9,18) = 1, and τ(3,6) = 1. Therefore, from Equation 2.1, we obtain
Definition 2.4. Let ℌ be a graph.
(i) The neighborhood multiple first Zagreb index is defined by
(ii) The neighborhood multiple second Zagreb index is defined by
(iii) The neighborhood multiple Forgotten index is defined by
(vi) The neighborhood multiple general Randic index is defined by
(v) The neighborhood multiple Harmonic index is defined by
(vi) The neighborhood multiple Atom-bond connectivity index is defined by
(vii) The neighborhood multiple Geometric arithmetic index is defined by
(viii) The neighborhood multiple inverse Randic index is defined by
(ix) The neighborhood multiple second modified Zagreb index is defined by
(x) The neighborhood multiple Inverse Sum index defined by
(xi) The neighborhood multiple Symmetric Division index defined by
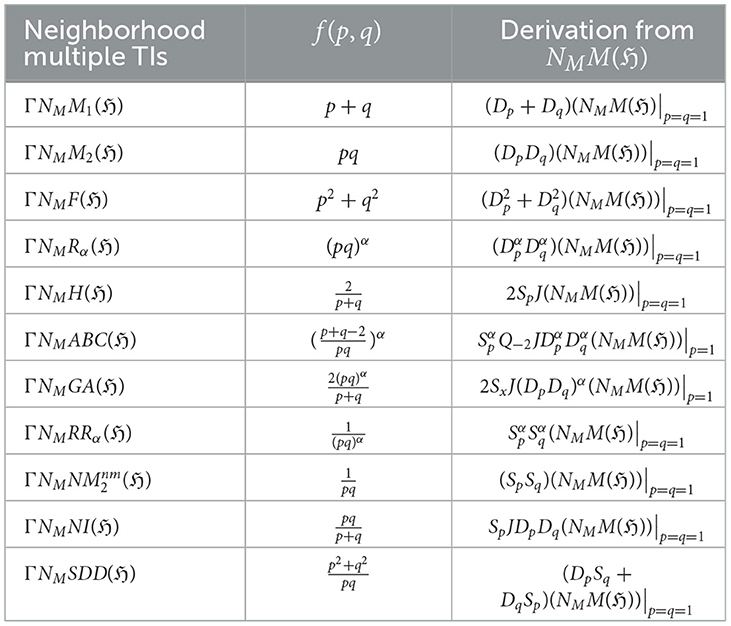
Table 1 displays the relationship between neighborhood multiple TIs and neighborhood multiple M-polynomial using the function defined in Definition 2.3, with .
Where,
3 Methodology
This study focuses on the neighborhood multiple degree-based TIs of the graphene structure when t > 1 and s > 1. First, we calculate the neighborhood multiple M-polynomial. By leveraging integration and differentiation techniques, we then derive eleven neighborhood multiple-degree-based TIs. This is achieved using graph theory algorithms, combinatorial computation, and neighborhood multiple-degree partition sets to extract the results. We employed Matlab 24.1 to calculate all neighborhood multiple degree-based TIs values for various graphene structures (t, s). The resulting TIs are presented with comprehensive analysis through graphical and tabular comparisons. Specifically, 3D plots of the neighborhood multiple M-polynomial and the visualization of numerical values were created using Matlab 24.1, while comparison scatter plots were generated using Python 3.12.5.
4 Neighborhood multiple m-polynomial of graphene structure
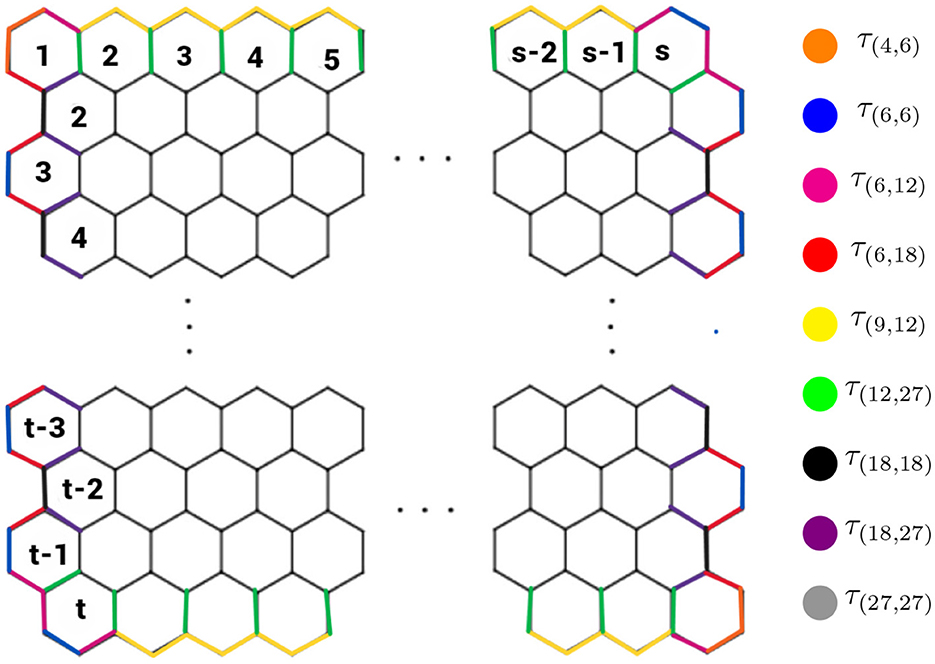
Graphene's structure resembles a hexagonal lattice as shown in Figure 2. In this lattice, the vertices correspond to carbon atoms, and the edges represent their covalent bonds. This honeycomb-like arrangement consists of t rows and s columns, forming a total of ts hexagons. Mathematically, the entire structure can be represented as ℌ(t, s). The structure of graphene consists of four cases:
Case 1: t > 1, s > 1, Case 2: t = 1, s = 1, Case 3: t = 1, s > 1, and Case 4: t > 1, s = 1. In each case, the values of t and s determine the specific structure of graphene.
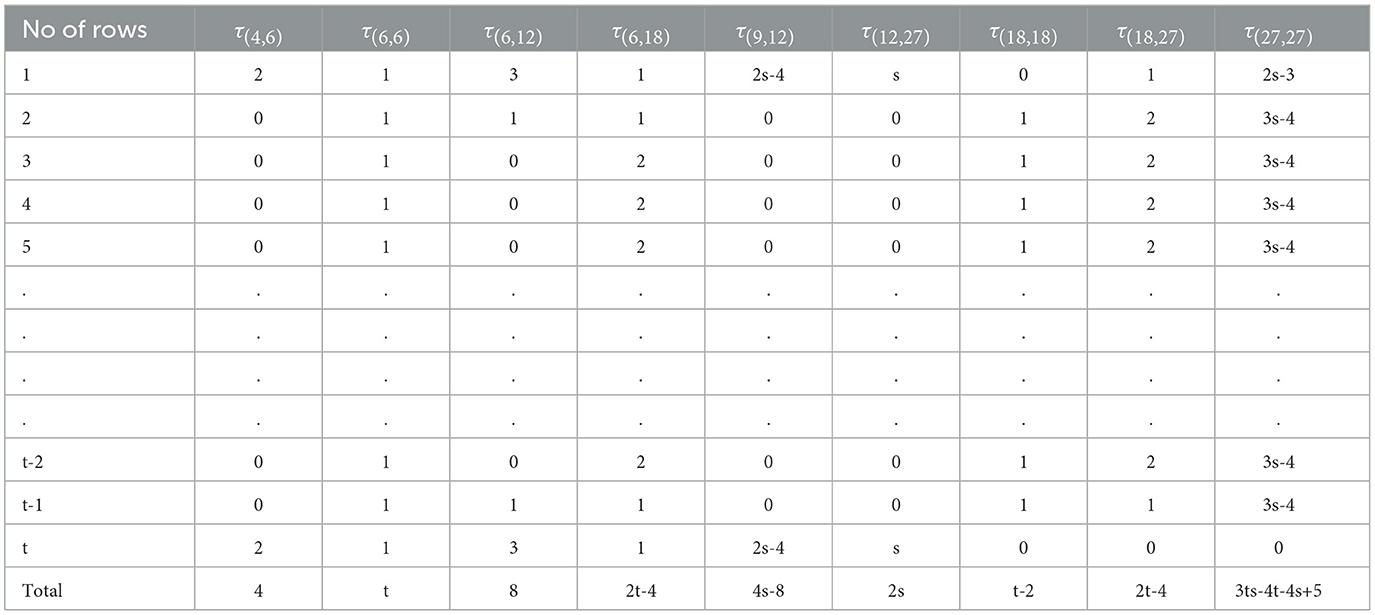
However, this study investigates only the instance of Case 1 of the graphene structure. To achieve this, we sort the neighborhood multiple edge partition sets τ(ξu, ξv) from the graphene structure shown in Figure 2, resulting in Table 2.
Theorem 4.1. Let ℌ be a graphene structure (t, s). The neighborhood multiple M-polynomial is given by:
Proof. By examining the graphene structure (t, s) reveals that the corresponding graph ℌ, possesses a total of 2ts + 2t + 2s vertices and 3ts + 2t + 2s − 1 edges. Furthermore, by Definition 2.1 the neighborhood multiple degrees of vertices within ℌ can take on the following distinct values: 4, 6, 9, 12, 18, and 27. This observation leads to the identification of nine distinct neighborhood multiple-edge partition sets for all edges uv ∈ E(ℌ) defined by the pairs (ξu, ξv), respectively. The identified partition sets are τ(4,6), τ(6,6), τ(6,12), τ(6,18), τ(9,12), τ(12,27), τ(18,18), τ(18,27), and τ(27,27) as shown in Figure 2. Table 2 details these neighborhood multiple-edge partition sets and the corresponding number of edges within each partition.
The neighborhood multiple M-polynomial of ℌ, derived from Definition 2.3 and utilizing Table 2, is obtained as follows:
Thus, the proof is complete.
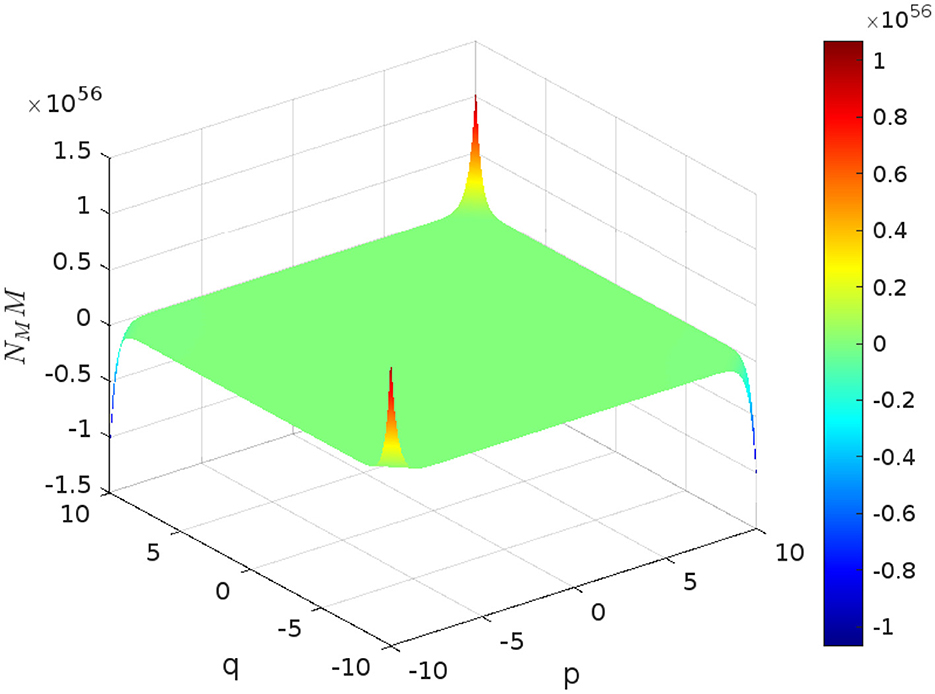
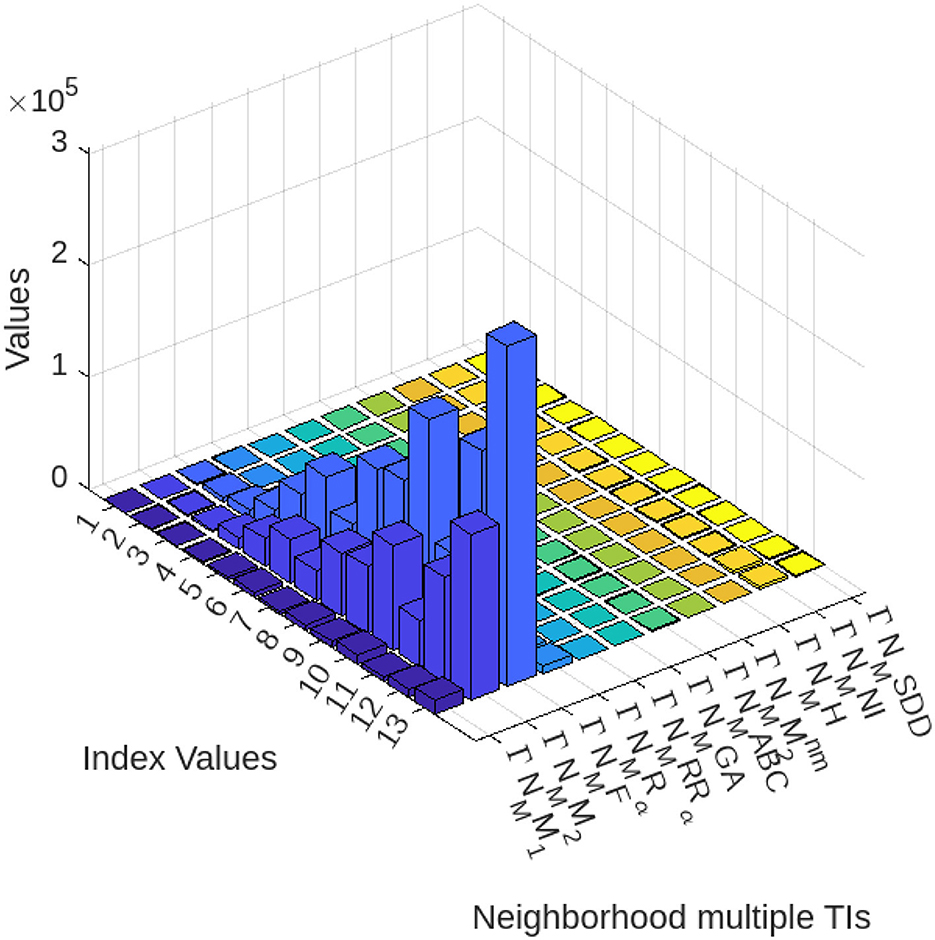
Figure 3 visually represents the aforementioned result, with the given parameters t=6 and s=9 of graphene structure. The plot visualizes how the function behaves over the range of p and q from 10 to -10.
Remark 4.1. For simplicity, we denote NMM(ℌ; p, q) as γ(p, q) throughout this work.
Theorem 4.2. Let ℌ be a graphene structure when t > 1 and s > 1, then we have:
Proof. The neighborhood multiple M-polynomial of ℌ when t > 1 and s > 1 is given as follows,
Let γ(p, q) = NMM(ℌ; p, q). Thus, we have:
Therefore, from Table 1, we get:
Theorem 4.3. Consider the graphene structure for t > 1 and s > 1, then the following results hold:
Proof. The proof follows a similar approach to Theorem 4.2. Define γ(p, q) = NMM(ℌ; p, q). Therefore, we obtain:
Theorem 4.4. Let ℌ be a graphene structure when t > 1 and s > 1, then we have:
Proof. Define γ(p, q) = NMM(ℌ; p, q). Using Table 1, we obtain:
5 QSPR analysis with neighborhood multiple M-polynomial descriptors for the mechanical properties of graphene variations
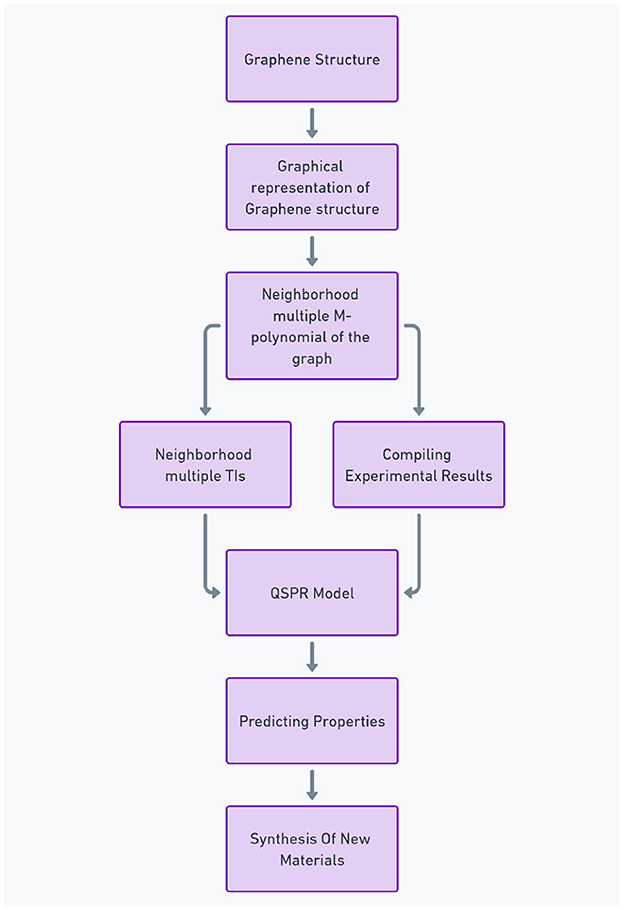
The veil of uncertainty surrounding the properties of 2D nanomaterials like graphene is thinning thanks to the power of molecular descriptors. These computational tools act as crystal balls, allowing scientists to peer into a material's potential based on its atomic arrangement. Particularly in graphene research, molecular descriptors play a crucial role in property prediction. While these descriptors can incorporate aspects of 3D electronic structure (relevant for some properties), their primary strength lies in capturing the unique features of graphene's 2D structure. Different categories of descriptors, ranging from simple measures of connectivity (1D) to complex electronic considerations, offer valuable insights into various aspects of graphene's behavior, such as its exceptional electrical conductivity, thermal stability, or potential for gas adsorption. Additionally, advanced methods can generate quantum-chemical descriptors. These descriptors delve into the electronic structure of the molecule, providing even deeper insights (refer [53, 54]). The recent surge in artificial intelligence and machine learning has opened doors for developing even more sophisticated descriptors and identifying the most informative ones for specific applications (refer [55, 56]). The core principle of QSPR is that a molecule's structure holds the key to its properties. QSPR methods aim to capture these properties using mathematical codes called descriptors. QSPR modeling rely on a vast library of pre-calculated descriptors, encompassing both physical and structural properties of molecules. This computational approach is much faster and more cost-effective than traditional experimental methods, which often require significant effort and expensive equipment. QSPR analysis workflow is depicted as a flowchart in Figure 4. Notably, the workflow emphasizes the utilization of structural descriptors specifically tailored for graphene structure.
Building upon the established interest in graphene structures, this section focuses on developing linear regression models to predict various properties of these materials. Here, we employ the least squares method to establish relationships between a selection of properties and corresponding neighborhood multiple degree-based TIs of the graphene structures. The following equation serves as the foundation for our analysis:
where Z is a mechanical property of the nanomaterial, n is the regression coefficient, m is a constant, and TI is a neighborhood multiple degree-based TI. Computational approaches, such as theoretical analysis, have the potential to aid pharmaceutical scientists, including chemists, in the prediction of nanomaterial features, thereby reducing the need for extensive experimentation. This also facilitates the design of new nanomaterials with desired properties. The neighborhood multiple M-polynomial technique offers a more efficient and concise approach to TIs computation for graphene structures compared to traditional algorithmic methods. The efficiency of the neighborhood multiple M-polynomial approach derives from its unique methodology. Unlike traditional methods that require separate calculations for each neighborhood multiple TI, this technique enables the derivation of numerous TIs through differentiation and integration, eliminating the need for repetitive computations.
5.1 Property prediction of graphene variations via neighborhood multiple degree-based TIs
This subsection focuses on predicting the mechanical properties of pristine graphene and its captivating derivatives–zigzag nanoribbon (ZGNR) and armchair nanoribbon (AGNR). Pristine graphene [57], the cornerstone of this study, possesses a perfect hexagonal lattice of carbon atoms, embodying the ideal defect-free state. In contrast, graphene nanoribbons (GNRs) represent a fascinating class of nanomaterials derived from graphene. These materials essentially consist of long, narrow strips of graphene with tailored edge configurations. Notably, zigzag and armchair nanoribbons have distinct edge structures, characterized by a zigzag pattern at the edge and a smooth, armchair-like edge, respectively [58].
By using neighborhood multiple degree-based TIs, this research unveils the underlying structure-property relationships for Young's Modulus (stiffness, a measure of a material's resistance to elastic deformation under a tensile load), Poisson's Ratio (the ratio of transverse contraction to longitudinal extension when a material is stretched), Shear Modulus (a measure of a material's ability to resist shear deformation), and Tensile Strength (resistance to deformation under stress). These TIs, mathematically derived from the atomic arrangements within a material, act as fingerprints, offering a powerful tool to decipher the intricate code that links structure to a material's mechanical behavior. Ultimately, this research holds the key to unlocking the full potential of graphene derivatives by guiding the design of materials with tailor-made mechanical properties for groundbreaking applications. Figure 5, Table 5 present the variations in graphene and provide a comprehensive summary of the properties of Young's Modulus, Poisson's Ratio, Shear Modulus, and Tensile Strength of these graphene variants.

Figure 5. Graphene variations: (A) Pristine graphene (9,6) [59], (B) AGNR (9,3) [60], and (C) ZGNR (4,9) [60].
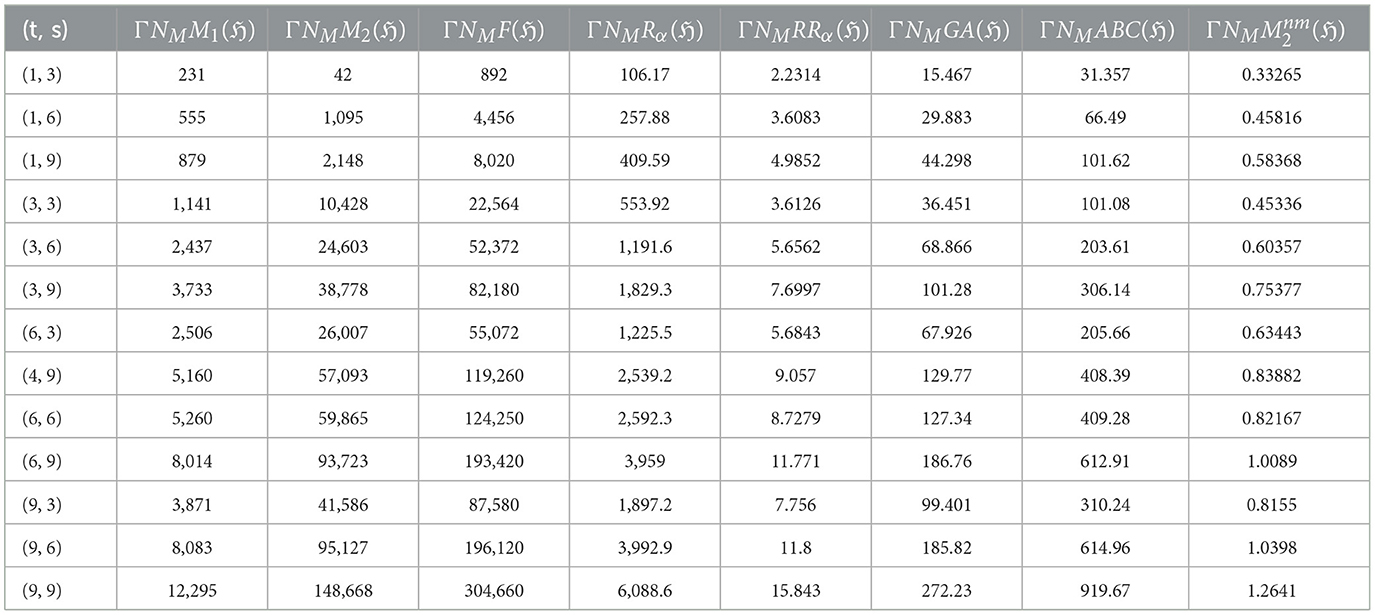
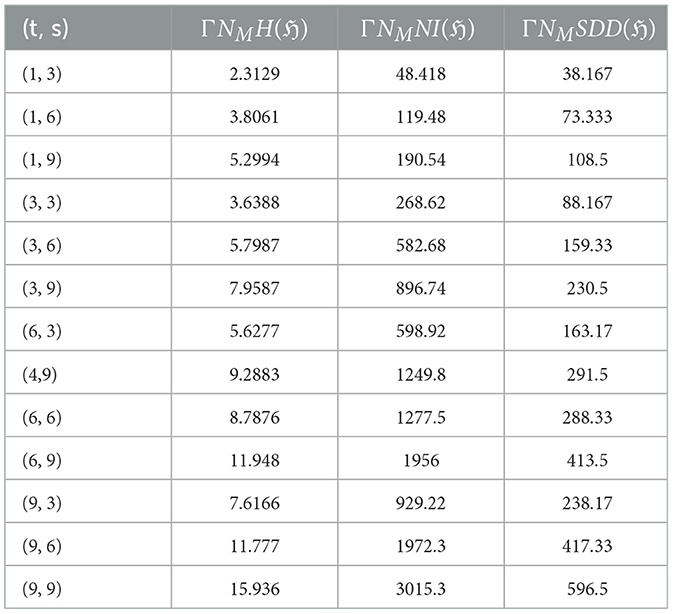
Researchers have explored graphene's mechanical properties through experiments and simulations, with computational methods being more widely used. The synthesis methods and edge configurations of graphene nanoribbons (GNRs) significantly influence their mechanical properties [78]. Bottom-up approaches like chemical vapor deposition (CVD) and surface-assisted synthesis strive for precise edge control. At the same time, top-down methods like lithography and CNT unzipping often yield a mix of configurations (see [79, 80]). While experimental techniques (e.g., nanoindentation [73]) and computational simulations (MD [81], DFT [72, 82], and Continuum mechanics [61]) offer valuable insights, achieving perfect agreement between them remains a challenge (see [83]). Experimental measurements can be affected by sample size and handling limitations, while simulations rely on accurate models and assumptions. These discrepancies highlight the need for further research to bridge the gap between theoretical predictions and experimental realities. However, a general trend still emerges: zigzag-edged GNRs are predicted to exhibit higher Tensile Strength and fracture toughness compared to armchair-edged GNRs. This is attributed to each configuration's unique atomic arrangements and edge states [84]. Tables 3, 4 presents the computed the neighborhood multiple degree-based parameters for graphene structures.
6 Discussion of results
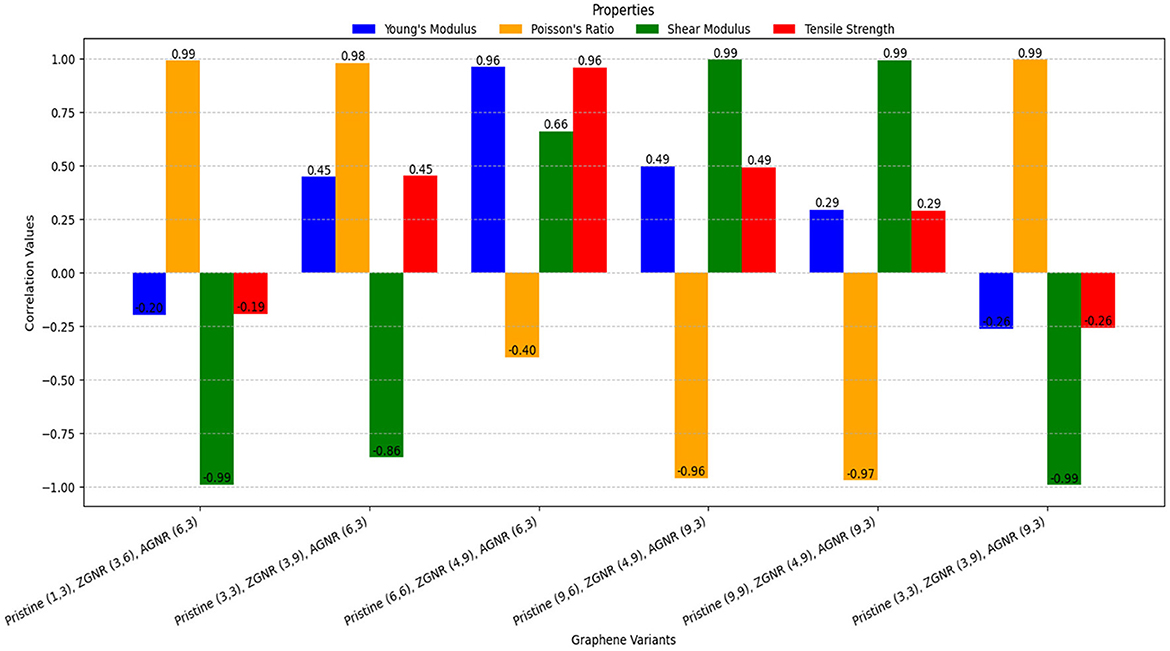
The Least Squares Approximation method was employed to elucidate the relationship between neighborhood multiple degree-based TIs and the properties of various graphene variations, as detailed in Table 5. Correlation, a statistical measure, quantifies the strength and direction of a linear relationship between two variables via the correlation coefficient, r, which ranges from -1 to 1. An r value of 1 signifies a strong positive linear relationship, -1 indicates a strong negative linear relationship, and 0 denotes no linear relationship. Regression analyses were performed using analytical tools such as Matlab 24.1 and Python 3.12.5. The resulting correlation coefficients, r, are summarized and visualized in Tables 6, 7, Figure 6. See Figure 7 also.
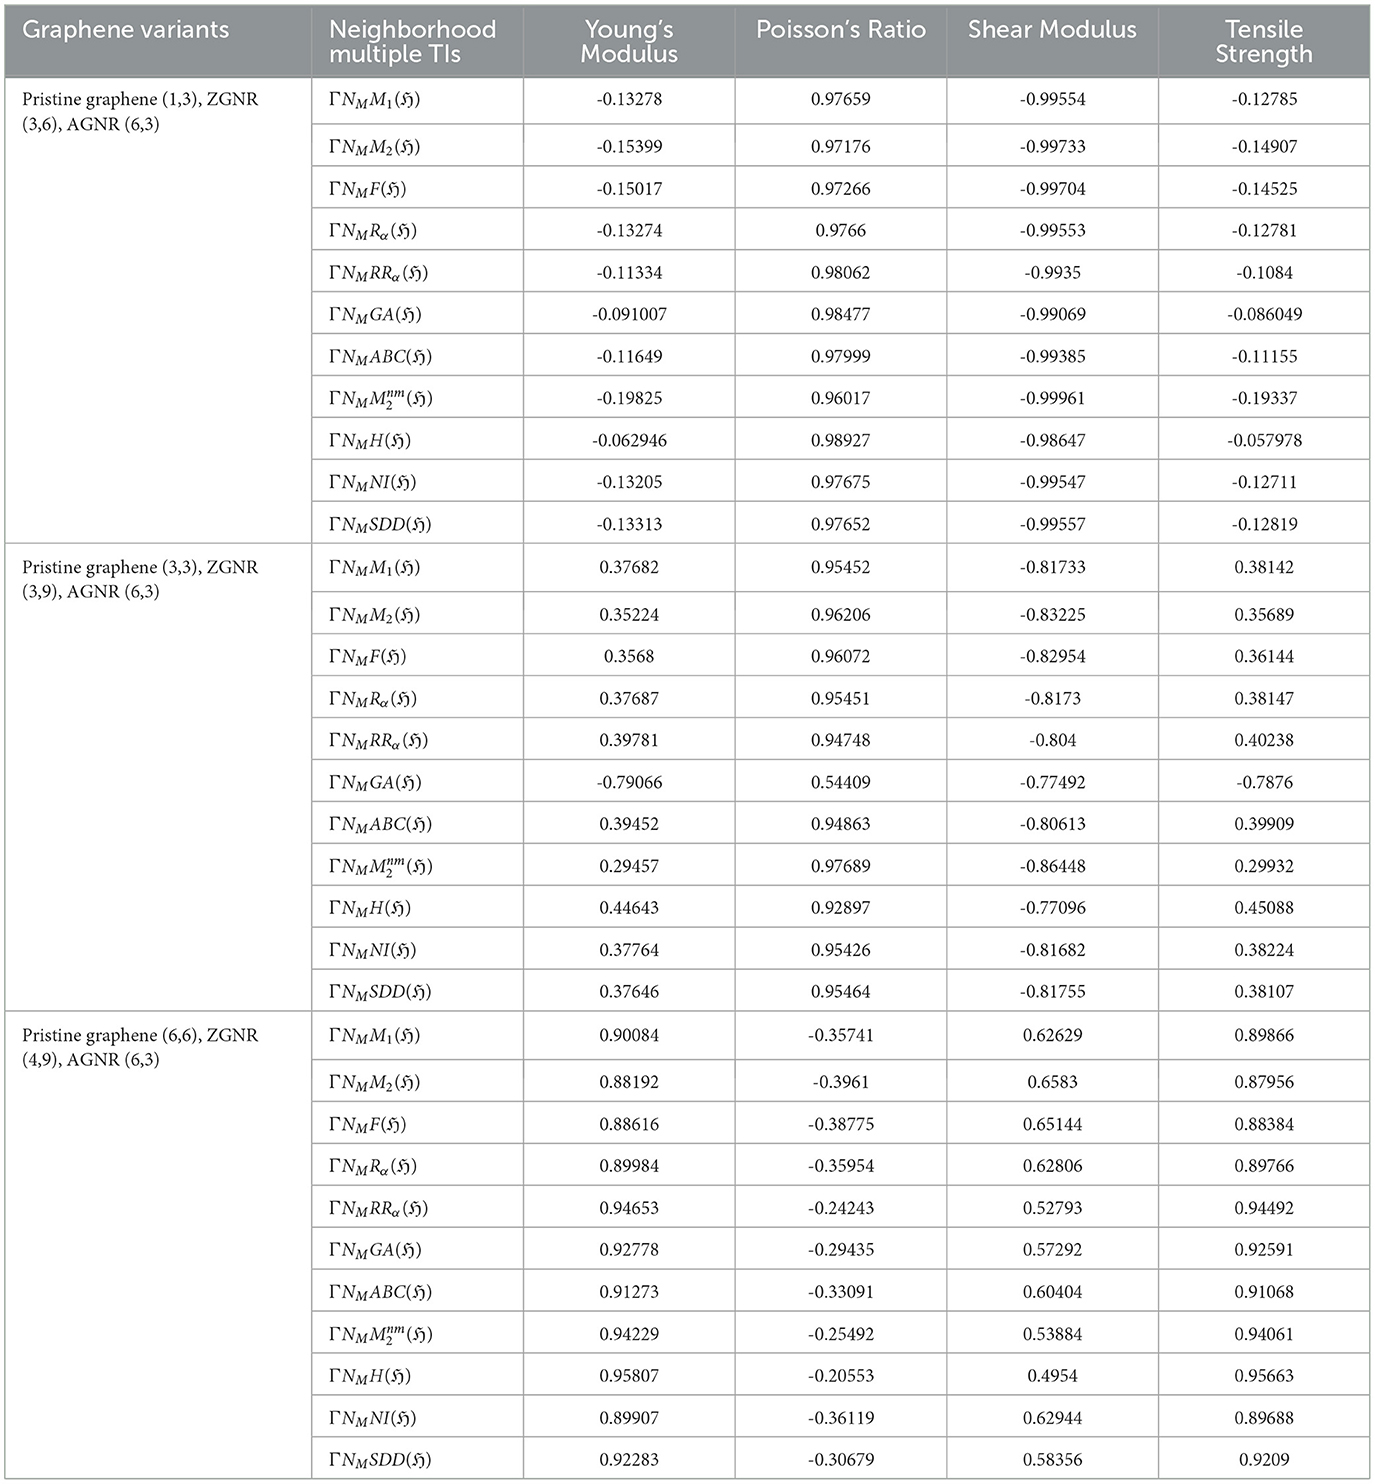
Table 6. Correlation table between mechanical properties and neighborhood multiple TIs for graphene variants.
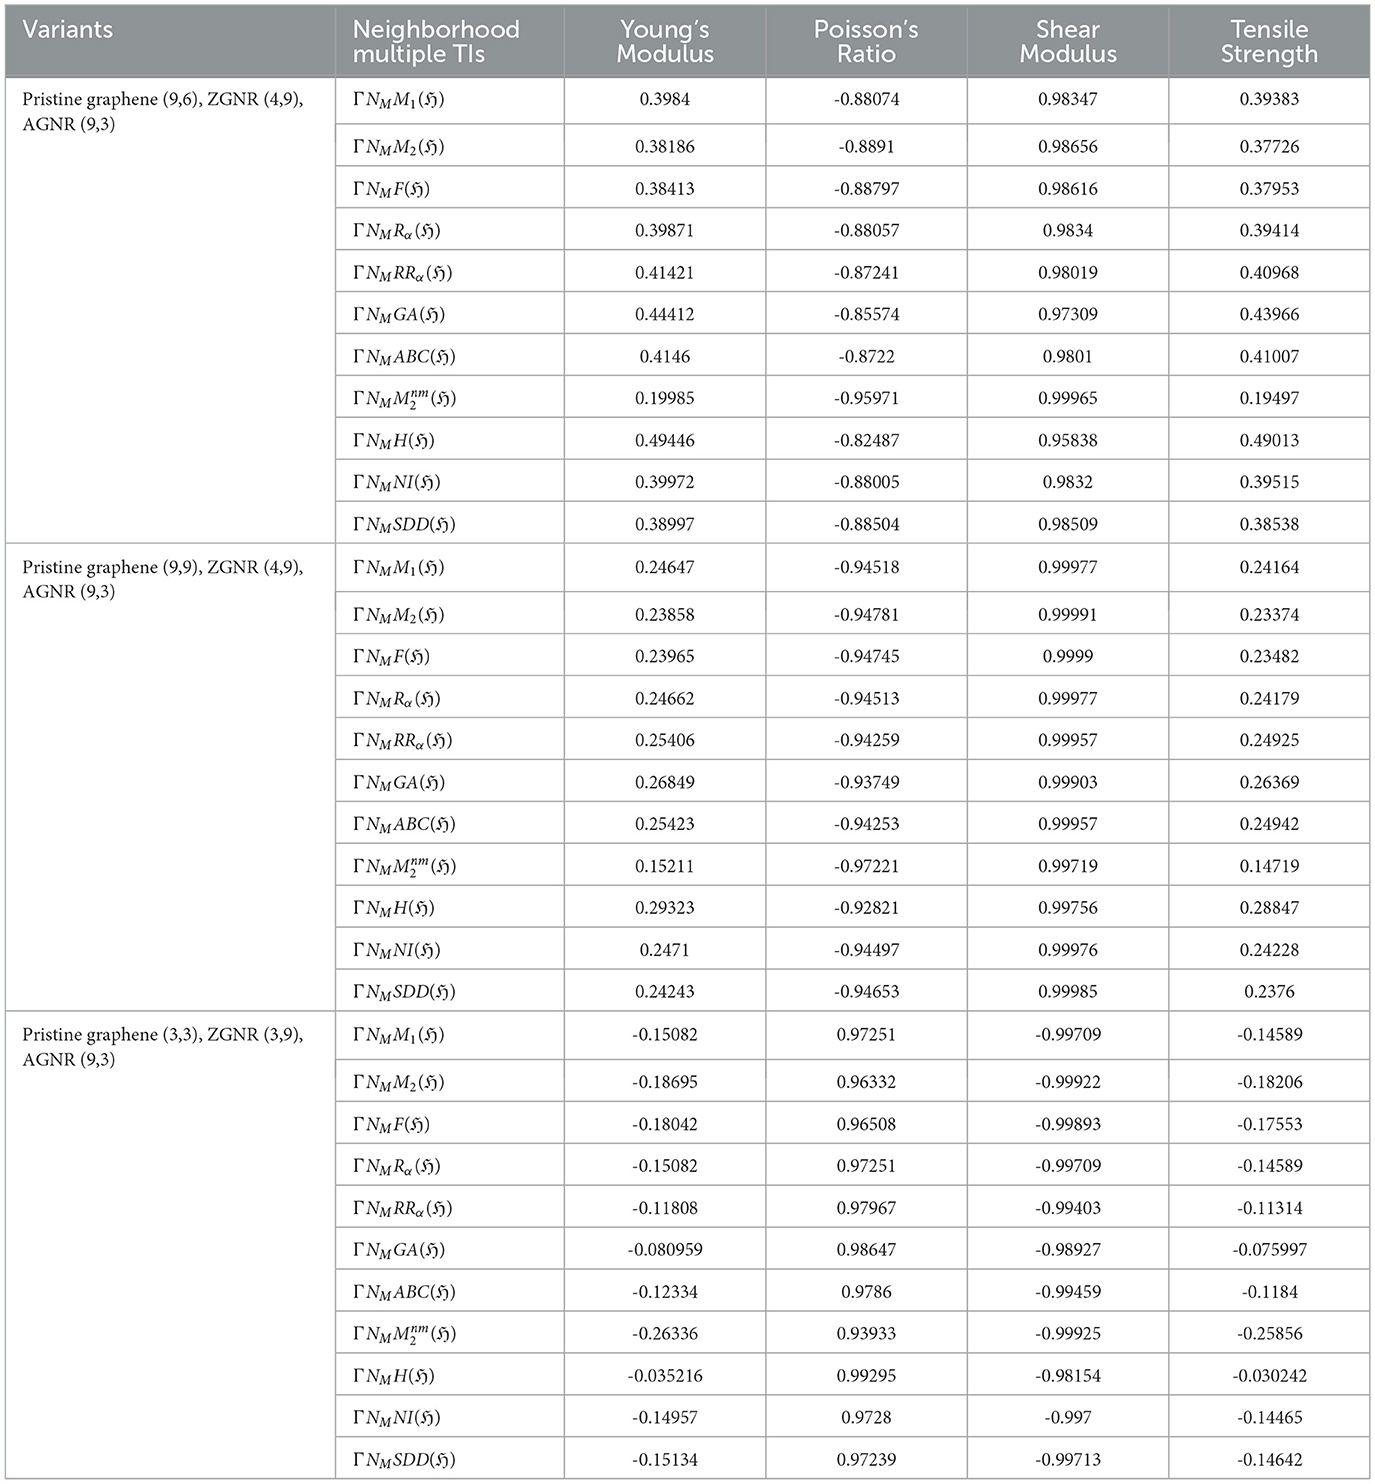
Table 7. Correlation table between mechanical properties and neighborhood multiple TIs for graphene variants.
6.1 Performance of neighborhood multiple TIs across mechanical properties
In this subsection, we analyze the correlation between neighborhood multiple TIs and the mechanical properties of various graphene variants, highlighting linear regression models with strong correlations. Scatter plots showing the relationship between properties and their best-fitted TIs are presented.
(i) Pristine (1,3), ZGNR (3,6), AGNR (6,3)
• The Shear Modulus demonstrates strong negative correlations with various neighborhood multiple TIs, most notably with (r = −0.99961) and ΓNMF(ℌ) (r = −0.9955). The corresponding regression models are:
• In contrast, Poisson's Ratio consistently exhibits strong positive correlations across multiple TIs, with the strongest observed for ΓNMH(ℌ) (r = 0.98927).
• Weak correlations are observed for Young's Modulus and Tensile Strength across all neighborhood multiple TIs, ranging from (r = −0.19825) with to (r = −0.062946) with ΓNMH(ℌ). This suggests that these properties are influenced by more complex structural factors beyond the scope of neighborhood multiple TIs.
(ii) Pristine (3,3), ZGNR (3,9), AGNR (6,3)
• Poisson's Ratio exhibits a robust positive correlation, particularly with (r = 0.97689), while Tensile Strength shows a strong negative correlation with ΓNMGA(ℌ) (r = −0.78760). The regression models are:
• Shear Modulus demonstrated strong negative correlations, particularly with (r = −0.86448).
• Also, Young's Modulus exhibit a strong negative correlation with ΓNMGA(ℌ) (r = −0.79066), while the other TIs show moderate to weak correlations, ranging from (r = 0.29457) to (r = 0.45088).
(iii) Pristine (6,6), ZGNR (4,9), AGNR (6,3)
• Strong positive correlations are observed for Young's Modulus (r = 0.95807) and Tensile Strength (r = 0.95663) with ΓNMH(ℌ). Regression models:
• Shear Modulus show a moderate correlation across neighborhood TIs ranging from (0.4954 to 0.6583)
• Poisson's Ratio shows weak negative correlations (−0.3961 to −0.20553).
(iv) Pristine (9,6), ZGNR (4,9), AGNR (9,3)
• The Shear Modulus exhibits the strongest positive correlation among the TIs, particularly with (r = 0.99965). ΓNMM2(ℌ) also performed well with (r = 0.98656). Conversely, Poisson's Ratio demonstrates strong negative correlations, with the highest observed for , yielding a correlation coefficient of (r = −0.95971). The corresponding regression models are:
• Young's Modulus and Tensile Strength exhibit weaker relationships with the TIs, with the maximum correlation coefficient being r = 0.49446.
(v) Pristine (9,9), ZGNR (4,9), AGNR (9,3)
• Shear Modulus exhibits a very strong correlation with all TIs, with the highest correlation observed for ΓNMM2(ℌ) (r = 0.99991). Additionally, ΓNMM1(ℌ) and ΓNMABC(ℌ) demonstrates excellent performance with (r = 0.99977) and (r = 0.99957), as described by the following regression models:
• In contrast, Poisson's Ratio shows the strongest negative correlation with (r = −0.97221)
• Young's Modulus and Tensile Strength demonstrate weaker correlations (r = 0.15211 to r = 0.26849).
(vi) Pristine (3,3), ZGNR (3,9), AGNR (9,3)
• Shear Modulus exhibits strong negative correlations among all TIs, particularly with (r = −0.99925). Additionally, ΓNMSDD(ℌ) demonstrated robust performance with Shear Modulus. Conversely, Poisson's Ratio displays strong positive correlation with . The corresponding regression models are given as follows:
• Weak correlations are observed for Young's Modulus and Tensile Strength across all TIs (−0.26336 to −0.11808).
The scatter plots illustrating the relationships between properties and their best-fit TIs are presented in Figures 8, 9. Therefore, it can be concluded that the mechanical properties of various graphene variations can be predicted using regression models derived from the computed neighborhood multiple TIs. Strong correlations, particularly in the Poisson ratio and Shear Modulus across all neighborhood multiple TIs, highlight the effectiveness of TIs such as , ΓNMF(ℌ), ΓNMM2(ℌ), and ΓNMH(ℌ) as robust predictors of mechanical properties across most graphene variants.
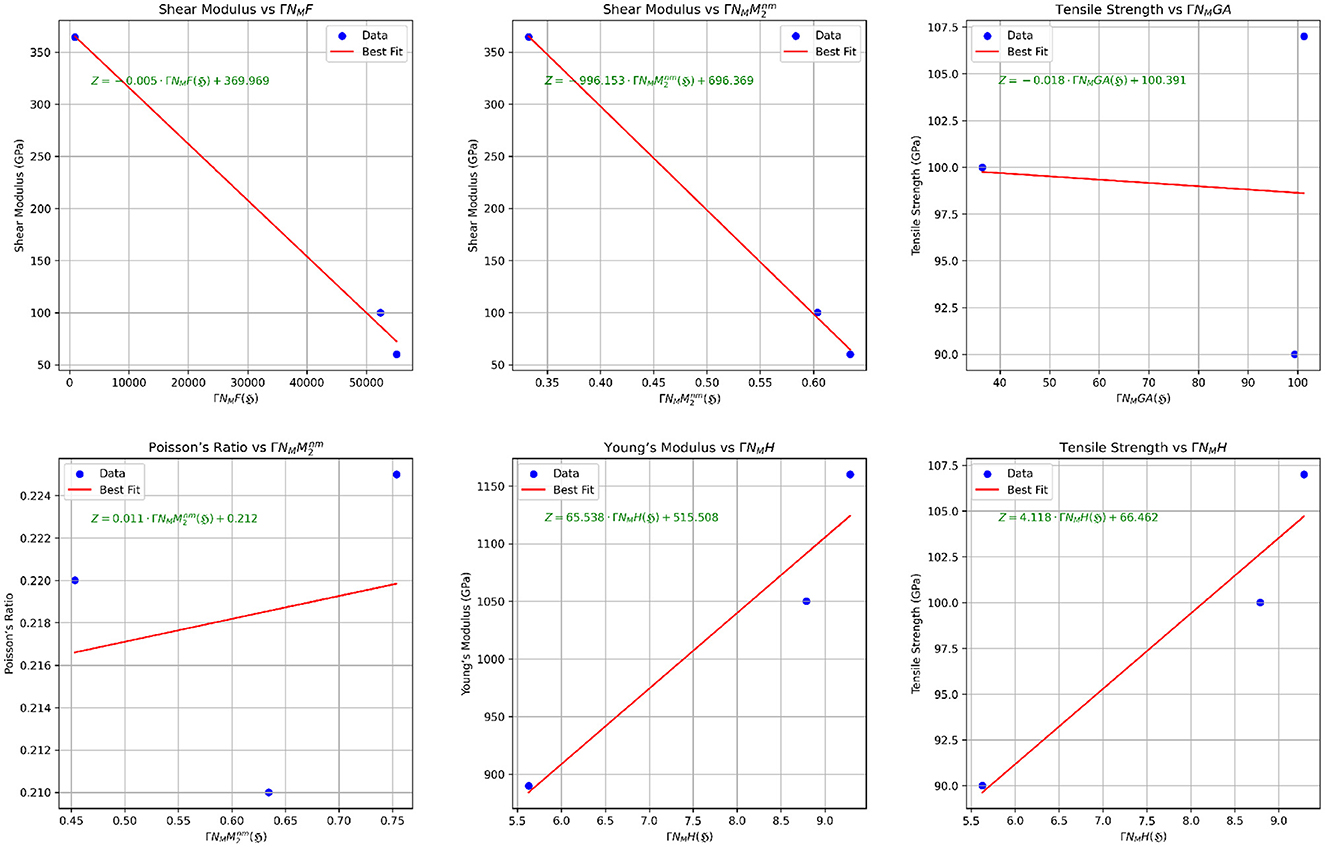
Figure 8. Scatter plots illustrating the correlation between mechanical properties and neighborhood multiple TIs.
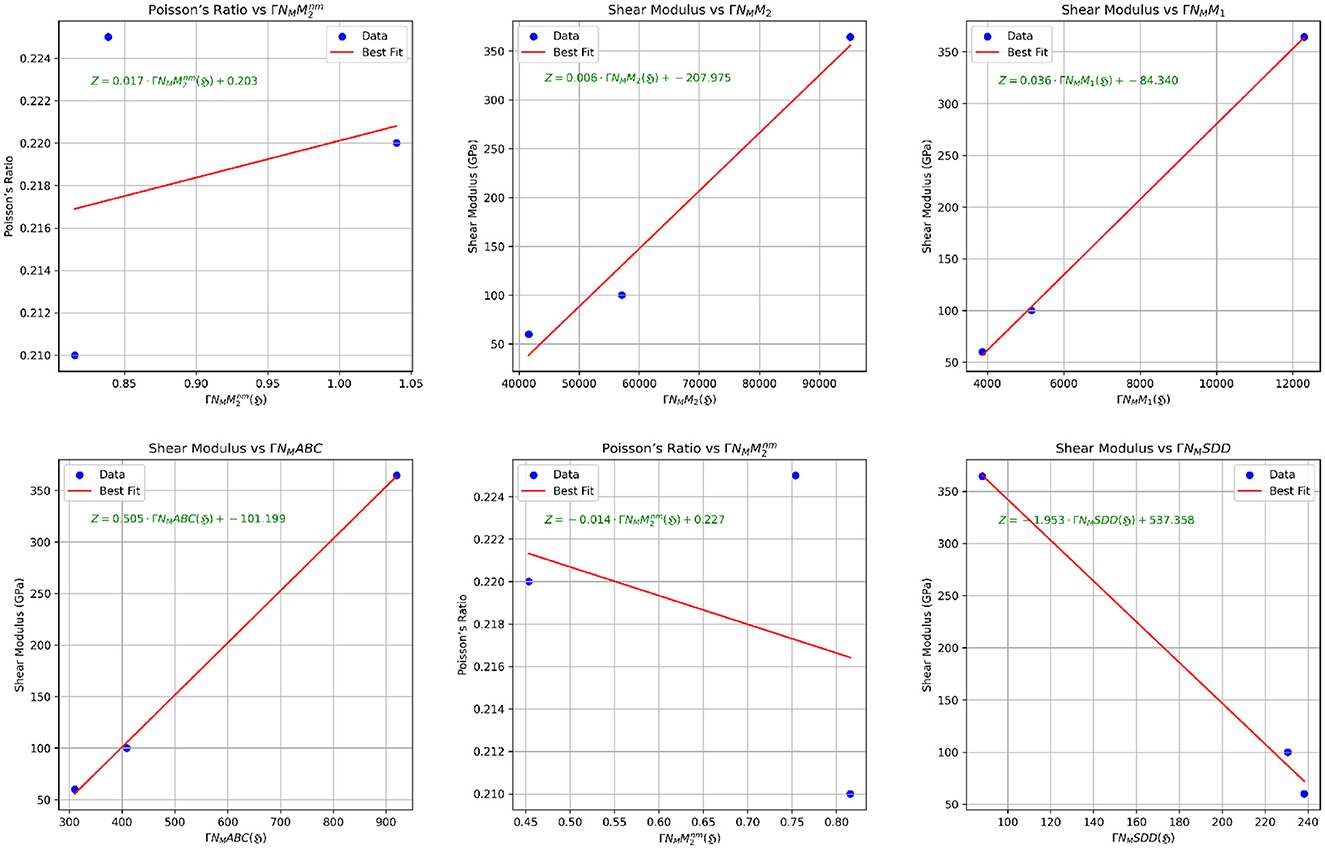
Figure 9. Scatter plots illustrating the correlation between mechanical properties and neighborhood multiple TIs.
6.2 Comparitive analysis via closed neighborhood degre-based TIs of graphene variations
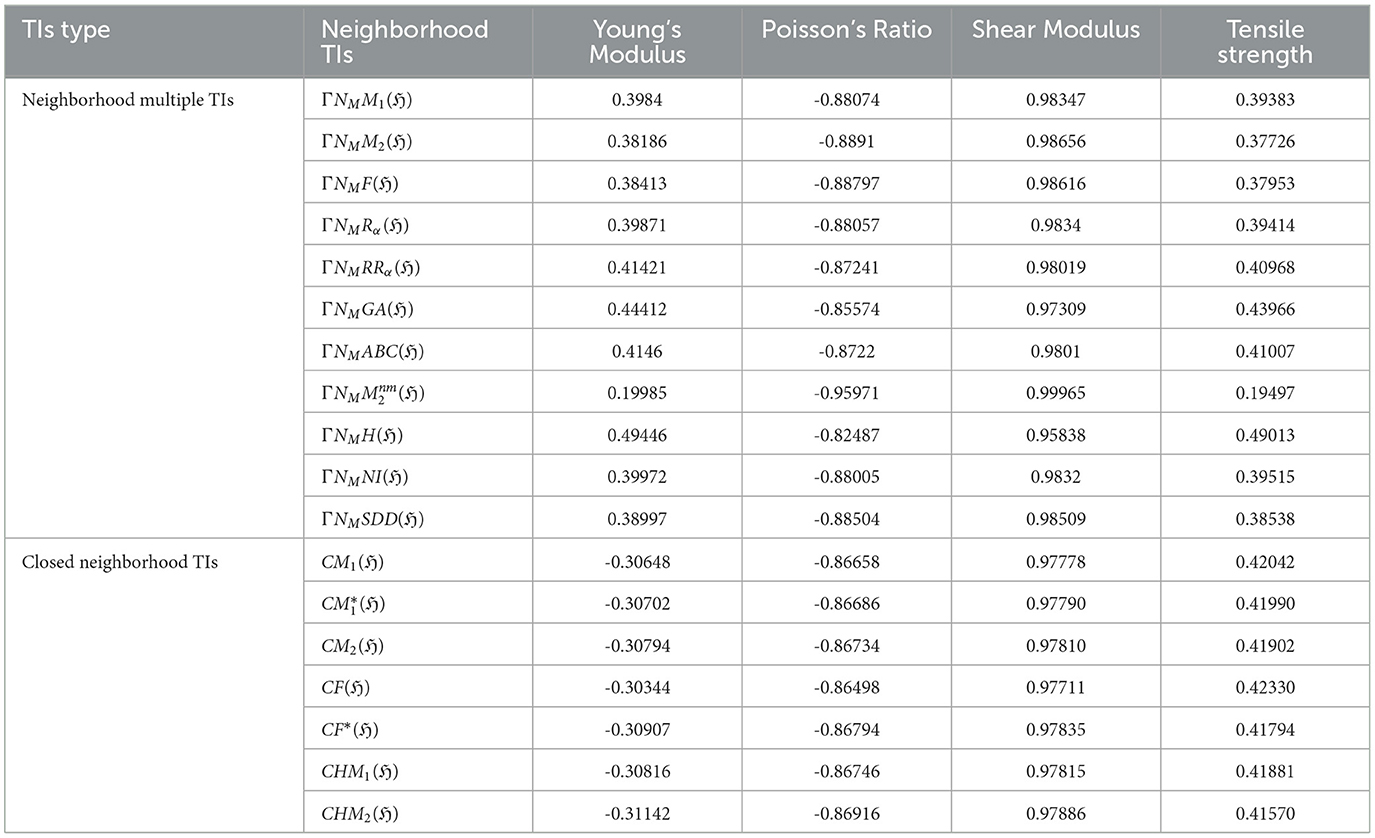
Sankarraman et al. [85] introduced seven newly defined TIs: the closed neighborhood first Zagreb index, CM1(ℌ); the modified closed neighborhood first Zagreb index, ; the closed neighborhood second Zagreb index, CM2(ℌ); the closed neighborhood Forgotten index, CF(ℌ); the modified closed neighborhood Forgotten index, CF*(ℌ); the closed neighborhood first hyper Zagreb index, CHM1(ℌ); and the closed neighborhood second hyper Zagreb index, CHM2(ℌ). These TIs were computed for graphene structures under the following cases: Case 1: t > 1, s > 1; Case 2: t = 1, s = 1; Case 3: t = 1, s > 1; and Case 4: t > 1, s = 1. In this comparison, these TIs were used to establish correlations with the mechanical properties of Pristine Graphene (9,6), ZGNR (4,9), and AGNR (9,3). The comparative results of these correlations are presented in Table 8 and visualized in Figure 10.
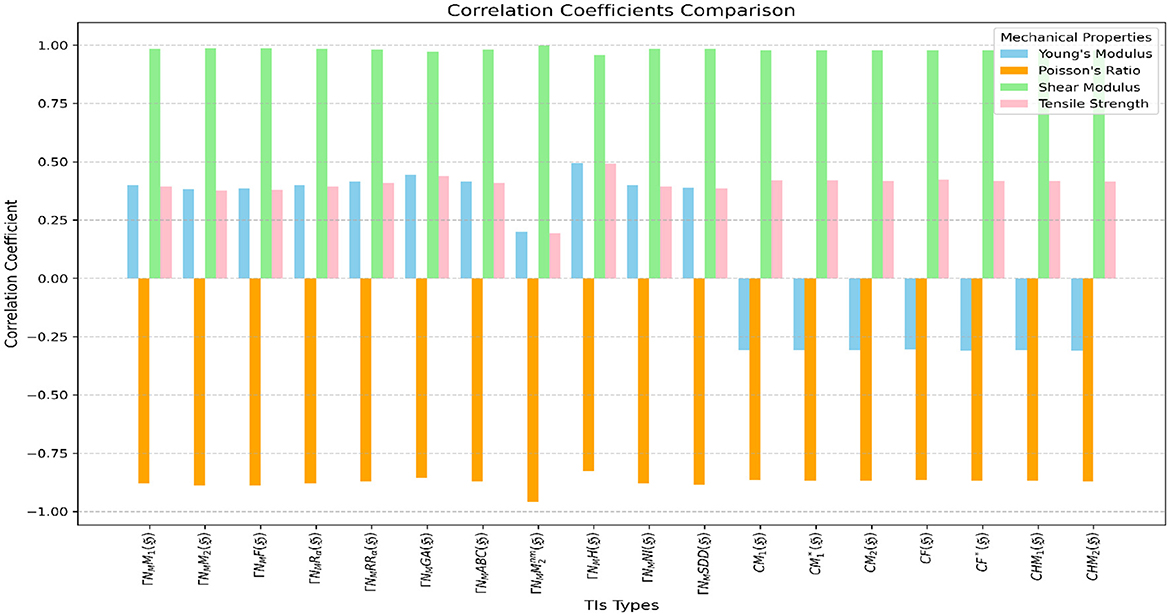
Figure 10. Visualization of correlations between neighborhood multiple TIs and closed neighborhood TIs.
Neighborhood Multiple TIs and Closed Neighborhood TIs demonstrate strong performance in predicting Poisson's Ratio and Shear Modulus. Neighborhood Multiple TIs exhibit strong negative correlations with Poisson's Ratio (r = −0.82487) to (r = −0.95971), with achieving the highest (r = −0.95971). In contrast, Closed Neighborhood TIs also show strong negative correlations with Poisson's Ratio (-0.86658 to -0.86916). For Shear Modulus, Neighborhood Multiple TIs show strong positive correlations (r = −0.98154) to (r = −0.99925), with having the strongest (r = −0.99965), while Closed Neighborhood TIs show strong positive correlations (r = 0.97778) to (r = 0.97886), with CHM2(ℌ) the highest (r = 0.97886). Among these, ΓNMH(ℌ) performed better across all properties, showing moderate correlations with Young's Modulus (r = 0.49446) and Tensile Strength (r = 0.49013). Both TIs performed poorly with Young's Modulus and Tensile Strength, showing weak correlations across graphene variants. Neighborhood Multiple TIs are particularly effective at predicting Poisson's Ratio and Shear Modulus, with high positive and negative correlations, respectively.
7 Discussion and limitations
The results of our study provide valuable insights into the relationship between neighborhood multiple degree-based TIs and the mechanical properties of various graphene structures. We have observed that certain TIs exhibit strong correlations with specific properties, while others show weaker correlations. These findings highlight the importance of selecting appropriate TIs for accurate property prediction. The correlation performance across neighborhood multiple TIs varies significantly among different mechanical properties of graphene variants, primarily due to their underlying structural topology. Key factors include the number of hexagonal rings, edge effects, and defects. Strong correlations, such as those observed in the Poisson Ratio and Shear Modulus for TIs like ,ΓNMF(ℌ), ΓNMM2(ℌ), and ΓNMH(ℌ), across most graphene variations, highlight a consistent relationship between structural topology and mechanical properties. These TIs are particularly effective, often demonstrating linear relationships, as evidenced by near-perfect regression equations. This suggests that such mechanical properties are strongly tied to the uniformity and symmetry of graphene's structural features, which these TIs effectively encode. Overall, neighborhood multiple TIs show exceptional performance with specific graphene variants, particularly for predicting certain mechanical properties.
Weaker or moderate correlations, such as those observed for Young's Modulus and Tensile Strength in most graphene variants, indicate that these properties may depend on factors not adequately captured by neighborhood multiple TIs. Alternatively, certain TIs might lack the sensitivity to detect subtle structural variations significantly influencing these properties. By examining the structural descriptors inherent in each TI, we can hypothesize their relevance to specific mechanical properties. For example, some TIs yield smaller numerical values, while others produce larger ones, depending on their sensitivity to structural features. By thoroughly analyzing these relationships, we can investigate how properties with smaller numerical ranges align with TIs that produce smaller values, and similarly, how properties with larger ranges correspond to TIs that yield higher values. This alignment could help uncover patterns that deepen our understanding of the relationship between TIs and physical properties. A notable observation is the descriptor , which produces values ranging from 0 to 1.2641. These values align well with Poisson's Ratio, which typically falls within the range of 0 to 0.5. In all graphene variants, demonstrated strong performance, showing a high correlation when used to predict Poisson's Ratio.
These limitations can be attributed to the mathematical design of the indices and their focus on either local or global connectivity within the molecular graph. Addressing these gaps may require refining existing TIs or developing new ones to better align with the target properties. Additionally, incorporating machine learning techniques could help identify the most predictive TIs and enable the creation of more accurate models for property estimation.
8 Conclusion
In this study, we introduced the neighborhood multiple M-polynomial for graphene structure, enabling the derivation of eleven neighborhood multiple degree-based multiple TIs across various (t, s) parameters. This approach significantly enhances the generality, speed, and efficiency of analyzing graphene's structural properties, offering a robust framework for systematic exploration. These TIs provided a theoretical framework for predicting graphene's properties without relying on experiments or simulations. Numerical and graphical representations were presented, showcasing the intricate connections between TIs and structural parameters. The QSPR analysis revealed a perfect linear relationship between TIs and mechanical properties, particularly for Poisson's Ratio and Shear Modulus. TIs such as , ΓNMGA(ℌ), ΓNMM2(ℌ), and ΓNMH(ℌ) emerged as robust predictors across most graphene variants. Linear regression models based on these TIs demonstrated the ability to accurately predict mechanical properties across graphene variants, effectively capturing the QSPR and offering a promising tool for understanding and designing graphene-based materials. However, weak correlations were observed for Young's Modulus and Tensile Strength across graphene variants, except in Pristine Graphene (6,6), ZGNR (4,9), and AGNR (6,3), where ΓNMH(ℌ) showed stronger predictive capability with Young's Modulus and Tensile Strength. A comparative study further highlighted the superior performance of neighborhood multiple TIs over closed neighborhood TIs, particularly in predicting Poisson's Ratio and Shear Modulus. This study highlights the potential of neighborhood multiple TIs for robust nanomaterial property prediction, advancing graphene-based design and applications.
Data availability statement
The original contributions presented in the study are included in the article/supplementary material, further inquiries can be directed to the corresponding author/s.
Author contributions
TK: Data curation, Formal analysis, Investigation, Methodology, Software, Writing – original draft, Writing – review & editing. KA: Conceptualization, Data curation, Methodology, Project administration, Supervision, Validation, Writing – review & editing. MA: Conceptualization, Supervision, Validation, Writing – review & editing.
Funding
The author(s) declare that no financial support was received for the research, authorship, and/or publication of this article.
Conflict of interest
The authors declare that the research was conducted in the absence of any commercial or financial relationships that could be construed as a potential conflict of interest.
Generative AI statement
The author(s) declare that no Gen AI was used in the creation of this manuscript.
Publisher's note
All claims expressed in this article are solely those of the authors and do not necessarily represent those of their affiliated organizations, or those of the publisher, the editors and the reviewers. Any product that may be evaluated in this article, or claim that may be made by its manufacturer, is not guaranteed or endorsed by the publisher.
References
1. Stankovich S, Dikin DA, Piner RD, Kohlhaas KA, Kleinhammes A, Jia Y, et al. Synthesis of graphene-based nanosheets via chemical reduction of exfoliated graphite oxide. Carbon N Y. (2007) 45:1558–65. doi: 10.1016/j.carbon.2007.02.034
2. Hu M, Zhang N, Shan G, Gao J, Liu J, Li RK. Two-dimensional materials: Emerging toolkit for construction of ultrathin high-efficiency microwave shield and absorber. Front Phys. (2018) 13:1–39. doi: 10.1007/s11467-018-0809-8
3. Clegg B. The Graphene Revolution: The Weird Science of the Ultra-Thin. London: Icon Books. (2018).
4. Nguyen BH, Nguyen VH. Promising applications of graphene and graphene-based nanostructures. Adv Nat Sci: Nanosci. (2016) 7:023002. doi: 10.1088/2043-6262/7/2/023002
5. Banerjee AN. Prospects and challenges of graphene-based nanomaterials in nanomedicine. Glob J Nanomed. (2016) 1:1–9. doi: 10.19080/GJN.2016.01.555552
6. Hancock Y. The 2010 Nobel Prize in physics-ground-breaking experiments on graphene. J Phys D Appl Phys. (2011) 44:473001. doi: 10.1088/0022-3727/44/47/473001
7. Rouvray D. The pioneering contributions of Cayley and Sylvester to the mathematical description of chemical structure. J Mol Struct: Theochem. (1989) 185:1–14. doi: 10.1016/0166-1280(89)85003-1
9. Wiener H. Structural determination of paraffin boiling points. J Am Chem Soc. (1947) 69:17–20. doi: 10.1021/ja01193a005
10. Ghani MU, Sultan F, Tag El Din ESM, Khan AR, Liu JB, Cancan M, et al. A paradigmatic approach to find the valency-based K-banhatti and redefined Zagreb entropy for niobium oxide and a metal-organic framework. Molecules. (2022) 27:6975. doi: 10.3390/molecules27206975
11. Randić M. Novel molecular descriptor for structure-property studies. Chem Phys Lett. (1993) 211:478–483. doi: 10.1016/0009-2614(93)87094-J
12. Randic M. Characterization of molecular branching. J Am Chem Soc. (1975) 97:6609–15. doi: 10.1021/ja00856a001
13. Shirakol S, Kalyanshetti M, Hosamani SM. QSPR analysis of certain distance based topological indices. Appl Mathem Nonlin Sci. (2019) 4:371–86. doi: 10.2478/AMNS.2019.2.00032
14. Ismail R, Baby A, Xavier DA, Varghese ES, Ghani MU, Nair AT, et al. A novel perspective for M-polynomials to compute molecular descriptors of borophene nanosheet. Sci Rep. (2023) 13:12016. doi: 10.1038/s41598-023-37637-5
15. Abubakar MS, Ejima O, Sanusi RA, Ibrahim AH, Aremu KO. Predicting antibacterial drugs properties using graph topological indices and machine learning. IEEE Access. (2024) 12:181420–35. doi: 10.1109/ACCESS.2024.3503760
16. Gutman I, Trinajstić N. Graph theory and molecular orbitals Total φ-electron energy of alternant hydrocarbons. Chem Phys Lett. (1972) 17:535–8. doi: 10.1016/0009-2614(72)85099-1
17. Furtula B, Graovac A. Vukičević D. Augmented zagreb index. J Mathem Chem. (2010) 48:370–80. doi: 10.1007/s10910-010-9677-3
18. Hao J. Theorems about Zagreb indices and modified Zagreb indices. MATCH Commun Math Comput Chem. (2011) 65:659–70.
20. Kier LB, Hall LH. Molecular Connectivity in Structure-Activity Analysis. New York: John Wiley & Sons (1986).
21. Li X, Gutman I, Randić M. Mathematical Aspects of Randić-Type Molecular Structure Descriptors. Mathematical Chemistry Monographs, University of Kragujevac, Kragujevac: Croatica Chemica Acta (2006).
24. Eliasi M, Vukicevic D. Comparing the multiplicative Zagreb indices. MATCH Commun Math Comput Chem. (2013) 69:765–73.
25. Ali A, Furtula B. Redžepović I, Gutman I. Atom-bond sum-connectivity index. J Mathem Chem. (2022) 60:2081–93. doi: 10.1007/s10910-022-01403-1
26. Amin S, Rehman M, Naseem A, Khan I, Andualem M. Treatment of COVID-19 patients using some new topological indices. J Chem. (2022) 2022:1–10. doi: 10.1155/2022/7309788
27. Islam TU, Mufti ZS, Ameen A, Aslam MN, Tabraiz A. On certain aspects of topological indices. J Mathem. (2021) 2021:1–20. doi: 10.1155/2021/9913529
28. Gupta C, Lokesha V, Shwetha SB, Ranjini P. On the symmetric division deg index of graph. In: Southeast Asian Bulletin of Mathematics. (2016). p. 40.
29. Mondal S, De N, Pal A. On some new neighbourhood degree based indices. arXiv [preprint] arXiv:190611215. (2019). doi: 10.2478/achi-2019-0003
30. Mondal S, Siddiqui MK De N, Pal A. Neighborhood M-polynomial of crystallographic structures. Biointerface Res Appl Chem. (2021) 11:9372–81. doi: 10.33263/BRIAC112.93729381
31. Mondal S, De N, Pal A. On neighborhood Zagreb index of product graphs. J Mol Struct. (2021) 1223:129210. doi: 10.1016/j.molstruc.2020.129210
32. Mondal S, Dey A, De N, Pal A. QSPR analysis of some novel neighbourhood degree-based topological descriptors. Complex Intellig Syst. (2021) 7:977–96. doi: 10.1007/s40747-020-00262-0
33. Abubakar MS, Aremu KO, Aphane M. Neighborhood versions of geometric-arithmetic and atom bond connectivity indices of some popular graphs and their properties. Axioms. (2022) 11:487. doi: 10.3390/axioms11090487
34. Sarkar P, De N, Pal A. On some neighbourhood degree-based multiplicative topological indices and their applications. Polycycl Aromat Compd. (2022) 42:7738–53. doi: 10.1080/10406638.2021.2007141
35. Ghorbani M, Hosseinzadeh MA. The third version of Zagreb index. Discrete Math. Algorithms Appl. (2013) 5:1350039. doi: 10.1142/S1793830913500390
36. Alamian V, Bahrami A, Edalatzadeh B. PI polynomial of V-phenylenic nanotubes and nanotori. Int J Mol Sci. (2008) 9:229–34. doi: 10.3390/ijms9030229
38. Abubakar MS, Aremu KO, Aphane M, Siddiqui MK. Exploring topological indices of oligothiophene dendrimer via neighbourhood M-polynomial. In: RAIRO-Operations Research. (2024).
39. Farahani MR. Π (G, X) Polynomial and Π (G) index of V-phenylenic planar, nanotubes and nanotori. World J Sci Technol Res. (2013) 1:135–43.
40. Ghani MU, Inc M, Sultan F, Cancan M, Houwe A. Computation of Zagreb polynomial and indices for silicate network and silicate chain network. J Mathem. (2023) 2023:1–9. doi: 10.1155/2023/9722878
41. Deutsch E, Klavžar S. M-polynomial and degree-based topological indices. arXiv [preprint] arXiv:14071592. (2014). doi: 10.48550/arXiv.1407.1592
42. Kwun YC, Munir M, Nazeer W, Rafique S, Min Kang S. M-Polynomials and topological indices of V-Phenylenic Nanotubes and Nanotori. Sci Rep. (2017) 7:8756. doi: 10.1038/s41598-017-08309-y
43. Mondal S, De N, Pal A. The M-polynomial of line graph of subdivision graphs. Commun Faculty Sci Univer Ankara Series A1 Mathem Statis. (2019) 68:2104–16. doi: 10.31801/cfsuasmas.587655
44. Li CP, Zhonglin C, Munir M, Yasmin K, Liu JB. M-polynomials and topological indices of linear chains of benzene, napthalene and anthracene. Mathem Biosci Eng. (2020) 17:2384–98. doi: 10.3934/mbe.2020127
45. Jude T, Elango P, Koneswaran M. M-polynomial and topological indices for the anti-tuberculosis drugs. J Nat SciFound Sri Lanka. (2022) 50:10786. doi: 10.4038/jnsfsr.v50i4.10786
46. Verma A, Mondal S, De N, Pal A. Topological properties of bismuth tri-iodide using neighborhood M-polynomial. Int J Mathem Trends Technol. (2019) 65, 83–70. doi: 10.14445/22315373/IJMTT-V65I10P512
47. Mondal S, De N, Pal A. Topological indices of some chemical structures applied for the treatment of COVID-19 patients. Polycycl Aromat Compd. (2022) 42:1220–34. doi: 10.1080/10406638.2020.1770306
48. Shanmukha M, Usha A, Shilpa K, Basavarajappa N. M-polynomial and neighborhood M-polynomial methods for topological indices of porous graphene. Eur Phys J Plus. (2021) 136:1–16. doi: 10.1140/epjp/s13360-021-02074-8
49. Mondal S, De N, Pal A. Neighborhood degree sum-based molecular descriptors of fractal and Cayley tree dendrimers. Eur Phys J Plus. (2021) 136:1–37. doi: 10.1140/epjp/s13360-021-01292-4
50. Mondal S, De N, Pal A. Topological properties of Graphene using some novel neighborhood degree-based topological indices. Int J Mathem Indust. (2019) 11:1950006. doi: 10.1142/S2661335219500060
51. Xavier DA, Ghani MU, Imran M, Nair AT, Varghese ES, Baby A. Comparative study of molecular descriptors of pent-heptagonal nanostructures using neighborhood M-polynomial approach. Molecules. (2023) 28:2518. doi: 10.3390/molecules28062518
52. Gao W, Siddiqui MK, Naeem M, Imran M. Computing multiple ABC index and multiple GA index of some grid graphs. Open Phys. (2018) 16:588–98. doi: 10.1515/phys-2018-0077
53. Karelson M, Lobanov V, KATRITZKY A. Quantum-chemical descriptors in QSAR/QSPR studies. Cheminform. (2010) 08:27. doi: 10.1002/chin.199635327
54. Yan R, Wang K. wei Wang C, gui Guo Q, zhong Wang J. A review of graphene-based catalysts for oxygen reduction reaction. New Carbon Mater. (2020) 35:508. doi: 10.1016/j.carbon.2020.10.007
55. Mueller T, Kusne AG, Ramprasad R. Machine learning in materials science: recent progress and emerging applications. Rev Comp Chem. (2016) 29:186–273. doi: 10.1002/9781119148739.ch4
56. Ghiringhelli LM, Vybiral J, Levchenko SV, Draxl C, Scheffler M. Big data of materials science: critical role of the descriptor. Phys Rev Lett. (2015) 114:105503. doi: 10.1103/PhysRevLett.114.105503
57. Rodríguez-Pérez L, Herranz MÁ, Martín N. The chemistry of pristine graphene. Chem Commun. (2013) 49:3721–35. doi: 10.1039/c3cc38950b
58. Yazyev OV. A guide to the design of electronic properties of graphene nanoribbons. Acc Chem Res. (2013) 46:2319–28. doi: 10.1021/ar3001487
59. Guo B, Liu Q, Chen E, Zhu H, Fang L, Gong JR. Controllable N-doping of graphene. Nano Lett. (2010) 10:4975–80. doi: 10.1021/nl103079j
60. Kalosakas G, Lathiotakis NN, Papagelis K. Width dependent elastic properties of graphene nanoribbons. Materials. (2021) 14:5042. doi: 10.3390/ma14175042
61. Yanovsky YG, Nikitina E, Karnet YN, Nikitin S. Quantum mechanics study of the mechanism of deformation and fracture of graphene. Phys Mesomechan. (2009) 12:254–62. doi: 10.1016/j.physme.2009.12.007
62. Zhang Y, Pan C. Measurements of mechanical properties and number of layers of graphene from nano-indentation. Diam Relat Mater. (2012) 24:1–5. doi: 10.1016/j.diamond.2012.01.033
63. Lee C, Wei X, Kysar JW, Hone J. Measurement of the elastic properties and intrinsic strength of monolayer graphene. Science. (2008) 321:385–8. doi: 10.1126/science.1157996
64. Sáenz Ezquerro C, Laspalas M, García Aznar JM, Castelar Ariza S, Chiminelli A. Molecular modelling of graphene nanoribbons on the effect of porosity and oxidation on the mechanical and thermal properties. J Mater Sci. (2023) 58:13295–316. doi: 10.1007/s10853-023-08810-y
65. Georgantzinos S, Giannopoulos G, Anifantis N. Numerical investigation of elastic mechanical properties of graphene structures. Mater Design. (2010) 31:4646–54. doi: 10.1016/j.matdes.2010.05.036
66. Rajasekaran G, Narayanan P, Parashar A. Effect of point and line defects on mechanical and thermal properties of graphene: a review. Criti Rev Solid State Mater Sci. (2016) 41:47–71. doi: 10.1080/10408436.2015.1068160
67. Gupta S, Dharamvir K, Jindal V. Elastic moduli of single-walled carbon nanotubes and their ropes. Phys Rev B. (2005) 72:165428. doi: 10.1103/PhysRevB.72.165428
68. Xu L, Wei N, Xu X, Fan Z, Zheng Y. Defect-activated self-assembly of multilayered graphene paper: a mechanically robust architecture with high strength. J Mater Chemist A. (2013) 1:2002–10. doi: 10.1039/C2TA00176D
69. Liu X, Metcalf TH, Robinson JT, Houston BH, Scarpa F. Shear modulus of monolayer graphene prepared by chemical vapor deposition. Nano Lett. (2012) 12:1013–7. doi: 10.1021/nl204196v
70. Min K, Aluru NR. Mechanical properties of graphene under shear deformation. Appl Phys Lett. (2011) 98:3534787. doi: 10.1063/1.3534787
71. Yu MF, Files BS, Arepalli S, Ruoff RS. Tensile loading of ropes of single wall carbon nanotubes and their mechanical properties. Phys Rev Lett. (2000) 84:5552. doi: 10.1103/PhysRevLett.84.5552
72. Tabarraei A, Shadalou S, Song JH. Mechanical properties of graphene nanoribbons with disordered edges. Compu Mater Sci. (2015) 96:10–9. doi: 10.1016/j.commatsci.2014.08.001
73. Faccio R, Denis PA, Pardo H, Goyenola C, Mombrú AW. Mechanical properties of graphene nanoribbons. J Phys: Cond Matter. (2009) 21:285304. doi: 10.1088/0953-8984/21/28/285304
74. Xin Z, Jianjun Z, Zhong-Can OY. Strain energy and Young's modulus of single-wall carbon nanotubes calculated from electronic energy-band theory. Phys Rev B. (2000) 62:13692. doi: 10.1103/PhysRevB.62.13692
75. Ansari R, Mirnezhad M, Sahmani S. An accurate molecular mechanics model for computation of size-dependent elastic properties of armchair and zigzag single-walled carbon nanotubes. Meccanica. (2013) 48:1355–67. doi: 10.1007/s11012-012-9671-x
76. Ragab T, McDonald J, Basaran C. Aspect ratio effect on shear modulus and ultimate shear strength of graphene nanoribbons. Diam Relat Mater. (2017) 74:9–15. doi: 10.1016/j.diamond.2017.01.017
77. Zhao H, Min K, Aluru NR. Size and chirality dependent elastic properties of graphene nanoribbons under uniaxial tension. Nano Lett. (2009) 9:3012–5. doi: 10.1021/nl901448z
78. Majumder S, Meher A, Moharana S, Kim KH. Graphene nanoribbon synthesis and properties in polymer composites: a review. Carbon N Y. (2024) 216:118558. doi: 10.1016/j.carbon.2023.118558
79. Chen Z, Zhang W, Palma CA, Lodi Rizzini A, Liu B, Abbas A, et al. Synthesis of graphene nanoribbons by ambient-pressure chemical vapor deposition and device integration. J Am Chem Soc. (2016) 138:15488–96. doi: 10.1021/jacs.6b10374
80. Kojima T, Onishi T, Nakae T, Sakaguchi H. Synthesis of graphene nanoribbons by topological engineering and their applications. Carbon N Y. (2021) 182:857–857. doi: 10.1016/j.carbon.2021.06.076
81. Zheng Y, Xu L, Fan Z, Wei N, Huang Z. A molecular dynamics investigation of the mechanical properties of graphene nanochains. J Mater Chem. (2012) 22:9798–805. doi: 10.1039/c2jm16626g
82. Aparicio E, Tangarife E, Munoz F, Gonzalez R, Valencia F, Careglio C, et al. Simulated mechanical properties of finite-size graphene nanoribbons. Nanotechnology. (2020) 32:045709. doi: 10.1088/1361-6528/abc036
83. Orlov A, Ovid'ko I. Mechanical properties of graphene nanoribbons: a selective review of computer simulations. Rev Adv Mater Sci. (2015) 40:249–50.
84. Kalosakas G, Lathiotakis N, Galiotis C, Papagelis K. In-plane force fields and elastic properties of graphene. J Appl Phys. (2013) 113:4798384. doi: 10.1063/1.4798384
Keywords: graphene, neighborhood multiple M-polynomial, TI, regression, chemical graph theory
Citation: Kekana T, Aremu KO and Aphane M (2025) Exploring a novel approach for computing topological descriptors of graphene structure using neighborhood multiple M-polynomial. Front. Appl. Math. Stat. 10:1508134. doi: 10.3389/fams.2024.1508134
Received: 08 October 2024; Accepted: 16 December 2024;
Published: 17 January 2025.
Edited by:
Donatelli Marco, University of Insubria, ItalyReviewed by:
Daniel Barci, Rio de Janeiro State University, BrazilArmen Kocharian, California State University, Los Angeles, United States
Copyright © 2025 Kekana, Aremu and Aphane. This is an open-access article distributed under the terms of the Creative Commons Attribution License (CC BY). The use, distribution or reproduction in other forums is permitted, provided the original author(s) and the copyright owner(s) are credited and that the original publication in this journal is cited, in accordance with accepted academic practice. No use, distribution or reproduction is permitted which does not comply with these terms.
*Correspondence: Kazeem Olalekan Aremu, YXJlbXVrYXplZW1vbGFsZWthbkBnbWFpbC5jb20=; YXJlbXUua2F6ZWVtQHVkdXNvay5lZHUubmc=
 Tumiso Kekana
 Kazeem Olalekan Aremu
 Maggie Aphane1