 Dipanjan Chakraborty1*†
 Vitaly V. Ganusov
94% of researchers rate our articles as excellent or good
Learn more about the work of our research integrity team to safeguard the quality of each article we publish.
Find out more
REVIEW article
Front. Appl. Math. Stat., 31 January 2024
Sec. Mathematical Biology
Volume 10 - 2024 | https://doi.org/10.3389/fams.2024.1355373
This article is part of the Research TopicMathematical Modeling of Diseases at Population-Level and Cellular-LevelView all 7 articles
Tuberculosis (TB), a disease caused by bacteria Mycobacterium tuberculosis (Mtb), remains one of the major infectious diseases of humans with 10 million TB cases and 1.5 million deaths due to TB worldwide yearly. Upon exposure of a new host to Mtb, bacteria typically infect one local site in the lung, but over time, Mtb disseminates in the lung and in some cases to extrapulmonary sites. The contribution of various host components such as immune cells to Mtb dynamics in the lung, its dissemination in the lung and outside of the lung, remains incompletely understood. Here we overview different types of mathematical models used to gain insights in within-host dynamics of Mtb; these include models based on ordinary or partial differential equations (ODEs and PDEs), stochastic simulation models based on ODEs, agent-based models (ABMs), and hybrid models (ODE-based models linked to ABMs). We illustrate results from several of such models and identify areas for future resesarch.
Mycobacterium tuberculosis (Mtb) is a bacterium causing the infectious disease tuberculosis (TB). One study estimated that over a billion people died due to TB in human history [1]. TB is an airborne disease that primarily affects the lungs but can also damage other organs as well [2]. Mtb spreads through coughing, sneezing, or close contact with an infected person. During outbreaks, one individual with TB may infect tens of close contacts [3, 4]. On average, however, Mtb is not a highly transmissible pathogen with estimated country-level average number of secondary infections produced by a single infected individual in a completely susceptible population (R0) varying between 0.2 to 4.3 [5].
Mtb causes significant morbidity and mortality, with millions of new cases and deaths reported annually [6, 7]. Despite medical advancements, TB remains a global challenge, particularly in regions with limited healthcare resources [8], underscoring the importance of continued research and global cooperation in combating this infectious disease. There is only one currently approved vaccine against TB, Bacillus Calmette-Gueŕin (BCG); however, its efficacy is not sufficient to prevent the disease in most individuals [9]. There are now several highly effective drug treatments for TB, but these are still relatively long (4–6 months) and require daily taking of several antibiotics [10]. Long duration of TB treatment increases the risk of toxicity and patient non-compliance [11]. Development of efficient TB vaccines and further reduction of treatment duration, e.g., by augmenting host immune response via so-called host-directed therapy [12], would be helped by a better understanding of how Mtb causes the disease and how host immunity plays a role at preventing or exacerbating the disease.
Because Mtb is transmitted primarily via aerosols [13], the lung is the primary site where Mtb bacteria initiate the infection. Three basic outcomes are possible following the initial exposure to Mtb: (i) macrophages are recruited to the infection site; they engulf and eliminate the bacteria; (ii) bacterial population may grow rapidly due to the failure of initial innate response which leads to the active disease, (iii) adaptive immunity contains the bacteria in a structure called granuloma making the infection latent. The latter, latent infection can persist for a long period, often to the whole lifespan of host [14–16]. A previous study suggested that one-third of the world's population has been infected with Mtb [17], and recent re-evaluation puts about a quarter of the world's population to have latent TB infection [18]. Given that following exposure to Mtb, active disease is most likely within the first several years [19], how much reactivation of latent TB infection decades after a primary exposure remains largely unknown and is often based on individual case studies (e.g., TB after using tumor necrosis factor (TNF)-blocking treatments [20]). In addition to the infection of the lung, in some instances, Mtb can also disseminate to other tissues such as lymph nodes (LNs), spleen, bone marrow, and brain; however, specifics of such dissemination (e.g., the sequence of organ infection, how bacteria get to these tissues, etc) remain incompletely understood [21–23].
Because studying Mtb dynamics in human lungs is nearly impossible, various animal models such as guinea pigs, mice, rabbits, and monkeys have been used to understand TB pathogenesis [24, 25]. However, none of these animal models likely represent adequately the full spectrum of human TB. Mtb is a slow-growing bacteria (with doubling time in vivo of around 24 h, [26, 27]), and measuring bacterial numbers and immune response in the lung of animals requires sacrificing the host that makes experiments with Mtb long and expensive. Mathematical modeling can be a complementary tool to help integrate limited experimental data into a coherent framework, help identify areas where important experimental measurements may be useful, and help discriminate between alternative hypotheses ([28], Figure 1). Models can also explore the impact of various interventions (e.g., vaccination and/or drug treatment) that could be tested in additional experiments [30].
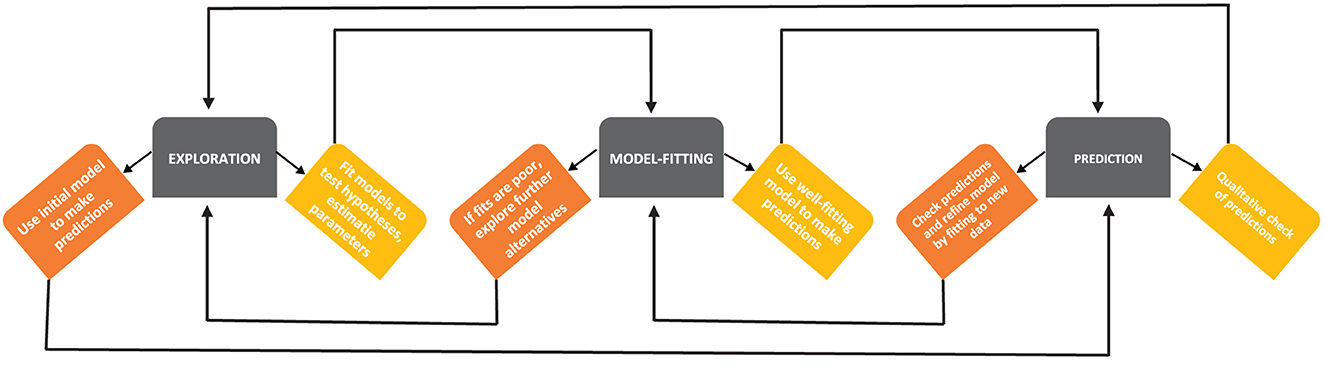
Figure 1. A schematic diagram of developing mathematical models (based on Handel et al. [29]). Building mathematical models of a biological system involves several steps, such as exploration of the model structure and essential details, predictions of the model stemming from its basic form and parameter values, and more rigorous fitting of the models to data. At every step, there may be model iterations, e.g., if a given model does not accurately fit the data, exploring additional alternative models is warranted [28].
Despite its potential importance, mathematical modeling of TB pathogenesis has focused primarily on epidemiological spread of Mtb; e.g., current estimates of number of TB cases and deaths due to TB come in part from mathematical modeling-based extrapolations of incidence in various countries to the world's population [6]. There has been less emphasis on mathematical modeling of within-host dynamics of Mtb, immune response to Mtb, and how drug treatment impacts Mtb dynamics; furthermore, recent reviews of mathematical/computational modeling of within-host Mtb dynamics did not focus on how models can be rigorously compared to data (e.g., [31]). Here, we fill in this gap and discuss different types of mathematical models of within-host dynamics of Mtb and how these models may have contributed (or not) to a quantitative understanding of TB pathogenesis. We also focus on issues related to comparing models to data to estimate model parameters, especially for stochastic models. We divide the previously published mathematical models of within-host Mtb dynamics into two categories: spatially homogeneous and spatially heterogeneous models. Among the spatially homogeneous models, we discuss ordinary differential equation (ODE)-based deterministic models and stochastic realizations of such ODE-based models. Further, among spatially heterogeneous models, we discuss partial differential equation (PDE)-based models, agent-based models (ABMs), and hybrid models. We also present a comparative analysis of the strengths and weaknesses of each modeling approach and potential avenues for future research.
For papers on mathematical modeling of within-host dynamics of Mtb, we searched primarily PubMed (https://pubmed.ncbi.nlm.nih.gov/) and supplemented our results by searches on Google Scholar (https://scholar.google.com/). Queries for the search included “mathematical model,” “tuberculosis,” “within-host,” and others. We also searched other published papers and reviews for references to the papers relevant to the mathematical modeling of within-host dynamics of Mtb. Because we cannot be sure we can find all the relevant papers, our paper should be viewed as an overview of the mathematical modeling rather than a comprehensive review. Our paper focuses explicitly on mathematical modeling of within-host dynamics of Mtb. Thus, we specifically excluded studies that use mathematical modeling to investigate various aspects of the epidemiological spread of Mtb.
For example, we got 308 hits in PubMed using the query “‘mathematical model' and tuberculosis” most of which were on the epidemiological spread of Mtb. We got 27 hits in PubMed using the query “‘mathematical model' and tuberculosis and ‘within host'.” We got 23 hits in PubMed using the keyword combination “ordinary differential equation tuberculosis.” Two of these papers are cited here. Additionally, we got 14 hits in PubMed using the keyword combination “partial differential equation tuberculosis.” We present seven of these papers here. Other papers on this subject are from direct Google or Google Scholar searches (Google Scholar typically returns thousands of hits that do not include published papers). Papers on other topics were identified similarly.
The lung and whole body are highly heterogeneous tissues in humans and animals. However, many mathematical models of within-host Mtb dynamics assume that such heterogeneity is not critical for TB pathogenesis. In such models, spatial variations in the distribution of bacteria, immune cells, and other components are thus not explicitly considered. This simplification is often made for analytical and/or computational tractability and to distill the essential dynamics governing the interaction between the host and Mtb. Furthermore, spatially explicit experimental data are not readily available to parameterize mathematical models, forcing the modelers to omit spatial aspects of Mtb dynamics in their models. Nevertheless, spatially homogeneous models have provided a foundational understanding of the within-host Mtb dynamics, including the estimation of key parameters such as Mtb division and death rates in vivo. Such models also serve as a starting point for investigating key biological processes without the added complexity introduced by spatial heterogeneity. We will start our review with a discussion of spatially homogeneous models, mainly based on ODEs and on the conversion of such models to their stochastic counterparts.
ODE-based models are typically deterministic; the model parameters and initial conditions fully define the model predictions. Many analytical and numeric methods are developed for the analysis of ODE-based mathematical models, and there are robust ways of fitting such models to data [32]. These benefits make ODE-based mathematical models the first choice when developing a new model of a biological system. The primary challenge in constructing ODE-based models lies in the necessity to rely on lateral thinking or inferential capabilities to gain a precise understanding of how the system and its internal components function. Steps in developing ODE models can be categorized as model exploration, model fitting, predictions, and model discrimination (Figure 1).
Developing an ODE-based model as a compartmental model is common, where each compartment may represent a given within-host population [29]. As far as we are aware, Antia et al. [33] were the first to specifically develop a mathematical model of within-host Mtb dynamics to explain how, after a long period of latent infection (with low levels of bacteria), Mtb is able to reach high levels and thus cause active disease. The authors proposed two key elements in their model: the ability of bacteria to enter dormant, non-replicative state and loss of Mtb-specific immune (T cell) response due to continuous cell division and reach of the Hayflick limit [34–36]. The Mtb dynamics during primary infection is given by the short-term dynamics model:
where P denotes the density of actively replicating pathogen, Q is the density of dormant (non-replicating) bacteria, X represents the immune response, h is the killing rate of Mtb by the immune response, f and g are the rates of dormancy and reactivation of the bacteria, s and d are the rates of T cell proliferation and death, a is the rate of production of new T cells from the thymus, and k the Mtb density at which the rate of T cell proliferation is half-maximal. Parameter values were assumed ad hoc to provide a plausible pathogen and immune response dynamics [33, 37, 38]; however, the model predictions were not compared to actual experimental data. In this relatively simple model, Antia et al. [33] found that slower growth rates r lead to a smaller nadir of bacterial counts after the peak, suggesting that slowly growing bacteria have a higher chance of persistence. However, in this version of the model, bacteria and host immunity reach a steady state with a relatively limited number of bacteria that may not represent active TB (Figure 2A). Therefore, in the model of long-term dynamics, Antia et al. [33] extended the dynamics of T cell response (Equation 3), by tracking the number of divisions Mtb-specific T cells have undergone and by making the production of new T cells from the thymus to be dependent on pathogen density (Figure 2B):
where a1 is the production of new T cells, m is the conversion coefficient of the function (linear to convex), a2 be the half saturation rate of the thymus due to the parasite, and xi is the number of T cells that have undergone i = 1…n divisions, and n is the Hayflick limit after which T cells stop dividing. Thus, in Equation (3) . In this model, T cells initially control Mtb dynamics, but as Mtb stops production of new T cells from the thymus and T cells reach the Hayflick limit, T cell response collapses and Mtb density increases without control (Figure 2B).
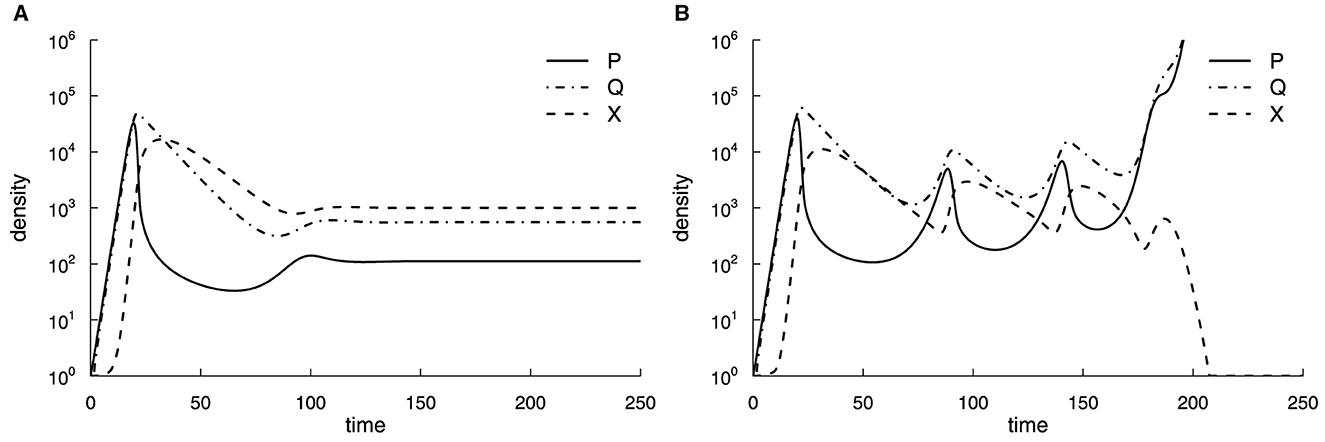
Figure 2. Suppression of production of new T cells by Mtb and a limit on how many divisions Mtb-specific T cells can explain progression to active TB. We simulated the dynamics of the actively replicating pathogen P, its quiescent state Q, and immune response X using Equations (1)–(3) (A) or Equations (1)–(6) (B). Parameter values in the short-term simulations (A) were as follows: r = 1.0, f = 0.5, g = 0.1, h = 10−3, d = 0.1, s = 1.0, k = 103, a = 0.1, with initial conditions P(0) = 1, Q(0) = 0, and X(0) = 1. For long-term simulations (B), the Hayflick limit was set to n = 23, and the total immune response was . In (B), parameter values were as those in (A) except for a1 = 0.1, a2 = 100, and m = 3 [33].
While being innovative (the first model for within-host Mtb dynamics), this model made several assumptions that are oversimplified and may be irrelevant to TB pathogenesis. The model assumed unlimited growth of Mtb while we know that Mtb typically is limited by the availability of various resources such as macrophages [39]. The assumption that during a latent phase, the number of bacteria is low or undetectable, but then it rises orders of magnitude in active disease is not always observed in animal infections [40]. Finally, recent work suggested that T cells have an incredible capacity for renewal [41], so the Hayflick limit probably does not apply to the loss of Mtb control by T cell response. This example nicely illustrates how model assumptions drive model predictions, so it is clear how the model generates the observed outcomes. While these assumptions were based on a contemporary understanding of TB pathogenesis, new experimental observations may invalidate such assumptions.
There were many further developments of ODE-based models of within-host dynamics of Mtb. In particular, Kirschner [42] developed a model of coinfection of a host with Mtb and HIV and showed how infection with Mtb may result in loss of CD4 T cells and/or increase in viral load. The key assumption in the model was that Mtb infection results in the proliferation of T cells, fueling further HIV replication and, thus, an increase in viral load. Wigginton and Kirschner [43] extended this basic model by including many additional details of the within-host dynamics of Mtb, such as populations of intra- and extracellular bacteria, different cytokines, macrophages, and different subsets of Mtb-specific CD4 T cells. In total, the model consisted of 12 ODEs and over 50 parameters. The authors reached a number of interesting predictions, such as the importance of the balance of different cytokines (IFNγ, IL-10, and IL-4) in regulating Mtb-specific T cell response and how T cell cytotoxicity and cytokine production may define the outcome of infection.
Among different cytokines, IFNγ plays a crucial role in activating the classically activated macrophages (CAM) at the time of increasing infection, while during the low microbial load, alternatively activated macrophages (AAM) act as the first line of defense against Mtb. The switching time is defined as the first time when CAM becomes more dominant than the AAM. Day et al. [44] explored how this switching time can be optimized using a mathematical model that can be tested experimentally.
Raman et al. [45] took a different approach to modeling the within-host dynamics of Mtb. Instead of using ODEs, the authors developed a Boolean network-based mathematical model that predicts an outcome depending on which nodes are in the ON or OFF state. The model included 75 nodes corresponding to states of host cells and the bacteria as well as various intracellular components such as reactive oxygen intermediates (ROI), cathelicidin, and others. Perturbation of states of various nodes showed the importance of phagocytosis and cytokines (IFNγ and IL-10) in determining Mtb persistence.
Pedruzzi et al. [46] considered Mtb dynamics within its primary target, the macrophage, and investigated the role of iron, lipids, and nitric oxide in determining the outcome of intracellular infection. The authors concluded that Mtb's interference with lipid and iron turnover in macrophages may result in the persistence of bacteria. A follow-up study considered how molecules such as PGE2, LXA4, and LTB4 may further impact within-host Mtb dynamics [47].
While previous papers typically focused on modeling Mtb dynamics in the whole host, Gong et al. [48] were first (1) to consider Mtb dynamics in individual subpopulations within the lung representing different stages of granuloma formation and (2) to explicitly model Mtb dynamics in the lung and lung-draining LNs. One of the interesting results of the paper was continuous/slow transition from a latent TB to active TB that was consistent with the previously established concept of progressive TB [49]. Importantly, Mtb dynamics in the granulomas was considered superficially as a transition from healthy tissue to a diseased one (both in the lung and LNs). Thus, the model was unable to accurately predict the relationship between the number of granulomas and the severity of the disease [50]. This limitation was partly mediated by ABMs and hybrid models developed later (see next section).
Several papers developed mathematical models to understand how drug treatment impacts Mtb dynamics. In particular, Bartelink et al. [51] were first to develop a detailed model of distribution kinetics of various drugs in tissues of Mtb-infected mice with impact of such drugs on Mtb elimination kinetics (so-called pharmacokinetics (PK)–pharmacodynamics (PD) or PK/PD models, [52]). The model, parameterized with data from Mtb-infected mice, predicted the impact of shorter treatments on the probability of TB relapse. The follow-up studies extended the model to Mtb dynamics in granulomas or simplified the model to explain Mtb dynamics in wild-type mice or mice lacking adaptive immunity [53, 54].
Importantly, with the exception of the models on drug treatment of Mtb infection [53, 54], most previous models did not estimate model parameters by fitting model predictions to data. Instead, parameters were assumed or indirectly inferred from other published data (e.g., half-life times of various cytokines). We next discuss several papers that estimated key parameters determining within-host Mtb dynamics by rigorously fitting model predictions to data.
Following aerosol-based infection of mice with Mtb, the number of bacteria found in murine lungs increases exponentially until 3–4 weeks, after which the numbers stabilize and slowly increase over time [26]. Whether the stable numbers of Mtb in the lung after 3–4 weeks post infection are due to the bacteria entering a dormant, non-replicative state or is due to continuous Mtb replication and elimination by host immunity remained unresolved. Gill et al. [26] developed a novel strain of Mtb carrying an unstable plasmid that is lost at cell division. In the presence of an antibiotic, plasmid-free cells are killed so that plasmids can be maintained in the bacterial population in a culture. However, in the absence of the antibiotic, bacteria lose the plasmid at a rate that only depends on the number of divisions and does not depend on the rate at which Mtb was replicating in the culture [26]. Therefore, by measuring the frequency of plasmid-bearing cells in the population, one can estimate the average number of cell divisions, and by knowing the total number of bacteria, the rate of Mtb replication and death can be estimated. To estimate these rates rigorously, Gill et al. [26] developed a basic mathematical model for the dynamics of plasmid-bearing (P) and plasmid-free (F) cells (Figure 3):
where r and δ are the rates of Mtb replication and death, respectively, that depends on the time since infection, s = 0.18 is the segregation coefficient, determining plasmid loss and estimated in vitro, and N(t) = P(t)+F(t) is the total number of bacteria (Equations 7, 8, 9 are given in supplement of [26]). Because Gill et al. [26] measured Mtb counts in the lungs of infected mice at five-time points (1, 13, 26, 69, and 111 days post-infection), the parameters r and δ were assumed to be constant within a given time interval (e.g., 1–11 days post-infection) but vary between time intervals. Gill et al. [26] used linear regression analysis to show that the rate of Mtb replication during the chronic phase of infection is only four–five fold lower than that during early Mtb growth. This result suggests that the apparent constancy of Mtb numbers after 3–4 weeks of infection is due to a balance between relatively active replication and elimination by host immunity.
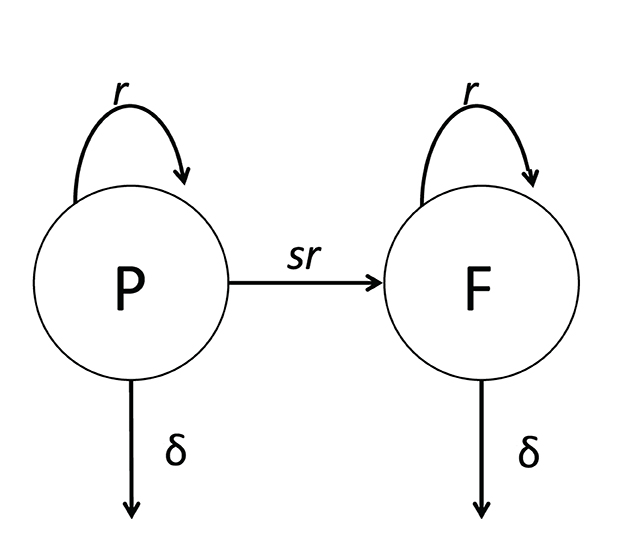
Figure 3. Cartoon of a general mathematical model of Mtb dynamics in mice. The model is based on the dynamics of Mtb strain H37Rv carrying an unstable plasmid pBP10 [26]. In the model (see Equations 7, 8), plasmid-bearing (P) and plasmid-free (F) bacteria replicate and die at rates r and δ, respectively; plasmid-free bacteria are formed during a division of plasmid-carrying cell with the probability s [26, 27].
McDaniel et al. [27] extended this pioneering study by (1) considering that the segregation coefficient s could depend on time since infection, (2) allowing a fraction of bacteria to enter dormant, non-replicative stage, and (3) developing a method to fit the numerical solution of the mathematical model (Equations 7, 8) to all data simultaneously without subdividing the data into different time intervals. Assuming a constant segregation coefficient, McDaniel et al. [27] showed that a simple model with fewer changes in the parameters with time since infection can describe the data with similar accuracy as the whole model based on 10 parameters. Additionally, this approach allowed to investigate how the estimated rates of Mtb replication and death may depend on actual value of the segregation coefficient (Figure 4). Specifically, the authors showed that the segregation coefficient cannot be greater than s* = 0.204 for all estimated parameters to be positive. Finally, McDaniel et al. [27] showed that to explain the data, most bacteria must be replicating during the chronic stage of infection as increasing the rate at which actively replicating bacteria become dormant above a critical value provided significantly worse fit based on Akaike Information Criterion [55].
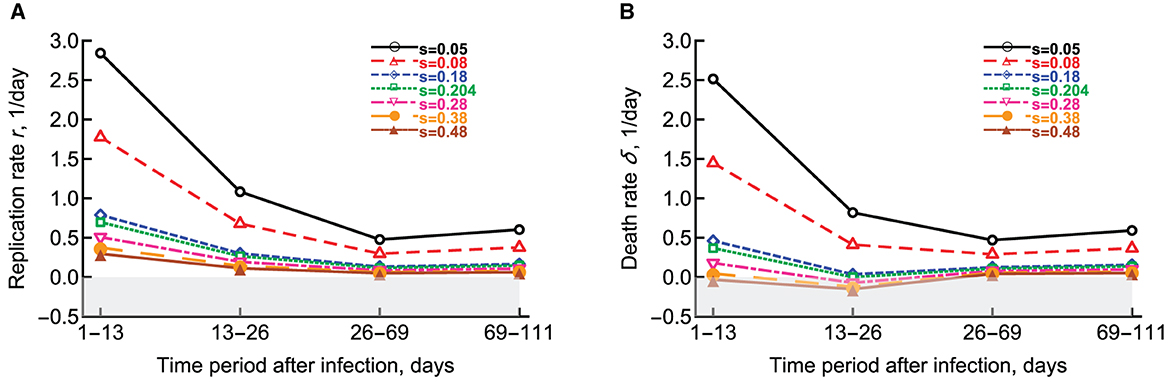
Figure 4. Change in the estimated replication r and death δ rates of Mtb strain H37Rv-pBP10 in B6 mice. We fitted the model (Equations 7, 8) to the data from Gill et al. [26] assuming different values of the segregation coefficient s and estimated the rate of Mtb replication (A) or the rate of Mtb death (B) as the function of the different time period since infection [27]. Gray boxes denote biologically-unrealistic (negative) values. Parameters for Mtb replication and death estimated in Gill et al. [26] can be found in (A, B) at s = 0.18 (blue diamonds).
So far, the mathematical models we have considered assume that a given set of parameters, Mtb dynamics, occurs deterministically. One inherent assumption of such models is that cell numbers in the model are relatively large, so intrinsic variability in the process of cell division/death/migration/etc can be ignored. This assumption is often justified in typical experiments with Mtb infection of mice because it is common to infect mice with hundreds of bacteria [26, 56]. However, the current consensus is that infection of humans is likely to occur with few or even with a single bacterium [13, 56]. For example, by passing the air from a ward with many TB patients through a cage with guinea pigs and detecting infection in the animals, one study estimated that it would take many days of exposure for an individual to be infected [13]. Such a low infection rate suggests that when infections start, a single bacterium is likely responsible. In monkeys, it was suggested that individual granulomas are found by single bacteria [57]. In those cases, Mtb dynamics is likely to be stochastic due to inherent randomness when bacteria divide, die, and migrate [58].
One straightforward approach to model Mtb dynamics stochastically is to convert an existing ODE-based model into a set of transition rules and simulate the dynamics using the Gillespie algorithm [59]. As far as we know, Plumlee et al. [56] was the first to show how the simplest ODE-based model can predict stochastic elements of within-host Mtb dynamics. One major innovation of that study was to infect mice with an ultra-low dose (ULD) of Mtb. By diluting the stock bacteria 50-fold, the authors found that only 60%–70% of mice had any bacteria in their lungs a few weeks after exposure, suggesting that the average dose of Mtb was about one bacterium/mouse. Using barcoded strains, the authors also showed that the number of barcodes recovered in individual mice nicely followed a Poisson distribution, consistent with random infection.
Interestingly, bacterial numbers found in the lungs, lung-draining LNs, and spleen were highly variable between individual mice with a higher coefficient of variation (CV) compared to mice infected with about 100 bacteria. The authors used a simple model with parameter estimates from the previous study ([27], Equation 9) and simulated Mtb dynamics stochastically by converting the ODE model into a set of rate rules. The authors showed that higher initial doses resulted in more deterministic change in the number of bacteria in the lungs (with a lower CV), consistent with experimental observations.
Here, we repeated this analysis using the adaptivetau library in R (Figure 5). By using parameters for Mtb replication and death estimated previously ([26, 27], Figure 4) and letting N(0) = 1 we found that less than half of all simulations (434/1,000) resulted in productive infection indicating a substantial chance of Mtb death upon entry into the lung. More importantly, model predictions with parameters from Gill et al. [26] were inconsistent with the measurements of bacterial counts found in ULD-infected mice; the discrepancy was larger at day 26 (Figure 4B). These results suggest the Mtb dynamics at conventional (~100 bacteria/mouse) and ultra-low (~1 bacterium/mouse) doses may occur differently. Therefore, to parameterize mathematical models of stochastic Mtb dynamics, we need mathematically-rigorous methods to fit stochastic simulations-based models to data.
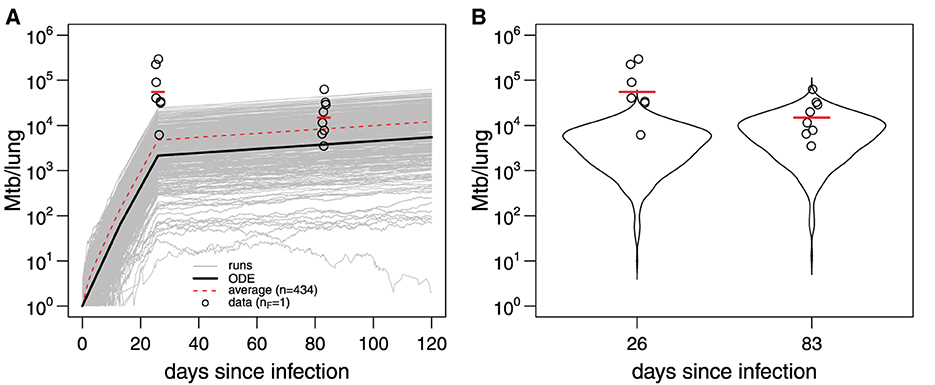
Figure 5. Mathematical model parameterized using data from conventional dose infection of B6 with Mtb H37Rv does not accurately predict Mtb dynamics at ultra-low doses. (A) The 1,000 trajectories (gray lines) from stochastic simulations of Mtb dynamics [Equation 9 with parameters in Figure 4 for s = 0.18 and N(0) = 1] using adaptivetau library in R. Dashed red line represents the average of all trajectories, and black line represents the predictions of the deterministic model. Data (bacterial numbers in the lung) are shown as markers [56]. Red bars denote the geometric mean. (B) The frequency distribution of model trajectories (violin plots) in (A) for day 26 or 83 post-infection. The average number of bacteria starting the infection in the data was nF = 1 [56].
Methods of fitting ODE-based deterministic mathematical models to data are well developed; typically, one uses least squares or its extensions (e.g., Bayesian inference) to find model parameters best consistent with the data ([60], Figure 6A). However, fitting stochastic mathematical models to data is less common. Several novel methods, for example, based on generating diffusion approximation to the original stochastic model or generating moments for the stochastic model, have been proposed [61–65]. Poovathingal and Gunawan [61] and later Aguilera et al. [62] proposed an approach for fitting stochastic simulations to noisy, high-throughput experimental data. In this method, the probability distribution function (PDF) is constructed for the data and for the model predictions, and the two distributions are compared using the least squares approach (Figure 6B). The best-fit parameters are then found by minimizing the sum of squared residuals. In our recent work, we have developed an alternative method in which we compare cumulative distribution function (CDF) coming from the data and the stochastic simulations by calculating the distance between the two CDFs, e.g., using the Kolmogorov–Smirnov test or other similar tests (Figure 6C and Chakraborty et al., in prep).
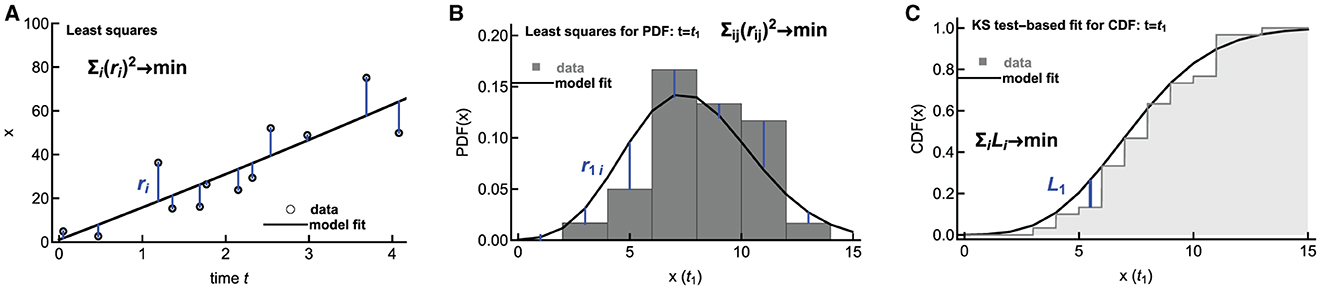
Figure 6. Alternative methodologies of fitting mathematical models to data. Deterministic models are typically fit to data using least squares by minimizing the sum of squared residuals (A). To fit stochastic predictions of a mathematical model to data, one approach is to create a histogram of data and model predictions and compare these two histograms using least squares ((B), [61, 62]). Alternatively, the distance between cumulative distributions given in the data and predicted by a mathematical model can be calculated using the Kolmogorov–Smirnov (KS) test (C). In (B, C), the distributions are shown only for a one-time point t = t1, but typically, the distributions are calculated for several time points.
While homogeneous, ODE-based mathematical models provided important insights into within-host dynamics of Mtb, they cannot predict spatially heterogeneous features of Mtb dynamics in the lung and other tissues. In particular, the formation of granulomas, highly organized structures in the lungs of Mtb-infected humans and some experimental animal species [66], would be difficult to model using spatially homogeneous ODEs. PDE-based models, ABMs, and hybrid models are the prime examples of spatially heterogeneous models.
Some PDE-based models have been developed to elucidate the formation and dissemination of Mtb-induced granulomas. In particular, Gammack et al. [67] developed coupled reaction-diffusion-advection PDEs to capture the dynamics of macrophages, bacterial populations, and a bacteria-produced chemokine (attractant). In the model, the authors integrated diverse types of macrophages, distinguished by their killing capacity. The flux conditions at the granuloma boundary represent the movement of immune cells from the LNs to the granuloma. Numerical simulations of the model revealed that the growth of the granuloma structure is contingent upon the influx of new bacteria. Moreover, the analytical calculations of a simplified version of the model identified conditions under which bacterial load decreases or increases, thereby influencing the growth or contraction of the granuloma.
By employing four distinct approaches, one of which involves PDEs, Gammack et al. [68] investigated both global and local immune responses to Mtb. Further, Hao et al. [69] framed a mathematical model consisting of a collection of PDEs where a parameter α, called the strength of the adaptive immune response, signifies the flux rate of T cells and M1 macrophages into the granuloma. Model simulations suggested that an increase in α (i.e., stronger immune response) reduced the size of the granuloma and bacterial load. The authors further investigated the impact of hypothetical drugs suppressing the secretion of cytokines IL-10 and IL-13 on Mtb control. The authors also found that increasing early recruitment of T cells and macrophages to the granuloma shortens the time at which protective M1 macrophages exceed the number of detrimental M2 macrophages, thus resulting in improved bacterial control.
As far as we are aware, Segovia-Juarez et al. [70] developed the first ABM to study within-host dynamics of Mtb. Specifically, the authors studied potential mechanisms during the formation of granulomas in the Mtb-infected lungs. The model depicted macrophages and T cells as agents within a cellular automata-like environment, while cytokines were represented continuously. By using sensitivity analyses, the authors suggested important roles of several processes such as (1) the diffusion of chemokines, (2) prevention of macrophage overcrowding within the granuloma, (3) the timing, location, and number of T cells within the granuloma, and (4) the overall host ability to activate macrophages during granuloma formation.
Ray et al. [71] developed a computational hybrid ABM to characterize the role of TNF in controlling Mtb infection in a single granuloma (Figure 7). This model suggested that TNF activities have a profound impact on controlling the Mtb infection by activating the macrophage for controlling bacterial growth. In addition, the model suggested that bacterial numbers are a strong contributing factor to the granuloma structure. These predictions are consistent with experimental observations on reactivation of latent TB infection in individuals starting anti-TNF therapy [72]. Fallahi-Sichani et al. [73] and Cilfone et al. [74] extended the model of Ray et al. [71] to investigate the process which regulates TNF concentration. Results of the analysis suggest that the combined effects of both molecular and cellular processes control the interplay between TNF concentration and bacterial numbers in a granuloma. Repasy et al. [75] investigated the effect of burst size (number of bacteria produced by an infected macrophage) on the formation of granuloma. Bru and Cardona [76] formed an ABM based on cellular automata. The model showed an important role of the foamy macrophages in bacillary drainage in animal species that poorly control Mtb, such as minipigs. The model also predicted that stopping bacterial growth early after the infection by adaptive immunity may be difficult.
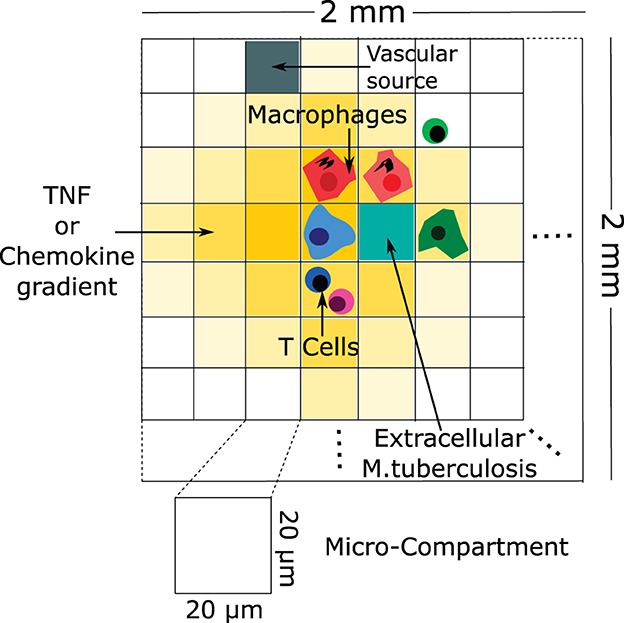
Figure 7. An example of a schematic of agent-based modeling (based on Ray et al. [71]). The configuration of the agent-based model environment is characterized by a grid measuring 100 × 100, representing a 2 mm × 2 mm segment of lung tissue. Within this grid, discrete entities consist of macrophages and T cells. Continuous entities such as TNF, chemokines, and extracellular Mtb are also represented. Each micro-compartment has the capacity to house either a single macrophage or up to two T cells, in addition to extracellular bacteria, TNF, and chemokines. Vascular sources are identified in a randomly selected percentage of micro-compartments, facilitating the recruitment of new macrophages and T cells to the grid through the action of chemokines and TNF.
Prats et al. [77] developed a model to investigate how granulomas may be disseminated in the lung. In this model, both local endogenous reinfection and coalescence of neighboring lesions in the lung can give rise to new granulomas (so-called “bubble model”). Authors modeled each lesion as a spheroid, like a soap bubble, and imposed rules of their dissemination and growth extracted from the experimental observations. Results showed that three factors are important for progress toward active TB, a state with many and/or large granulomas: (i) an inflammatory response, (ii) an endogenous reinfection (infection of new lung tissues from an existing granuloma), and (iii) coalescence of lesions. Català et al. [78] extended this work by investigating the role of the bronchial tree in endogenous reinfection. The authors used computed tomography (CT) scans of the lungs of five Mtb-infected minipigs to reconstruct virtual pulmonary surfaces and mapped the size and location of TB lesions in each animal. Model simulations could match spatial and size distributions of TB lesions observed experimentally, thereby emphasizing an important role of the bronchial tree as the spatial structure guiding Mtb dynamics in the lung.
Using an ABM called “GramSim,” Wong et al. [79] investigated the role of anti-inflammatory cytokines, such as IL-10, on within-host Mtb dynamics and compared model predictions with data from Mtb infection of non-human primates (NHPs). Interestingly, neutralization of IL-10 with monoclonal antibodies did not impact Mtb dynamics in NHPs during the first eight weeks post-infection, but the ABM suggested that the longer-term outcome of such treatment may result in overall better control of Mtb. Other studies explored the role of fibrosis and neutrophil dynamics in the formation of granulomas in Mtb-infected NHPs [80–82]. Wessler et al. [83] extended these previous studies to include the dynamics of multiple granulomas within an infected lung in a model called “MultiGran.” MultiGran was capable of reproducing several patterns of in vivo local and non-local Mtb dissemination and suggested an essential role for multifunctional CD8+ T cells and dynamic macrophage behaviors in preventing the spread of Mtb in the lung. An important role of CD8α-expressing cells such as CD8 T cells and innate lymphocytes for early (first eight weeks) Mtb dynamics has been recently observed in NHPs [84, 85].
In addition to the aforementioned ABMs, several ODE-based mathematical models have described cellular trafficking between distinct organs such as the lung and LNs [86, 87]. However, these models could not accurately describe the spatial aspects of the granuloma dynamics. Therefore, Marino et al. [88] introduced a multi-organ, hybrid model incorporating an ABM to represent the lung compartment and a non-linear system of ODEs to depict the LN compartment. Such a hybrid model suggested an essential role of migration of different types of cells, such as antigen-presenting cells, between the lung and the LNs, for establishing protective immunity. Notably, the migration rates of major immune cells emerge as a key factor regulating the entire spectrum of infection outcomes from latency to active disease. Furthermore, the study posits that effector CD4+ T cells play a rescuing role in the system, intervening to shift from a persistent infection to successful clearance once a granuloma attains full maturation. Using the same approach, other studies explored the role of dendritic cells in Mtb infection and kinetics of Mtb-specific T cell response as a biomarker for disease progression following Mtb infection [89, 90].
One major drawback of spatially heterogeneous mathematical models, e.g., ABMs or hybrid models, is the need for detailed experimental data to estimate their parameters rigorously. Most parameters of ABMs are typically guessed or derived by analyzing independent datasets (e.g., the rate of lymphocyte migration between various tissues, [91]). Methods to systematically compare predictions of ABMs with experimental data are an active area of current research [92–94].
Mathematical modeling is the most rigorous way to follow from assumptions to predictions. By building a mathematical model for a given biological system in question, we may identify what aspects of the system are well understood and quantified and which require further experimental work. TB is a highly heterogeneous disease, and any single mathematical model is unlikely to describe such heterogeneity accurately. We have reviewed studies that used mathematical modeling to gain insights into the within-host dynamics of Mtb. This field has matured from the first paper published in 1996 [33], but there are still ways to improve the current models.
One major limitation is that the size of the latest mathematical models, defined, for example, as the number of model parameters, typically dramatically exceeds the amount of quantitative experimental data available for parameter estimation. For example, it is relatively typical to measure the number of bacteria in several organs of infected animals (e.g., in individual granulomas of the lung, in whole lungs, in lung-draining LNs, etc.). However, many parameters related to immune response (e.g., number of alveolar and interstitial macrophages, recruited neutrophils, monocytes, NK cells, and T cells) are rarely measured in the same experiments. Development of more biologically realistic mathematical models with parameters estimated directly from experimental data by rigorously fitting models to data is needed to further improve our understanding of TB pathogenesis.
The number of time points and the number of animals used in experiments is also relatively limited. Methods that integrate different types of experimental data (e.g., flow cytometry, PET/CT, microscopy, etc) in a rigorous manner are needed. Using mathematical modeling to predict the sampling times and the number of samples per time point (a.k.a. power analysis) could be extremely useful to design the most informative (for mathematical modeling) experiments [95, 96]. For models with a large number of parameters (e.g., more than 20), methods helping identify parameters most critical to key model predictions would be extremely useful [97, 98]. It is typical in mathematical modeling to identify parameter values and model structures that best match experimental data. However, finding situations when a biologically reasonable model is not consistent with the data could be highly informative—such a model would suggest which biological mechanisms are important to explain the data [28].
Another interesting future aspect of modeling Mtb dynamics is to estimate efficacy of TB vaccines. Mathematical models can incorporate various parameters like transmission rates, immune system parameters, and vaccine-induced effects. By adjusting these parameters, researchers can simulate different scenarios and predict the potential impact of a vaccine on Mtb infection dynamics. This results in assessing the vaccine efficacy, optimizing dosing strategies, and understanding potential outcomes before conducting expensive and time-consuming clinical trials. Finally, as mathematical modelers are now nearly required to learn about the details of experiments and experimental data, experimentalists need to meet modelers in the middle and learn about the basics of mathematical modeling. Such training is vital to recognize when mathematical modeling brings novel insights into the Mtb dynamics and when it acts as a “therapeutic illusion” [99]. Ultimately, mathematical modeling of within-host Mtb dynamics will significantly benefit from further sustained collaborations between experimental biologists and modelers following the translational systems biology approach [100].
DC: Conceptualization, Data curation, Investigation, Methodology, Visualization, Writing—original draft. SB: Conceptualization, Data curation, Investigation, Methodology, Visualization, Writing—original draft, Writing—review & editing. VG: Conceptualization, Funding acquisition, Investigation, Supervision, Visualization, Writing—review & editing.
The author(s) declare financial support was received for the research, authorship, and/or publication of this article. This work was supported by the NIH/NIAID grant (R01AI158963) to VG.
We did our best to find and cite all studies relevant to mathematical modeling of within-host Mtb dynamics. However, it is possible that we have missed some. We apologize to those authors whose work we have missed.
The authors declare that the research was conducted in the absence of any commercial or financial relationships that could be construed as a potential conflict of interest.
The author(s) declared that they were an editorial board member of Frontiers, at the time of submission. This had no impact on the peer review process and the final decision.
All claims expressed in this article are solely those of the authors and do not necessarily represent those of their affiliated organizations, or those of the publisher, the editors and the reviewers. Any product that may be evaluated in this article, or claim that may be made by its manufacturer, is not guaranteed or endorsed by the publisher.
Mtb, Mycobacterium tuberculosis; TB, tuberculosis; ODE, ordinary differential equation; PDE, partial differential equation; LN, lymph node; ABM, agent-based model; TNF, tumor necrosis factor.
2. Rodriguez-Takeuchi SY, Renjifo ME, Medina FJ. Extrapulmonary tuberculosis: pathophysiology and imaging findings. Radiographics. (2019) 39:2023–37. doi: 10.1148/rg.2019190109
3. Houk VN. Spread of tuberculosis via recirculated air in a naval vessel: the Byrd study. Ann NY Acad Sci. (1980) 353:10–24. doi: 10.1111/j.1749-6632.1980.tb18901.x
4. Lee RS, Proulx JF, McIntosh F, Behr MA, Hanage WP. Previously undetected super-spreading of Mycobacterium tuberculosis, revealed by deep sequencing. eLife. (2020) 9:e53245. doi: 10.7554/eLife.53245
5. Ma Y, Horsburgh CR, White LF, Jenkins HE. Quantifying TB transmission: a systematic review of reproduction number and serial interval estimates for tuberculosis. Epidemiol Infect. (2018) 146:1478–94. doi: 10.1017/S0950268818001760
6. Bagcchi S. WHO's global tuberculosis report 2022. Lancet Microbe. (2023) 4:e20. doi: 10.1016/S2666-5247(22)00359-7
7. Pai M, Kasaeva T, Swaminathan S. COVID-19's devastating effect on tuberculosis care—a path to recovery. N Engl J Med. (2022) 386:1490–3. doi: 10.1056/NEJMp2118145
8. Mayosi BM, Benatar SR. Health and health care in South Africa—20 years after Mandela. N Engl J Med. (2014) 371:1344–53. doi: 10.1056/NEJMsr1405012
10. WHO. Global Tuberculosis Report 2021: WHO TB Guidelines: Recent Updates. World Health Organization (2021). Available online at: https://www.who.int/publications/digital/global-tuberculosis-report-2021/featured-topics/tb-guidelines (accessed January 23, 2024).
11. Tostmann A, Boeree MJ, Aarnoutse RE, De Lange WC, Van Der Ven AJ, Dekhuijzen R. Antituberculosis drug-induced hepatotoxicity: concise up-to-date review. J Gastroenterol Hepatol. (2008) 23:192–202. doi: 10.1111/j.1440-1746.2007.05207.x
12. Tiberi S, du Plessis N, Walzl G, Vjecha MJ, Rao M, Ntoumi F, et al. Tuberculosis: progress and advances in development of new drugs, treatment regimens, and host-directed therapies. Lancet Infect Dis. (2018) 18:e183–98. doi: 10.1016/S1473-3099(18)30110-5
13. Riley RL, Mills CC, Nyka W, Weinstock N, Storey PB, Sultan LU, et al. Aerial dissemination of pulmonary tuberculosis. A two-year study of contagion in a tuberculosis ward. Am J Epidemiol. (1959) 142:3–14. doi: 10.1093/oxfordjournals.aje.a117542
14. Flynn JL, Chan J. Tuberculosis: latency and reactivation. Infect Immun. (2001) 69:4195–201. doi: 10.1128/IAI.69.7.4195-4201.2001
15. Monack DM, Mueller A, Falkow S. Persistent bacterial infections: the interface of the pathogen and the host immune system. Nat Rev Microbiol. (2004) 2:747–65. doi: 10.1038/nrmicro955
16. Gideon HP, Flynn JL. Latent tuberculosis: what the host “sees”? Immunol Res. (2011) 50:202–12. doi: 10.1007/s12026-011-8229-7
17. Dye C, Scheele S, Dolin P, Pathania V, Raviglione MC. Consensus statement. Global burden of tuberculosis: estimated incidence, prevalence, and mortality by country WHO Global Surveillance and Monitoring Project. JAMA. (1999) 282:677–86. doi: 10.1001/jama.282.7.677
18. Cohen A, Mathiasen VD, Schön T, Wejse CH. The global prevalence of latent tuberculosis: a systematic review and meta-analysis. Eur Respir J. (2019) 54:1900655. doi: 10.1183/13993003.00655-2019
19. Behr MA, Edelstein PH, Ramakrishnan L. Is latent Mycobacterium tuberculosis infection life long? BMJ. (2019) 367:l5770. doi: 10.1136/bmj.l5770
20. Keane J. TNF-blocking agents and tuberculosis: new drugs illuminate an old topic. Rheumatology. (2005) 44:714–20. doi: 10.1093/rheumatology/keh567
21. Chackerian AA, Alt JM, Perera TV. D ascher CC, Behar SM. Dissemination of Mycobacterium tuberculosis is influenced by host factors and precedes the initiation of T-cell immunity. Infect Immun. (2002) 70:4501–9. doi: 10.1128/IAI.70.8.4501-4509.2002
22. Krishnan N, Robertson BD, Thwaites G. The mechanisms and consequences of the extra-pulmonary dissemination of Mycobacterium tuberculosis. Tuberculosis. (2010) 90:361–6. doi: 10.1016/j.tube.2010.08.005
23. Samstein M, Schreiber HA, Leiner IM, Susac B, Glickman MS, Pamer EG. Essential yet limited role for CCR2+ inflammatory monocytes during Mycobacterium tuberculosis-specific T cell priming. Elife. (2013) 2:e01086. doi: 10.7554/eLife.01086
24. Dharmadhikari AS, Nardell EA. What animal models teach humans about tuberculosis. Am J Respir Cell Mol Biol. (2008) 39:503–8. doi: 10.1165/rcmb.2008-0154TR
25. Myllymäki H, Niskanen M, Oksanen KE, Rämet M. Animal models in tuberculosis research - where is the beef? Expert Opin Drug Discov. (2015) 10:871–83. doi: 10.1517/17460441.2015.1049529
26. Gill WP, Harik NS, Whiddon MR, Liao RP, Mittler JE, Sherman DR, et al. replication clock for Mycobacterium tuberculosis. Nat Med. (2009) 15:211–4. doi: 10.1038/nm.1915
27. McDaniel MM, Krishna N, Handagama WG Eda S, Ganusov VV. Quantifying limits on replication, death, and quiescence of Mycobacterium tuberculosis in mice. Front Microbiol. (2016) 7:862. doi: 10.3389/fmicb.2016.00862
28. Ganusov VV. Strong inference in mathematical modeling: a method for robust science in the twenty-first century. Front Microbiol. (2016) 7:1131. doi: 10.3389/fmicb.2016.01131
29. Handel A, La Gruta NL, Thomas PG. Simulation modelling for immunologists. Nat Rev Immunol. (2020) 20:186–95. doi: 10.1038/s41577-019-0235-3
30. Kirschner DE, Linderman JJ. Mathematical and computational approaches can complement experimental studies of host-pathogen interactions. Cell Microbiol. (2009) 11:531–9. doi: 10.1111/j.1462-5822.2009.01281.x
31. Kirschner D, Pienaar E, Marino S, Linderman JJ. A review of computational and mathematical modeling contributions to our understanding of Mycobacterium tuberculosis within-host infection and treatment. Curr Opin Syst Biol. (2017) 3:170–85. doi: 10.1016/j.coisb.2017.05.014
32. Ganusov VV. Opening Pandora's box: caveats with using toolbox-based approaches to mathematical modeling in biology. Front Appl Math Stat. (2024) 10:1355220. doi: 10.3389/fams.2024.1355220
33. Antia R, Koella JC, Perrot V. Models of the within-host dynamics of persistent mycobacterial infections. Proc R Soc Lond Ser B: Biol Sci. (1996) 263:257–63. doi: 10.1098/rspb.1996.0040
34. Hayflick L, Moorhead PS. The serial cultivation of human diploid cell strains. Exp Cell Res. (1961) 25:585–621. doi: 10.1016/0014-4827(61)90192-6
35. Perillo NL, Walford RL, Newman MA, Effros RB. Human T lymphocytes possess a limited in vitro life span. Exp Gerontol. (1989) 24:177–87. doi: 10.1016/0531-5565(89)90009-0
36. Miller JFAP. The Croonian Lecture, 1992. The key role of the thymus in the body's defence strategies. Philos Trans R Soc Lond Ser B: Biol Sci. (1992) 337:105–24. doi: 10.1098/rstb.1992.0087
37. Reibnegger G, Fuchs D, Hausen A, Werner ER, Werner-Felmayer G, Dierich MP, et al. Stability analysis of simple models for immune cells interacting with normal pathogens and immune system retroviruses. Proc Nat Acad Sci. (1989) 86:2026–30. doi: 10.1073/pnas.86.6.2026
38. Antia R, Levin BR, May RM. Within-host population dynamics and the evolution and maintenance of microparasite virulence. Am Nat. (1994) 144:457–72. doi: 10.1086/285686
39. Sankar P, Mishra BB. Early innate cell interactions with Mycobacterium tuberculosis in protection and pathology of tuberculosis. Front Immunol. (2023) 14:1260859. doi: 10.3389/fimmu.2023.1260859
40. Lin PL, Ford CB, Coleman MT, Myers AJ, Gawande R, Ioerger T, et al. Sterilization of granulomas is common in active and latent tuberculosis despite within-host variability in bacterial killing. Nat Med. (2014) 20:75–9. doi: 10.1038/nm.3412
41. Soerens AG, Knzli M, Quarnstrom CF, Scott MC, Swanson L, Locquiao JJ, et al. Functional T cells are capable of supernumerary cell division and longevity. Nature. (2023) 614:762–6. doi: 10.1038/s41586-022-05626-9
42. Kirschner D. Dynamics of Co-infection with M. tuberculosis and HIV-1. Theor Popul Biol. (1999) 55:94–109. doi: 10.1006/tpbi.1998.1382
43. Wigginton JE, Kirschner D. A model to predict cell-mediated immune regulatory mechanisms during human infection with Mycobacterium tuberculosis. J Immunol. (2001) 166:1951–67. doi: 10.4049/jimmunol.166.3.1951
44. Day J, Friedman A, Schlesinger LS. Modeling the immune rheostat of macrophages in the lung in response to infection. Proc Nat Acad Sci. (2009) 106:11246–51. doi: 10.1073/pnas.0904846106
45. Raman K, Bhat AG, Chandra N. A systems perspective of host-pathogen interactions: predicting disease outcome in tuberculosis. Mol Biosyst. (2010) 6:516–30. doi: 10.1039/B912129C
46. Pedruzzi G, Rao KV, Chatterjee S. Mathematical model of mycobacterium-host interaction describes physiology of persistence. J Theor Biol. (2015) 376:105–17. doi: 10.1016/j.jtbi.2015.03.031
47. Pedruzzi G, Das PN, Rao KV, Chatterjee S. Understanding PGE2, LXA4 and LTB4 balance during Mycobacterium tuberculosis infection through mathematical model. J Theor Biol. (2016) 389:159–70. doi: 10.1016/j.jtbi.2015.10.025
48. Gong C, Linderman JJ, Kirschner D. A population model capturing dynamics of tuberculosis granulomas predicts host infection outcomes. Math Biosci Eng. (2015) 12:625. doi: 10.3934/mbe.2015.12.625
49. Lin PL, Flynn JL. The end of the binary era: revisiting the spectrum of tuberculosis. J Immunol. (2018) 201:2541–8. doi: 10.4049/jimmunol.1800993
50. Lin PL, Coleman T, Carney JP, Lopresti BJ, Tomko J, Fillmore D, et al. Radiologic responses in cynomolgus macaques for assessing tuberculosis chemotherapy regimens. Antimicrob Agents Chemother. (2013) 57:4237–44. doi: 10.1128/AAC.00277-13
51. Bartelink IH, Zhang N, Keizer RJ, Strydom N, Converse PJ, Dooley KE, et al. New paradigm for translational modeling to predict long-term tuberculosis treatment response. Clin Transl Sci. (2017) 10:366–79. doi: 10.1111/cts.12472
52. Drusano GL. Antimicrobial pharmacodynamics: critical interactions of ‘bug and drug.' Nat Rev Microbiol. (2004) 2:289–300. doi: 10.1038/nrmicro862
53. Fors J, Strydom N, Fox WS, Keizer RJ, Savic RM. Mathematical model and tool to explore shorter multi-drug therapy options for active pulmonary tuberculosis. PLoS Comput Biol. (2020) 16:e1008107. doi: 10.1371/journal.pcbi.1008107
54. Zhang N, Strydom N, Tyagi S, Soni H, Tasneen R, Nuermberger EL et al. Mechanistic modeling of Mycobacterium tuberculosis infection in murine models for drug and vaccine efficacy studies. Antimicrob Agents Chemother. (2020) 64:e01727-19. doi: 10.1128/AAC.01727-19
55. Burnham KP, Anderson RD. Model Selection and Multimodel Inference: A Practical Information-Theoretic Approach. New York, NY: Springer-Verlag (2002).
56. Plumlee CR, Duffy FJ, Gern BH, Delahaye JL, Cohen SB, Stoltzfus CR, et al. Ultra-low dose aerosol infection of mice with Mycobacterium tuberculosis more closely models human tuberculosis. Cell Host Microbe. (2021) 29:68–82. doi: 10.1016/j.chom.2020.10.003
57. Martin CJ, Cadena AM, Leung VW, Lin PL, Maiello P, Hicks N, et al. Digitally barcoding Mycobacterium tuberculosis reveals infection dynamics in the macaque model of tuberculosis. mBio. (2017) 8:e00312–7. doi: 10.1128/mBio.00312-17
58. Yang Y, Karin O, Mayo A, Song X, Chen P, Santos AL, et al. Damage dynamics and the role of chance in the timing of E. coli cell death. Nat Commun. (2023) 14:2209. doi: 10.1038/s41467-023-37930-x
59. Gillespie D. Exact stochastic simulation of coupled chemical-reactions. J Phys Chem. (1977) 81:2340–61. doi: 10.1021/j100540a008
60. Rodriguez-Fernandez M, Egea JA, Banga JR. Novel metaheuristic for parameter estimation in nonlinear dynamic biological systems. BMC Bioinformatics. (2006) 7:1–18. doi: 10.1186/1471-2105-7-483
61. Poovathingal SK, Gunawan R. Global parameter estimation methods for stochastic biochemical systems. BMC Bioinformatics. (2010) 11:1–12. doi: 10.1186/1471-2105-11-414
62. Aguilera LU, Zimmer C, Kummer U. A new efficient approach to fit stochastic models on the basis of high-throughput experimental data using a model of IRF7 gene expression as case study. BMC Syst Biol. (2017) 11:1–14. doi: 10.1186/s12918-017-0406-4
63. Golightly A, Wilkinson DJ. Bayesian inference for stochastic kinetic models using a diffusion approximation. Biometrics. (2005) 61:781–8. doi: 10.1111/j.1541-0420.2005.00345.x
64. Milutinovic D, De Boer RJ. Process noise: an explanation for the fluctuations in the immune response during acute viral infection. Biophys J. (2007) 92:3358–67. doi: 10.1529/biophysj.106.094508
65. Zechner C, Ruess J, Krenn P, Pelet S, Peter M, Lygeros J, et al. Moment-based inference predicts bimodality in transient gene expression. Proc Nat Acad Sci. (2012) 109:8340–5. doi: 10.1073/pnas.1200161109
66. Cohen SB, Gern BH, Urdahl KB. The tuberculous granuloma and preexisting immunity. Ann Rev Immunol. (2022) 40:589–614. doi: 10.1146/annurev-immunol-093019-125148
67. Gammack D, Doering C, Kirschner D. Macrophage response to Mycobacterium tuberculosis infection. J Math Biol. (2004) 48:218–42. doi: 10.1007/s00285-003-0232-8
68. Gammack D, Ganguli S, Marino S, Segovia-Juarez J, Kirschner DE. Understanding the immune response in tuberculosis using different mathematical models and biological scales. Multiscale Model Simul. (2005) 3:312–45. doi: 10.1137/040603127
69. Hao W, Schlesinger LS, Friedman A. Modeling granulomas in response to infection in the lung. PLoS ONE. (2016) 11:e0148738. doi: 10.1371/journal.pone.0148738
70. Segovia-Juarez JL, Ganguli S, Kirschner D. Identifying control mechanisms of granuloma formation during M. tuberculosis infection using an agent-based model. J Theor Biol. (2004) 231:357–76. doi: 10.1016/j.jtbi.2004.06.031
71. Ray JCJ, Flynn JL, Kirschner DE. Synergy between individual TNF-dependent functions determines granuloma performance for controlling Mycobacterium tuberculosis infection. J Immunol. (2009) 182:3706–17. doi: 10.4049/jimmunol.0802297
72. Snast I, Bercovici E, Solomon-Cohen E, Avni T, Shitenberg D, Hodak E, et al. Active tuberculosis in patients with psoriasis receiving biologic therapy: a systematic review. Am J Clin Dermatol. (2019) 20:483–91. doi: 10.1007/s40257-019-00432-y
73. Fallahi-Sichani M, El-Kebir M, Marino S, Kirschner DE, Linderman JJ. Multiscale computational modeling reveals a critical role for TNF-α receptor 1 dynamics in tuberculosis granuloma formation. J Immunol. (2011) 186:3472–83. doi: 10.4049/jimmunol.1003299
74. Cilfone NA, Perry CR, Kirschner DE, Linderman JJ. Multi-scale modeling predicts a balance of tumor necrosis factor-α and interleukin-10 controls the granuloma environment during Mycobacterium tuberculosis infection. PLoS ONE. (2013) 8:e68680. doi: 10.1371/journal.pone.0068680
75. Repasy T, Lee J, Marino S, Martinez N, Kirschner DE, Hendricks G, et al. Intracellular bacillary burden reflects a burst size for Mycobacterium tuberculosis in vivo. PLoS Pathog. (2013) 9:e1003190. doi: 10.1371/journal.ppat.1003190
76. Bru A, Cardona PJ. Mathematical modeling of tuberculosis bacillary counts and cellular populations in the organs of infected mice. PLoS ONE. (2010) 5:e12985. doi: 10.1371/journal.pone.0012985
77. Prats C, Vilaplana C, Valls J, Marzo E, Cardona PJ, López D. Local inflammation, dissemination and coalescence of lesions are key for the progression toward active tuberculosis: the bubble model. Front Microbiol. (2016) 7:33. doi: 10.3389/fmicb.2016.00033
78. Català M, Bechini J, Tenesa M, Pérez R, Moya M, Vilaplana C, et al. Modelling the dynamics of tuberculosis lesions in a virtual lung: role of the bronchial tree in endogenous reinfection. PLOS Comput Biol. (2020) 16:e1007772. doi: 10.1371/journal.pcbi.1007772
79. Wong EA, Evans S, Kraus CR, Engelman KD, Maiello P, Flores WJ, et al. IL-10 impairs local immune response in lung granulomas and lymph nodes during early Mycobacterium tuberculosis infection. J Immunol. (2020) 204:644–59. doi: 10.4049/jimmunol.1901211
80. Evans S, Wong EA, Flynn JL, Mattila JT, Kirschner D. Unraveling the role of fibrosis in the TB granuloma. J Immunol. (2019) 202(1_Supplement):182–6. doi: 10.4049/jimmunol.202.Supp.182.86
81. Warsinske HC, DiFazio RM, Linderman JJ, Flynn JL, Kirschner DE. Identifying mechanisms driving formation of granuloma-associated fibrosis during Mycobacterium tuberculosis infection. J Theor Biol. (2017) 429:1–17. doi: 10.1016/j.jtbi.2017.06.017
82. Hult C, Mattila JT, Gideon HP, Linderman JJ, Kirschner DE. Neutrophil dynamics affect Mycobacterium tuberculosis granuloma outcomes and dissemination. Front Immunol. (2021) 12:712457. doi: 10.3389/fimmu.2021.712457
83. Wessler T, Joslyn LR, Borish HJ, Gideon HP, Flynn JL, Kirschner DE, et al. A computational model tracks whole-lung Mycobacterium tuberculosis infection and predicts factors that inhibit dissemination. PLoS Comput Biol. (2020) 16:e1007280. doi: 10.1371/journal.pcbi.1007280
84. Winchell CG, Nyquist SK, Chao MC, Maiello P, Myers AJ, Hopkins F, et al. CD8+ lymphocytes are critical for early control of tuberculosis in macaques. J Exp Med. (2023) 220:e20230707. doi: 10.1084/jem.20230707
85. Barber DL. Early innate role for CD8aa+ cells in tuberculosis. J Exp Med. (2023) 220:e20231631. doi: 10.1084/jem.20231631
86. Marino S, Kirschner DE. The human immune response to Mycobacterium tuberculosis in lung and lymph node. J Theor Biol. (2004) 227:463–86. doi: 10.1016/j.jtbi.2003.11.023
87. Linderman JJ, Riggs T, Pande M, Miller M, Marino S, Kirschner DE. Characterizing the dynamics of CD4+ T cell priming within a lymph node. J Immunol. (2010) 184:2873–85. doi: 10.4049/jimmunol.0903117
88. Marino S, El-Kebir M, Kirschner D. A hybrid multi-compartment model of granuloma formation and T cell priming in tuberculosis. J Theor Biol. (2011) 280:50–62. doi: 10.1016/j.jtbi.2011.03.022
89. Marino S, Gideon HP, Gong C, Mankad S, McCrone JT, Lin PL, et al. Computational and empirical studies predict Mycobacterium tuberculosis-specific T cells as a biomarker for infection outcome. PLoS Comput Biol. (2016) 12:e1004804. doi: 10.1371/journal.pcbi.1004804
90. Marino S, Kirschner DE. A multi-compartment hybrid computational model predicts key roles for dendritic cells in tuberculosis infection. Computation. (2016) 4:39. doi: 10.3390/computation4040039
91. Ganusov VV, Auerbach J. Mathematical modeling reveals kinetics of lymphocyte recirculation in the whole organism. PLoS Comp Biol. (2014) 10:e1003586. doi: 10.1371/journal.pcbi.1003586
92. Tong X, Chen J, Miao H, Li T, Zhang L. Development of an agent-based model (ABM) to simulate the immune system and integration of a regression method to estimate the key ABM parameters by fitting the experimental data. PLoS ONE. (2015) 10:e0141295. doi: 10.1371/journal.pone.0141295
93. Wang C, Hu M, Yang L, Zhao Z. Prediction of air traffic delays: an agent-based model introducing refined parameter estimation methods. PLoS ONE. (2021) 16:e0249754. doi: 10.1371/journal.pone.0249754
94. Nanda P, Budak M, Michael CT, Krupinsky K, Kirschner DE. Development and analysis of multiscale models for tuberculosis: from molecules to populations. bioRxiv. (2023) [Preprint]. doi: 10.48550/2023.11.13.566861
95. Rajakaruna H, Ganusov VV. Mathematical modeling to guide experimental design: T cell clustering as a case study. Bull Math Biol. (2022) 84:103. doi: 10.1007/s11538-022-01063-x
96. Majumder B, Budhu S, Ganusov VV. Cytotoxic T lymphocytes control growth of B16 tumor cells in collagin-fibrin gels by cytolytic and non-lytic mechanisms. Viruses. (2023) 15:1454. doi: 10.3390/v15071454
97. Raman DV, Anderson J, Papachristodoulou A. Delineating parameter unidentifiabilities in complex models. Phys Rev E. (2017) 95:032314. doi: 10.1103/PhysRevE.95.032314
98. Monsalve-Bravo GM, Lawson BAJ, Drovandi C, Burrage K, Brown KS, Baker CM, et al. Analysis of sloppiness in model simulations: unveiling parameter uncertainty when mathematical models are fitted to data. Sci Adv. (2022) 8:eabm5952. doi: 10.1126/sciadv.abm5952
99. Casarett D. The science of choosing wisely-overcoming the therapeutic illusion. N Engl J Med. (2016) 374:1203–5. doi: 10.1056/NEJMp1516803
Keywords: Mycobacterium tuberculosis, mathematical models, within-host dynamics, immune response, antibiotic treatment, stochastic model of Mtb, agent-based models of Mtb
Citation: Chakraborty D, Batabyal S and Ganusov VV (2024) A brief overview of mathematical modeling of the within-host dynamics of Mycobacterium tuberculosis. Front. Appl. Math. Stat. 10:1355373. doi: 10.3389/fams.2024.1355373
Received: 13 December 2023; Accepted: 16 January 2024;
Published: 31 January 2024.
Edited by:
Joseph Malinzi, University of Eswatini, EswatiniReviewed by:
Chinwendu Madubueze, Federal University of Agriculture Makurdi (FUAM), NigeriaCopyright © 2024 Chakraborty, Batabyal and Ganusov. This is an open-access article distributed under the terms of the Creative Commons Attribution License (CC BY). The use, distribution or reproduction in other forums is permitted, provided the original author(s) and the copyright owner(s) are credited and that the original publication in this journal is cited, in accordance with accepted academic practice. No use, distribution or reproduction is permitted which does not comply with these terms.
*Correspondence: Dipanjan Chakraborty, ZGNoYWtyYWJvcnR5QHR4YmlvbWVkLm9yZw==; Saikat Batabyal, c2JhdGFieWFsQHR4YmlvbWVkLm9yZw==
†These authors have contributed equally to this work
Disclaimer: All claims expressed in this article are solely those of the authors and do not necessarily represent those of their affiliated organizations, or those of the publisher, the editors and the reviewers. Any product that may be evaluated in this article or claim that may be made by its manufacturer is not guaranteed or endorsed by the publisher.
Research integrity at Frontiers
Learn more about the work of our research integrity team to safeguard the quality of each article we publish.