 Chemseddine Tidjani
 Abderazak Madouri
95% of researchers rate our articles as excellent or good
Learn more about the work of our research integrity team to safeguard the quality of each article we publish.
Find out more
ORIGINAL RESEARCH article
Front. Appl. Math. Stat. , 12 April 2024
Sec. Mathematical Finance
Volume 10 - 2024 | https://doi.org/10.3389/fams.2024.1276218
This article is part of the Research Topic Advanced Statistical Modelling for Fintech, Financial Inclusion, and Inequality View all 4 articles
In this study, we explore the nexus between sustainable development and finance, with a specific focus on the African region–a critical yet underexplored context in the existing literature. Against the backdrop of evolving challenges in financial inclusion, improved access, and the growing prevalence of financial technology (FinTech), we aim to fill a research gap by investigating the connection between FinTech, financial inclusion, and sustainable development. The empirical exploration spans 25 African countries from 2011 to 2019, employing econometric methods such as dynamic panel (SGMM two-steps) and static panel (OLS, FE, LSDV). Utilizing key indicators like Adjusted Net Savings (ANS) and Gross Saving rate (GS), our findings reveal a substantial positive impact of financial inclusion and FinTech on sustainable development. However, an intriguing discovery emerges as the interaction between these variables exhibits a weak negative and significant effect. As a unique contribution to the existing literature, we estimate marginal effects at various levels of FinTech and financial inclusion on sustainable development. Beyond insights, our study offers vital policy recommendations, emphasizing the necessity for improved collaboration among financial service providers to avoid redundancy. Furthermore, we highlight the critical need to expand financial infrastructure, advocate for FinTech promotion, and foster inter-African cooperation.
Wealth analysis, as anticipated by economic theory, is crucial for comprehending the concept of sustainability. Shifts in genuine wealth per capita profoundly impact well-being prospects and future opportunities (1–3). While wealth encompasses production capital, human, and institutional capital, it also incorporates natural assets like land, forests, and underground resources, providing a comprehensive measure of sustainability. Countries such as Botswana showcase impressive growth rates by leveraging their natural resources (4–9). The three types of capital - product, human, and natural - are essential components for sustaining economic growth. Sustainability is vital for preserving resources, ensuring their continued availability for present and future generations (3, 10, 11). Accordingly, an important element in this analysis is a measure of Adjusted Net Saving as percentage of Gross National Income (ANS_GNI) or genuine saving (3, 10, 12–15).
Genuine savings offer national-level decision-makers a clear and relatively simple indicator to assess sustainability and address resource and environmental challenges, aligning with financial and developmental planning institutions [(4, 16–18)]. It highlights the importance of promoting national savings and implementing comprehensive and sound economic policies (9, 19). Linking sustainable development to genuine savings rates implies a range of possible interventions to increase sustainability, spanning from macroeconomic to purely environmental considerations. Thus, genuine savings, rather than GDP growth, allow long-run economic sustainability (20, 21). Thus, sustainability has gained increasing significance over time due to the depletion of natural resources and the impacts of climate change caused by unsustainable economic activity (22). It has evolved into a broad and continually evolving paradigm (23). Distinguishing between weak and strong sustainability is essential (24, 25). Genuine savings are often labeled as an indicator of ‘weak sustainability’ because they rely on the unrealistic assumption that natural capital can be entirely substituted by produced and human capital. However, the use of genuine savings as an indicator of weak sustainability remains in line with the United Nations (UN) definition of sustainable development (20, 26).
Financial inclusion plays a crucial role as a facilitator in achieving the eighth (8th) UN Sustainable Development Goal (UN-SDG), which focuses on providing access to formal financial services for the unbanked population. Recent innovations in this field have garnered attention due to their potential to drive socioeconomic development, reduce poverty, and foster economic stability (27–32). Particularly during the COVID-19 pandemic, promoting financial inclusion through digital financial services becomes even more vital as it can contribute to the achievement of universal health and well-being (SDG 3) (33, 34). Contemporary researchers assert that beyond fostering technological progress and sustainable economic growth, financial inclusion equally impacts the environment, notably in terms of carbon emissions. The transition to carbon neutrality and environmental sustainability is impossible without improving financial services, resources, and markets [(35, 36)]. In summary, the findings underscore the potential of financial inclusion as a valuable tool in advancing sustainable practices and contributing to global initiatives aimed at combating climate change (37).
Financial Technology (FinTech) is a driving force in the technological revolution, holding potential for inclusive finance, economic development, and reduced inequality. It refers to innovative financial solutions through technology (that creates new business models, processes, or products), addressing challenges like high transaction costs and limited banking access. FinTech, fostering financial inclusion, is reshaping the financial landscape, and contributing to sustainable economic progress (22, 38–39). Moreover, FinTech holds promise as an enabler for addressing climate change by promoting financial inclusion and reducing energy consumption [(40) as cited by (41, 42)]. Significantly, the technology spillover effect of FinTech plays a pivotal role in fostering the growth of green finance (43, 44). In brief, FinTech has revolutionized financial services and pricing models, promoting sustainable and green productivity. It embraces eco-friendly practices and actively contributes to the achievement of sustainable development goals (45–49).
Numerous studies by (50–52), emphasize that FinTech plays a pivotal role in driving financial inclusion, a key component for achieving sustainable and balanced development in line with the UN-SDGs. However, to fully harness the potential of FinTech in supporting the SDGs, it is crucial to adopt a gradual and forward-looking approach that focuses on building the necessary infrastructure for digital financial transformation. It is important to recognize that FinTech and financial inclusion are not standalone objectives in themselves but rather means to create a sustainable future that can be sustained over time. By establishing robust digital frameworks and promoting inclusive financial systems, we can ensure long-term societal and economic benefits.
This paper examines the variables that explain different outcomes in terms of sustainable development, measured by Gross Saving as percentage of GNI (GS_GNI) and ANS. This indicator, grounded in the theoretical frameworks of green accounting and social welfare literature, is perceived and justified as a valuable contribution to enhancing national accounting. By incorporating environmental and social considerations, this novel measure aims to extend beyond traditional economic metrics (26, 53, 54). The existing empirical literature tends to focus on the impact of financial inclusion and FinTech on economic growth and income inequality, which, while important for economic development, may not capture sustainability adequately. In line with the weak sustainability literature, particularly in Sub-Saharan Africa (SSA) [(9, 21, 55)]; this paper considers ANS_GNI and GS_GNI to assess the nexus between financial inclusion, FinTech, and sustainable development in the African region.
The exploration of the interconnection between sustainability, FinTech, and financial inclusion has been notably lacking in prior research, with these domains often treated as separate entities (51). A thorough examination of the existing literature reveals differences in methodologies and findings, primarily stemming from variations in the selection of independent variables. An area requiring particular attention is the identification of suitable dependent variables. Unfortunately, consistent and adequate measurements of sustainable development have been overlooked (56). The genuine saving indicator, while aiming to incorporate human and environmental factors into national accounting, is hindered by flawed data and methodology. Excluding key factors and relying on the assumption of weak sustainability, it may mislead policymakers. These limitations stem from the institution’s focus on quantification and cross-country comparability in environmental research (57). Besides that, the conceptual framework of ANS_GNI primarily focuses on the productive aspects of natural resources, environmental quality, and human capital, restricting the comprehension of systemic causes behind global unsustainability. This approach also hinders the consideration of sustainability beyond a framework tied to sustained production and consumption dynamics (26).
Our study focuses on the nexus of three variables: financial inclusion, FinTech, and sustainable development. The research question comprises two integral components: (1) Does a relationship exist between FinTech, financial inclusion, and sustainable development in the African region? (2) How does this relationship contribute to sustainable development in Africa? In essence, to what extent does the interaction between FinTech and financial inclusion impact sustainable development in the African region?
Accordingly, we aim to explore and estimate the interaction term between financial inclusion and FinTech and its impact on sustainable development, also estimating its marginal effect. By focusing specifically on a panel of African countries, our study enriches the literature by providing alternative evidence and findings. By scrutinizing the interactions between financial inclusion and FinTech within the African context, we transcend the isolated treatment of these variables in prior research. This twofold contribution not only introduces innovative measures but also provides fresh insights into the interconnected dynamics of financial inclusion and FinTech, thereby contributing to a more comprehensive understanding of sustainable development in the African region.
Starting with introduction and ended with conclusions and recommendations, the rest of the study is organized as follows: section 2, presents the literature review and backgrounds; section 3, describes the data, estimation methods and variables determinant; section 4, empirical results, and discussion; section 5, provides discussions.
Joseph Stiglitz has stated that “GDP tells you nothing about sustainability.” (58) proposed using a more comprehensive measure of sustainable economic growth, which reflects economic, social, as well as environmental efficiency, since the capacity of a nation to flourish cannot be measured through economic growth alone. It is widely recognized that there is a need for an improved statistical framework to shift the focus from solely measuring economic factors (traditional approaches primarily focus on economic indicators such as GDP growth) to overlooking crucial social and environmental dimensions in measuring sustainable development (59, 60). Although, several studies are trying to adopt some improved indicators for measuring sustainable development by Human Development Index (HDI), Ecological Footprint, Social Progress Index (SPI), Sustainable Development Goals (SDGs), Environmental Performance Index (EPI), Environmental Vulnerability Index, Summary Innovation Index (SII), Internal Market Index, Genuine Savings (GS) index, Business climate index, …etc. (61–64). Thus, no single indicator can fully capture the complexity of sustainable development. Using a combination of these indicators provides a more comprehensive understanding of progress toward sustainability.
According to ESCWA (65), GS refers to gross disposable income minus final consumption expenditure. Eurostat (66) defines GS as the remaining income after deducting consumption expenditure, which includes savings from various sectors. To ensure consistency and comparability over time, GS is adjusted for seasonal and calendar variations. The World Bank (67) describes GS as follow: “GS are calculated as a residual from the national accounts by taking the difference between income earned by residents (including income received from abroad and workers’ remittances) and their consumption expenditures. GS is used as a starting point for calculating adjusted net savings. Adjusted net saving is an indicator of the sustainability of an economy.” GS can be considered a suitable proxy for ANS and can measure sustainable development (68, 69). Furthermore, GS serves as an anchor and a fundamental component for assessing the sustainability of an economy. While GS plays a significant role in the calculation of ANS, the latter holds greater importance when considering weak sustainable development (24).
Several studies (3, 13, 26, 70) highlight that ANS serves as a measure of a country’s national wealth change. Interpreting ANS follows a straightforward rule: a negative ANS indicates a depletion of capital stocks, which will negatively impact future well-being, whereas a positive ANS signifies an increase in wealth and future well-being (13, 71, 72). While wealth generally remains stable and changes gradually, ANS is a dynamic metric that can fluctuate rapidly. This dynamic nature makes ANS a valuable early warning indicator for economic decline and responsive to policy changes. Changes in government investment in education and policies promoting private sector investment are promptly reflected in the ANS value. Sustained small negative ANS values can eventually lead to a decline in overall wealth and well-being. However, Hamilton and Clemens (21) and Hamilton (73) argue that if ANS consistently remains below zero, it suggests that the economy is not meeting the criteria for weak sustainability.
In summary, ANS tends as a comprehensive measure that takes into account the depletion of natural capital and environmental costs. This approach provides a more accurate assessment of sustainability by capturing the true savings available for future well-being and development (3, 21). Additionally, the World Bank (74) and Atkinson et al. (75) recommend ANS as a primary indicator for evaluating economic growth and sustainable development strategies.
To explore the existing and potential links among three variables, we proposed examining the relationships between financial inclusion and sustainable development, FinTech and sustainable development, and the interaction between FinTech and financial inclusion.
Demir et al. (76) and Ma’ruf and Aryani (77) acknowledge the crucial role of inclusive access to financial services in achieving SDGs. According to Sadia, Saleem, and Shahzad (78), digital finance and financial inclusion are essential strategies that contribute to both economic growth and environmental sustainability. Wang, Fahad, Wei, Luo, and Luo (79) discovered that financial inclusion has a positive impact on environmental quality and sustainable development, particularly at medium and high levels. However, this impact is not significant at low levels. Subsequent research has confirmed the positive relationship between inclusive financial development, environmental quality, and sustainable development. Shah and Dubhashi (80) emphasize the role of financial inclusion in promoting inclusive growth, while Sarma and Pais (81) establish a strong correlation between human development and financial inclusion. Chinoda and Mashamba (82) examined the relationship between financial technology, financial inclusion, and income inequality in 25 African countries, by introducing a double FFI Model and utilizes structural equation modeling. The findings highlight the significant role of financial inclusion in reducing income inequality and recommend policymakers in Africa to focus on fostering FinTech developments and enhancing financial inclusion to address income disparities. Petrivskyi and Medvid (83) as well as Ozili (84) provide evidence demonstrating the direct positive effects of financial inclusion on economic development, poverty reduction, inequality, and the attainment of the SDGs. However, Queralt, Fu, and Romano (85) criticize the 2030 agenda for sustainable development for not prioritizing financial inclusion as a standalone goal, arguing that it misses an opportunity to effectively address the financial needs of the global poor.
In November 2018, the United Nations (UN) established the Task Force on digital financing to develop strategies that leverage FinTech for the progress of SDGs. Digital finance and FinTech play three crucial roles in managing trade-offs and enhancing synergies between the environmental and social aspects of SDG achievement. These roles include improving resource allocation for sustainable development, expanding financial resources within the system, and utilizing digital finance and FinTech directly to accomplish the SDGs themselves (51, 86–89). Moreover, FinTech, with its peer-to-peer and Distributed Ledger Technology (DLT) networks, aligns with the goal of the Environmental, Social, and Governance (ESG) community to create an inclusive and environmentally friendly financial system for sustainable development. It has the potential to reduce costs, facilitate global connectivity, and enhance financial inclusion. Recognizing its significance, the G20 and the UN have included “Sustainable digital finance” in their workstreams for 2030 (90–94). Awais et al. (22) concluded that FinTech (measured by Internet popularization and Findex) have positive effects on green economic activity while carbon emissions have a negative impact. However, the IISD (89) has raised concerns about the risks associated with digital financing for SDG advancement, including the potential exacerbation of the digital divide and concerns regarding data privacy, money laundering, fraud, and illicit financial flows. Addressing these risks requires regulatory capacity to keep pace with the rapid digital revolution.
A solid foundation of infrastructure, supportive policies, and regulations is recognized as crucial for leveraging FinTech to promote financial inclusion. Within the broad category of FinTech, digital financial solutions play a significant role in advancing global financial inclusion by offering financial services and opportunities to individuals worldwide. This recognition is widely acknowledged in the literature (51, 95–98). Additionally, Yeyouomo et al. (99) addresses the role of FinTechs in closing the gender gap of financial inclusion in Sub-Saharan Africa (SSA) between 2011 and 2017. Through a multilevel tobit regression model and panel data analysis, the study examines the impact of FinTechs on mitigating the gender gap in access to and use of financial services. The findings highlight the significance of FinTechs in reducing the gender gap, while also emphasizing the need for targeted policy initiatives to further bridge the divide. Telukdarie et al. (100) emphasize the potential of digital financial technology to expedite financial inclusion in developing markets. The utilization of digital technology, encompassing artificial intelligence, presents a formidable tool that aids individuals in emerging markets by enabling access to financial institutions and the services they offer. Furthermore, FinTech start-ups play a pivotal role in driving financial inclusion due to their competitive advantage in innovating faster, identifying consumer needs, and addressing market gaps for new business opportunities, thereby providing accessible and affordable financial services to underserved populations (101–103).
Several studies have examined the relationship between financial inclusion and various aspects of sustainable development. Hussain et al. (35) analyzed 110 developing countries from 2004 to 2020, focusing on financial inclusion and information communication technology (ICT) indicators. Robust statistical techniques (Driscoll-Kraay standard errors, generalized linear model, feasible general least squares, and difference GMM) were used to address statistical issues. The panel estimation findings showed a significantly positive relationship between financial inclusion, ICT, and sustainable economic development. Policymakers are recommended to prioritize inclusive financial systems and equitable access to ICT for sustainable economic growth. Ozili (87) conducted a study that revealed a significant association between higher levels of financial inclusion, measured by the presence of commercial bank branches per 100,000 adults, and positive outcomes related to sustainable development. These outcomes include increased electricity production from renewable sources, enhanced industry productivity, higher adult literacy rates, and greater output of renewable electricity. Ifediora et al. (104) investigated the impact of financial inclusion on economic growth in 22 sub-Saharan African countries between 2012 and 2018. Their study utilized a composite index and individual indicators such as bank branches, Automated Teller Machines (ATMs), mobile money, deposit accounts, and outstanding loans. The findings revealed that the availability and penetration dimensions of financial inclusion, along with the composite index, significantly contributed to economic growth. However, the usage dimension of financial inclusion had a positive but not statistically significant effect. Moreover, the study indicated that mobile money agents had a negative impact on economic growth, while mobile money accounts and transactions had a positive but not statistically significant impact. Besides, Li and Wu (105), Daud and Ahmad (106), Ahmad et al. (106), Younas et al. (107) have reached that the financial inclusion has a significant positive impact on the economic growth in developing countries.
Bkwayep and Tsafack (108) employed the Generalized Method of Moments (GMM) to analyze a panel of 47 countries from 2004 to 2014, investigating the potential of financial inclusion in reducing income inequality. They considered five indicators of financial inclusion (ATMs per 100,000 adults, banking branches per 100,000 adults, credit availability, deposits, and insurance), along with remittances, and three variables related to income inequality (Gini index, Atkinson ratio, and Palma ratio). Gautam et al. (183) conducted a study using panel data on 17 Indian states to explore the impact of financial inclusion on India’s sustainable development. They found a negative relationship between financial inclusion and sustainable development. Emara and Mohieldin (109) utilized the System of GMM panel estimation (SGMM) to investigate the influence of financial inclusion, measured by access and usage, on the eradication of extreme poverty by 2030, which is the first goal of the SDGs. The analysis was conducted on annual data from 11 MENA countries and 23 emerging markets spanning the years 1990 to 2017. Moreover, Hasan et al. (110). examined the connection between financial inclusion and bank performance across 18 Asian countries, involving a total of 3,071 financial institutions. The study utilized both GMM strategy and Ordinary Least Square (OLS) regressions to ensure the accuracy of the findings.
Nenavath and Mishra (111) conducted an empirical analysis to examine the impact of green finance and FinTech on sustainable economic growth in Indian states during the period from 2010 to 2021. Employing panel regression and two-step GMM, the authors found robust evidence supporting the positive impact of green finance on economic growth. Specifically, green finance was found to shape finance structure, enhance financial effectiveness, and contribute to environmental quality protection. Additionally, the study revealed that FinTech, while not significantly affecting economic effectiveness, played a complementary role by amplifying the effects of green finance on finance structure and environmental quality. Deng et al. (112) focused on analyzing the relationship between FinTech and sustainable development using a comprehensive indicator system and data from peer-to-peer platforms (P2P) across 31 Chinese provinces. Applying the fixed-effect model along with dynamic SGMM and other robustness checks, the authors identified a U-shaped relationship between FinTech and sustainable development. This relationship was driven by the pattern of extensive economic growth, highlighting the potential of FinTech as a catalyst for sustainable development. Hodula (113) employed a GMM estimator to investigate the relationship between FinTech and big tech credit growth and income inequality. By analyzing data from 78 countries between 2013 and 2019, the study reveals that the expansion of FinTech and big tech credit is linked to a decrease in income inequality. However, this effect is observed primarily in countries with a high level of financial inclusion. These findings suggest that promoting financial inclusion is crucial for harnessing the potential of FinTech and big tech credit to address income disparities. Building on the potential of FinTech, Haddad and Hornuf (114), Popescu and Popescu (115), and Knuth (116) underscored its effectiveness in providing financial services for social, energy, and environmental initiatives. These studies showcased the transformative power of FinTech in fostering a fair and equitable society, thus aligning with the multidimensional nature of sustainable development.
According to Demire et al. (76), several existing studies have not fully explored the relationship between FinTech and financial inclusion, which raises another question that remains unanswered. However, Al-Smadi (117) examines the association between digital finance (measured by ATMs) and financial inclusion (measured by composite index) in the MENA region. The author employed a SGMM panel method for 12 countries spanning the period from 2004 to 2020. The results confirm that digital finance plays a crucial role in enhancing financial inclusion in the region. Lyons et al. (118) discovered that FinTech development plays a crucial role in improving financial inclusion. They found a consistently strong and positive relationship between them. Authors examined the connection between FinTech development and the demand for savings, borrowing, and remittances in 16 of the largest emerging economies. This research represents one of the initial multi-country assessments of the relationship between FinTech and financial inclusion, laying the groundwork for future studies in this area. Furthermore, using panel data from 35 countries between 2009 and 2018; Rumondang et al., (119) employ a SGMM estimator to analyze how information and communication technologies (ICT) development contribute and impact the financial inclusion in emerging countries. The findings emphasize the positive influence of ICT, including mobile phones, internet users, and ATMs, in promoting financial inclusion in emerging economies.
Our study addresses three key research gaps. Firstly, by introducing unique sustainable development measures, ANS_GNI and GS_GNI, we present an alternative approach compared to conventional indicators such as GDP and income inequality. Secondly, there is a research void regarding the investigation of the interaction between financial inclusion, FinTech, and their impact on sustainable development, highlighting the novelty of our research. Thirdly, the African context remains underexplored with this combination of variables in the same model, distinct from parameters investigated separately. In summary, our research contributes innovatively by providing alternative measures and evidence.
Our study relies on accurately collected data primarily sourced from two subcategories within the World Bank indicators datasets. The G20 financial inclusion indicators dataset, a comprehensive set capturing detailed information on both the supply (accessibility) and demand (usage) sides of financial services, contributes variables associated with FinTech and financial inclusion. The World Development Indicators (WDI) dataset, which offers the most up-to-date and accurate global development data from recognized international sources; furnishes data pertaining to sustainable development. This strategic incorporation of distinct datasets ensures a comprehensive and multifaceted approach to our data collection process.
These sources offer comprehensive and standardized data, enabling the construction of an annual panel dataset for our analysis. However, certain restrictions on variable inclusion or limited analysis based on available data were encountered. The data collection process spanned from 2011 to 2019, varying depending on variable availability. The final sample comprises only those countries with available data, resulting in the selection of a panel of 25 African countries. This careful and thorough data collection approach ensures the robustness and validity of our findings in exploring the relationship between FinTech, financial inclusion, and sustainable development in the African region. Appendix 1 provides details of the sample economies.
To estimate the impact of FinTech, financial inclusion, and their interaction on sustainable development, we suggested the following model:
The model equations used in this study are constructed following Demire et al. (76), Chinoda and Mashamba (82), Arner et al. (51), Makina and Walle (124), Hussain et al. (35), and Dietz et al. (24). The model is specified by including sustainable development which represented, as dependent variable, by GS_GNI (denotes the Gross Saving as percentage of GNI) and ANS_GNI (denotes the Adjusted Net Savings as percentage of GNI). The independent variables in the model are Fi, which refers to FinTech, and Fic, which represents financial inclusion. Furthermore, represents a set of control variables, namely the ratio of domestic credit to the private sector, inflation rate, trade openness, urban population, primary school enrollment, and age dependency rate. These control variables are expected to have an impact on sustainable development, as indicated in prior research by Lacalle-Calderon et al. (121), Belloumi and Alshehry (122), and Huo et al. (123).
Figure 1 visually represents the directional relationships among the main variables of interest, considering interaction effects, control variables, and ANS indicator, GS variable. The selection of control variables is guided by empirical literature. The estimation process involves selecting an appropriate econometric dynamic model to conduct a comprehensive analysis.
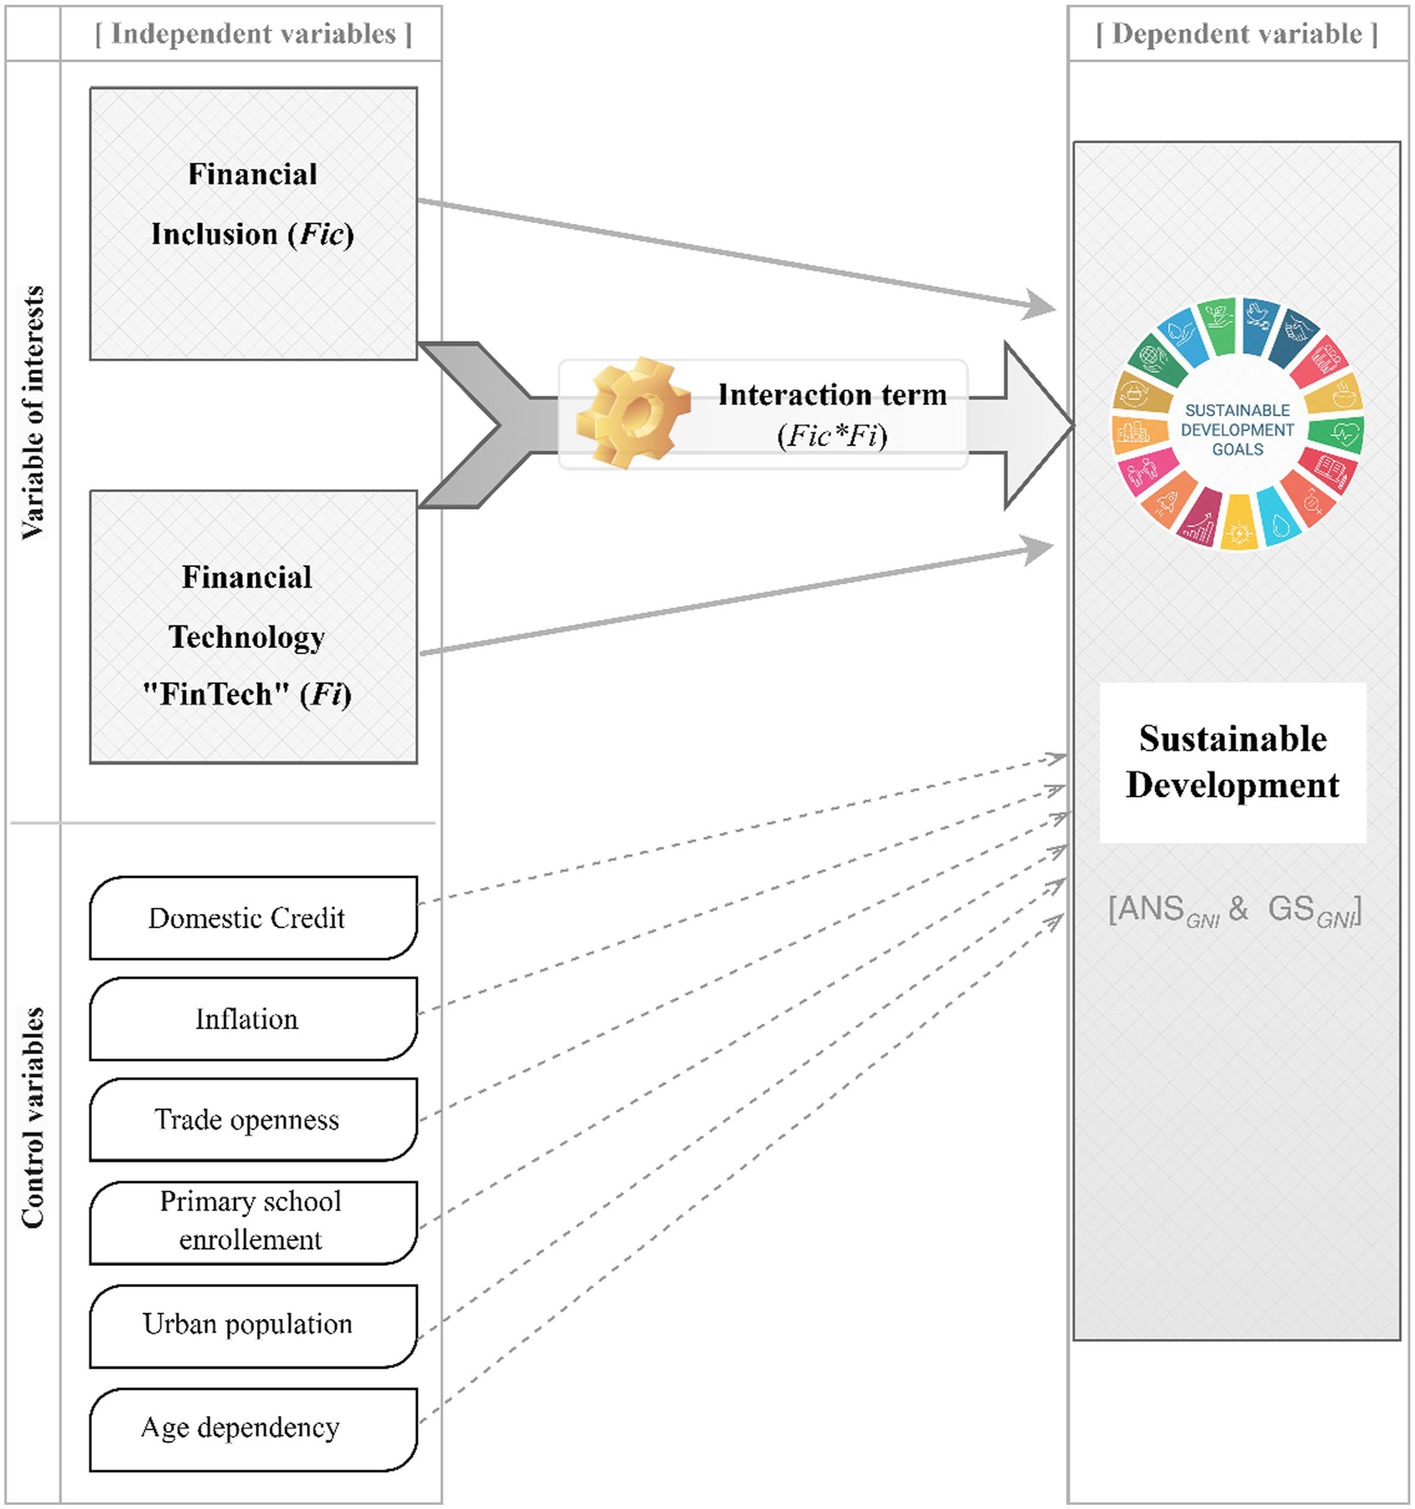
Figure 1. Conceptual framework (incorporated by authors).
GS (% GNI) can be utilized as a proxy for ANS (% GNI) in evaluating sustainable development (70). It serves as a crucial element in gaging the sustainability of an economy, particularly in the context of weak sustainable development (24). ANS_GNI, as the secondary dependent variable, serves as a primary metric for measuring sustainable development. It quantifies the fluctuation in the value of designated assets, excluding capital gains (3, 9, 10, 24, 124) (see Table 1). To mitigate potential endogeneity issues, we incorporated lagged values into our analysis.
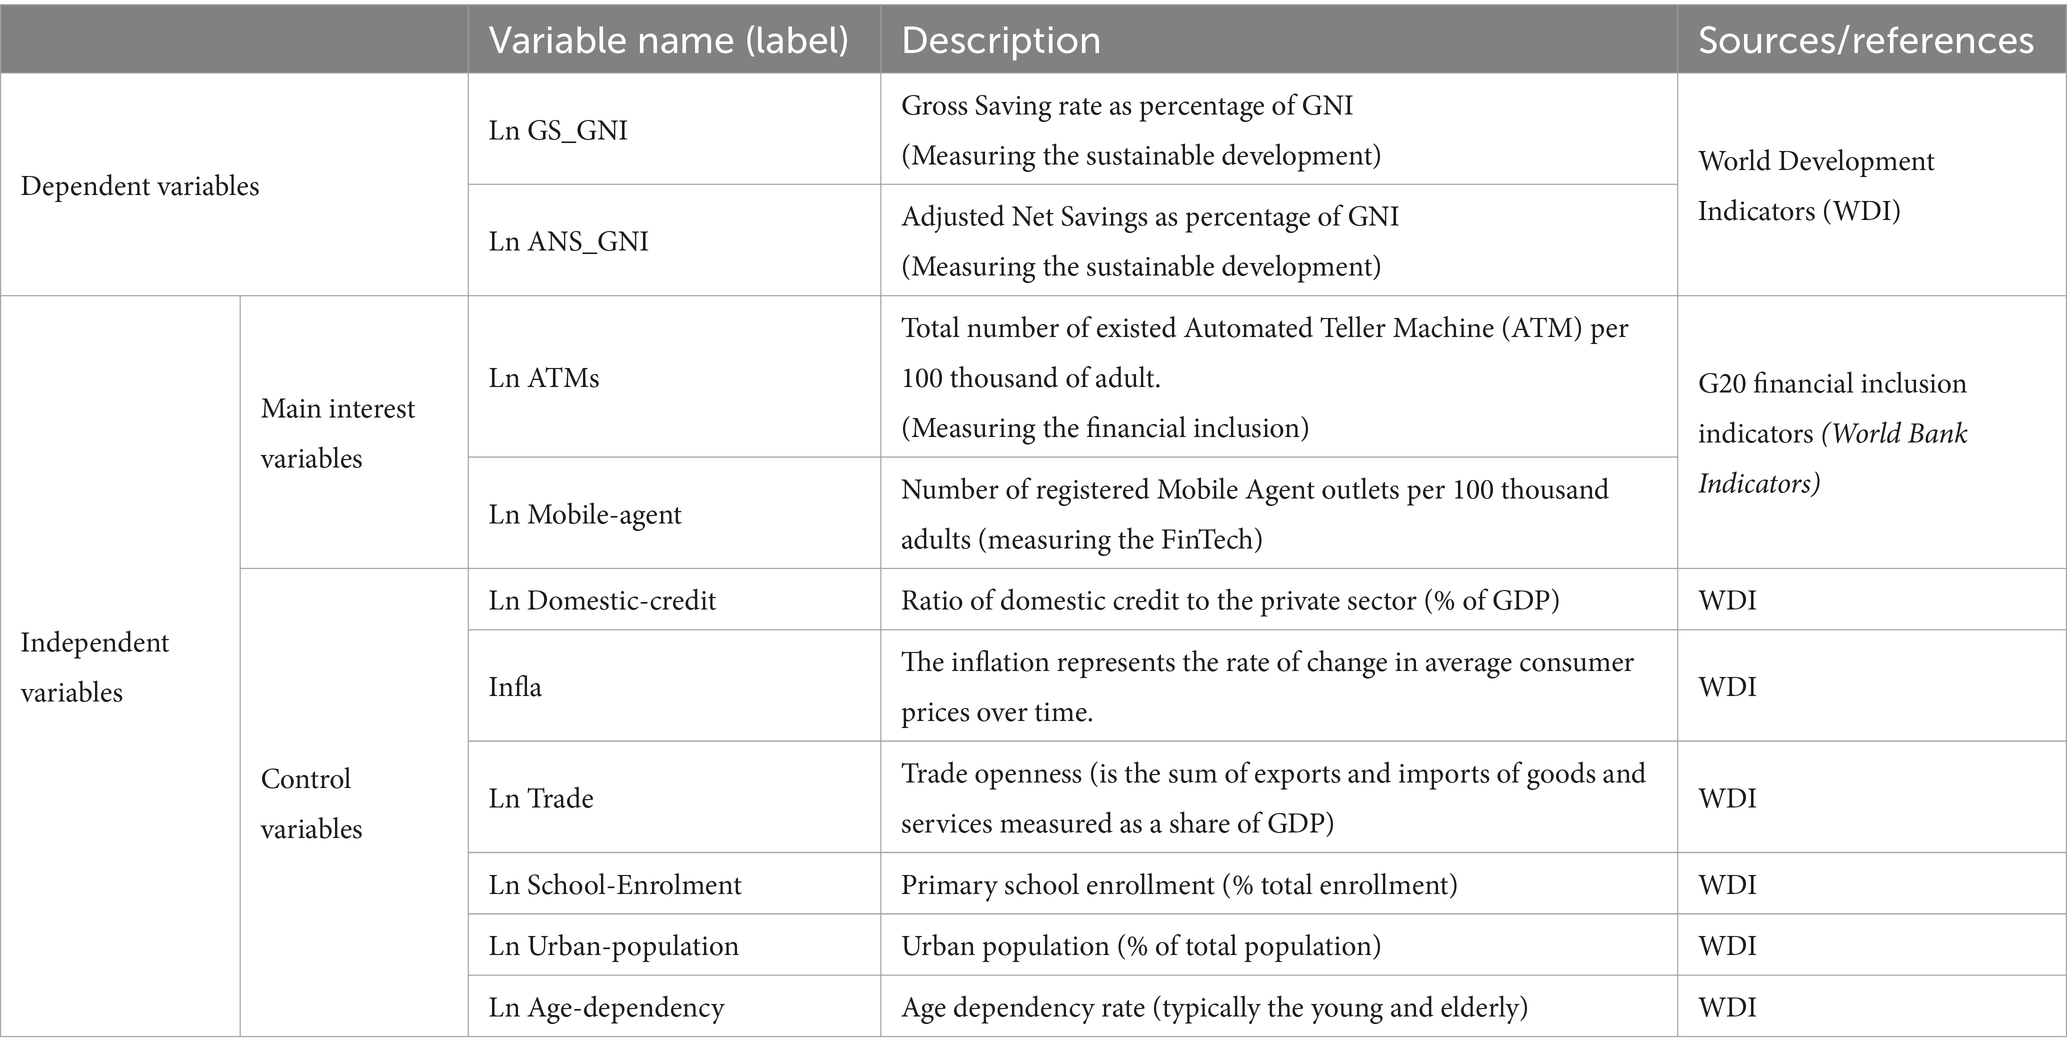
Table 1. Variables description.
The results depicted in Figure 2 demonstrate some striking differences when drawing the dependent variables (ANS and GS). Regarding the ANS, it is evident that certain countries, such as Cameroon, Ghana, Guinea, Guinea-Bissau, Kenya, Madagascar, Mozambique, Rwanda, South Sudan, and Uganda, have experienced negative average rates. Therefore, Guinea shows the lowest rate at −16.41%. These findings suggest that these countries following an unsustainable development trajectory, as declining ANS rates can pose threat to future generations. Conversely, the majority of countries display positive average rates of ANS, with Botswana leading to 23.27%. This indicates that these countries doing well in terms of their capacity to save and accumulate resources for investment and development. In terms of average GS rates, the figure reveals that Uganda and Botswana stand out with the highest rates recorded at 35.80 and 33.69%, respectively. This figure reflects their significant ability to accumulate savings. Additionally, the figure illustrates a positive relationship between GS and ANS.
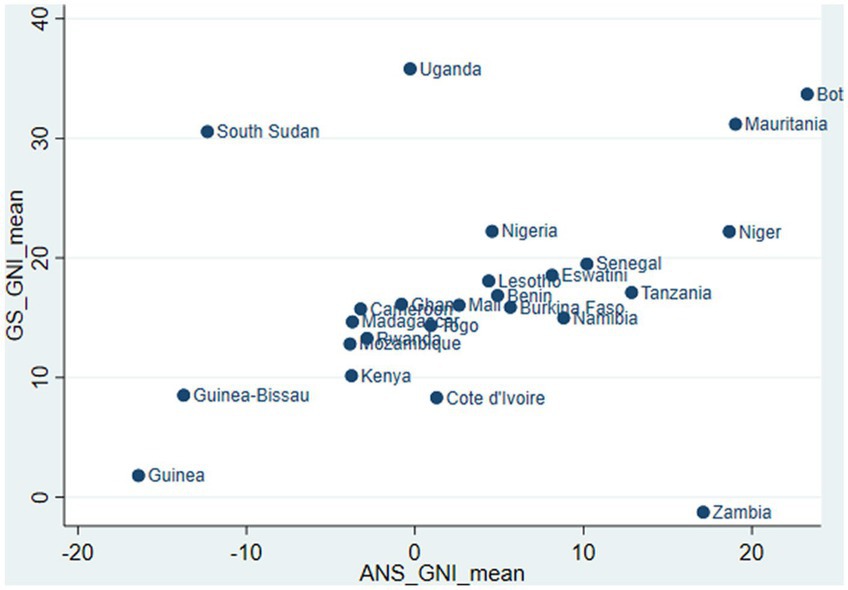
Figure 2. ANS and GS average rates (all panel countries are included).
It is vital to maintain the integrity of the model and ensure reliable outcomes in SGMM estimation by employing a single measure index for each variable. Furthermore, the presence of missing values poses a significant limitation in terms of data availability, necessitating careful selection of the most appropriate indices, representing the variables of interest in their natural logarithmic form (see Table 1).
Hence, Fic denotes financial inclusion, which is measured by the total number of existing ATMs per 100 thousand adults (106, 125–128). This indicator acts as a proxy for the access dimension of financial inclusion. Notably, previous research has predominantly focused on measuring financial inclusion through a limited set of dimensions, such as access to finance (129). It is generally expected that higher levels of financial inclusion will contribute to elevated sustainable development, as it provides individuals with increased opportunities to save and invest their money.
Fi represents FinTech, measured by the number of registered mobile agent outlets per 100 thousand adults (130–133). This indicator serves as a proxy for FinTech. The positive impact of FinTech on sustainable development is anticipated, as it has the potential to enhance the accessibility and affordability of financial services, particularly in remote and underbanked areas.
To consider other factors that may impact sustainable development, a range of macroeconomic variables are employed (see Table 1). Consequently, all control variables are included in their natural logarithmic form, except for inflation. These variables are the ratio of domestic credit to the private sector (% of GDP) shows the significance of credit in supporting economic activities and fostering growth within the country (134–137). On the other hand, trade openness (% of GDP) is measured by the sum of exports and imports of goods and services relative to GDP, also it promotes economic growth by facilitating market access, encouraging competition, and driving innovation and efficiency gains [(138–143)]. Furthermore, accounting for the potential influence of urbanization on sustainable development, we included Urban population (% of total population) which tracks urbanization trends, rural–urban migration, and urban development (144–146). Therefore, Age dependency rate reflecting the ratio of dependents to the working-age population, affects societies and economies (147–149). These variables strongly impact GS [(150–155, 158)]. However, Primary school enrollment (% of total enrollment) represents early-stage formal education and human capital development [Demire et al., (76, 123, 151, 156)]. Additionally, we incorporated the inflation rate as a proxy for macroeconomic stability, considering previous research by Rraci (157) and Emenalo et al. (144) as cited in Kebede et al. (159).
Our empirical strategy seeks to: (1) examines the potential associations among FinTech, financial inclusion, and sustainable development; (2) estimates the impact of interaction of FinTech and financial inclusion (Fic*Fi) on sustainable development (ANS_GNI / GS_GNI); and (3) estimates the marginal effect at median, maximum, and minimum levels.
We employed a dynamic panel of System Generalized Method of Moments (SGMM) to estimate our model. This approach combines equations with first differences and levels (161–167). To address endogeneity Arellano and Bover (168) recommended using forward orthogonal deviations (104). Overall, this approach helps researchers address various issues such as heteroscedasticity, autocorrelation, and individual effects. The GMM method’s ability to achieve consistent estimation results in at one time makes it a preferred choice and popular (169). In this respect, Roodman (170) suggested the two-step option of SGMM, which is more asymptotically efficient due to its utilization of an optimal weighting matrix in the estimation process. The use of SGMM allows for an accurate and valid results through the two-step level outcomes, which outperformed the one-step option. This approach also mitigates certain weaknesses associated with differenced GMM, such as small sample bias, as highlighted by Asongu and Nwachukwu (171), Goczek and Witkowski (172), Soto (173), Love and Zicchino (174). It is worth noting that the estimators are consistent if there is no second-order serial correlation in the error term. Serial correlation is tested using the (168) test for first and second order correlation; i.e., AR (1) and AR (2) tests, and overidentification is tested using the Sargan test for over-identifying restrictions (175, 176).
As an initial step, we conducted an exploratory analysis of the relationships between the dependent and main explanatory variables, as illustrated in Figure 3, and examined the correlation matrix, as depicted in Figure 4. Additionally, we performed a stationarity test, and the results are presented in Table 2.
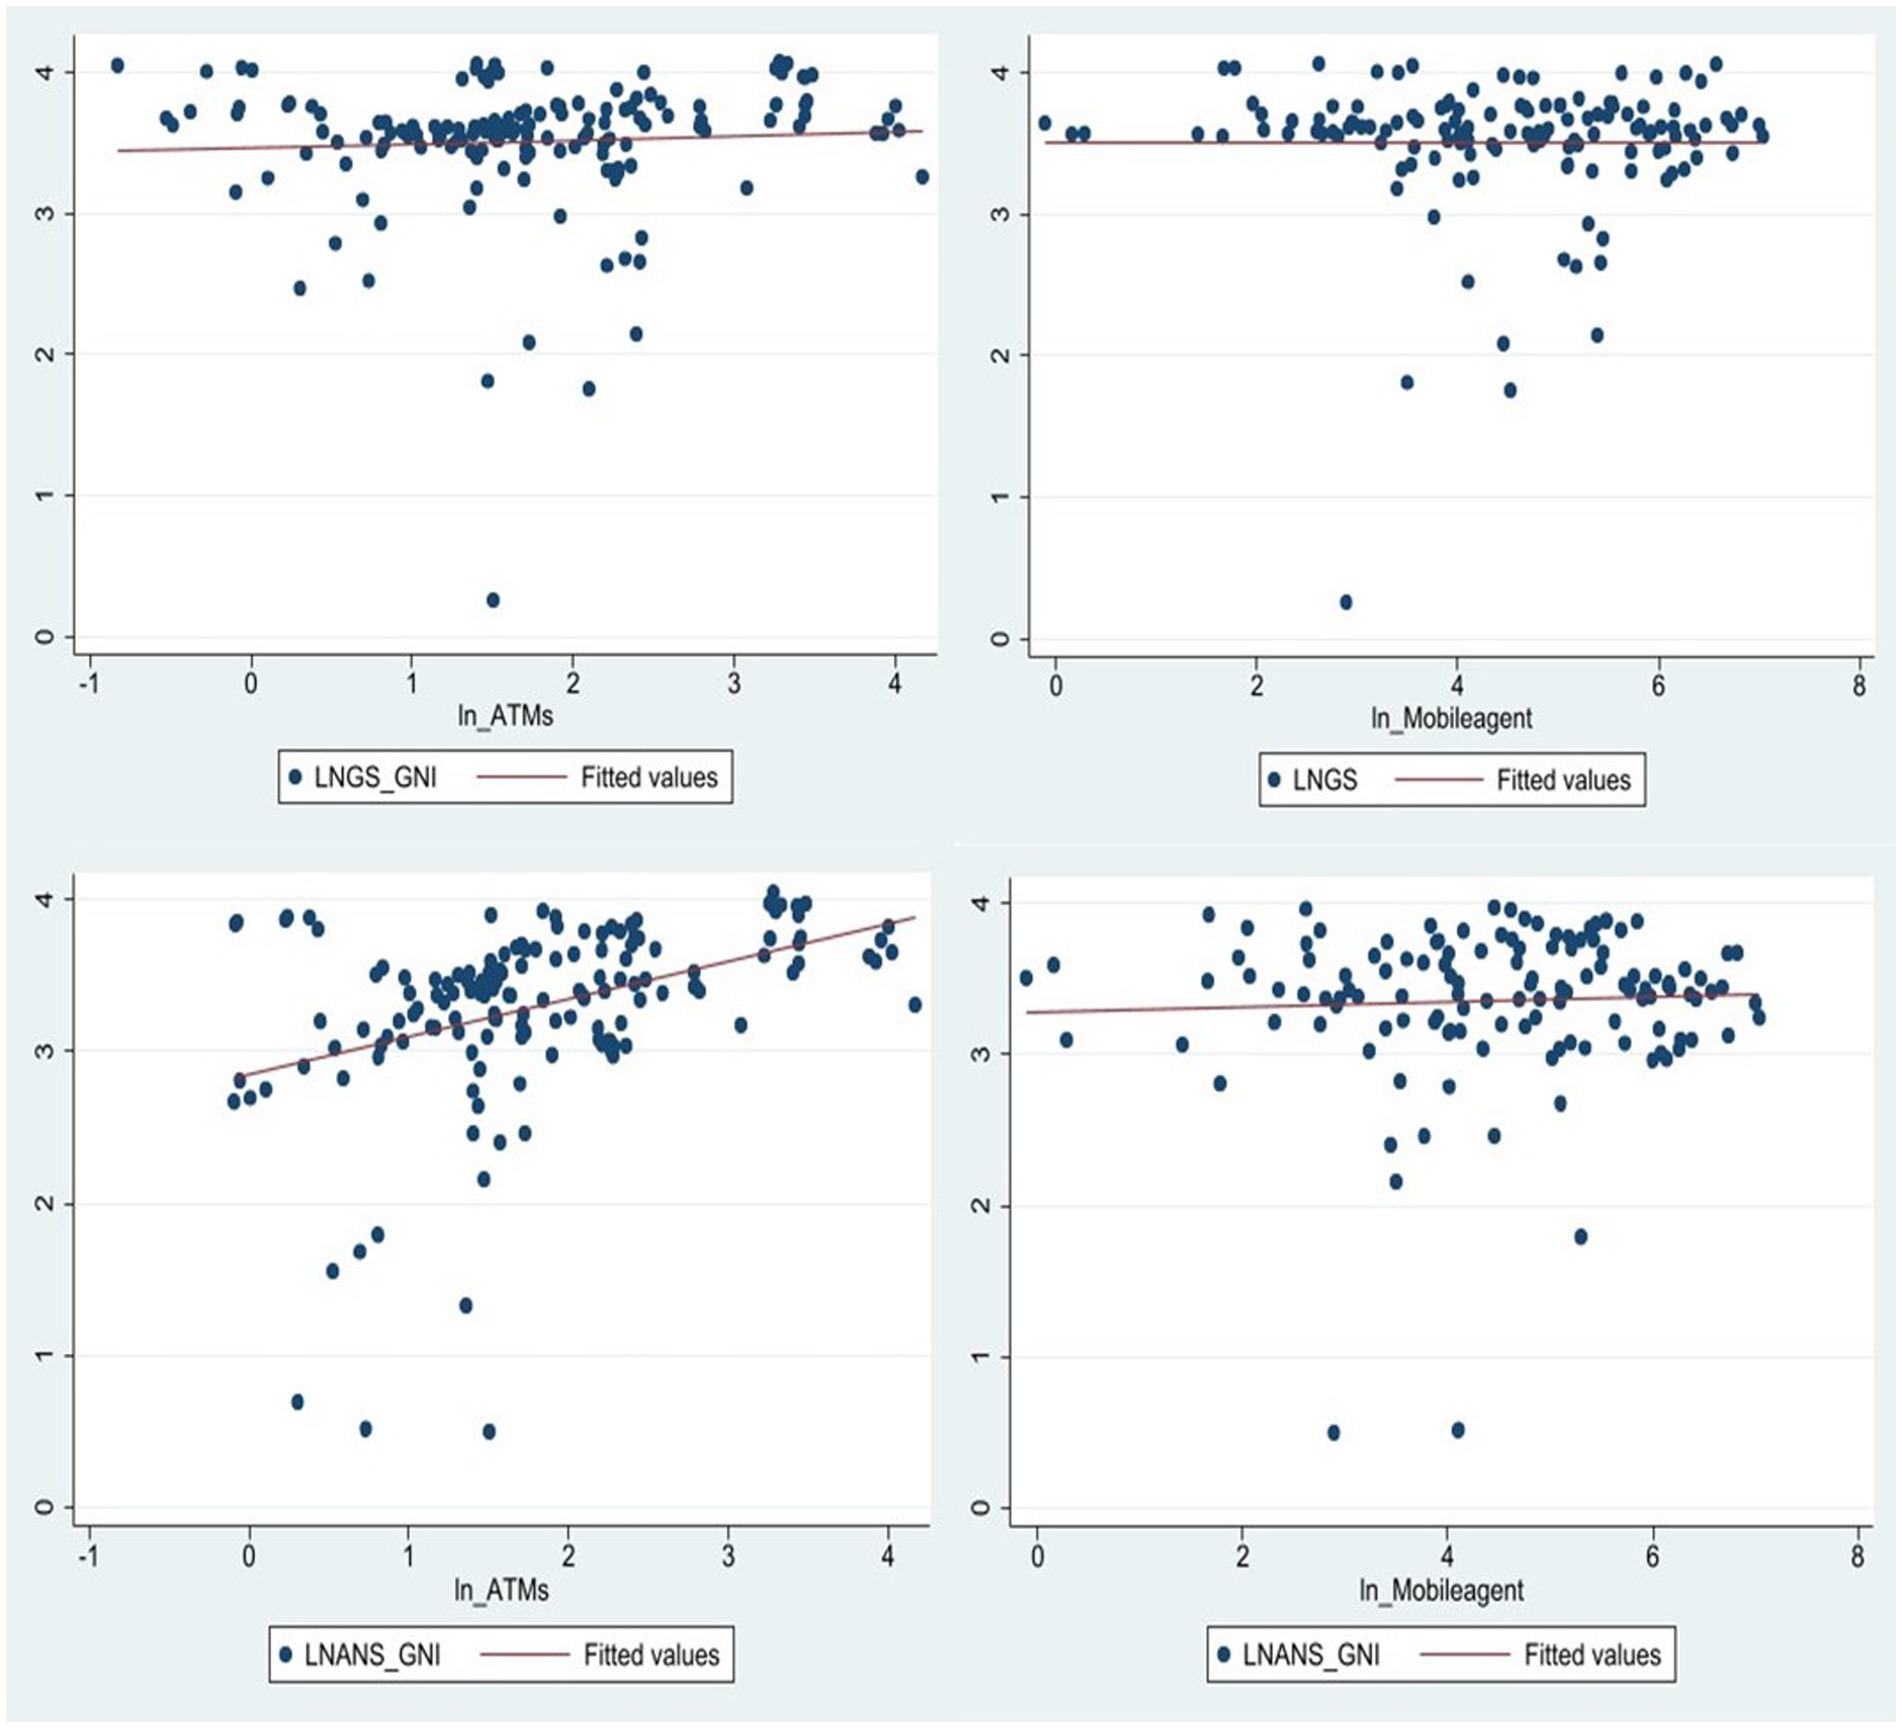
Figure 3. The relationship between FinTech, financial inclusion and sustainable development (GS_GNI, ANS_GNI).
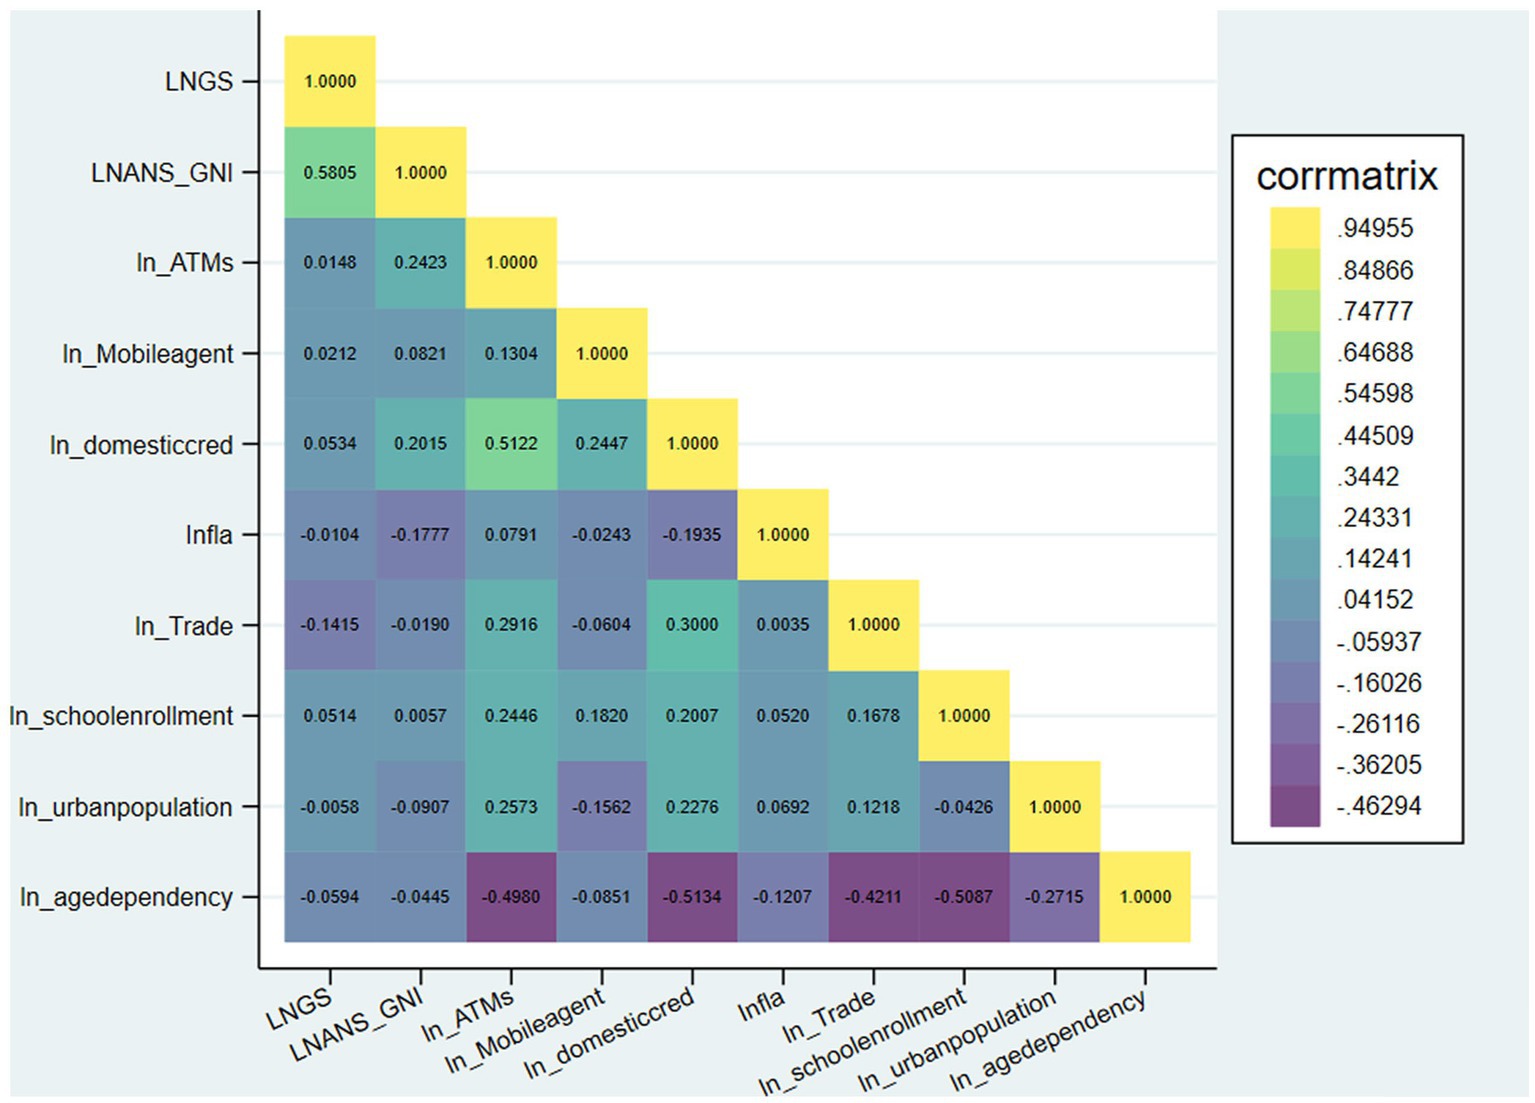
Figure 4. Correlation heatmap matrix.
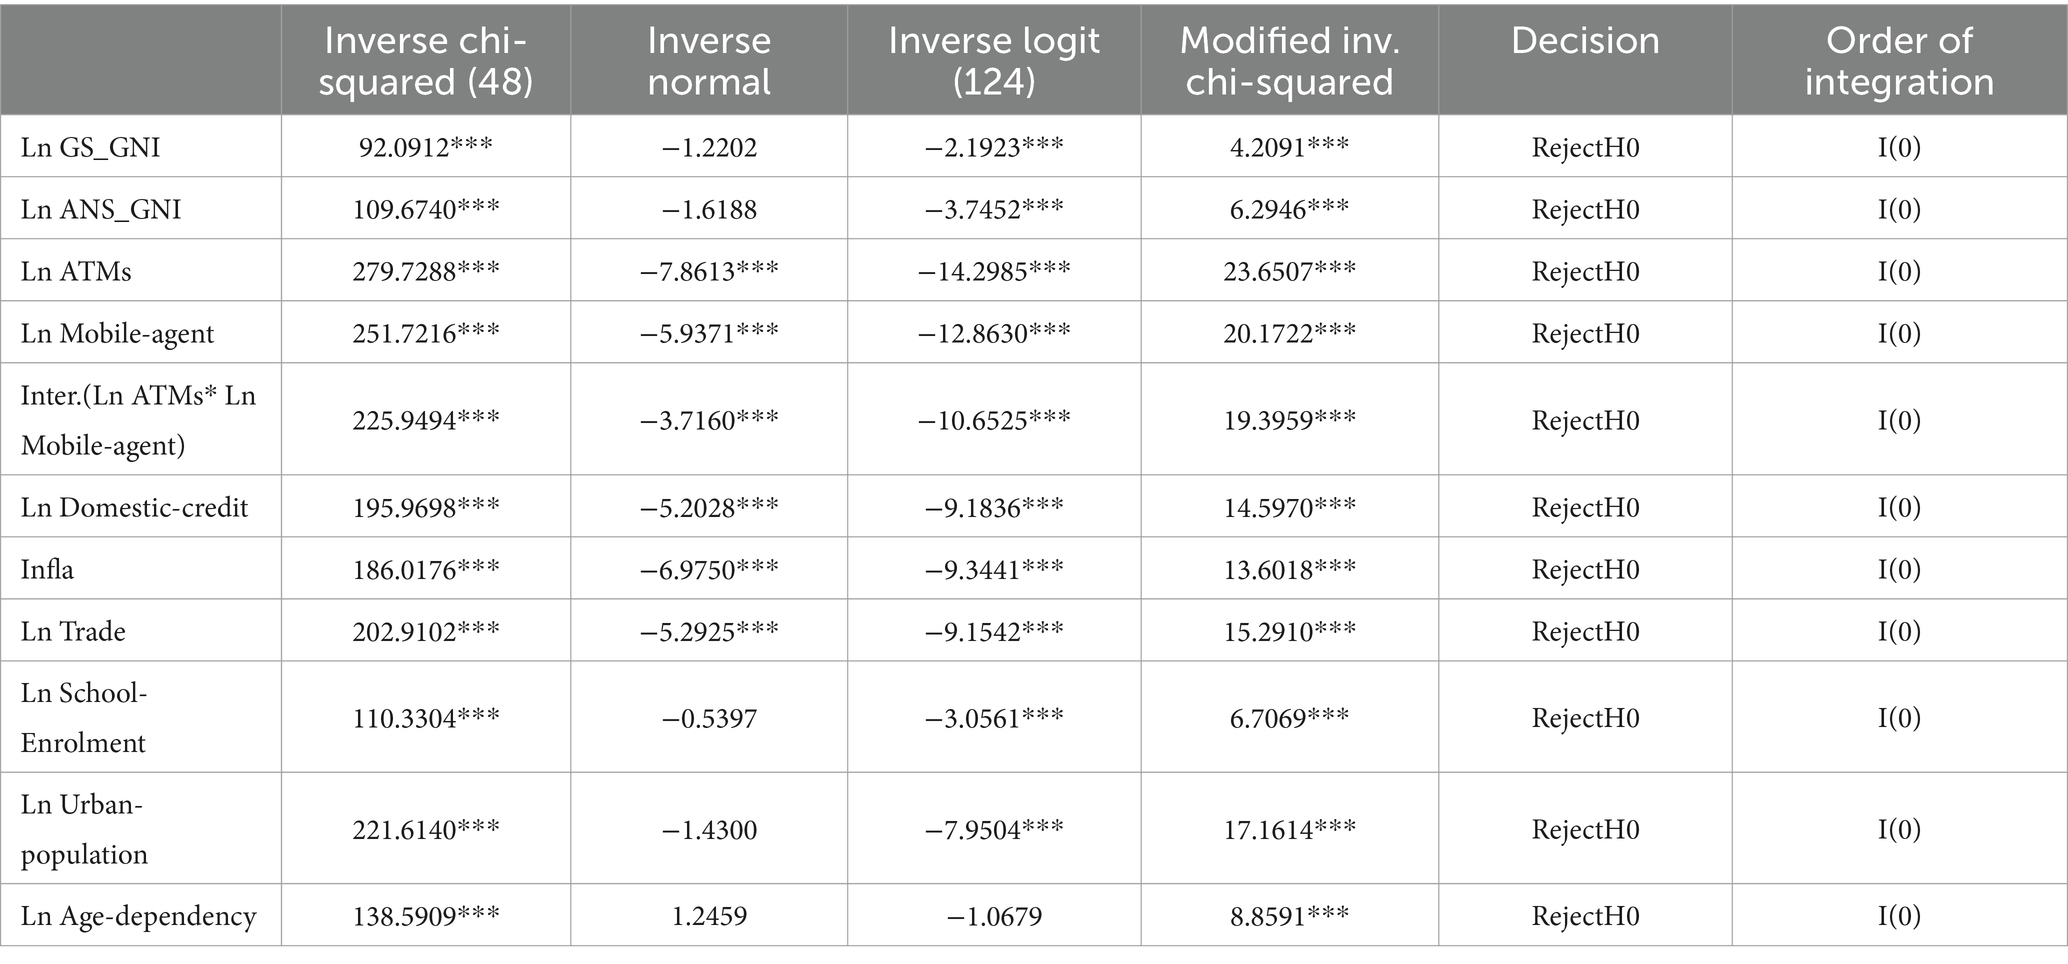
Table 2. Fisher ADF panel unit root test.
The empirical analysis follows several steps. In the first step, we employed the two-step SGMM method. This estimation was conducted for both GS_GNI, as reported in Tables 3, 4, and ANS_GNI, as displayed in Tables 5, 6. We considered models both with and without interaction terms to capture any potential moderating effects. In the second step, we conducted a static panel estimation to enable comparison. This involved utilizing Ordinary Least Square (OLS), OLS Fixed Effect (OLS FE) regressions, and Least Square Dummy Variable (LSDV) regression. These static estimations provided a comprehensive analysis of the relationships between the variables. In the last step, we estimated the marginal effects using SGMM for both dependent variables.
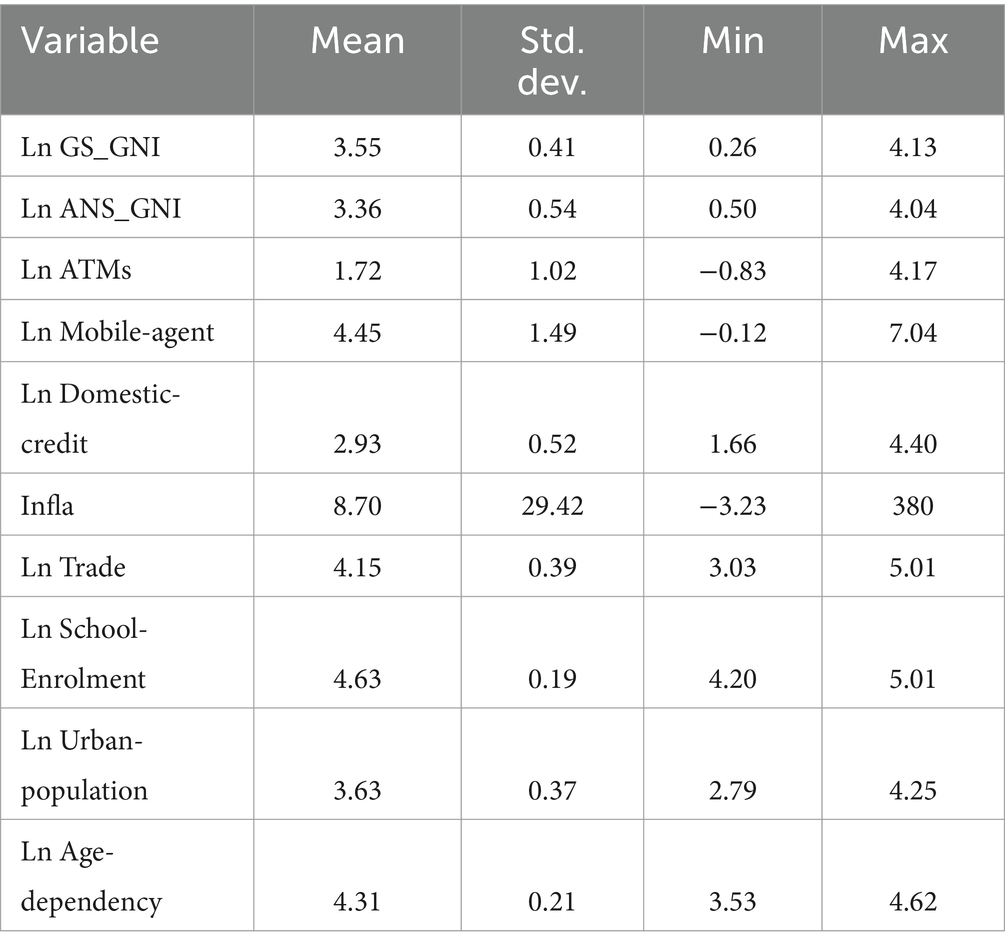
Table 3. Dynamic panel estimates: SGMMtwosteps (GS as a percentage of GNI).
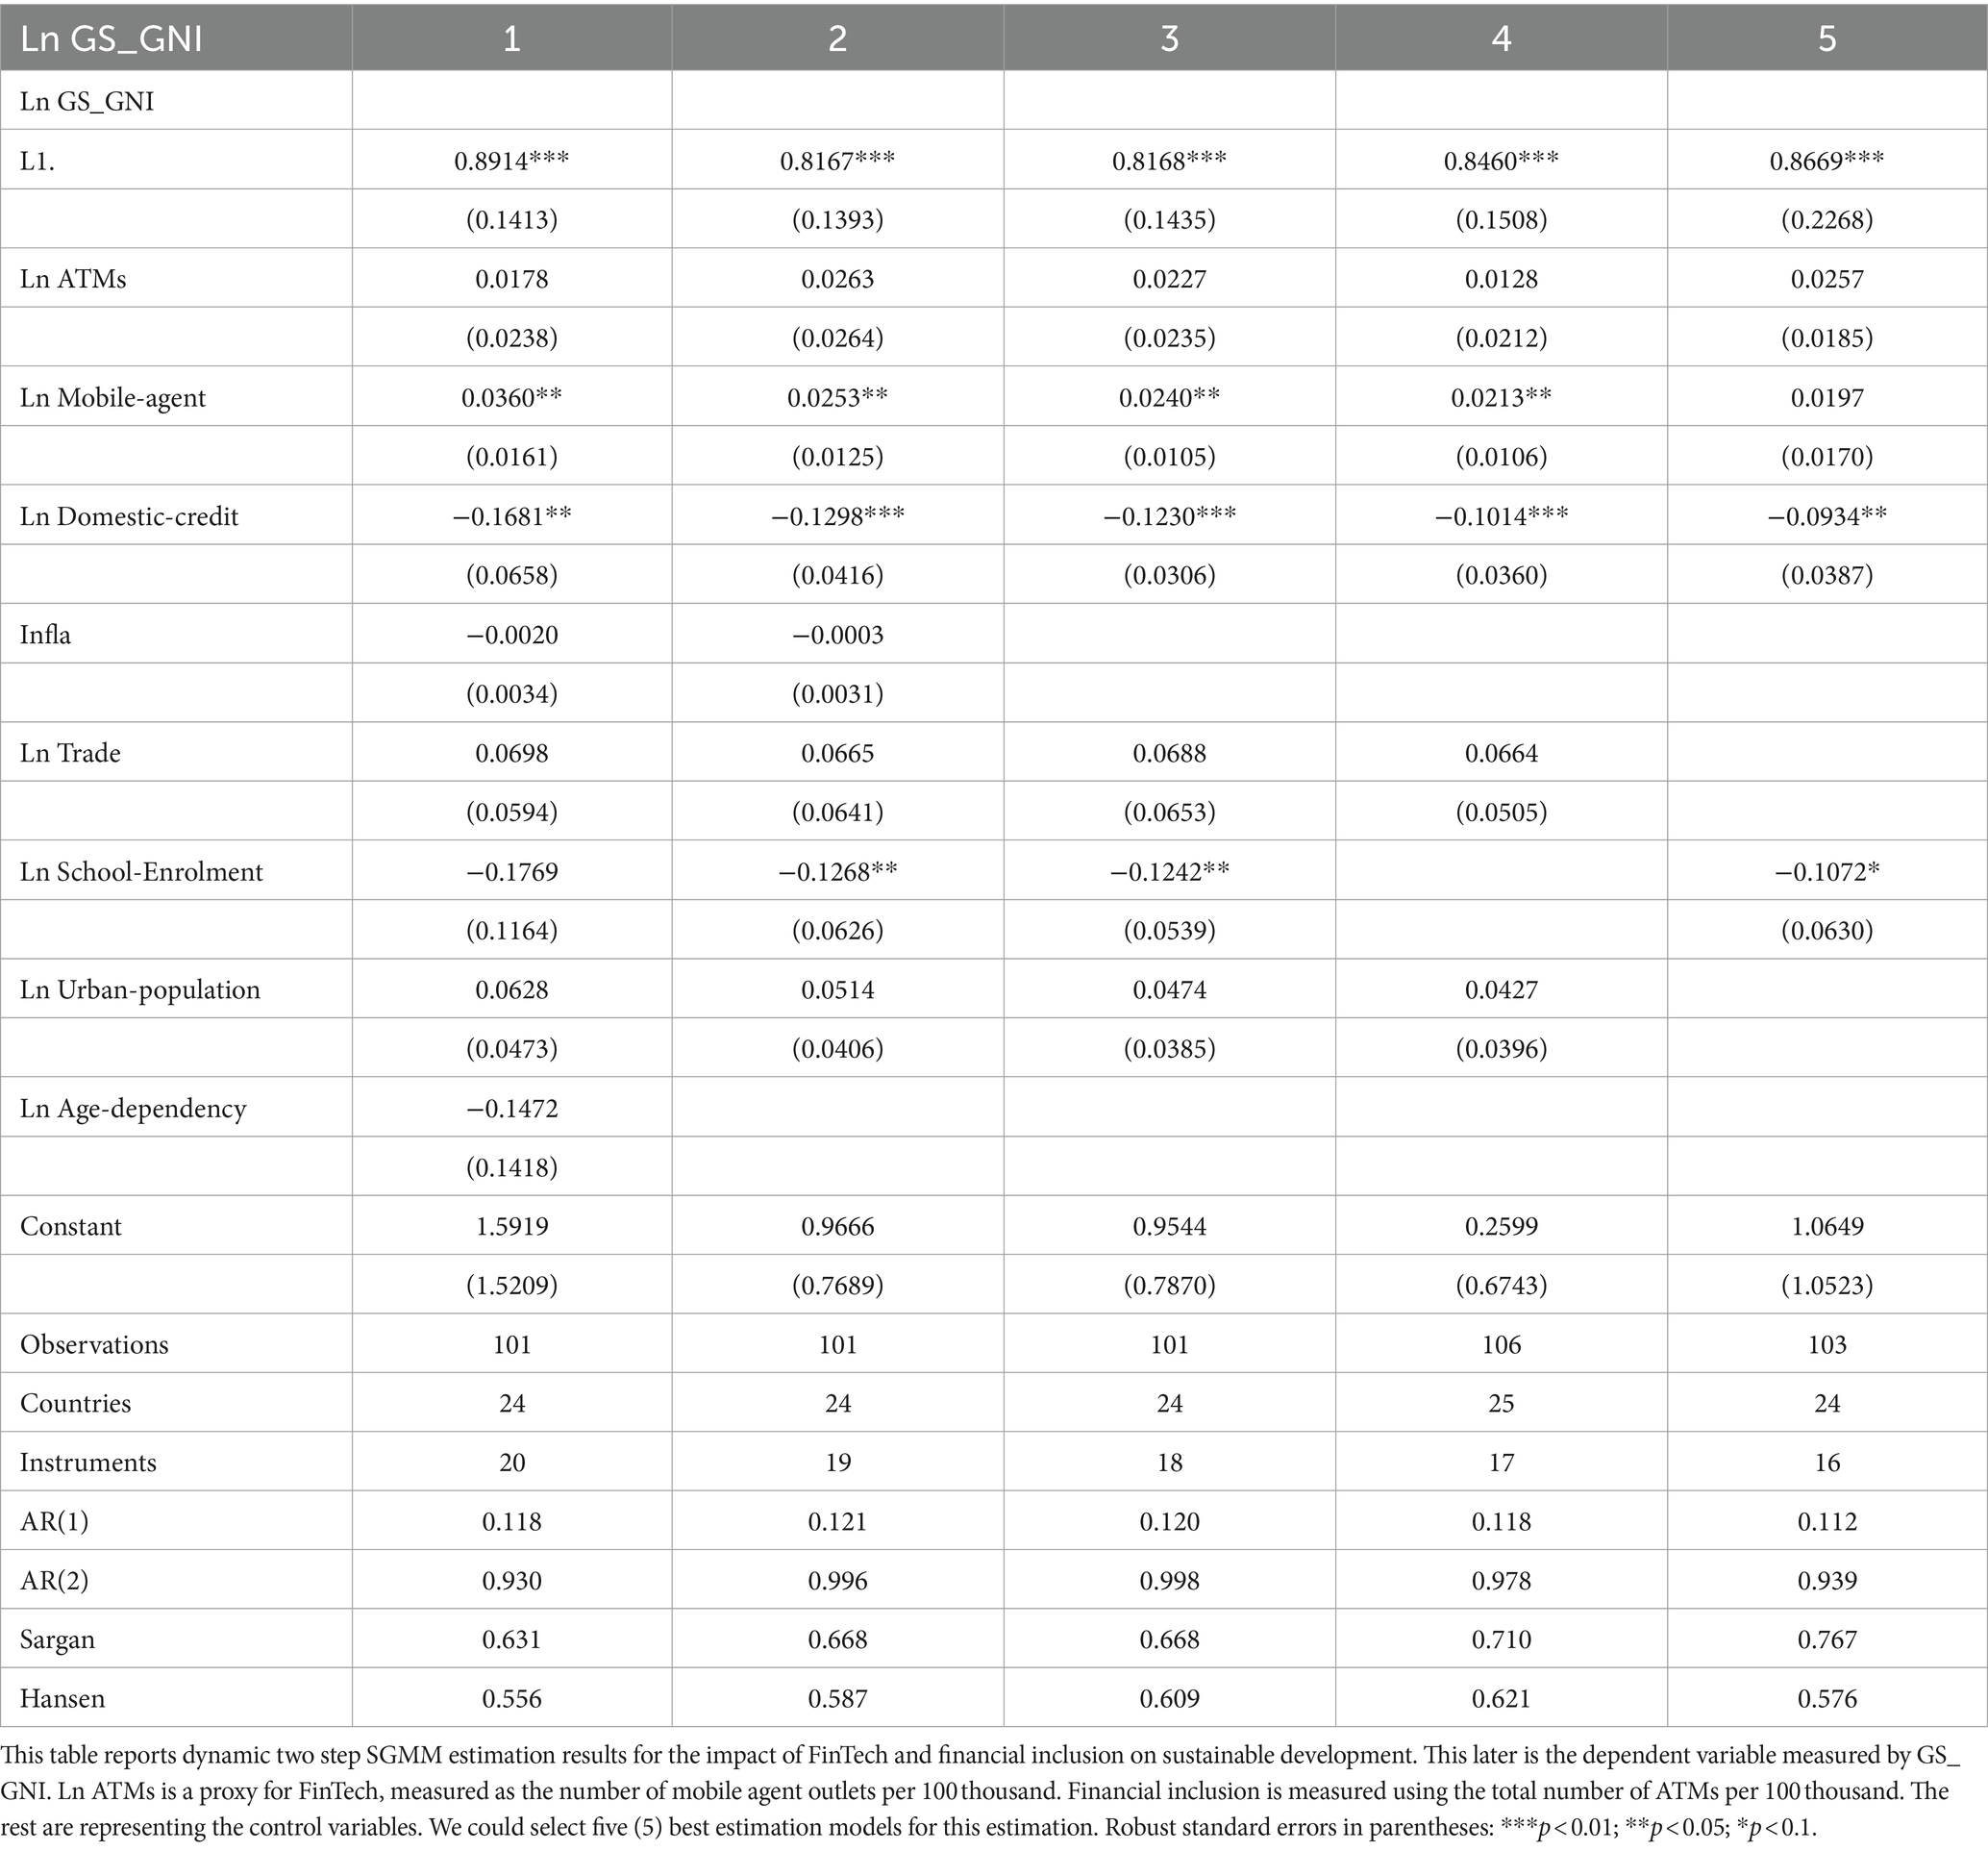
Table 4. Dynamic panel estimates: SGMMtwosteps (GS as a percentage of GNI) with interaction terms.
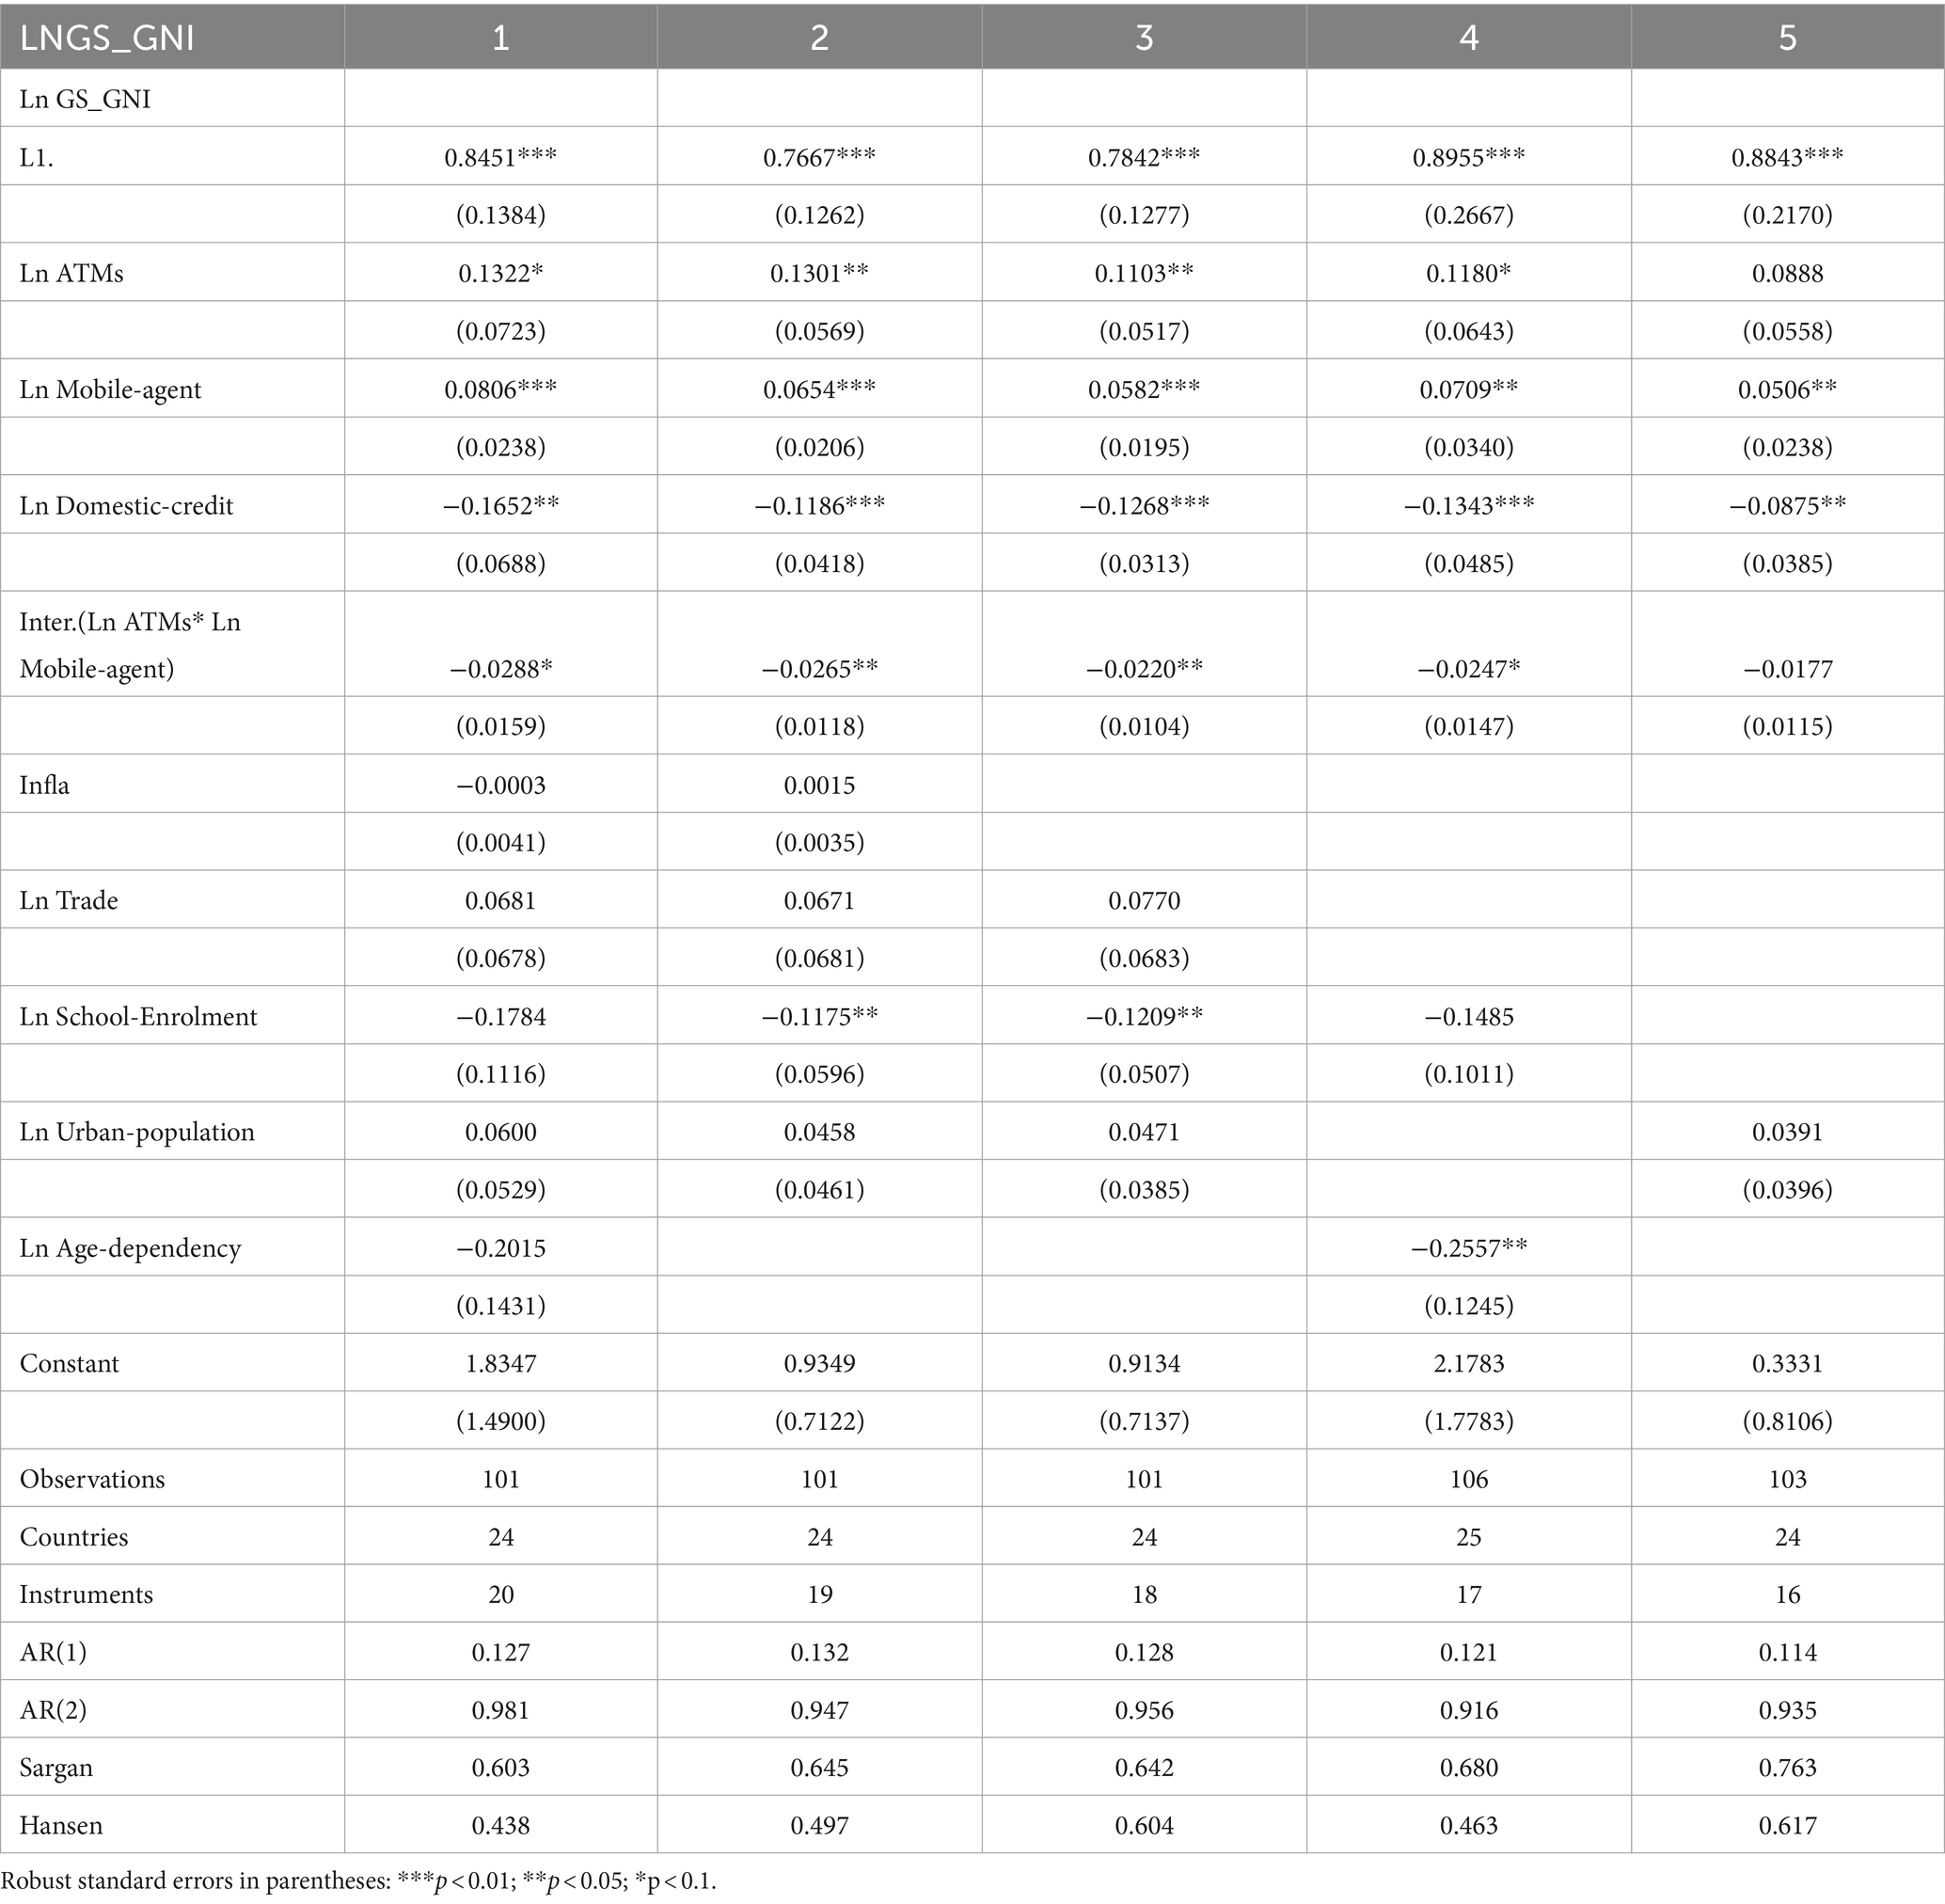
Table 5. Dynamic panel estimates: SGMMtwosteps (ANS as a percentage of GNI).
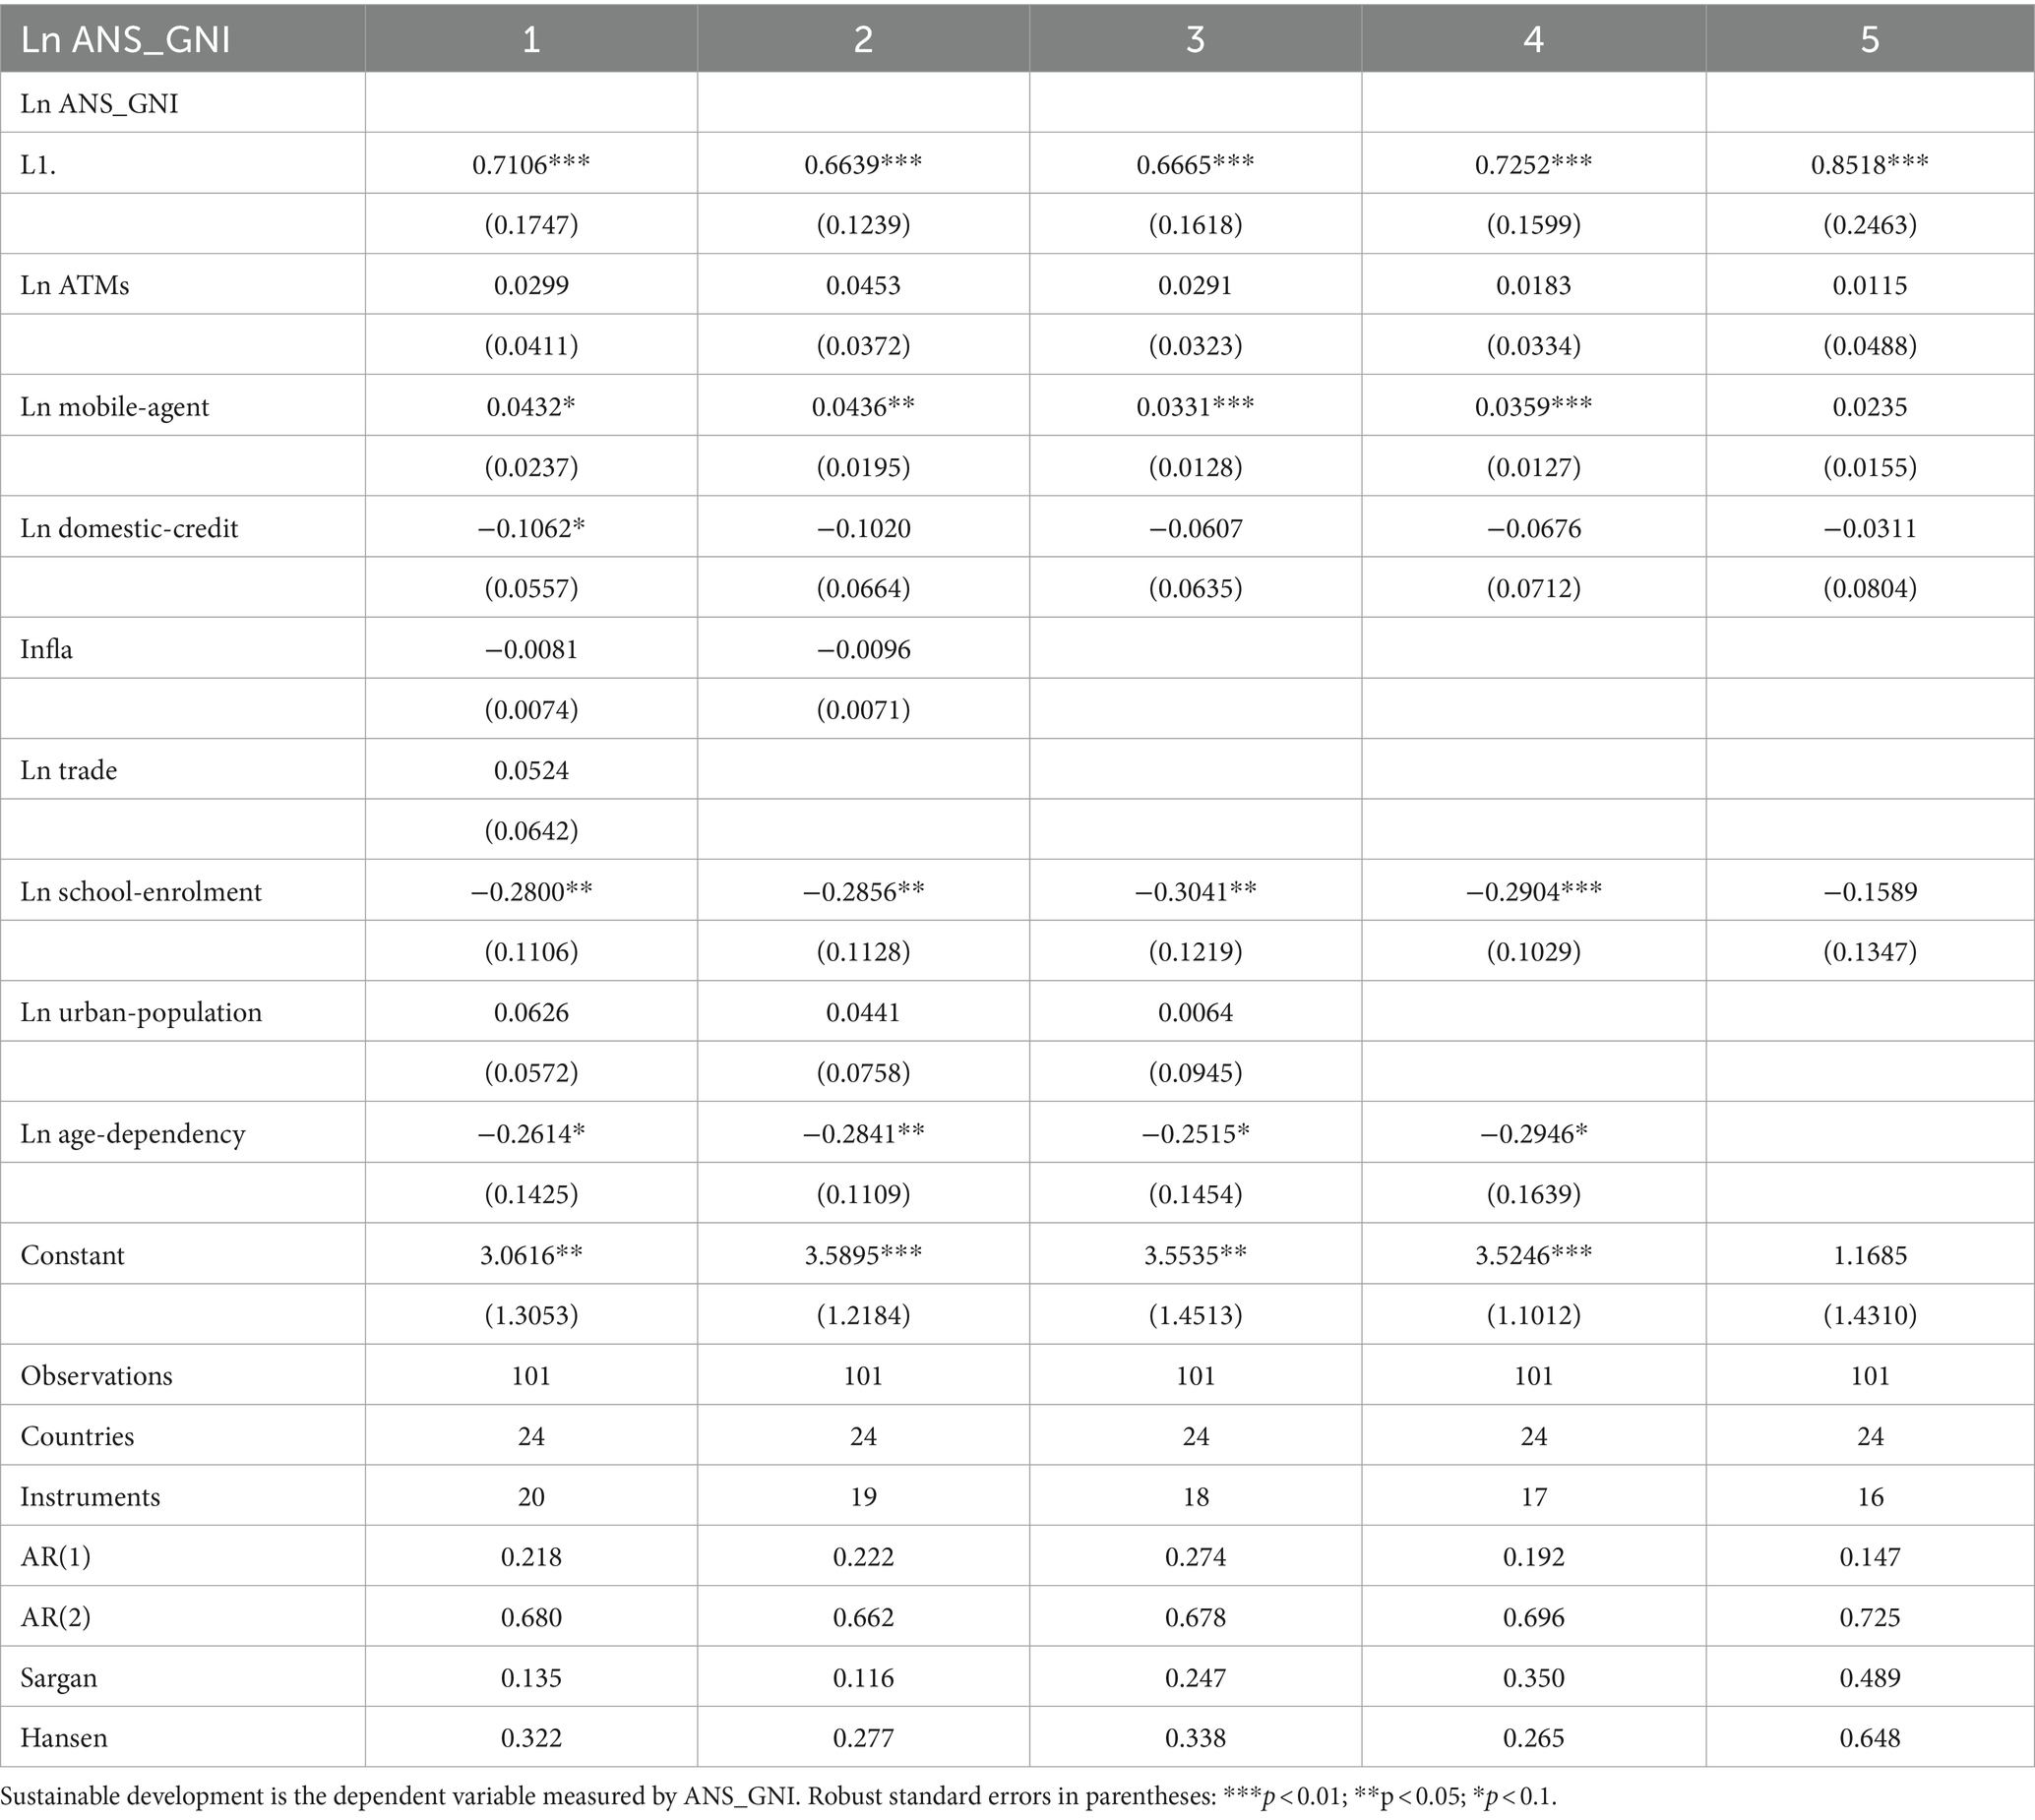
Table 6. Dynamic panel estimates: SGMMtwosteps (ANS as a percentage of GNI) with interaction terms.
We conducted our analysis estimation using STATA version 17, a widely utilized statistical software package known for its powerful tools and functionalities in data analysis. The utilization of STATA enabled us to effectively perform a comprehensive analysis, leveraging its features for robust estimation and interpretation of our findings.
To ensure appropriateness and avoid spurious regression and misleading conclusions in dynamic panel estimation and static panel estimation, stationary properties are highly necessary [(104, 177–179)]. To meet this requirement, we conducted a Fisher ADF panel unit root test (180). The results, presented in Table 2, indicate that all variables included in our analysis exhibit stationarity in levels (at the 1% significance level).
Table 7 provides descriptive statistics for each variable, offering valuable insights into their characteristics and variability. The table includes information such as the number of observations, mean, standard deviation, minimum, and maximum values. Notably, the ATMs variable displays a standard deviation of 1.02, indicating moderate variation. The minimum value of −0.83 and the maximum value of 4.17 suggest a wide range of observations for this variable. In contrast, the Mobile agent variable exhibits a higher standard deviation of 1.49, indicating a minimum value of −0.12 and a maximum value of 7.04. For the Inflation variable, the standard deviation is 29.42, with a minimum value of −3.23 and a maximum value of 380. The wide range of values and high standard deviation in inflation suggest the presence of observations with significant inflation rates, potentially indicating periods of hyperinflation.
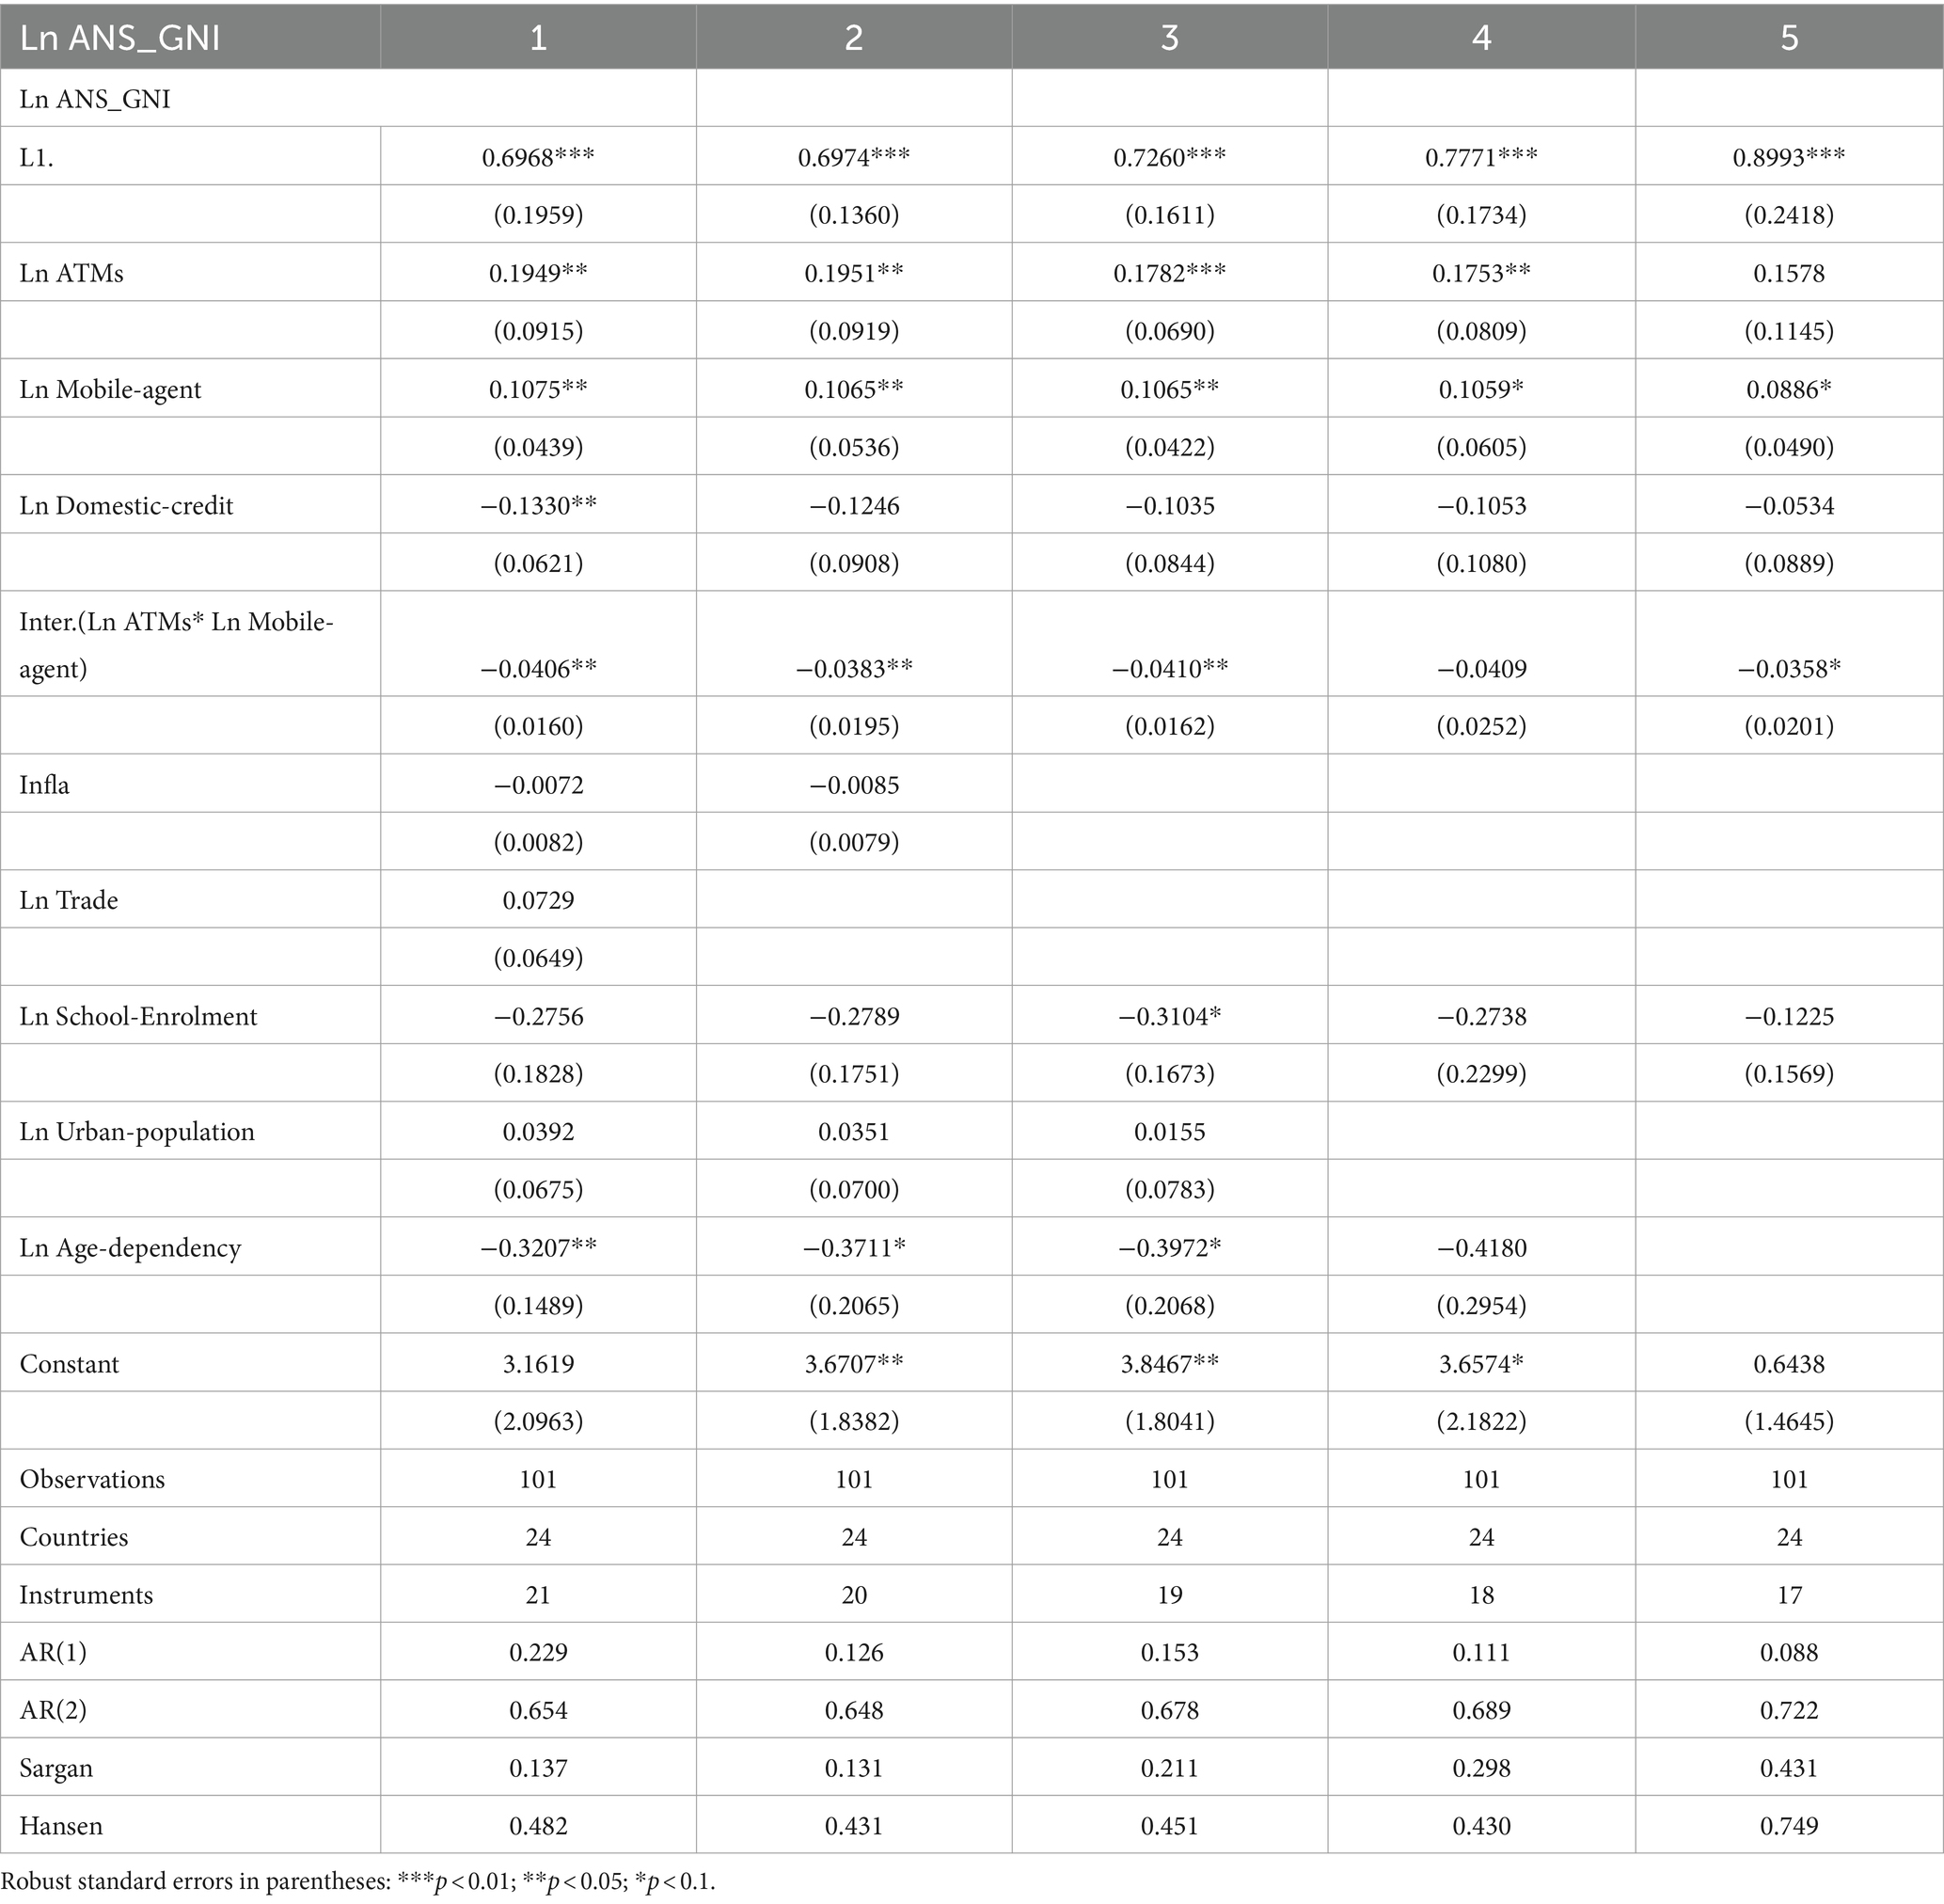
Table 7. Summary statistics.
Figure 4 is a correlation heatmap that visually displays the relationships and correlations between 10 variables. Each variable is represented by a column, and the rows show the relationships between pairs of variables. Positive values in the cells indicate positive correlations, while negative values indicate negative correlations. The color-coding makes it easy to quickly identify and interpret the strength of the relationship between two variables (181).
The correlation matrix reveals some notable links among the variables. Firstly, moderate positive correlations are observed between GS_GNI and ANS_GNI (0.5805), ATMs and domestic credit (0.5122), and trade and domestic credit (0.3000). On the other hand, weak bivariate correlations below 30% are observed. Secondly, moderate negative correlations are found between age dependency and domestic credit (−0.5134), school enrollment and age dependency (−0.5087), and age dependency and trade (−0.4211). These negative correlations suggest an inverse relationship between these variables, where an increase in one variable is associated with a decrease in the other. Additionally, weak bivariate correlations below −30% are also observed. Overall, the correlation analysis indicates that most correlation coefficients among the explanatory variables fall within the moderate range (around 0.3 to 0.5, −0.3 to −0.5), with some even weaker. Thus, these bivariate correlations imply that multicollinearity is unlikely to be a problem for the estimated models. Figure 3 provides an overview of the relationships between FinTech (mobile agent), financial inclusion (ATMs), and sustainable development (GS_GNI and ANS_GNI), offering a clear and concise description of their trends. This figure shows a positive association between these variables.
Table 3 presents preliminary results. For instance, the coefficient value of 0.8914 highlights a strong positive association between the current and lagged values of GS_GNI. This observation indicates a high degree of stability in GS_GNI, suggesting that past values strongly influence the current value of GS_GNI. The coefficients for ATMs show a non-significant positive impact on GS_GNI for all specifications. The presence of mobile agents exhibits a weak but statistically significant positive association with GS_GNI across different specifications (1 to 4). Conversely, domestic credit consistently exhibits a statistically significant negative relationship with GS_GNI across all specifications. This points to a situation where an increase in domestic credit is linked to a decrease in GS_GNI. In specifications 2, 3, and 5, there is a statistically significant negative relationship between school enrollment and GS_GNI. Additionally, the coefficients of the remaining control variables, namely inflation, trade, urban population, and age dependency, do not demonstrate any statistically significant impact on GS_GNI.
The diagnostic tests reveal that the null hypothesis (Ho: no autocorrelation) is not rejected for both AR(1) and AR(2) tests, which suggests the absence of the first-order and second-order serial correlation in disturbances across all specifications. Furthermore, the Sargan and Hansen tests were performed to assess the validity of the instruments used in the estimation. The results of these tests confirm the validity of the instruments in all specifications, indicating that the model is properly specified and the instruments employed are appropriate for capturing the relationships between the variables.
Table 4 reveals significant findings. Firstly, the coefficients for GS_GNI indicate a strong positive relationship with lagged GS_GNI, suggesting a substantial impact. Secondly, the coefficients for ATMs demonstrate significant impacts on sustainable development in specifications 1, 2, 3, and 4 (0.1322*, 0.1301**, 0.1103**, 0.1180*). This implies that a one percentage point increase in financial inclusion leads to a 0.1301 percentage points increase in sustainable development at a 5% significance level in specification 2. Thirdly, the coefficients for Mobile-agent indicate a statistically significant and weak positive effect on sustainable development across all specifications. Specifically, a one percentage point increase in financial technology leads to a 0.0806 percentage points increase in sustainable development at a 1% significance level in specification 1. Fourthly, the coefficients for Domestic-credit demonstrate a significant negative impact on sustainable development in all specifications (−0.1268 in specification 3 at a 1% significance level). Fifthly, the interaction term between ATMs and Mobile-agent shows a statistically significant and weak negative effect in specifications 1, 2, 3, and 4. Sixthly, variables such as School-Enrollment and Age-dependency show a statistically significant negative impact in certain specifications. Seventhly, the coefficients for Inflation and Urban-population show insignificant effects, both positive and negative. As for the robustness tests, they consistently demonstrate high reliability across all specifications.
Not surprisingly, Table 5 presents consistent findings with Table 3 regarding the impact coefficients and their directions, except for Age-dependency, which consistently displays a negative and statistically significant impact on sustainable development across all specifications. Additionally, the constant term demonstrates a positive and statistically significant impact in all specifications, except for specification 5. The table also includes the results of the AR(1) and AR(2) tests which suggest that there is no significant serial correlation in the residuals. Further, the Sargan test statistics are provided, which show that the instruments used in the analysis are valid and there is no problem of over-identification.
Table 6 reveals compelling findings regarding the relationship between variables and sustainable development. The coefficients for ANS_GNI demonstrate a consistently positive and robust relationship with lagged ANS_GNI, suggesting a substantial and meaningful impact. Notably, the coefficients for ATMs show significant impact on sustainable development across multiple specifications (1, 2, 3, and 4), indicating a more pronounced impact compared to previous estimations. Specifically, in specification 2, a one percentage point increase in financial inclusion is associated with a 0.1951 percentage points increase in sustainable development at a 5% significance level. These results underscore the important role of ATMs in enhancing access to financial services and promoting sustainable development. Furthermore, the coefficients for Mobile-agent also indicate a significant positive effect on sustainable development across all specifications. For example, in specification 1, a one percentage point increase in FinTech is associated with a 0.1075 percentage points increase in sustainable development at a 5% significance level. This finding highlights the promising potential of increased utilization of FinTech in improving levels of sustainable development in the African region.
Contrarily, the coefficients for Domestic-credit reveal a statistically significant negative effect on sustainable development, particularly in the first specification. This finding suggests that higher levels of local borrowing or credit may impede efforts toward sustainable development. Additionally, the coefficients for the interaction term between ATMs and Mobile agent services demonstrate a statistically significant and weak negative effect on sustainable development across specifications 1, 2, 3, and 5. These negative coefficients can be attributed to the potential overlap of services provided by ATMs and Mobile agent outlets, resulting in redundancy and inefficiency.
Regarding the remaining control variables, the coefficients for inflation, trade, and urban population do not demonstrate statistically significant effects on sustainable development. However, school enrollment exhibits a significant negative impact, specifically in specification 3, at a 10% significance level. This suggests that a one percentage point increase in school enrollment leads to a 0.3104 percentage points decrease in sustainable development. Similarly, the Age-dependency ratio shows a significant negative impact in specifications 1, 2, and 3. A one percentage point increase in the Age-dependency ratio results in a 0.3972 percentage points decrease in sustainable development in specification 3, at a 10% significance level. The constant coefficients exhibit positive and statistically significant impact in specifications 2, 3, and 4. Accordingly, the conducted robustness tests confirm the high reliability of the results across all specifications, further strengthening the validity of the findings.
To enhance the robustness of our results, we employed a static panel estimation methodology. This approach involved utilizing various regression techniques, namely Ordinary Least Squares (OLS), OLS with Fixed Effects (FE), and Least Squares Dummy Variable (LSDV) regression. This comparative approach allows for a comprehensive analysis and reinforces the reliability of our findings.
Table 8 displays the results of a static panel estimation using OLS, OLS FE, and LSDV for the GS_GNI regression model described by Equation (1). The coefficients of GS_GNI and its lagged value, L1, are found to be statistically significant across all three estimation methods. The coefficients of ATMs generally lack statistical significance, except in the OLS FE estimation, where a significant positive relationship (0.5730, 0.5129, 0.5084) is observed at a 5% significance level. Likewise, the coefficients of Mobile-agent are mostly insignificant in the various estimation methods. However, in the OLS FE estimation, significant positive coefficients (0.1222*, 0.1304**, 0.1208**) are observed. This implies that Mobile-agent has a positive impact on sustainable development. Conversely, the coefficients for domestic-credit are statistically significant across all estimation methods, with negative values indicating an inverse relationship. Thus, an increase in domestic credit is associated with a decrease in sustainable development.
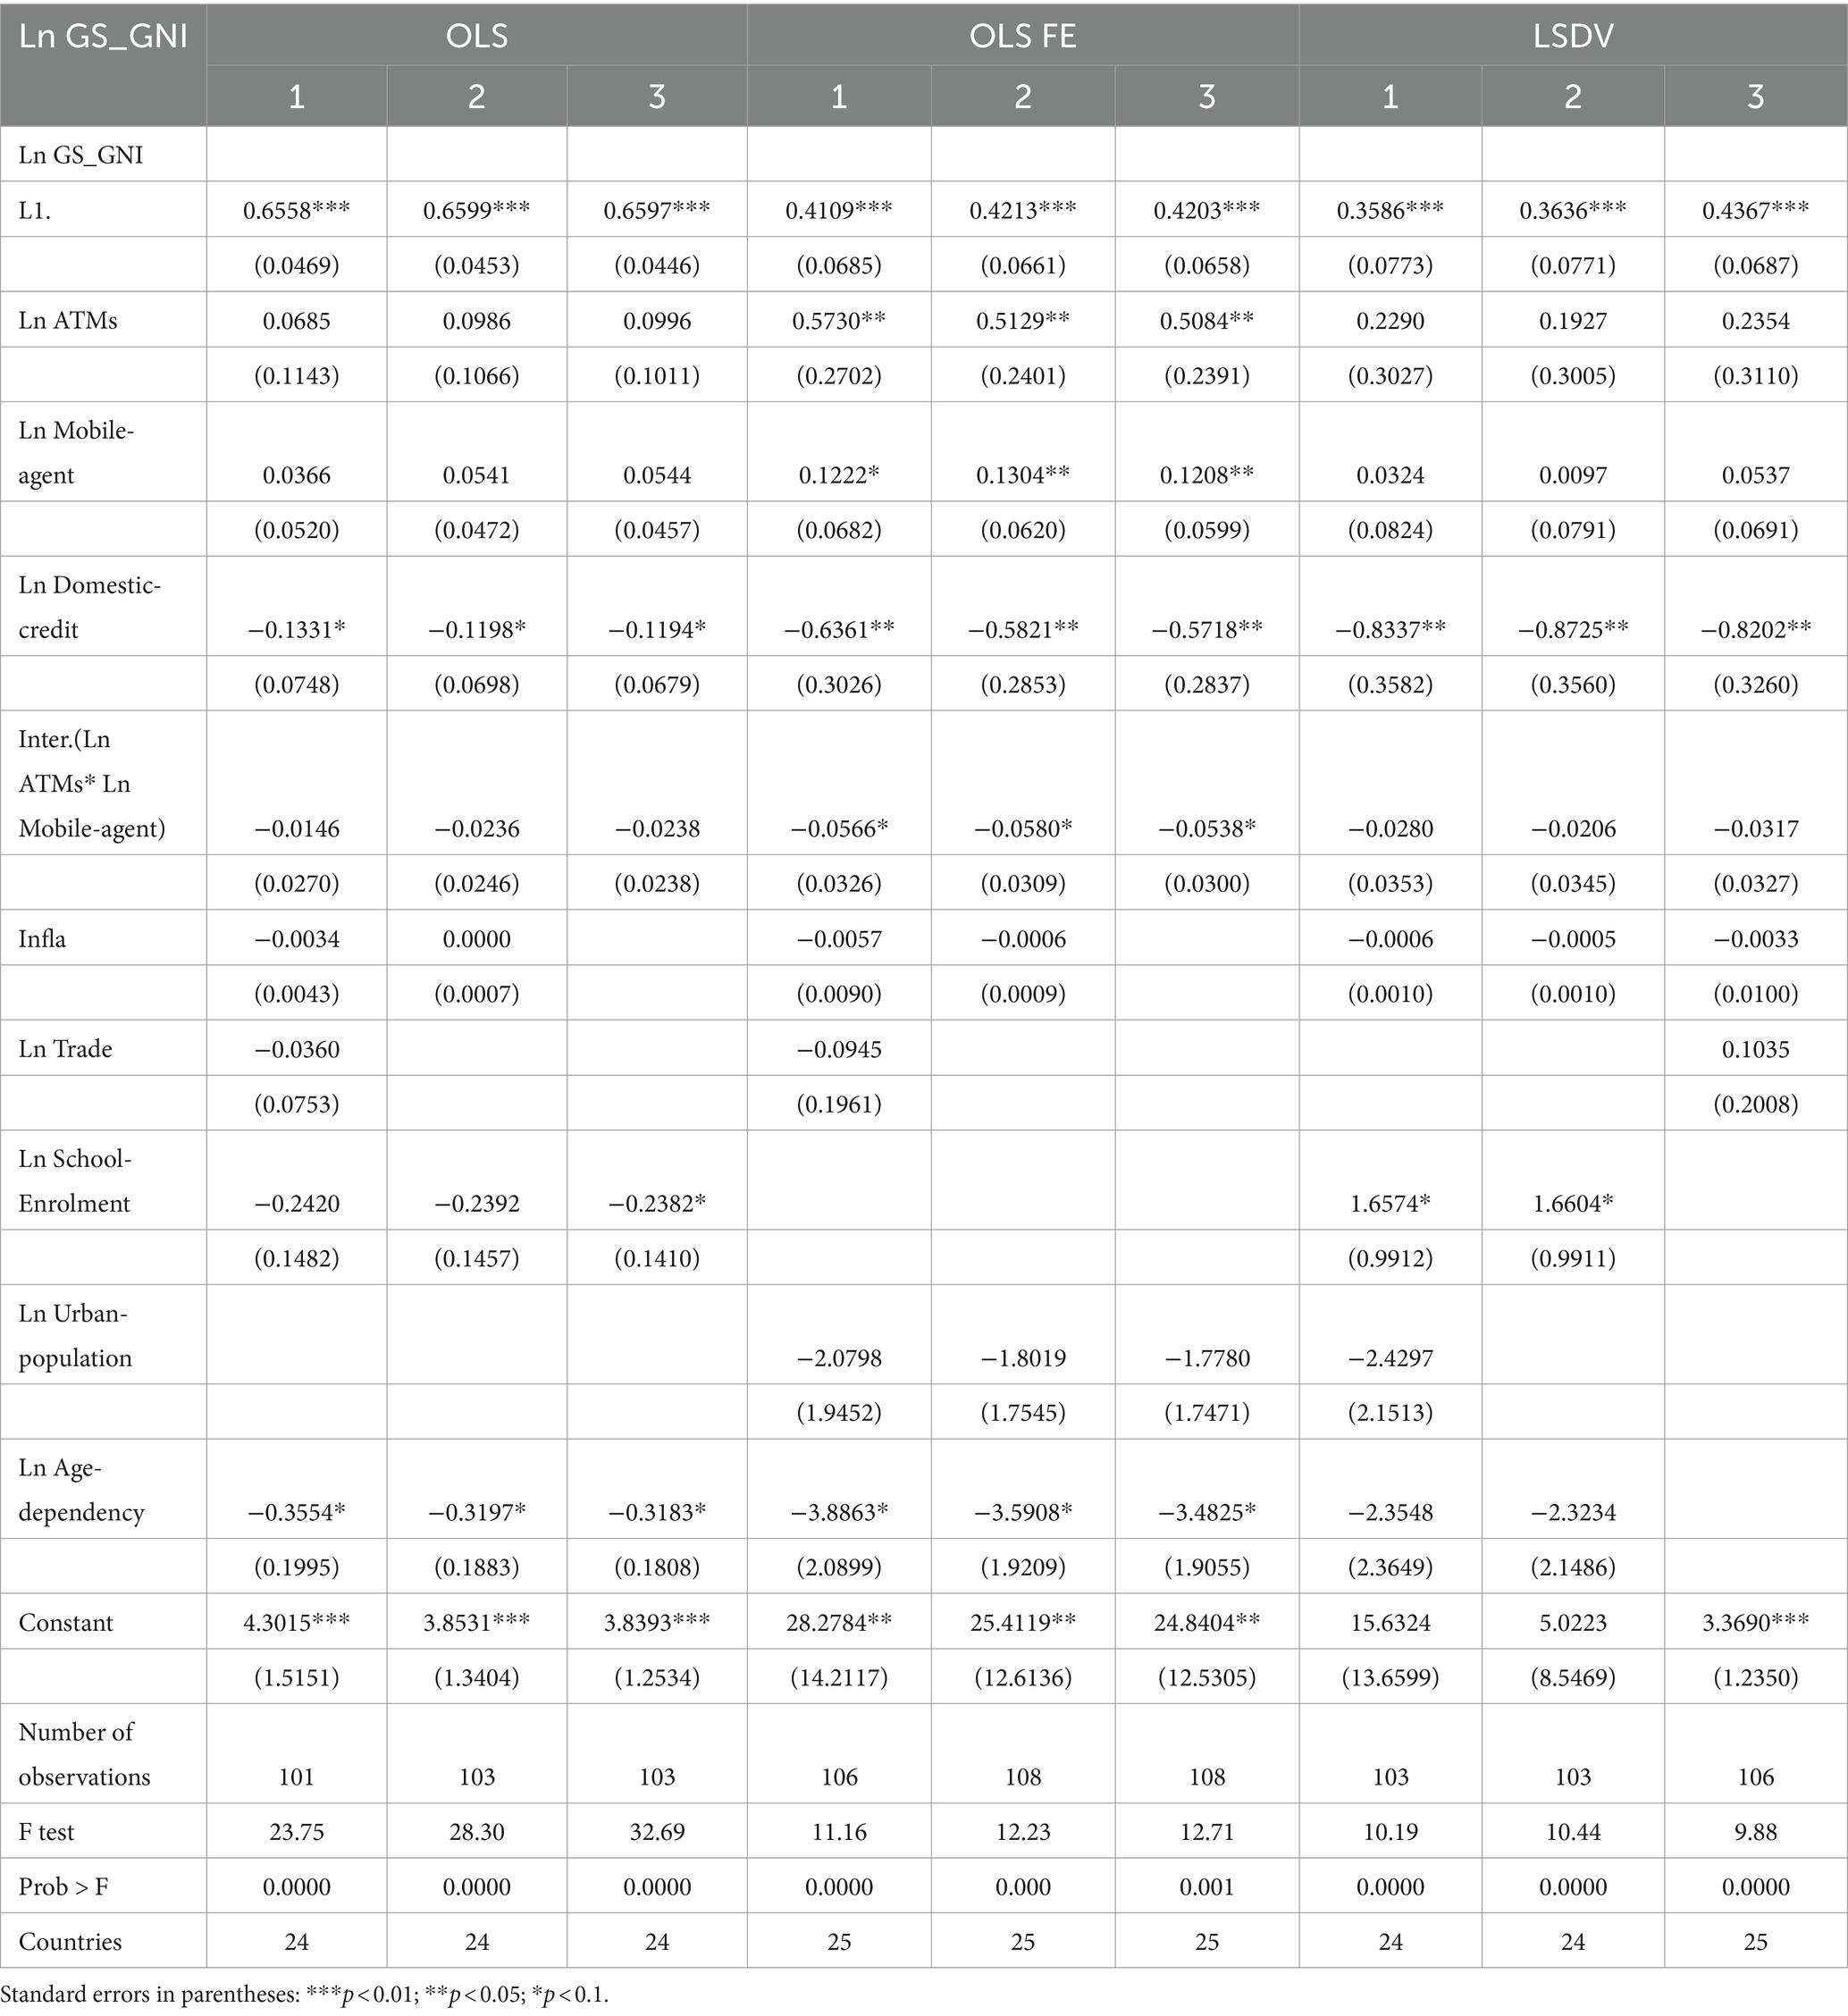
Table 8. Static panel estimates: OLS, OLS FE, LSDV (GS as a percentage of GNI).
The results regarding the interaction term (ATMs * Mobile-agent) suggest that, in most estimation methods, the coefficients are not statistically significant. However, in the OLS FE estimation, they are observed to be significant, albeit with low significance levels (−0.0566*, −0.0580*, −0.0538*). This indicates that the interaction between ATMs and Mobile-agent has a limited impact on sustainable development. Among the variables examined, the coefficients related to age dependency exhibit a significant and substantial negative impact on sustainable development in the OLS and OLS FE estimations, while this impact was not statistically significant in the LSDV estimation. On the other hand, the coefficients for inflation, urban population, and trade are not statistically significant. However, the coefficients for school enrollment demonstrate statistical significance at a 10% level in the OLS (−0.2382*) and LSDV (1.6574*, 1.6604*) estimations. Finally, the statistically significant coefficients observed in the F test provide confirmation of the reliability of the estimation results.
Table 9 presents the results of a regression analysis using OLS, OLS FE, and LSDV estimation methods with ANS_GNI in Equation (2). The coefficients of ATMs indicate a statistically significant positive impact on sustainable development in all estimation methods. Specifically, increasing the number of ATMs by one percentage point leads to an increase in sustainable development by (0.2153**, 0.2207**, 0.2257** percentage points) in OLS estimation. The impact is also significant and relatively higher in OLS FE and LSDV estimations. Similarly, the coefficients of the mobile agent exhibit a statistically significant positive effect on sustainable development in all estimation methods. Increasing the mobile agent by one percentage point results in an increase in sustainable development by (0.1087**, 0.1067**, 0.1070** percentage points) in OLS estimation. The impact is also relatively higher in OLS FE and LSDV estimations.
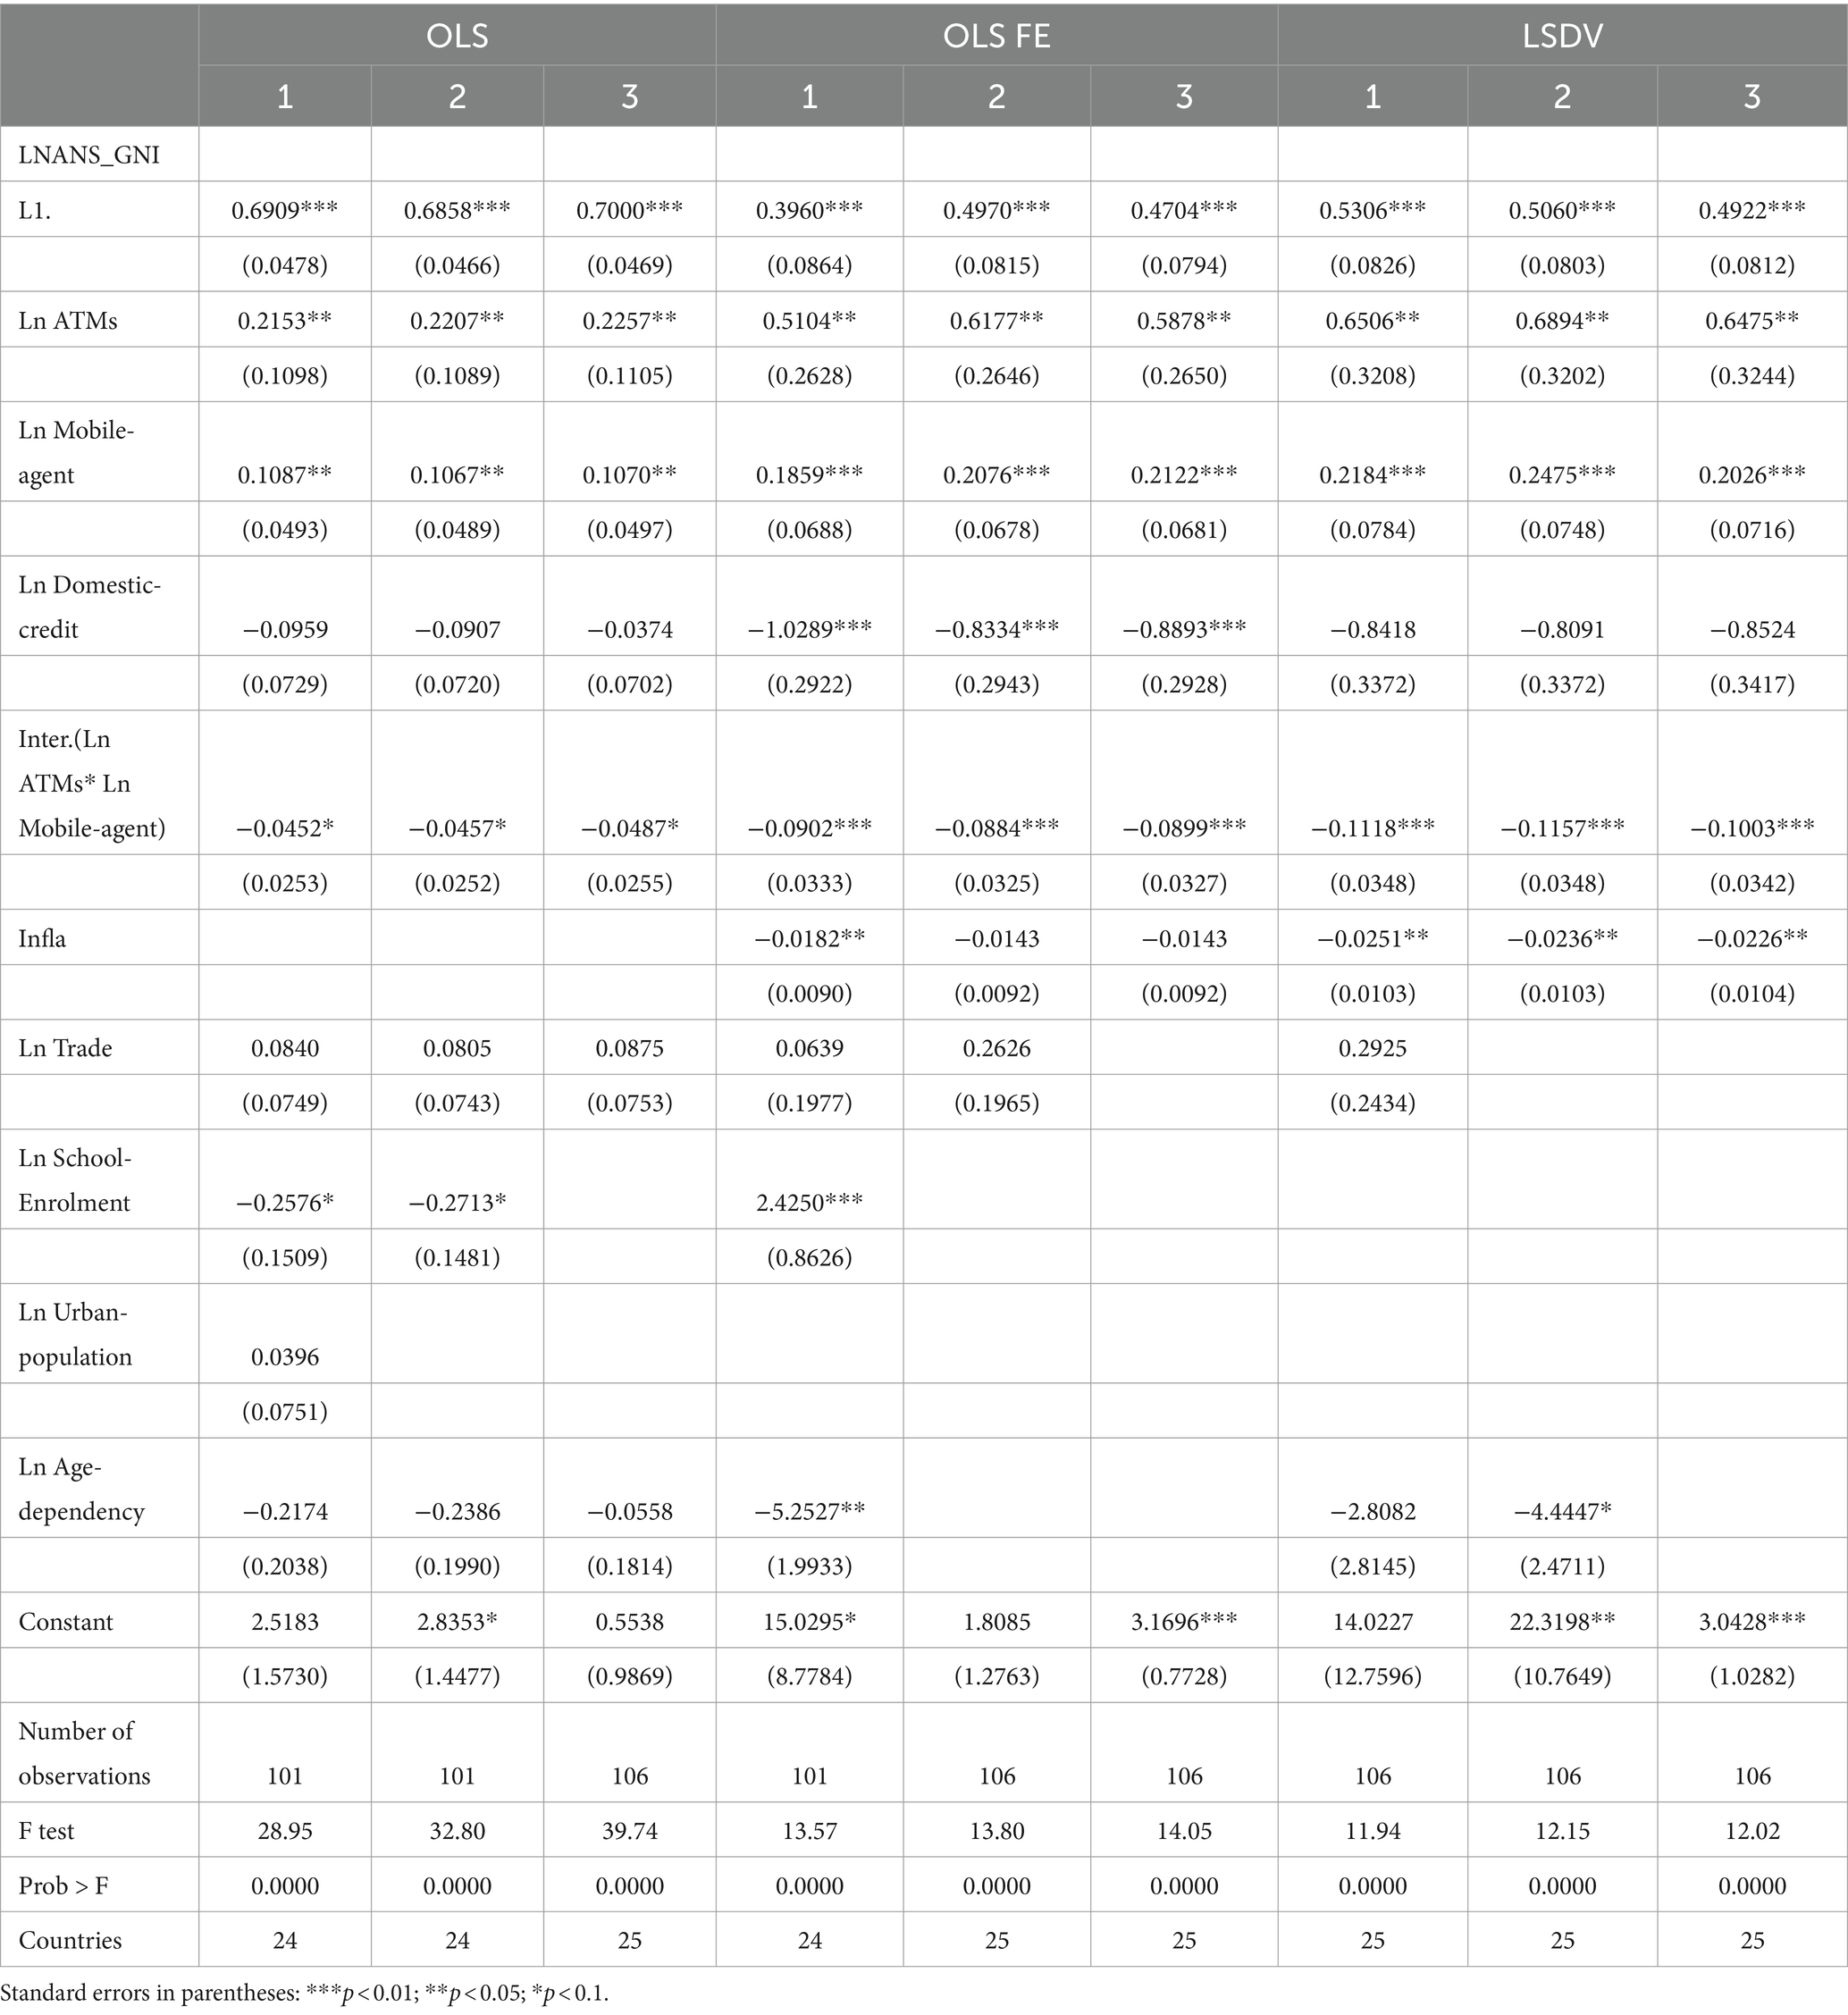
Table 9. Static panel estimates: OLS, OLS FE, LSDV (ANS as a percentage of GNI).
The results indicate that the coefficients of domestic credit have a statistically significant and substantial negative impact in the OLS FE estimation at a 1% level. This finding implies that higher levels of domestic credit may indeed hinder sustainable development. Also, the coefficients of the interaction term show statistically significant negative effects in all estimations, particularly in OLS FE and LSDV estimations at a 1% level. This means that an increase in the interaction term by one percentage point leads to a decrease in sustainable development by (−0.1118***, −0.1157***, −0.1003*** percentage points) in LSDV.
However, the coefficients of inflation show statistically significant negative effects in the LSDV estimation at a 5% level in all three specifications. There is also a statistically significant negative effect in Specification 1 of the OLS FE estimation, where an increase in inflation by one percentage point leads to a decrease in sustainable development by −0.0182 percentage points at a 5% level.
Along similar lines, the coefficients of school enrollment demonstrate a statistically significant negative impact in the OLS estimation at a 10% level. However, in specification 1 of the OLS FE estimation, they display a significant positive impact on sustainable development. Furthermore, the coefficients of age dependency show a statistically significant and substantial negative impact in specification 1 of the OLS FE estimation and specification 2 of the LSDV estimation. An increase in age dependency by one percentage point corresponds to a decrease in sustainable development by 5.2527 percentage points at a 5% level and 4.4447 percentage points at a 10% level, respectively.
For the remaining control variables, the coefficients of trade and urban population show non-significant positive effects in the analysis. Nevertheless, the intercept coefficients demonstrate a statistically significant positive impact in most of specifications. Finally, the F-test confirms the statistical significance of the coefficient results, providing evidence for the reliability of the static panel estimates.
To sum up, the results of the static panel estimation specifications demonstrate relative stability, regarding both significance and direction, versus the results of the dynamic panel SGMM. It is noteworthy that the OLS estimation specifications show higher stability in terms of coefficients compared to OLS FE and LSDV, which are biased and inconsistent. This might be attributed to the small T, as mentioned by Habimana (175). However, the analysis and interpretation are always based on the SGMM estimates.
In conclusion, based on the conditional convergence hypothesis derived from the literature on economic growth (104) and drawing upon World Bank (3) reports, it was expected that the coefficients of the sustainable development variables (GS_GNI (L1), ANS_GNI (L1)) would have negative values across all estimations. Nevertheless, the results consistently show statistically significant positive coefficients (at a 1% significance level). These findings suggest a lack of conditional convergence within the study sample, indicating that lower-income per capita countries do not achieve higher and faster levels of sustainable development than to higher-income per capita countries in the African region.
As is typical in empirical literature, we estimate the marginal effects to assess the impact of the interaction term on sustainable development. Table 10 reports the marginal effects of mobile agents and ATMs on ANS_GNI and GS_GNI, estimated using the SGMM method, at different levels (median, minimum, maximum) of ATMs and mobile agents. These effects provide insights into the direction and significance of the relationships. In terms of the dependent variable GS_GNI, the marginal effects of Mobile agents at the minimum level of ATMs (at Ln ATMs = −0.07449) have a significant positive effect on sustainable development in all specifications, particularly in specification 04 (**0.0914). Similarly, the marginal effects of Mobile agents at the median level of ATMs (at Ln ATMs = 1.7250) have a significant positive effect on sustainable development in specifications 1, 2, and 3. On the other hand, the marginal effects of ATMs at the minimum level of Mobile agents (at Ln Mobile-agent = 1.4101) are significant and positive in all specifications, especially in specification 02 (**0.0928). This means that a one percentage point increase in ATMs at the minimum level of Mobile agents leads to a 0.0928 percentage points increase in sustainable development at a 5% significance level.
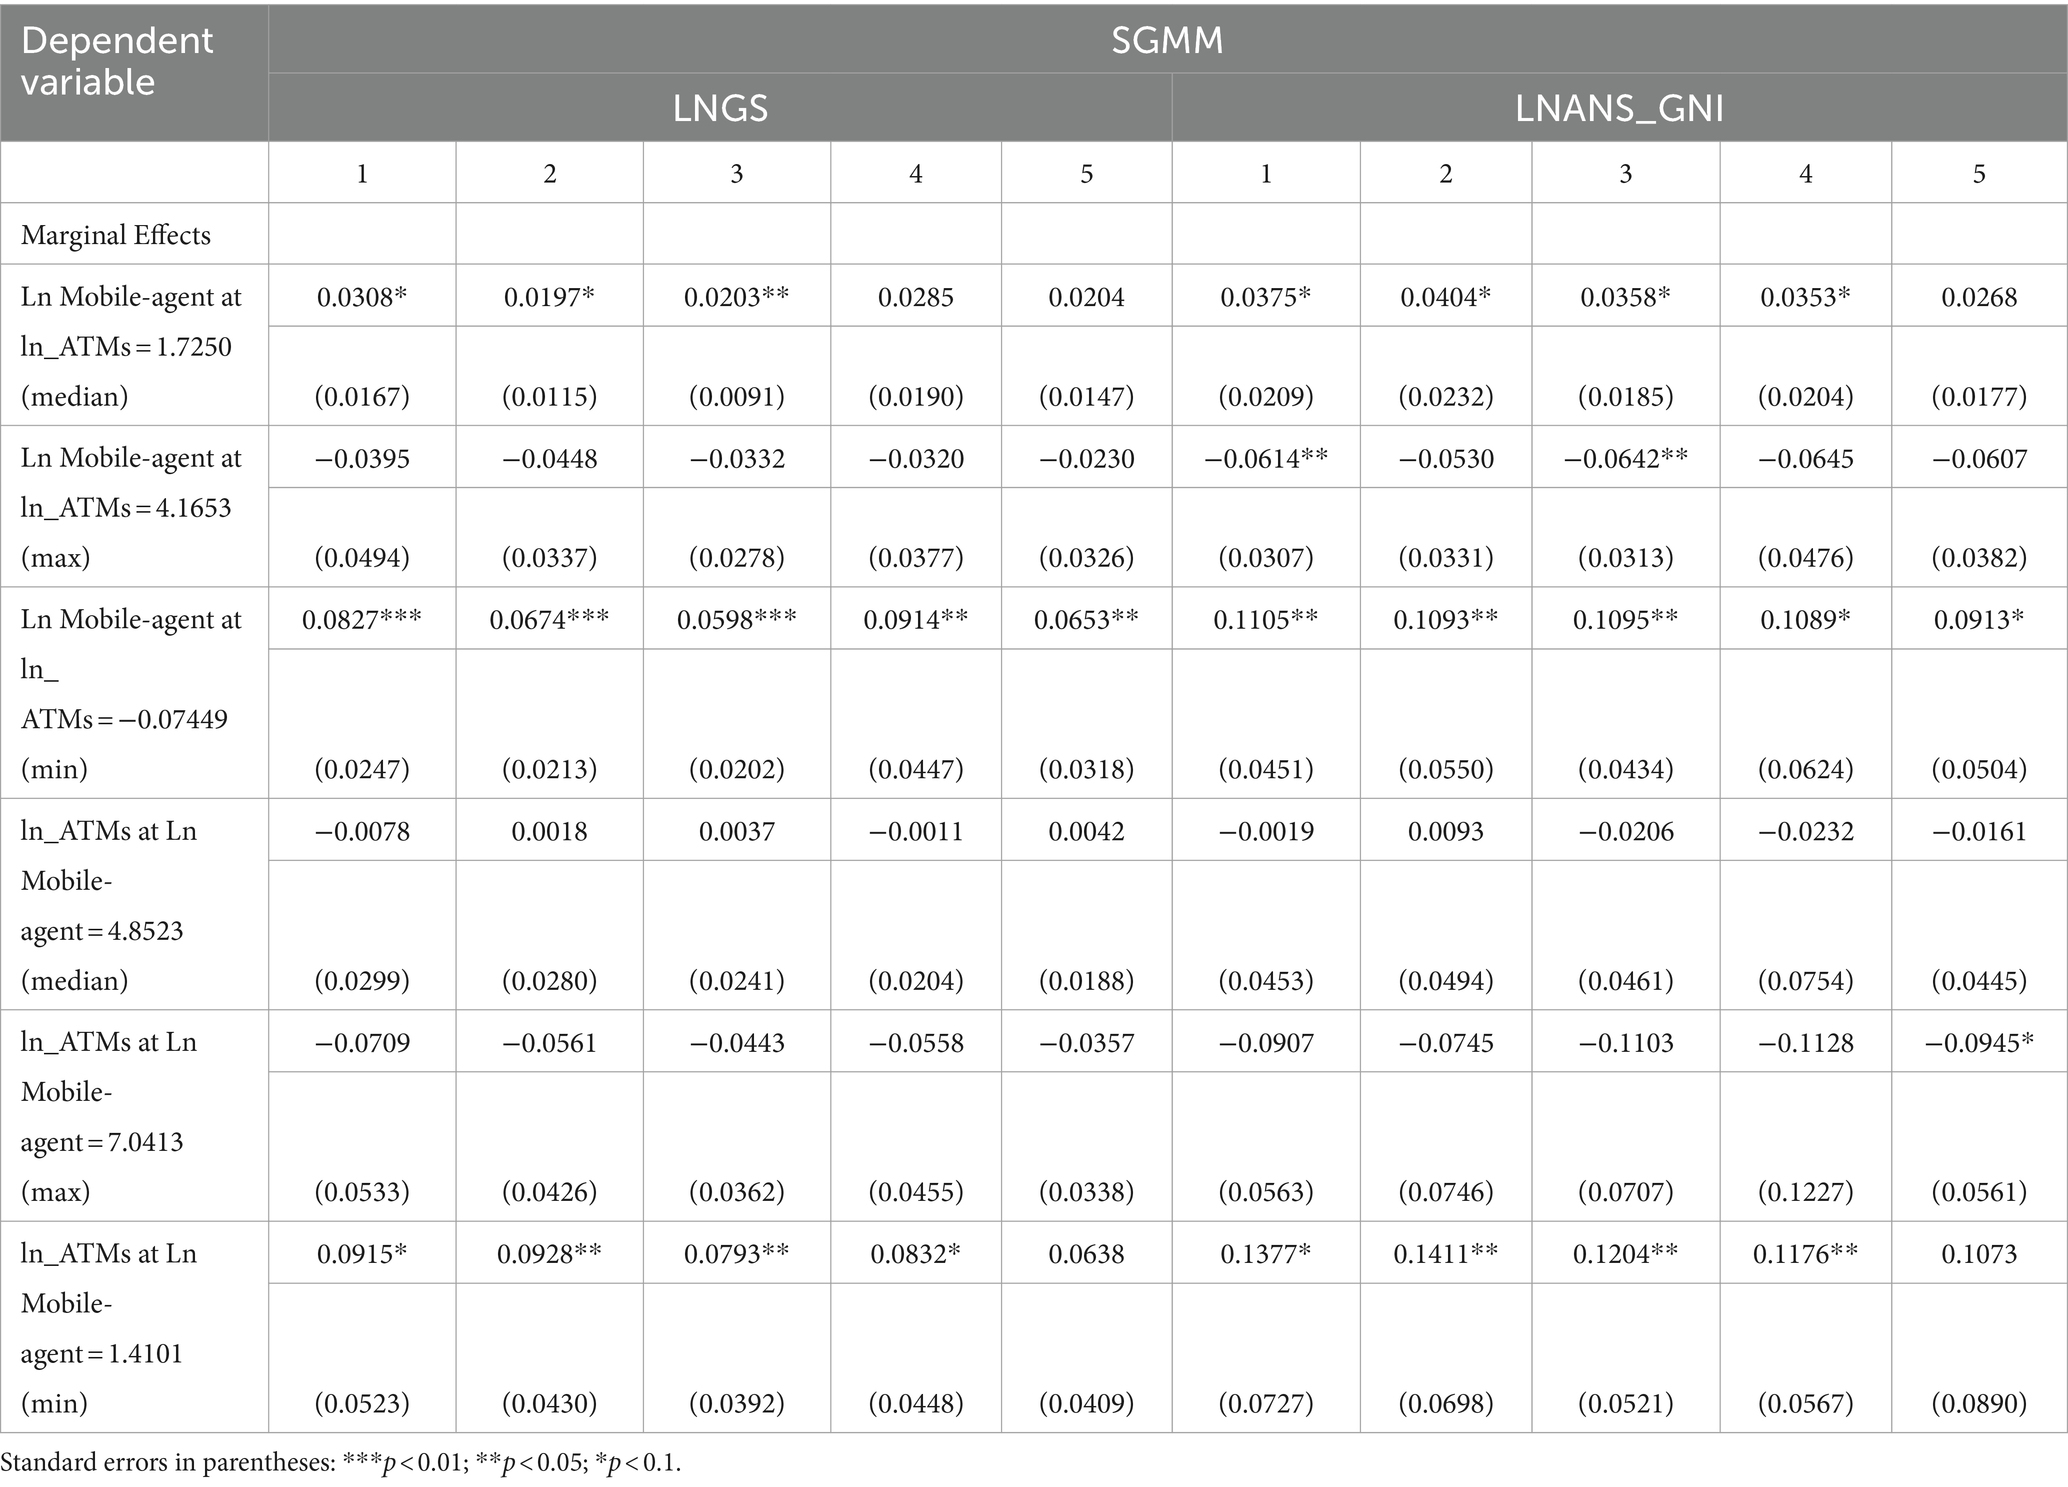
Table 10. Marginal effects using SGMM (GS and ANS).
It should be noted that when ATMs reach the maximum level (at Ln ATMs = 4.1653), an increase in Mobile agents has a non-significant negative effect on Ln GS_GNI in all specifications. Likewise, when Mobile agents reach the maximum level (at Ln Mobile-agent = 7.0413), an increase in ATMs has a non-significant negative effect on Ln GS_GNI in all specifications. Figure 5 illustrates the marginal effects of Mobile agents at the lowest levels (for each country) of ATMs using SGMM estimation, showing a negative impact on sustainable development. It also displays the marginal effects of ATMs at the lowest levels (for each country) of Mobile agents, indicating a negative effect on sustainable development. This figure is consistent with the estimation results presented in Table 4 concerning the interaction term.
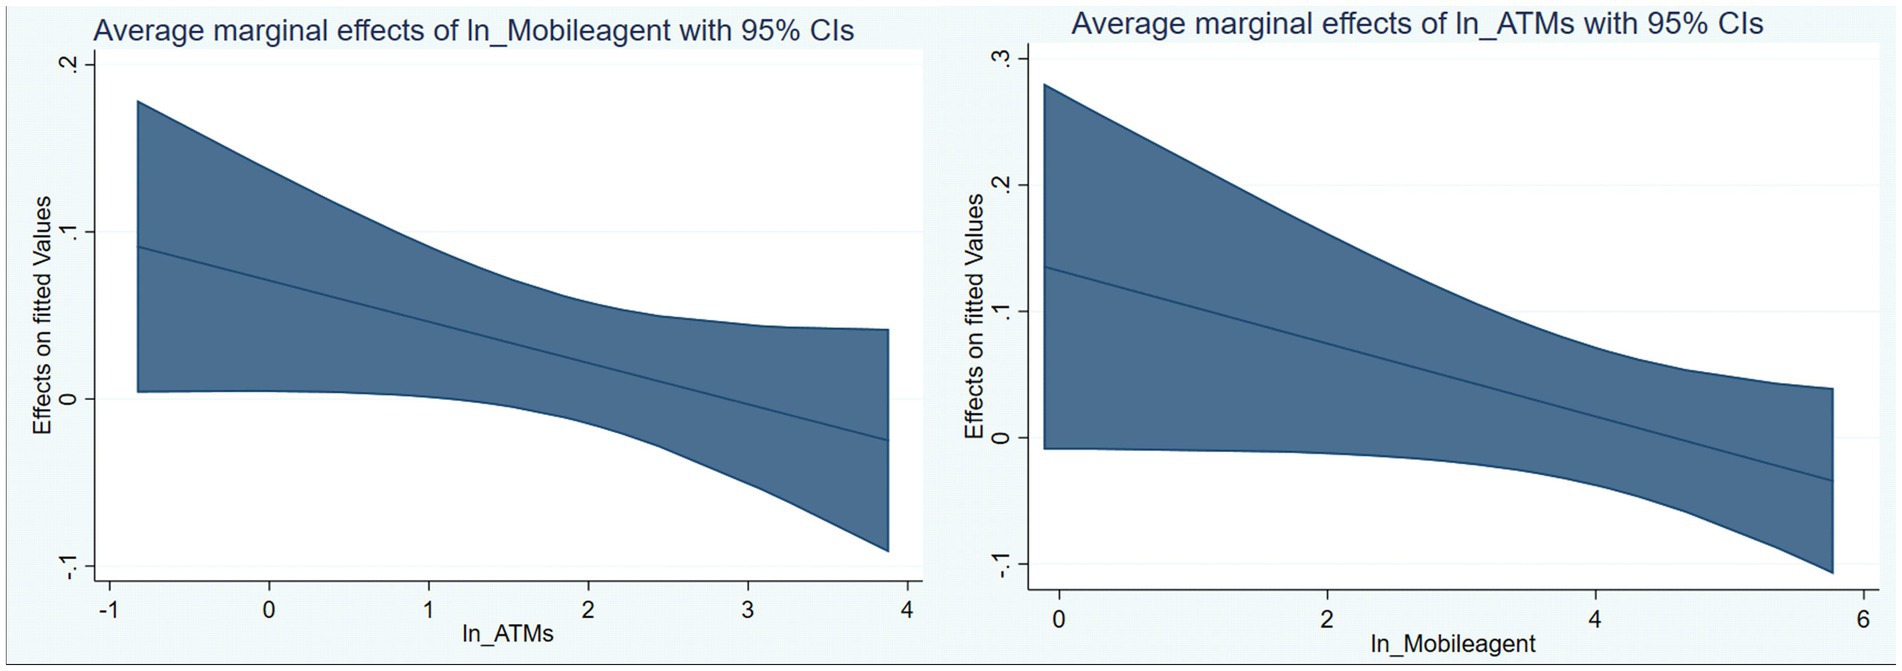
Figure 5. Marginal effects of ATMs at Min. of Mobile-agent/Mobile-agent at Min. of ATMs.
Concerning the dependent variable ANS_GNI, the marginal effects of Mobile agents at the minimum level of ATMs reveal a significant positive impact in all specifications, particularly in specification 01 (**0.1105). This indicates that an increase in the number of Mobile agents at the minimum level of ATMs by one percentage point leads to a 0.1105 percentage points increase in sustainable development at a 5% significance level. Similarly, there is a significant positive effect of Mobile agents at the median level of ATMs in specifications 1, 2, 3 and 4. On the other hand, the marginal effects of ATMs at the minimum level of Mobile agents are significant and positive impact across all specifications, with specification 02 showing a particular coefficient of (**0.1411). This means that increasing the number of ATMs at the minimum level of Mobile agents by one percentage point leads to a 0.1411 percentage points increase in sustainable development. Figure 6 presents the marginal effects of Mobile agents at the lowest levels (for each country) of ATMs using SGMM estimation. It also illustrates the marginal effects of ATMs at the lowest levels (for each country) of Mobile agents. Both marginal effects demonstrate a negative impact on sustainable development, which aligns with the estimation results presented in Table 6 for the interaction term.
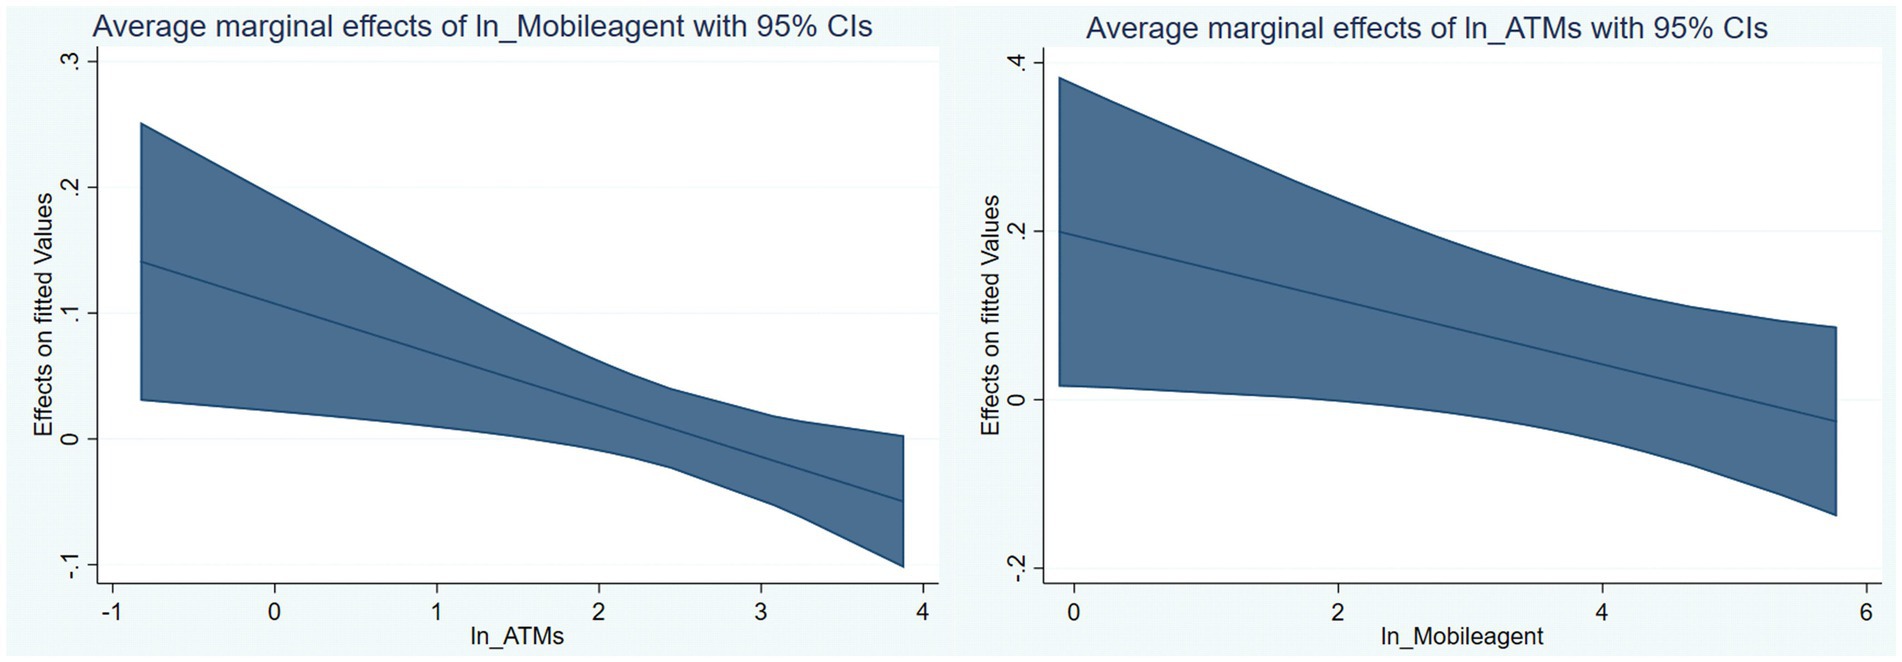
Figure 6. Marginal effects of Mobile-agent at Min of ATMs/ATMs at Min. of Mobile-agent.
The current section presents the discussion of the empirical results related to SGMM two-step. These findings confirm the role of ATMs in improving access to financial services and promoting sustainable development. ATMs undoubtedly provide companies and households with an easy and convenient method to access cash and conduct financial transactions at a lower cost. According to Sahay et al. (182), financial inclusion can serve multiple macroeconomic goals, but there are trade-offs with financial stability that need to be considered. Overall, these findings are consistent with prior researches. Hussain et al. (35) found a strong and positive relationship between financial inclusion and sustainable economic growth in developing countries, supporting the notion that enhanced access to financial services can contribute to broader economic development. Ifediora et al. (104) observed a positive impact of financial inclusion on economic growth across various indicators in sub-Saharan Africa. Chinoda and Mashamba (82) concluded that financial inclusion plays a crucial role in reducing income inequality in Africa. Furthermore, the findings of Li and Wu (108), Daud et al. (100), Ahmad et al. (109), Younas et al. (110), Ozili (87), Gautam et al. (183), Bkwayep and Tsafack (111), and Emara and Mohieldin (112) also align with our results.
The coefficients of mobile agents demonstrate a positive and significant impact on sustainable development, indicating that increasing the utilization of FinTech has the potential to enhance sustainable development levels in the region. These findings are consistent with the results of Hodula (116), who found that increased FinTech and significant technology credit are indeed associated with a reduction in income inequality. Our findings align with the results of Nenavath and Mishra (114), who concluding that green finance has a positive impact on economic growth through its influence on financing structures, financial efficiency, and environmental quality preservation. They also correspond with the findings of Yeyouomo et al. (103), which indicated that FinTech companies contribute to reducing the gender gap in financial inclusion in Sub-Saharan African countries, enabling easier access to and utilization of financial services. Their findings have important implications for economic policy emphasize the potential of FinTech to promote sustainable development. Mertzanis (184) claims that FinTech has a small but statistically significant positive impact on social-environmental performance in 58 countries during the period of 2013–2019. Furthermore, our results are consistent with the conclusions of Awais et al. (22, 116) and Haddad and Hornuf (117). Other than that, Lisha et al. (185) found, when exploring the nexus between sustainability, green innovations, FinTech, financial development, and natural resources for BRICS economies during 2000–2019, using the Method of Moments Quantile Regression (MMQR), that both FinTech and natural resources have a negative impact on environmental sustainability across all three quantile ranges (0.10th-0.30th, 0.40th-0.60, and 0.70th-0.90th).
However, interactions between ATMs and mobile agent coefficients revel a weak negative and statistically significant impact on sustainable development. This suggests that the joint use of ATMs and mobile agent services hinders sustainable development in the African region, indicating the possibility of redundancy in the provided financial services. In this regard, Telukdarie et al. (104) have highlighted digital FinTech as a potential solution for accelerating financial inclusion in developing markets. The application of digital technology, including artificial intelligence, serves as a powerful tool to facilitate individuals in emerging markets in accessing financial institutions and their services. Arner et al. (2020) argue that FinTech plays a crucial role as the key driver for financial inclusion, which, in turn, underlies sustainable and balanced development, as reflected in the UNSDGs. Their study has analyzed the full potential of FinTech to support the SDGs may be realized with a progressive approach to the development of underlying infrastructure to support digital financial transformation.
Regarding the control variables, the coefficients of domestic credit show a statistically significant negative effect on sustainable development across all specifications. This is consistent with the findings of Gök (139), who found that financial development leads to environmental degradation through increased carbon emissions (CO2). Additionally, Singh et al. (186) investigated the impact of financial development on economic growth in India, a major emerging economy, using a Non-linear Autoregressive Distributed Lag (ARDL). The findings showed a consistently negative impact of financial development and foreign inflows on economic growth in the long and short runs. Meanwhile, our outcomes align with the findings of Makina and Walle (124). Conversely, Hunjra et al. (128) investigated the impact of financial development on sustainable economic development (SED) in low- and middle-income countries over the period 1991–2020. The study findings through Fixed Effects (FE), the Feasible Generalized Least Squares (FGLS), and the Bootstrap Panel Quantile showed that sustainable economic development is positively affected by financial development.
In terms of inflation, school enrollment, and age dependency, their coefficients demonstrate significant negative impact on sustainable development in certain specifications. On the other hand, coefficients associated with urban population and trade display non-significant positive effect on sustainable development, which is consistent with the results reported by Hussain et al. (35).
Finally, the marginal effects analysis indicates that the positive impact on sustainable development only occurs when either mobile agents or ATMs are at their minimum level, highlighting the recurrence of financial services in the African region. To address this issue, it is imperative to enhance cooperation and coordination among financial service providers. The scarcity of studies examining the interaction between financial inclusion, financial technology, and their impact on sustainable development in developing countries, including the African region, underscores the significance of our contribution. Our research provides valuable insights to policymakers, enabling them to enhance financial inclusion and financial technology and understand their combined effects on sustainable development. By developing a robust strategy based on these insights, the region can effectively improve sustainable development opportunities.
The study examines the relationship between financial technology, financial inclusion, and sustainable development in the African region, with a specific focus on 25 countries from 2011 to 2019. It employs various econometric methods, including dynamic panel (SGMM two-step ) and static panel (OLS, OLS FE, LSDV), and estimates marginal effects. The research is motivated by the limited availability of comprehensive and focused studies in this area, especially in Africa.
To ensure more precise findings compared to previous literature, we carefully selected the most pertinent indicators of sustainable development, namely the Gross Saving rate and Adjusted Net Savings. Our choices were informed by the research works of Hunjra et al. (128), Güney (10), World Bank (3); Dietz et al. (24), and the World Bank (9).
In this regard, our study has yielded significant findings, particularly regarding the SGMM estimates. The results indicate a positive and statistically significant impact of financial inclusion and financial technology on sustainable development. However, the interaction between financial inclusion and FinTech shows a weak negative and significant effect. Moreover, we noticed a negative and significant impact of domestic credit coefficients, school enrollment, and age dependency on sustainable development. On the other hand, other control variables such as inflation, urban population, and trade presented mixed effects, both positive and negative, significant and non-significant, on sustainable development. Additionally, the marginal effects analysis reveals an important detail: the positive impact is observed only when one of the interaction variables is at its minimum level, highlighting the redundancy of financial services in the African region. These findings provide valuable insights into the relationships and trends at play and inform the necessary actions to enhance financial inclusion and promote the use of financial technology, thereby ensuring sustainable economic development.
Based on the empirical findings and the outcomes of some relevant key studies [(28, 34, 35, 51, 82, 100, 103, 104, 109, 187–189)], several policy implications have been provided that could benefit the governments, policymakers, and related stakeholders in the African region for promoting sustainable development. The details are as follows:
1. Expand financial infrastructure: Policymakers are encouraged to prioritize efforts to expand financial infrastructure by extending the reach of financial institutions and banks, with a specific focus on enhancing their presence in rural and remote areas to serve financially marginalized individuals. Additionally, improving access to banking services and promoting financial literacy programs are essential. These measures can create an enabling environment for sustainable economic growth, poverty reduction, and improved living standards.
2. Enhance financial technology: Policymakers are encouraged to prioritize enhancing and expanding access to financial technology. This can be achieved through the following measures: (a) providing the necessary technological infrastructure and promoting its adoption to facilitate the spread of financial technology; (b) developing financial education by enhancing financial literacy, awareness, and education for individuals and communities in the African region; (c) fostering cooperation and partnerships between governments, financial institutions, and technology service providers in the field of financial technology; (d) encouraging regulation and oversight to ensure the safety and security of financial transactions. Additionally, it is important to promote research and innovation in the field of financial technology in Africa by supporting research initiatives and creating more opportunities for startups and innovators in this area.
3. Foster collaboration: Efforts should be made to bolster collaboration between traditional financial institutions and emerging financial service providers to enhance the synergy between financial inclusion and financial technology. This collaborative endeavor aims to reduce service redundancy and maximize their positive contributions to the sustainable development of the region.
4. Monitor domestic credit activities: Policymakers and Government authorities need to actively supervise and monitor domestic credit activities to ensure their beneficial impact in line with the SDGs. It is vital to employ responsible borrowing practices and sustainable approaches to prevent adverse economic imbalances. Furthermore, it is important to channel credit toward sustainable sectors that promote environmental and social well-being. This can be accomplished by incentivizing financial institutions to fund projects that are environmentally and socially sustainable, thereby enhancing their long-term viability.
5. Strengthen legislation and regulation: Strong legislation and regulation must be in place to protect the rights of financial consumers and ensure transparency and accountability in the financial services sector by harnessing mechanisms to address financial fraud.
6. Strengthening African cooperation: Encouraging stronger cooperation among African countries is crucial to facilitate the exchange of experiences and knowledge in the field of financial technology and promote financial inclusion. This can be accomplished by establishing forums and platforms that facilitate dialog and collaborative efforts.
The findings of this study offer valuable insights, but it’s essential to acknowledge its limitations and identify areas for further research. Future investigations could benefit from broadening the scope to include more countries and extending the study period for a more comprehensive perspective. One potential avenue for future research involves constructing a composite “index” for financial inclusion and financial technology, offering an alternative to the traditional method of single selection. This approach aims to encompass all dimensions within an index. Furthermore, enhancing the comprehensiveness of the analysis could be achieved by incorporating additional control variables, especially institutional factors. Adopting alternative methodologies such as quantile-on-quantile regression and Fourier ARDL may provide a deeper understanding and robustness to the findings. However, it’s crucial for future research to prioritize analyzing the role of financial inclusion and the adoption of financial technology in promoting investment and production activities within the context of environmental sustainability.
The original contributions presented in the study are included in the article/supplementary materials, further inquiries can be directed to the corresponding author.
CT: Conceptualization, Data curation, Project administration, Supervision, Validation, Writing – original draft, Writing – review & editing, Resources. AM: Formal analysis, Investigation, Methodology, Software, Validation, Visualization, Writing – review & editing.
The author(s) declare that no financial support was received for the research, authorship, and/or publication of this article.
The authors declare that the research was conducted in the absence of any commercial or financial relationships that could be construed as a potential conflict of interest.
All claims expressed in this article are solely those of the authors and do not necessarily represent those of their affiliated organizations, or those of the publisher, the editors and the reviewers. Any product that may be evaluated in this article, or claim that may be made by its manufacturer, is not guaranteed or endorsed by the publisher.
1. Aidt, T. Corruption and sustainable development In: S Rose-Ackerman and T Søreide, editors. International handbook on the economics of corruption, vol. 2. Cheltenham, UK: Edward Elgar Publishing (2011)
2. Ferreira, S, Hamilton, K, and Vincent, JR. Comprehensive wealth and future consumption: accounting for population growth. World Bank Econ Rev. (2008) 22:233–48. doi: 10.1093/wber/lhn008
3. World Bank. The changing wealth of nations: Measuring sustainable development in the new millennium. Washington, DC: World Bank (2011).
4. Bolt, K, Hamilton, KE, Lange, GM, Markandya, A, Ordoubadi, MS, Pedroso-Galinato, S, et al. (2010). Where is the wealth of nations: measuring capital for the 21st century: Donde esta la riqueza de las naciones: medir el capital para el siglo XXI (Spanish). Disclosure.
5. Ekins, P, Hillman, M, and Hutchison, R. Wealth beyond measure: an atlas of new economics. Environ Values. (1992) 1:1.
6. Hamilton, K, and Atkinson, G. Wealth, welfare and sustainability: Advances in measuring sustainable development. Cheltenham, UK: Edward Elgar (2006).
7. Khan, J. Towards Wealth Accounting-Natural Capital within Comprehensive Wealth. Office for National Statistics, UK. Available at: http://www.ons.gov.uk/ons/guide-method/user-guidance/wellbeing/publications/index.html (Accessed February 16, 2015). (2013).
9. World Bank. Where is the wealth of nations? Measuring capital for the 21st century. Washington, DC: World Bank (2005).
10. Güney, T. Governance and sustainable development: how effective is governance? J Int Trade Econ Dev. (2017) 26:316–35. doi: 10.1080/09638199.2016.1249391
11. World Commission on Environment and Development. Our common future. Oxford, UK: Oxford University Press (1987).
12. Ferreira, S, and Vincent, JR. Genuine savings: leading Indicator of sustainable development? Econ Dev Cult Chang. (2005) 53:737–54.
13. Gnègnè, Y. Adjusted net saving and welfare change. Ecol Econ. (2009) 68:1127–39. doi: 10.1016/j.ecolecon.2008.08.002
14. Labat, J, and Willebald, H. Do we need just one sustainable development indicator? Could genuine savings be that one? Int J Environ Sci Nat Resources. (2019) 16:78–80. doi: 10.19080/IJESNR.2019.16.555938
15. Sato, M, Samreth, S, and Yamada, K. A numerical study on assessing sustainable development with future genuine savings simulation. Int J Sustain Dev. (2012) 15:293–312. doi: 10.1504/IJSD.2012.050029
16. Atkinson, G, and Hamilton, K. Progress along the path: evolving issues in the measurement of genuine saving. Environ Resour Econ. (2007) 37:43–61. doi: 10.1007/s10640-007-9114-7
17. Dietz, S, and Neumayer, E. Genuine savings: a critical analysis of its policy-guiding value. Int J Environ Sustain Dev. (2004) 3:276–92. doi: 10.1504/IJESD.2004.005076
18. Tokimatsu, K, Yamguchi, R, Sato, M, Yasuoka, R, Nishio, M, and Ueta, K. Assessing future sustainability by forecast of genuine savings paths. Environ Econ Policy Stud. (2014) 16:359–79. doi: 10.1007/s10018-013-0056-8
19. Ribaj, A, and Mexhuani, F. The impact of savings on economic growth in a developing country (the case of Kosovo). J Innov Entrep. (2021) 10:1–13. doi: 10.1186/s13731-020-00140-6
20. Hanley, N, Dupuy, L, and McLaughlin, E. Oil, gas and minerals: The impact of resource-dependence and governance on sustainable development. Working Paper n°8. Centre on Conflict, Development and Peacebuilding (CCDP). Available at: https://repository.graduateinstitute.ch/record/12367/files/CCDP_WP8.pdf
21. Hamilton, K, and Clemens, M. Genuine savings rates in developing countries. World Bank Econ Rev. (1999) 13:333–56. doi: 10.1093/wber/13.2.333
22. Awais, M, Afzal, A, Firdousi, S, and Hasnaoui, A. Is fintech the new path to sustainable resource utilisation and economic development? Resources Policy. (2023) 81:103309. doi: 10.1016/j.resourpol.2023.103309
23. Davies, GR. Appraising weak and strong sustainability: searching for a middle ground. Consilience. (2013) 10:111–24.
24. Dietz, S, Neumayer, E, and De Soysa, I. Corruption, the resource curse and genuine saving. Environ Dev Econ. (2007) 12:33–53. doi: 10.1017/S1355770X06003378
25. Neumayer, E. Weak versus strong sustainability: Exploring the limits of two opposing paradigms. 2nd ed. Northampton, MA: Edward Elgar (2003).
26. Thiry, G, and Cassiers, I. Alternative Indicators to GDP: Values behind Numbers Adjusted Net Savings in Question (No. UCL-Université Catholique de Louvain). UCL. (2010).
27. Chitimira, H, and Warikandwa, TV. Financial inclusion as an enabler of United Nations sustainable development goals in the twenty-first century: an introduction In: H Chitimira and TV Warikandwa, editors. Financial inclusion and digital transformation regulatory practices in selected SADC countries: South Africa, Namibia, Botswana and Zimbabwe. Cham: Springer International Publishing (2023). 1–22.
28. Hussain, S, Gul, R, Ullah, S, Waheed, A, and Naeem, M. Empirical nexus between financial inclusion and carbon emissions: evidence from heterogeneous financial economies and regions. Heliyon. (2023a) 9:e13164. doi: 10.1016/j.heliyon.2023.e13164
29. Suhrab, M, Chen, P, and Ullah, A. Digital financial inclusion and income inequality nexus: can technology innovation and infrastructure development help in achieving sustainable development goals? Technol Soc. (2024) 76:102411. doi: 10.1016/j.techsoc.2023.102411
30. Beck, T. Fintech and financial inclusion: Opportunities and pitfalls (No. 1165). ADBI working paper series. (2020).
31. Hoang, TG, Nguyen, GNT, and Le, DA. Developments in Financial Technologies for Achieving the sustainable development goals (SDGs): fintech and SDGs In: U Akkucuk, editor. Disruptive technologies and eco-innovation for sustainable development. Hershey, PA: IGI Global (2022). 1–19.
32. Adedokun, M. W., and Ağa, M. Financial inclusion: A pathway to economic growth in Sub‐Saharan African economies. Int J Fin Eco. (2023) 28:2712–2728. doi: 10.1002/ijfe.2559
33. Ahmad, NW, Bahari, N, and Ripain, N. Covid-19 outbreak: the influence on digital finance and financial inclusion. In International Conference On Syariah and Law, pp. 160–166. (2021).
34. Allmen, UEV, Khera, P, Ogawa, S, and Sahay, R. Digital financial inclusion in the times of COVID-19. IMF Blog. (2020).
35. Hussain, S, Gul, R, and Ullah, S. Role of financial inclusion and ICT for sustainable economic development in developing countries. Technol Forecast Soc Chang. (2023b) 194:122725. doi: 10.1016/j.techfore.2023.122725
36. Zhao, B, and Yang, Y. Does financial development influence CO2 emissions? A Chinese province-level study. Energy. (2020) 200:117523. doi: 10.1016/j.energy.2020.117523
37. Liu, K, Mahmoud, HA, Liu, L, Halteh, K, Arnone, G, Shukurullaevich, NK, et al. Exploring the nexus between fintech, natural resources, urbanization, and environment sustainability in China: a QARDL study. Resources Policy. (2024) 89:104557. doi: 10.1016/j.resourpol.2023.104557
38. Tidjani, C. COVID-19 and challenges of the Fintech industry: A state of the art and outlooks on the North African region. Abaad Iktissadia Rev. (2021) 11:696–721. Available at: https://www.asjp.cerist.dz/en/downArticle/279/11/2/173438
39. World Bank. Fintech: The Experience so Far - Executive Summary (English). Washington, DC. (2019). Available at: http://documents.worldbank.org/curated/en/130201561082549144/Fintech-The-Experience-so-Far-Executive-Summary
40. Hussain, M, Ye, C, Ye, C, and Wang, Y. Impact of financial inclusion and infrastructure on ecological footprint in OECD economies. Environ Sci Pollut Res. (2022) 29:21891–21898. doi: 10.1007/s11356-021-17429-y
41. Mhlanga, D. The role of financial inclusion and FinTech in addressing climate-related challenges in the industry 4.0: Lessons for sustainable development goals. Frontiers in Climate. (2022) 4:949178. doi: 10.3389/fclim.2022.949178
42. Zaidi, SAH, Hussain, M, and Zaman, QU. Dynamic linkages between financial inclusion and carbon emissions: evidence from selected OECD countries. Resour Environ Sustainabil. (2021) 4:100022. doi: 10.1016/j.resenv.2021.100022
43. Wan, S, Lee, YH, and Sarma, VJ. Is Fintech good for green finance? Empirical evidence from listed banks in China. Econ Anal Policy. (2023) 80:1273–91. doi: 10.1016/j.eap.2023.10.019
44. Zhang, Y, Zheng, K, Xia, F, and Cheng, Z. Fintech, natural resource rents, renewable energy consumption and environmental quality: a perspective of green economic recovery from BRICS economies. Resources Policy. (2024) 89:104604. doi: 10.1016/j.resourpol.2023.104604
45. Yin, Y, and Liu, H. Fin-tech indicators, mineral resources, and green productivity: role of human development and globalization in BRICS region. Resources Policy. (2024) 89:104463. doi: 10.1016/j.resourpol.2023.104463
46. Hoang, TG, Nguyen, GNT, and Le, DA. Developments in financial technologies for achieving the sustainable development goals (SDGs): FinTech and SDGs. In Disruptive technologies and eco-innovation for sustainable development. IGI Global. (2022) 29:1–19.
47. Mpofu, FY. Industry 4.0 in financial services: mobile money taxes, revenue mobilisation, financial inclusion, and the realisation of sustainable development goals (sdgs) in africa. Sustainability. (2022) 14:8667. doi: 10.3390/su14148667
48. Ogunode, OA, and Akintoye, RI. Financial technologies and financial inclusion in emerging economies: perspectives from nigeria. Asian Journal of Economics, Business and Accounting. (2023) 23:38–54. doi: 10.9734/AJEBA/2023/v23i1915
49. Perdana, A, and Kulkarni, MS. Exploring the synergy between financial technologies and financial inclusion: what we know and where we should be heading?. Pacific Asia Journal of the Association for Information Systems. (2023) 15:4. doi: 10.17705/1pais.15104
50. Pauliukevičienė, G, and Stankevičienė, J. Assessment of the impact of sustainable development goals indicators on the sustainable development of FinTech Industry. Business and management. (2022) 290–298. doi: 10.3846/bm.2022.759
51. Arner, D. W., Buckley, R. P., Zetzsche, D. A., and Veidt, R. (2020). Sustainability, FinTech and financial inclusion. European Business Organization Law Review, 21, 7–35.
52. Zetzsche, D. A., Buckley, R. P., and Arner, D. W. (2019). FinTech for financial inclusion: driving sustainable growth. Sustainable Development Goals: Harnessing Business to Achieve the SDGs through Finance, Technology, and Law Reform, 177-203. doi: 10.1002/9781119541851.ch10
53. Hanley, N, Dupuy, L, and McLaughlin, E. Genuine savings and sustainability. J Econ Surv. (2015) 29:779–806. doi: 10.1111/joes.12120
54. Pillarisetti, JR, and Van den Bergh, JCJ. Sustainable Nations: What do Aggregate Indicators tell us? Tinbergen Institute Discussion Paper, No.08–012/3, Tinbergen Institute, Amsterdam and Rotterdam. (2008).
55. Van der Ploeg, F. (2010). Why do many resource-rich countries have negative genuine saving?: Anticipation of better times or rapacious rent seeking. Resource and Energy Economics, 32, 28–44. doi: 10.1016/j.reseneeco.2009.07.002
56. Okui, G, and Takeda, S. Revisiting the measure of development: a critique of sustainametrics. Front Sustain. (2022) 3:943202. doi: 10.3389/frsus.2022.943202
57. Everett, G, and Wilks, A. The World Bank’s genuine savings indicator: A useful measure of sustainability. London, UK: Bretton Woods Project, 1–10. (1999).
58. Curran, J. (2017). Getting the measure of sustainable economic growth. The Ecologist,Available at: https://theecologist.org/2017/jan/30/getting-measure-sustainable-economic-growth
59. Doyle, E, and Perez-Alaniz, M. From the concept to the measurement of sustainable competitiveness: social and environmental aspects. Entrep Bus Econ Rev. (2017) 5:35–59. doi: 10.15678/EBER.2017.050402
60. Atkinson, G, Dubourg, R, Hamilton, K, Munasinghe, M, Pearce, D, and Young, C. Measuring sustainable development: Macroeconomics and the environment. Cheltenham, UK: Edward Elgar Publishing Ltd. (1997).
61. Gripenberg, S. Measuring Sustainable Development Goals: A Social-Ecological Perspective (Dissertation). (2017). Available at: http://urn.kb.se/resolve?urn=urn:nbn:se:su:diva-145387.
62. Lamichhane, S, Eğilmez, G, Gedik, R, Bhutta, MKS, and Erenay, B. Benchmarking OECD countries’ sustainable development performance: a goal-specific principal component analysis approach. J Clean Prod. (2021) 287:125040. doi: 10.1016/j.jclepro.2020.125040
63. Singh, RK, Murty, HR, Gupta, SK, and Dikshit, AK. An overview of sustainability assessment methodologies. Ecol Indic. (2012) 15:281–99. doi: 10.1016/j.ecolind.2011.01.007
64. Mirghaderi, SH, and Mohit-Ghiri, Z. Measuring sustainable development: linear regression approach. Int J Sustain Dev. (2019) 22:110. doi: 10.1504/IJSD.2019.104736
65. ESCWA. Gross saving. Dictionary of national accounts. ESCWA dictionary of national accounts. (2017). Available at: https://archive.unescwa.org/sd-glossary/gross-saving (Accessed May 21, 2023).
66. Eurostat. Gross saving. European Commission. (2023). Original work published 2023. Available at: http://data.europa.eu/88u/dataset/xhsponjk7zsqhipjnn21q.
67. World Bank. Metadata Glossary. (2023). Available at: https://databank.worldbank.org/metadataglossary/adjusted-net-savings/series/NY.ADJ.ICTR.GN.ZS.
68. Atkinson, G, and Hamilton, K. Savings, growth and the resource curse hypothesis. World Dev. (2003) 31:1793–807. doi: 10.1016/j.worlddev.2003.05.001
69. UNECE. Conference of European statisticians recommendations on measuring sustainable development. New York: United Nations (2014).
70. Pearce, D, Hamilton, K, and Atkinson, G. Measuring sustainable development: Progress on indicators. Environ Dev Econ. (1996) 1:85–101. doi: 10.1017/S1355770X00000395
71. Gomber, P, Kauffman, RJ, Parker, C, and Weber, BW. On the fintech revolution: interpreting the forces of innovation, disruption, and transformation in financial services. J Manag Inf Syst. (2018) 35:220–65. doi: 10.1080/07421222.2018.1440766
72. Drastichová, M. Adjusted Net Savings in the countries of the European Union. In 10th International Scientific Conference INPROFORUM, České Budějovice (Czech Republic). (2016). 220–65. Available at: https://omp.ef.jcu.cz/index.php/EF/catalog/view/49/48/130-1#page=15.
73. Hamilton, K. Sustaining economic welfare: estimating changes in total and per capita wealth. Environ Dev Sustain. (2003) 5:419–36. doi: 10.1023/A:1025716711086
75. Atkinson, G, Dietz, S, and Neumayer, E. Handbook of sustainable development. Cheltenham, UK: Edward Elgar Publishing Limited (2007).
76. Demire, A, Pesqué-Cela, V, Altunbas, Y, and Murinde, V. Fintech, financial inclusion and income inequality: a quantile regression approach. Eur. J. Fin. (2022) 28:86–107. doi: 10.1080/1351847X.2020.1772335
77. Ma’ruf, A, and Aryani, F. Financial inclusion and achievements of sustainable development goals (SDGs) in ASEAN. J Bus Econ Rev. (2019) 4:147–55. doi: 10.35609/jber.2019.4.4(1)
78. Sadia, T, Saleem, F, and Shahzad, F. Does digital finance and financial inclusion STRENGTHEN environmental sustainability: evidence from Asia. Pak J Soc Res. (2022) 4:876–83. doi: 10.52567/pjsr.v4i04.847
79. Wang, Y, Fahad, S, Wei, L, Luo, B, and Luo, J. Assessing the role of financial development and financial inclusion to enhance environmental sustainability: do financial inclusion and eco-innovation promote sustainable development? Front Environ Sci. (2022) 10:478. doi: 10.3389/fenvs.2022.1056478
80. Shah, P, and Dubhashi, M. Review paper on financial inclusion-the means of inclusive growth. Chanakya Int J Bus Res. (2015) 1:37–48. doi: 10.15410/cijbr/2015/v1i1/61403
81. Sarma, M, and Pais, J. Financial inclusion and development. J Int Dev. (2011) 23:613–28. doi: 10.1002/jid.1698
82. Chinoda, T, and Mashamba, T. Fintech, financial inclusion and income inequality nexus in Africa. Cogent Economics & Finance. (2021) 9:1986926. doi: 10.1080/23322039.2021.1986926
83. Petrivskyi, O, and Medvid, H. Financial inclusion as a factor in the transformation of financial markets in the context of sustainable development. Three Seas Econ J. (2022) 3:145–52. doi: 10.30525/2661-5150/2022-1-21
84. Ozili, PK. Financial inclusion and sustainable development: an empirical association. J Money Bus. (2022) 2:186–98. doi: 10.1108/JMB-03-2022-0019
85. Queralt, J, Fu, J, and Romano, M. Financial inclusion and the 2030 agenda for sustainable development: a missed opportunity. Enterp Dev Microfinanc. (2017) 28:200–11. doi: 10.3362/1755-1986.16-00037
86. Moufakkir, M, and Mohammed, Q. The Nexus between FinTech adoption and financial inclusion. Research anthology on personal finance and improving financial literacy. (2020).
87. Puschmann, T. FinTech as a catalyst for sustainability in the financial system. Building Bridges. (2021). Available at: https://www.buildingbridges.org/fintech-as-a-catalyst-for-sustainability-in-the-financial-system/.
88. Hinson, R, Lensink, R, and Mueller, A. Transforming agribusiness in developing countries: SDGs and the role of fintech. Curr Opin Environ Sustain. (2019) 41:1–9. doi: 10.1016/j.cosust.2019.07.002
89. International Institute for Sustainable Development (IISD). Task Force Analyzes Role of Fintech in Accelerating SDGs. SDG knowledge hub. (2019). Available at: https://sdg.iisd.org/news/task-force-analyzes-role-of-fintech-in-accelerating-sdgs/.
90. Jiang, B. Does fintech promote the sustainable development of renewable energy enterprises? Environ Sci Pollut Res. (2023) 30:65141–8. doi: 10.1007/s11356-023-27030-0
91. Macchiavello, E, and Siri, M. Sustainable Finance and Fintech: Can Technology Contribute to Achieving Environmental Goals? A Preliminary Assessment of ‘Green FinTech’. European Banking Institute Working Paper Series 2020 – no. 71. Available at: https://ssrn.com/abstract=3672989. (2020).
92. Pawłowska, M, Staniszewska, A, and Grzelak, M. Impact of FinTech on sustainable development. Financial Sci. (2022) 27:49–66. doi: 10.15611/fins.2022.2.05
93. Stephenson, M, Hamid, MF, Peter, A, Sauvant, KP, Šerić, A, and Tajoli, L. How the G20 Can Advance Sustainable and Digital Investment. Social Science Research Network. (2020).
94. Zorlu, PK. Transforming the financial system for delivering sustainable development: A high-level overview. IGES Discussion Paper. (2018).
95. Bala, S, and Singhal, P. Digital financial inclusion through FinTech In: S Bala and P Singhal, editors. Gender perspectives on industry 4.0 and the impact of technology on mainstreaming female employment. Pennsylvania, US: IGI Global (2022). 77–90.
96. Daud, SNM, and Ahmad, AH. Financial inclusion, economic growth and the role of digital technology. Financ Res Lett. (2023) 53:103602. doi: 10.1016/j.frl.2022.103602
97. Senyo, PK, Karanasios, S, Gozman, D, and Baba, M. FinTech ecosystem practices shaping financial inclusion: the case of mobile money in Ghana. Eur J Inf Syst. (2022) 31:112–27. doi: 10.1080/0960085X.2021.1978342
98. AFI. Fintech for financial inclusion: a framework for digital financial transformation. Special report. (2018). Available at: https://www.ada-microfinance.org/sites/default/files/2020-12/fintech-for-financial-inclusion-a-framework-for-digital-financial-transformation.pdf (Accessed May 24, 2023).
99. Yeyouomo, AK, Asongu, SA, and Agyemang-Mintah, P. Fintechs and the financial inclusion gender gap in sub-Saharan African countries. Womens Stud Int Forum. (2023) 97:102695.
100. Telukdarie, A, and Mungar, A. The impact of digital financial technology on accelerating financial inclusion in developing economies. Proc Comput Sci. (2023) 217:670–8. doi: 10.1016/j.procs.2022.12.263
101. Howard, T, and Yuwa, HW. How digital finance and Fintech can improve financial inclusion In: T Howard, editor. Inclusive growth. Bingley, UK: Emerald Publishing Limited (2019). 27–41.
102. Salampasis, D, and Mention, AL. FinTech: harnessing innovation for financial inclusion In: DL Chuen and RH Deng, editors. Handbook of Blockchain, digital finance, and inclusion, vol. 2. Cambridge, MA: Academic Press (2018). 451–61.
103. Umarov, HS. The role of FinTech startups in contemporary society. Finance Credit. (2021) 27:1911–30. doi: 10.24891/fc.27.8.1911
104. Ifediora, C, Offor, KO, Eze, EF, Takon, EA, Ibe, GI, et al. Financial inclusion and its impact on economic growth: Empirical evidence from sub-Saharan Africa. Cogent Eco. Fin. 10:1–27. doi: 10.1080/23322039.2022.2060551
105. Abor, JY, Issahaku, M, Amidu, M, and Murinde, V. Financial inclusion and economic growth: What do we know? CGF Working Paper 11/2018, Centre for Global Finance, London. (2018). Available at: https://www.soas.ac.uk/centreforglobalfinance/publications/
106. Asiedu-Danquah, YF. Financial inclusion and the fourth industrial revolution in Ghana: challenges and prospects from a legal perspective. (Doctoral dissertation, University of Johannesburg). (2020).
107. Hantrais, L, Allin, P, Kritikos, M, Sogomonjan, M, Anand, PB, Livingstone, S, et al. Covid-19 and the digital revolution. Contemp Soc Sci. (2020) 16:256–70. doi: 10.1080/21582041.2020.1833234
108. Salamon, J. The measurement of sustainable development level in the aspect of selection of indicators and measurement methods In: J Salamon, editor. Infrastructure and environment. Berlin: Springer International Publishing (2019). 328–36.
109. Li, N, and Wu, D. Nexus between natural resource and economic development: how green innovation and financial inclusion create sustainable growth in BRICS region? Resources Policy. (2023) 85:103883. doi: 10.1016/j.resourpol.2023.103883
110. Ahmad, AH, Green, CJ, Jiang, F, and Murinde, V. Mobile money, ICT, financial inclusion and growth: how different is Africa? Econ Model. (2023) 121:106220. doi: 10.1016/j.econmod.2023.106220
111. Younas, ZI, Qureshi, A, and Al-Faryan, MAS. Financial inclusion, the shadow economy and economic growth in developing economies. Struct Chang Econ Dyn. (2022) 62:613–21. doi: 10.1016/j.strueco.2022.03.011
112. Bkwayep, NYR, and Tsafack, NR. Remittances, financial inclusion and income inequality in Africa. (2020).
113. Emara, N, and Mohieldin, M. Financial inclusion and extreme poverty in the MENA region: a gap analysis approach. Rev Econ Polit Sci. (2020) 5:207–30. doi: 10.1108/REPS-03-2020-0041
114. Hasan, MM, and Lu, Z. Nexus among financial inclusion and sustainability in Asia: role of banking sector. Environ Sci Pollut Res. (2023) 30:62481–93. doi: 10.1007/s11356-023-26028-y
115. Nenavath, S, and Mishra, S. Impact of green finance and fintech on sustainable economic growth: empirical evidence from India. Heliyon. (2023) 9:e16301. doi: 10.1016/j.heliyon.2023.e16301
116. Deng, X, Huang, Z, and Cheng, X. FinTech and sustainable development: evidence from China based on P2P data. Sustain For. (2019) 11:6434. doi: 10.3390/su11226434
117. Hodula, M. Fintech credit, big tech credit and income inequality. Financ Res Lett. (2023) 51:103387. doi: 10.1016/j.frl.2022.103387
118. Haddad, C, and Hornuf, L. The emergence of the global fintech market: economic and technological determinants. Small Bus Econ. (2019) 53:81–105. doi: 10.1007/s11187-018-9991-x
119. Popescu, CRG, and Popescu, GN. An exploratory study based on a questionnaire concerning green and sustainable finance, corporate social responsibility, and performance: evidence from the Romanian business environment. J Risk Financ Manag. (2019) 12:162. doi: 10.3390/jrfm12040162
120. Knuth, S. “Breakthroughs” for a green economy? Financialization and clean energy transition. Energy Res Soc Sci. (2018) 41:220–9. doi: 10.1016/j.erss.2018.04.024
121. Al-Smadi, MO. Examining the relationship between digital finance and financial inclusion: evidence from MENA countries. Borsa Istanbul Rev. (2023) 23:464–72. doi: 10.1016/j.bir.2022.11.016
122. Lyons, AC, Kass-Hanna, J, and Fava, A. Fintech development and savings, borrowing, and remittances: a comparative study of emerging economies. Emerg Mark Rev. (2022) 51:100842. doi: 10.1016/j.ememar.2021.100842
123. Rumondang, I, Yusgiantoro, IB, and Rofifa, J. Effects of Information and Communication Technologies on Financial Inclusion in Emerging Countries. WORKING Paper 20 (08), Otoritas Jasa Keungan. (2020).
124. Makina, D, and Walle, YM. Financial inclusion and economic growth: evidence from a panel of selected African countries. Extending Financ Inclusion Africa. (2019) 9:193–210. doi: 10.1016/B978-0-12-814164-9.00009-8
125. Lacalle-Calderon, M, Larrú, JM, Garrido, SR, and Perez-Trujillo, M. Microfinance and income inequality: new macrolevel evidence. Rev Dev Econ. (2019) 23:860–76. doi: 10.1111/rode.12573
126. Belloumi, M, and Alshehry, A. The impact of international trade on sustainable development in Saudi Arabia. Sustain For. (2020) 12:5421. doi: 10.3390/su12135421
127. Huo, W, Ullah, MR, Zulfiqar, M, Parveen, S, and Kibria, U. Financial development, trade openness, and foreign direct investment: a Battle between the measures of environmental sustainability. Front Environ Sci. (2022) 10:77. doi: 10.3389/fenvs.2022.851290
128. Hunjra, AI, Azam, M, Bruna, MG, and Taskin, D. Role of financial development for sustainable economic development in low middle income countries. Financ Res Lett. (2022) 47:102793. doi: 10.1016/j.frl.2022.102793
129. Cámara, N, and Tuesta, D. Measuring financial inclusion: a multidimensional index. IFC bulletins chapters In: N Cámara, editor. Bank for International Settlements: The role of data in supporting financial inclusion policy, vol. 47. Basel, Switzerland: Bank for International Settlements (2018)
130. Nguyen, TTH. Measuring financial inclusion: a composite FI index for the developing countries. J Econ Dev. (2020) 23:77–99. doi: 10.1108/JED-03-2020-0027
131. Ozili, PK. Financial inclusion and legal system quality: are they correlated? J Money Bus. (2021) 1:84–101. doi: 10.1108/JMB-10-2021-0041
132. Tram, TXH, Lai, TD, and Nguyen, TTH. Constructing a composite financial inclusion index for developing economies. The Quarterly Review of economics and finance. (2021).
133. Kebede, J, Naranpanawa, A, and Selvanathan, S. Financial inclusion: measures and applications to Africa. Econ Anal Policy. (2021) 70:365–79. doi: 10.1016/j.eap.2021.03.008
134. AFI. Digital financial service indicators. Alliance for Financial Inclusion, guidelines note, No. 3, p. 12. (2019).
135. Banna, H, Hassan, MK, and Rashid, M. Fintech-based financial inclusion and bank risk-taking: evidence from OIC countries. J Int Financ Mark Inst Money. (2021) 75:101447. doi: 10.1016/j.intfin.2021.101447
136. Demirguc-Kunt, A, Klapper, L, Singer, D, Ansar, S, and Hess, J. Global Findex Database 2017 [La base de datos Global Findex 2017]. Washington, DC: World Bank Publications-Books (2018).
137. Sarma, M. Measuring financial inclusion for Asian economies In: S Gopalan and T Kikuchi, editors. Financial inclusion in Asia: Issues and policy concerns. Berlin: Springer (2016). 3–34.
138. Bojanic, AN. Tying decentralization and income redistribution to fight corruption: empirical evidence from developed and developing countries. Front Appl Math Stat. (2023) 8:1099553. doi: 10.3389/fams.2022.1099553
139. Ashenafi, BB, and Dong, Y. Financial inclusion, fintech, and income inequality in Africa. FinTech. (2022) 1:376–87. doi: 10.3390/fintech1040028
140. Fujii, E. What does trade openness measure? Oxford Bulletin of Economics and Statistics. (2019) 81:868–888.
141. Gök, A. The role of financial development on carbon emissions: a meta regression analysis. Environ Sci Pollut Res. (2020) 27:11618–36. doi: 10.1007/s11356-020-07641-7
142. Pandey, A, Kiran, R, and Sharma, RK. Investigating the determinants of financial inclusion in BRICS economies: panel data analysis using fixed-effect and cross-section random effect. Sustain For. (2023) 15:1603. doi: 10.3390/su15021603
143. Tok, YW, and Heng, D. Fintech: Financial inclusion or exclusion? New Hampshire, US: International Monetary Fund (2022).
144. Adu-Gyamfi, G, Nketiah, E, Obuobi, B, and Adjei, M. Trade openness, inflation and GDP growth: panel data evidence from nine (9) West Africa countries. Open J Bus Manage. (2019) 8:314–28. doi: 10.4236/ojbm.2020.81019
145. Emenalo, CO, Gagliardi, F, and Hodgson, GM. Historical institutional determinants of financial system development in Africa. J Inst Econ. (2018) 14:345–72. doi: 10.1017/S1744137417000042
146. Shahbaz, M. Does trade openness affect long run growth? Cointegration, causality and forecast error variance decomposition tests for Pakistan. Econ Model. (2012) 29:2325–39. doi: 10.1016/j.econmod.2012.07.015
147. Shahbaz, M, Aamir, N, and Butt, MS. Rural-urban income inequality under financial development and trade openness in Pakistan: the econometric evidence. Pak Dev Rev. (2007) 46:657–72. doi: 10.30541/v46i4IIpp.657-672
148. Allen, F, Demirgüç-Kunt, A, Klapper, L, and Peria, MM. The foundations of financial inclusion: understanding ownership and use of formal accounts. J Financ Intermed. (2016) 27:1–30. doi: 10.1016/j.jfi.2015.12.003
149. Bozkurt, İ, Karakuş, R, and Yildiz, M. Spatial determinants of financial inclusion over time. J Int Dev. (2018) 30:1474–504. doi: 10.1002/jid.3376
150. Kowalewski, O, and Pisany, P. The rise of fintech: a cross-country perspective. Technovation. (2023) 122:102642. doi: 10.1016/j.technovation.2022.102642
151. Čihák, M, Mare, DS, and Melecky, M. The nexus of financial inclusion and financial stability: A study of trade-offs and synergies. World Bank Policy Research Working Paper, (7722). (2016).
152. Omar, MA, and Inaba, K. Does financial inclusion reduce poverty and income inequality in developing countries? A panel data analysis. J Econ Struct. (2020) 9:37. doi: 10.1186/s40008-020-00214-4
153. Park, CY, and Mercado, R. Financial inclusion, poverty, and income inequality in developing Asia. Asian Development Bank Economics Working Paper Series, p. 426. (2015).
154. Loayza, N, Schmidt-Hebbel, K, and Serven, L. What drives private saving across the world. Rev Econ Stat. (2000) 82:165–81. doi: 10.1162/003465300558678
155. Samwick, A. Is pension reform conducive to higher saving. Rev Econ Stat. (2000) 82:264–72. doi: 10.1162/003465300558777
156. Corbo, V, and Schmidt-Hebbel, K. Public policies and saving in developing countries. J Dev Econ. (1991) 36:89–115. doi: 10.1016/0304-3878(91)90006-H
157. Dayal-Gulati, A, and Thimann, C. Saving in Southeast Asia and Latin America compared: searching for policy lessons. IMF working paper; WP/97/110. Washington, D.C., International Monetary Fund Asia and Pacific Dept. (1997).
158. Haque, NU, Pesaran, MH, and Sharma, S. Neglected Heterogeneity and Dynamics in Cross-Country Savings Regressions. (1999).
159. Edwards, S. Why are Latin America’s saving rates so low? An international comparative analysis. J Dev Econ. (1996) 51:5–44. doi: 10.1016/S0304-3878(96)00424-5
160. Masson, PR, Bayoumi, T, and Samiei, H. International evidence on the determinants of private saving. World Bank Econ Rev. (1998) 12:483–501. doi: 10.1093/wber/12.3.483
161. Bond, SR. Dynamic panel data models: a guide to micro data methods and practice. Port Econ J. (2002) 1:141–62. doi: 10.1007/s10258-002-0009-9
162. Oyelami, LO, Saibu, OM, and Adekunle, BS. Determinants of financial inclusion in sub-Sahara African countries. Covenant J Bus Soc Sci. (2017) 8:116.
163. Rraci, O. The effect of foreign banks in financing firms, especially small firms, in transition economies. East Eur Econ. (2010) 48:5–35. doi: 10.2753/EEE0012-8775480401
164. Kebede, J, Selvanathan, S, and Naranpanawa, A. Foreign bank presence, institutional quality, and financial inclusion: evidence from Africa. Econ Model. (2021) 102:105572. doi: 10.1016/j.econmod.2021.105572
165. Baltagi, BH. Dynamic panel data models In: BH Baltagi, editor. Econometric analysis of panel data. Hoboken, NJ: Wiley (2021). 187–228.
166. Blundell, R, Bond, S, and Windmeijer, F. Estimation in dynamic panel data models: Improving on the performance of the standard GMM estimator. 15. Bingley, UK: Emerald Group Publishing Limited, pp. 53–91. (2001).
167. Hsiao, C. Panel data analysis—advantages and challenges. TEST. (2007) 16:1–22. doi: 10.1007/s11749-007-0046-x
168. Arellano, M, and Bover, O. Another look at the instrumental variable estimation of error-components models. J Econ. (1995) 68:29–51. doi: 10.1016/0304-4076(94)01642-D
169. Zhou, H, and Xu, G. Research on the impact of green finance on China's regional ecological development based on system GMM model. Resources Policy. (2022) 75:102454. doi: 10.1016/j.resourpol.2021.102454
171. Asongu, SA, and Nwachukwu, JC. The mobile phone in the diffusion of knowledge for institutional quality in sub-Saharan Africa. World Dev. (2016) 86:133–47. doi: 10.1016/j.worlddev.2016.05.012
172. Goczek, L, and Witkowski, B. Determinants of non-cash payments. National Bank of Poland Working Paper, p. 196, (2015).
174. Love, I, and Zicchino, L. Financial development and dynamic investment behavior: evidence from panel VAR. Q Rev Econ Finance. (2006) 46:190–210. doi: 10.1016/j.qref.2005.11.007
175. Habimana, O. Do flexible exchange rates facilitate external adjustment? A dynamic approach with time-varying and asymmetric volatility. IEEP. (2017) 14:625–42. doi: 10.1007/s10368-016-0341-7
176. Sultana, T, Dey, SR, and Tareque, M. Exploring the linkage between human capital and economic growth: a look at 141 developing and developed countries. Econ Syst. (2022) 46:101017. doi: 10.1016/j.ecosys.2022.101017
177. Ahn, SC, and Schmidt, P. Efficient estimation of models for dynamic panel data. J Econ. (1995) 68:5–27. doi: 10.1016/0304-4076(94)01641-C
178. Gujarati, D, and Porter, DC. Functional forms of regression models: Essentials of econometrics, pp. 132–177. (2010).
179. Judson, RA, and Owen, AL. Estimating dynamic panel data models: a guide for macroeconomists. Econ Lett. (1999) 65:9–15. doi: 10.1016/S0165-1765(99)00130-5
180. Maddala, GS, and Wu, S. A comparative study of unit root tests with panel data and a new simple test. Oxf Bull Econ Stat. (1999) 61:631–52. doi: 10.1111/1468-0084.0610s1631
181. Ajitesh, K. Correlation Concepts, Matrix & Heatmap using Seaborn. Data Analytics. (2022). Available at: https://vitalflux.com/correlation-heatmap-with-seaborn-pandas/
182. Sahay, MR, Cihak, M, N'Diaye, MP, Barajas, MA, Mitra, MS, Kyobe, MA, et al. Financial inclusion: Can it meet multiple macroeconomic goals? vol. 15. Washington, DC: International Monetary Fund (2015). 1 p.
183. Gautam, RS, Rawal, A, and Rastogi, S. Financial inclusion and their impact on India's sustainable development: using internet subscribers as moderator. In: 2022 IEEE International Humanitarian Technology Conference (IHTC). IEEE, pp. 118–123. (2022).
184. Mertzanis, C. FinTech finance and social-environmental performance around the world. Financ Res Lett. (2023) 56:104107. doi: 10.1016/j.frl.2023.104107
185. Lisha, L, Mousa, S, Arnone, G, Muda, I, Huerta-Soto, R, and Shiming, Z. Natural resources, green innovation, fintech, and sustainability: a fresh insight from BRICS. Resources Policy. (2023) 80:103119. doi: 10.1016/j.resourpol.2022.103119
186. Singh, S, Arya, V, Yadav, MP, and Power, GJ. Does financial development improve economic growth? The role of asymmetrical relationships. Glob Financ J. (2023) 56:100831. doi: 10.1016/j.gfj.2023.100831
187. Alexeev, M, and Chernyavskiy, A. The impact of institutional quality on manufacturing sectors: a panel data analysis. Econ Syst. (2021) 45:100891. doi: 10.1016/j.ecosys.2021.100891
188. Menyelim, CM, Babajide, AA, Omankhanlen, AE, and Ehikioya, BI. Financial inclusion, income inequality and sustainable economic growth in sub-Saharan African countries. Sustain For. (2021) 13:1780. doi: 10.3390/su13041780
189. Tay, LY, Tai, HT, and Tan, GS. Digital financial inclusion: A gateway to sustainable development. Heliyon. (2022) 8:1–10. doi: 10.1016/j.heliyon.2022.e09766
TABLE A1 List of panel countries.
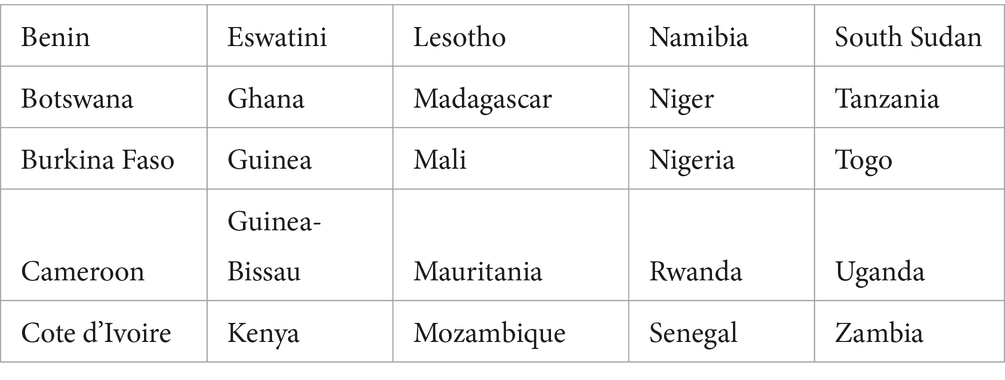
N = 25.
Keywords: FinTech, financial inclusion, sustainable development, Adjusted Net Saving, gross saving, system GMM, marginal effect, African region
Citation: Tidjani C and Madouri A (2024) Fintech, financial inclusion, and sustainable development in the African region. Front. Appl. Math. Stat. 10:1276218. doi: 10.3389/fams.2024.1276218
Edited by:
Claudia Tarantola, University of Pavia, ItalyReviewed by:
Hazimi Foziah, Sultan Zainal Abidin University, MalaysiaCopyright © 2024 Tidjani and Madouri. This is an open-access article distributed under the terms of the Creative Commons Attribution License (CC BY). The use, distribution or reproduction in other forums is permitted, provided the original author(s) and the copyright owner(s) are credited and that the original publication in this journal is cited, in accordance with accepted academic practice. No use, distribution or reproduction is permitted which does not comply with these terms.
*Correspondence: Chemseddine Tidjani, Yy50aWRqYW5pQGNyZWFkLmR6
Disclaimer: All claims expressed in this article are solely those of the authors and do not necessarily represent those of their affiliated organizations, or those of the publisher, the editors and the reviewers. Any product that may be evaluated in this article or claim that may be made by its manufacturer is not guaranteed or endorsed by the publisher.
Research integrity at Frontiers
Learn more about the work of our research integrity team to safeguard the quality of each article we publish.