 Rosa Fabbricatore
 Lucio Palazzo
95% of researchers rate our articles as excellent or good
Learn more about the work of our research integrity team to safeguard the quality of each article we publish.
Find out more
ORIGINAL RESEARCH article
Front. Appl. Math. Stat. , 04 October 2023
Sec. Statistics and Probability
Volume 9 - 2023 | https://doi.org/10.3389/fams.2023.1278146
This article is part of the Research Topic Advanced Statistical Modelling for Fintech, Financial Inclusion, and Inequality View all 4 articles
Introduction: Modern FinTech tools (e.g., instant payments, blockchain, roboadvisor) represent the new frontier of digital finance. Consequently, the evaluation of the knowledge level of the population about these topics is a crucial concern. In this context, several exogenous factors may influence individual differences in financial literacy. In particular, the territorial characteristics can have an impact on FinTech. In this work, we investigate individual heterogeneity in subjective financial knowledge in Italy, specifically focusing on modern FinTech tools, and exploring the differences at the individual and regional levels.
Methods: A sample of 598 Italian individuals from 10 different Italian regions was involved. A multilevel IRT model is performed to evaluate the level of FinTech individual knowledge and the differences according to Italian regions to account for the hierarchical structure of the data.
Results: Results reported a weak regional effect, revealing that heterogeneity in financial knowledge can be mainly attributed to individual characteristics. At the individual level, age, economic condition, knowledge of traditional financial objects and numeracy showed a significant effect. In addition, a scientific field of study and work have an impact on respondents' knowledge level.
Discussion: What is shown and discussed in this contribution can inspire policymakers' actions to increase financial literacy in the population. In particular, the obtained results imply that policymakers should improve the population's awareness of less popular FinTech tools and foster individuals' literacy about numbers and traditional financial tools, which proved to have a great influence in explaining FinTech knowledge differences.
Financial technology, or FinTech, is a new sector that has emerged as a result of the new issues that the modern digital transition has presented to financial systems worldwide [1]. The diffusion of digital technology determined economic and social implications in all sectors. There is an increasing interest in national governments supporting the automation of financial services for more sustainable approaches to financial management and customized solutions to meet individual demands. The swift evolution of FinTech has forced traditional financial institutions, i.e., banks and insurance companies, to shift toward more open business models, transforming their role in the market through a re-intermediation process [2].
Making better economic judgments should be a result of understanding financial systems, according to Robb and Woodyard [3], and the available literature usually corroborates this; in particular, numerous studies indicated that well-developed financial abilities are necessary for effective money management [refer to Barroso and Laborda [4] for an extensive review of the topic].
Encouraging individual knowledge of these new financial tools and services allows for achieving more equitable economic growth. Indeed, people having access to the financial system are better equipped to launch and grow enterprises and expand businesses, invest in their children's education, and withstand financial shocks. Italy is significantly affected by the spread of digital technologies in financial intermediation. Due to both rapid technical advancement and governmental initiatives to boost payment efficiency and security (even before the pandemic crisis), there has been a progressive growth in the use of alternative payment instruments to cash, especially cards. Nonetheless, the Italian government is showing the willingness to move forward with the objectives outlined in the 2018 FinTech Action Plan1, aiming to expand the functionality and security of traditional electronic payments to address and cope with new instruments (such as crypto-assets).
The literature highlighted several individual differences in financial inclusion and literacy [5, 6]. Among them, the gender gap is crucial, especially when combined with further socio-demographic features and/or with country-based attributes. In addition, other individual aspects, such as attitude and affinity with numbers (numeracy), can influence financial literacy. The proven significant effect of these attributes has brought questions regarding their impact, also in the new contests of FinTech. However, much remains to be understood. For example, within the topic of gender equality in finance, even if some researchers highlight the persistence of a gender gap in the FinTech context [7], newly published studies prove that FinTech is able to drive more women into employment and enable them to increase their wages [8, 9].
In this work, we intend to contribute to this research line by further investigating individual heterogeneity concerning the knowledge of FinTech tools. To assess the level of FinTech knowledge, a multilevel IRT model [10] is performed to evaluate the level of FinTech individual knowledge, the differences according to Italian regions, and the effect of individual and regional characteristics. It is realistic to assume that people's financial literacy is more similar for those who belong to the same region because the Italian regions may differ at the national level regarding their updating and advancement in FinTech.
The paper is organized as follows: Section 2 introduces the data adopted for the study while Section 3 describes the theoretical framework. In Section 4, the main results are discussed, while the concluding remarks are summarized in Section 5.
Data used in this work are part of the survey on “Knowledge and Use of Fintech Products” belonging to the European project CA19130 Fintech and Artificial Intelligence in Finance2. Data are collected in the form of a self-administered questionnaire to a sample of respondents selected by a non-probabilistic convenience sampling. The considered sample consists of 598 Italian individuals from 10 different Italian regions. Participants were asked to indicate their knowledge level of several financial tools (FT) on a 6-point Likert response scale, ranging from 1 = “no knowledge” to 6 = “expert”.
The considered variables contribute to a wide understanding of the individual subjective financial knowledge (SFK) referred to in the modern FinTech framework. They include the following digital services and tools:
• Crowdfunding (FT1), the use of small amounts of capital from a large number of individuals to finance a new business venture;
• Cryptocurrencies (FT2), digital verified currencies maintained by a decentralized system using cryptography;
• Instant insurance (FT3), micro-insurance policy that covers specific and often imminent events, covering a limited time frame, even daily, in conjunction with particular events;
• Instant payments (FT4), electronic payment solutions that solve the transaction in the immediate or close-to-immediate interbank clearing;
• Roboadvisor (FT5), digital algorithm-driven platform that uses the data to offer advice and to provide automated financial planning and investment services with little to no human supervision;
• Peer to peer services (FT6), a form of financial technology that allows people to lend or borrow money from one another without going through a third-party service, such as a bank;
• Cloud computing (FT7), an on-demand service that offers online access to pooled resources, including data storage, servers, databases, networking and software;
• DLT/Blockchain (FT8), decentralized databases using ledgers stored on separate, connected devices in a network to ensure data accuracy and security;
• Artificial Intelligence (FT9), it refers to the software or systems that mimic human intelligence to perform tasks to significantly enhance human capabilities and understandings in most difficult tasks;
• Internet of Things (FT10), it is a broad concept referring to a network of interrelated devices that connect and exchange data with other devices;
• Machine Learning (FT11), a branch of artificial intelligence that uses statistical models to make predictions, detect fraud, and automate trading activities;
• Biometric Identification (FT12), a technology that uses biometric authentication based on physical characteristics to determine a person's identity.
In addition, a set of individual characteristics were also assessed: socio-demographic information (sex, age, education level, field of study, occupational status, field of work, income), knowledge of traditional financial objects and numeracy. The knowledge of traditional financial objects is a construct composed of seven 6-point Likert scales questions about the individual knowledge level concerning some classical financial concepts (i.e., inflation rate, gross domestic product, rating, spread, etc.). Regarding numeracy, the Berlin Numeracy Test in the multiple choice format was used [11], comprising four multiple choice questions about fractions, proportions, percentages, and probabilities.
To obtain a preliminary investigation of the FinTech framework in literature, a bibliometric analysis was conducted by extracting the data from the Web of Science Core Collection3 and using the R package bibliometrix for the elaborations [12]. A total of 2,092 papers having the term “FinTech” in their title or in their abstract have been selected for this analysis. Starting from the raw data, the keyword co-occurrence network has been extracted by selecting the subset of terms with a frequency at least equal to 20.
The co-occurrences map of the keywords is depicted in Figure 1. Each node in the network represents a keyword. The size of the node indicates the number of times the keyword occurs; the link between the nodes represents the co-occurrence between keywords; the thickness of the link is proportional to the co-occurrence of keywords (i.e., the number of times the keywords occur together). Subsequently, the Leiden community detection algorithm has been applied to cluster the keywords, which guarantees that communities are well-connected [13]. The clustering algorithm detected a total of four clusters. The first group, depicted in red in Figure 1, is represented by keywords related to digital currencies and digital encryption. The second (in blue) mainly focuses on digitalization and financial inclusion, referring to population access to the most widespread financial tools promoted for example by banks, like payment services, e-commerce and open banking. The green cluster is mostly associated with technical keywords belonging to financial investments (credit risk, portfolio management, household savings and personal finance) and modern statistical techniques (big data, machine learning, deep learning, data modeling and statistical models). Finally, the last cluster, colored in violet, is more related to the political sphere. Keywords such as sociology, liberalism, state and governance suggest that the related papers focus the discussion on a conceptual level.
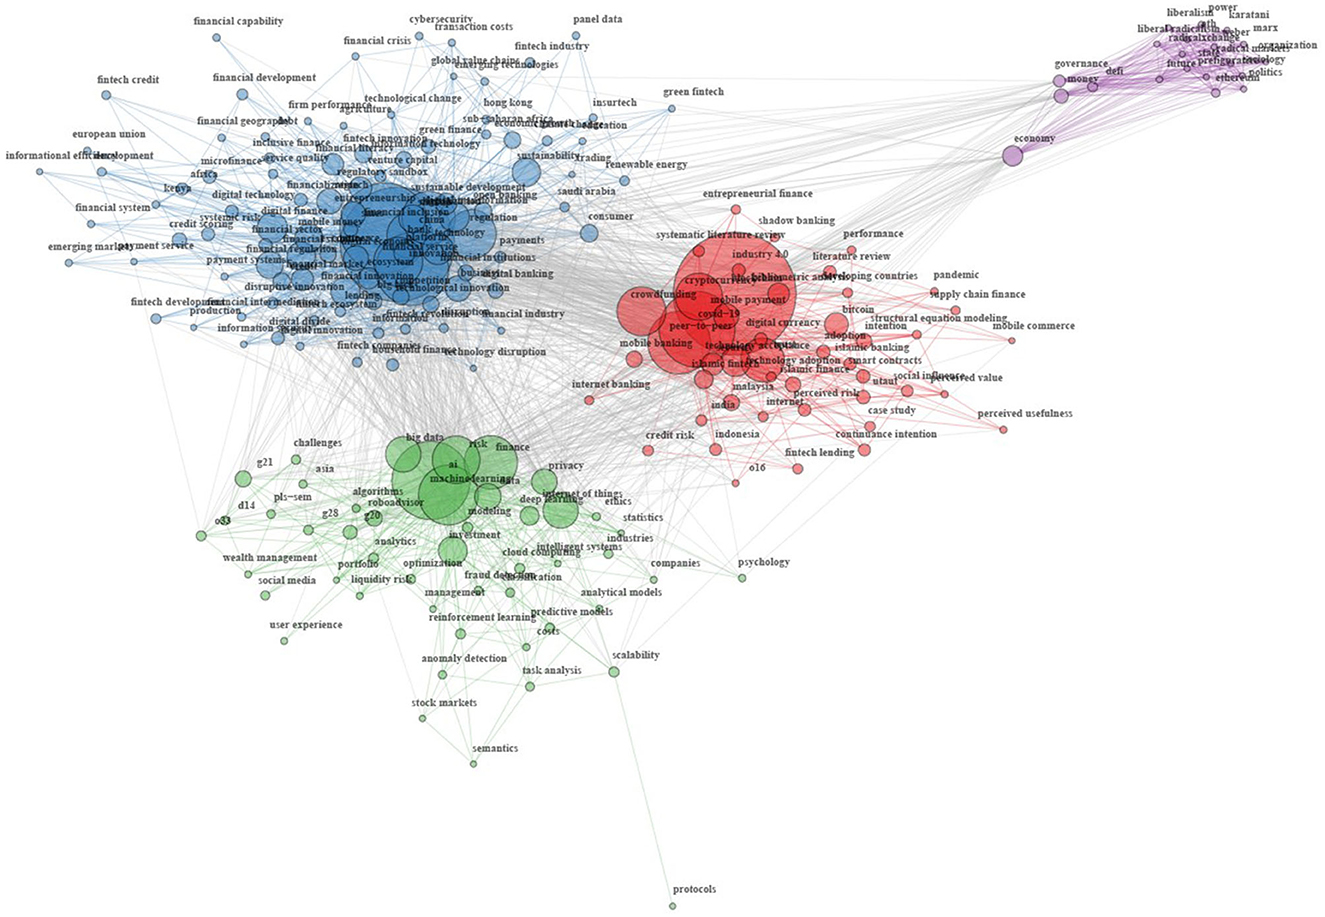
Figure 1. Map of the co-occurrencies network. Cluster 1 is colored in red, cluster 2 in blue, cluster 3 in green and cluster 4 in violet.
To highlight the importance of the nodes in the network, the betweenness centrality measure of the top-5 terms of each cluster is summarized in Table 1. Moreover, keyword matching has been performed to investigate whether the financial tools considered in this work belonged to the keyword list of the clusters. Based on the results, the majority of the considered financial tools in this work belong to clusters 1 and 3, while only three of them are not present: it is the case of Instant insurance (FT3), Instant payments (FT4), Biometric Identification (FT12). While FT3 and FT12 are not present at all in the keyword list, terms related to “payment” (mobile payment, payment service, and payment system) appear in clusters 1 and 2.
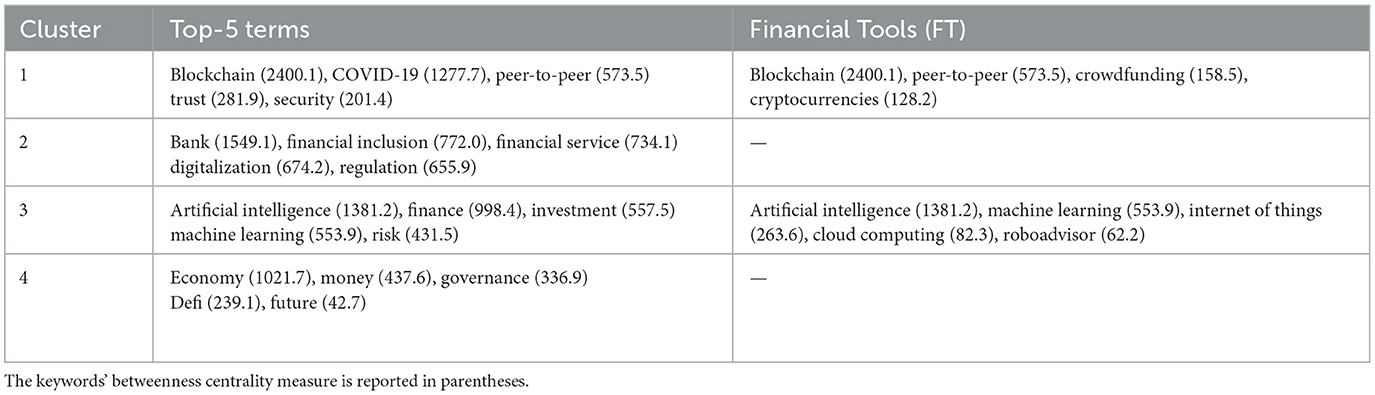
Table 1. Results of the Leiden algorithm of the co-occurrencies network.
To further explore the heterogeneity in SFK at the regional level, we also considered secondary data collected by the OECD (https://stats.oecd.org/) and included in the Regional Economy dataset (Regional gross domestic product (GDP), Regional Gross Value Added (GVA) for total activities, GVA in financial and insurance activities), and in the Regional WellBeing dataset (disposable income per capita, unemployment rate, share of labor force with at least secondary education, perception of corruption). Thus, the considered variables embrace information on both individual and regional levels.
Starting from the observed frequencies of respondents' behaviors depicted in Figure 2, it is possible to notice a high ratio of respondents that declare to possess no knowledge at all about most of the considered topics. In some cases, the percentage of respondents that answered “1” (corresponding to no knowledge at all) exceeded 50%, with higher scores observed for the items FT5, FT3, and FT8 (that are roboadvisor, DLT/blockchain and instant insurance, respectively). However, cloud computing and artificial intelligence (FT7 and FT9) show an opposite trend, meaning that respondents declare to possess at least a minimal knowledge of these modern financial tools.
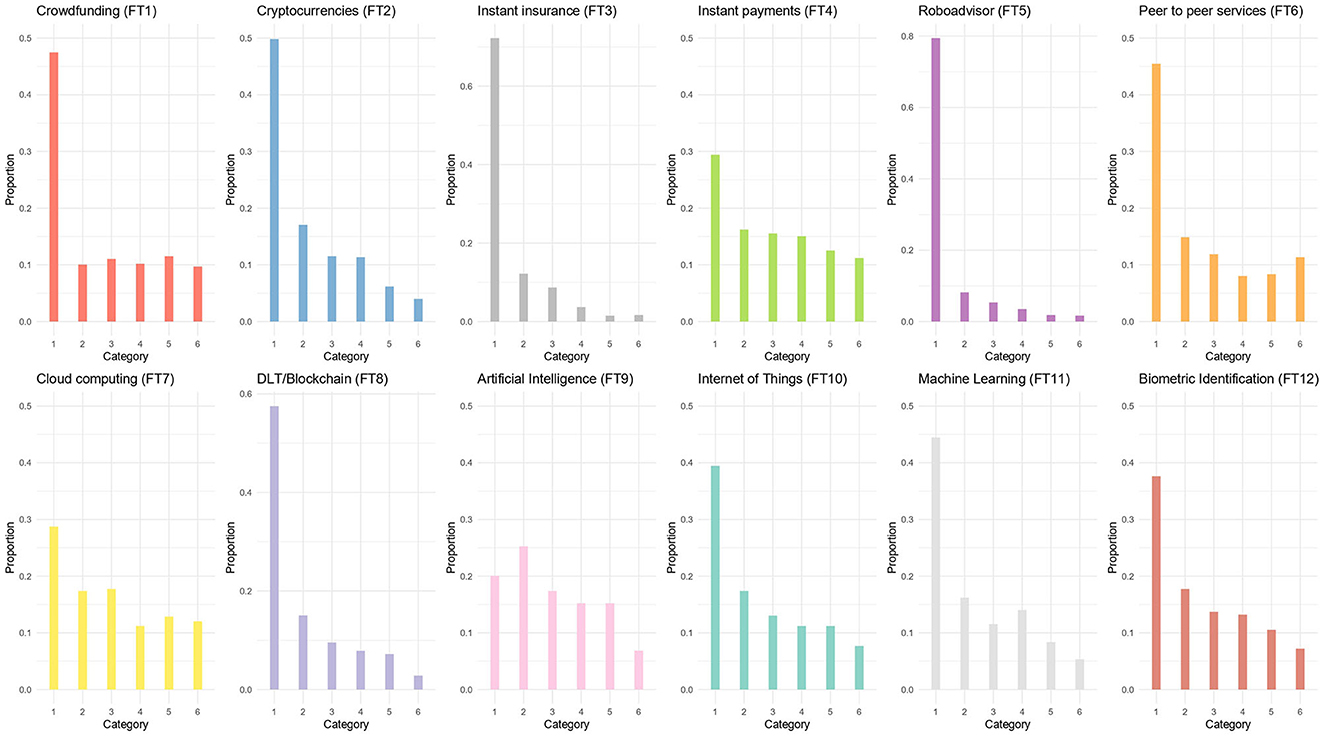
Figure 2. Empirical distribution of the FT items.
The median age of the respondents is 22 years old, which are predominantly females (56%) and with a mean age of m = 24.44 (sd = 7.36). The main descriptive statistics are presented in Table 2. The majority of the respondents reside in Campania, Lombardia, and Lazio, which are the most populated Italian regions. More in general, the quota of people living in the Northern regions (Emilia Romagna, Lombardia, Piemonte, and Veneto) sum up to 36.9% of the sample, the same count reaches 50.8% for the Southern regions (Campania, Puglia, and Sicilia), while the remaining 12.3% respondents live in the Center, i.e., Lazio, Toscana, and Umbria.
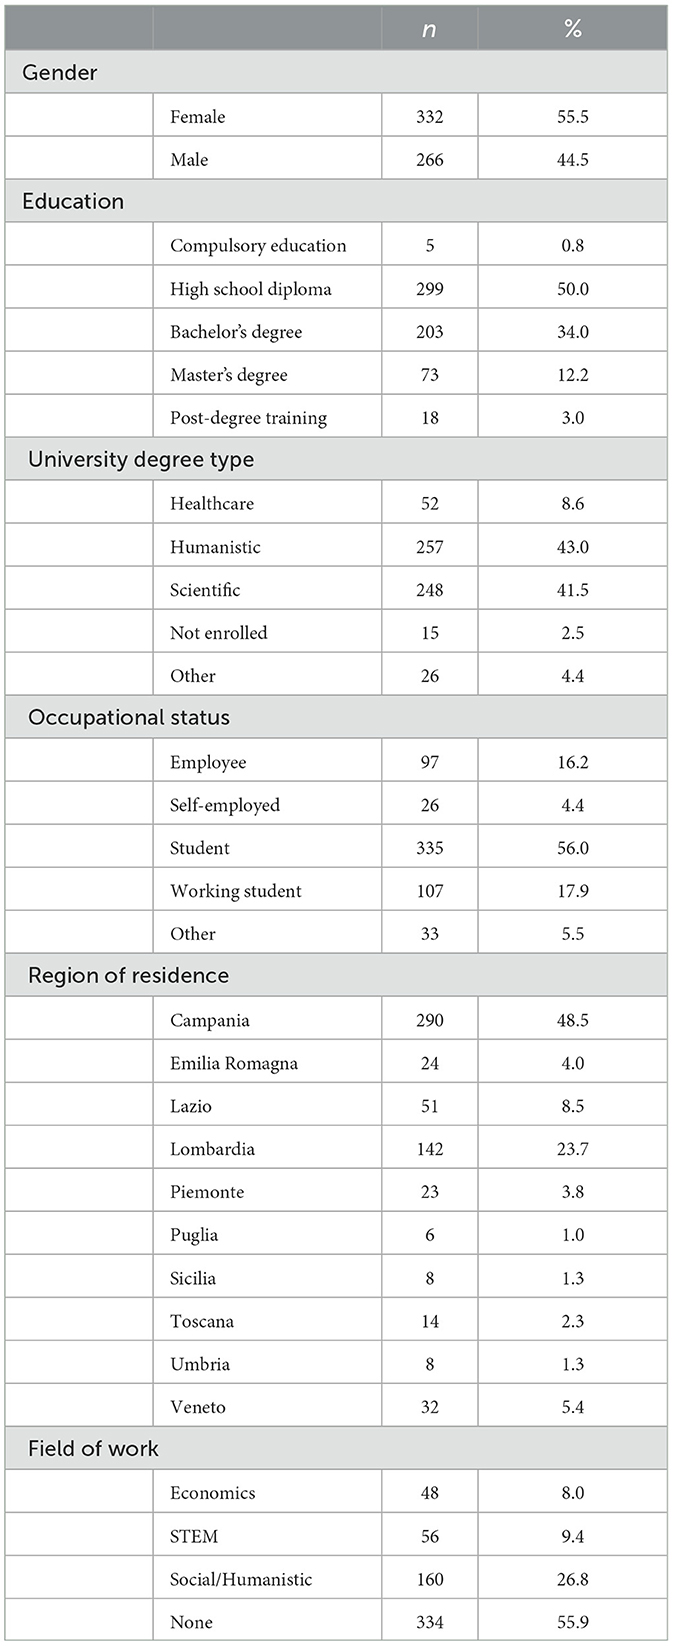
Table 2. Descriptive statistics.
The educational attainment is at high school graduation for approximately one-half of the respondents, while seven respondents (equivalent to 0.8%) declared not having at least a high school degree. In the other half, 34% has a bachelor's degree; the others have at least a master's degree. The share of interviewees enrolled in a Scientific degree program is comparable to that of those enrolled in a Humanities faculty (41.5 and 43.0%, respectively), while the remaining 15.5% at the time of the interview were either not enrolled in a university or attending another type of course (e.g., training program and job initiation course). Given the young average age of the sample, it is not surprising that their occupational status comprises 56% of students and 17.9% of working students, 97 (16.2%) employees, and only 4.4% of self-employed workers. For the same reason, the majority of respondents (334) declared that they were not working at the time of the interview.
Subjective financial knowledge (SFK) represents an unobservable (i.e., latent) construct that can be measured by a set of observable (manifest) indicators. Accordingly, latent variable models represent suitable statistical models for their assessment, allowing obtaining a reliable estimate of the latent trait. Among them, IRT models [14] stand out as a reference when nominal or ordered categorical indicators are considered, such as Likert-type scales.
In addition, a multilevel approach to data analysis [15] is useful in the case of hierarchical data structures, as in our application, where individuals (first level) are nested within regions (second level). Indeed, multilevel models make it possible to investigate the influence of the group-level units on the low-level units' outcomes, decomposing the total variance in within-group and between-group variation. This means that a measurement of individuals' SFK and, simultaneously, a rank of Italian regions according to the knowledge levels of their citizens can be obtained.
In this vein, multilevel IRT modeling [10] offers a unique framework for jointly considering the latent nature of SFK and the hierarchical structure of the data. Moreover, a set of covariates at the individual and cluster levels can be added to model the effect of individual and regional characteristics on SFK.
In a multilevel IRT model, we can distinguish two components: a measurement part following an IRT parameterization and a regression component accounting for the hierarchical data structure and covariates effect. More formally, let Yijk be the response on item k (k = 1, …, 12) of individual i (i = 1, …, n) belonging to the Italian region j (j = 1, …, 10). Each item has m = 6 response categories indicated with c = 0, …, m−1. Moreover, let θij denote the SFK of individual i belonging to region j, where θij is a normally distributed random variable. Finally, let X and Z be the two matrices including the covariates at individual and regional level, respectively.
The measurement part of the model specifies the conditional probability of the observed item responses given the latent financial knowledge P(Y|θ). According to the adjacent-categories approach [16], the probability that individual i in the region j selects the response category c of item k is based on a local comparison between category c and category c−1:
where γk and δck are the discrimination and the step-difficulty parameters, respectively. Specifically, γk denotes how strongly the item discriminates among different levels of the latent trait, whereas δck is the value of θij at which the probability of answering by category c equals the probability of answering by category c−1 [17]. F[] is a cumulative probability distribution function; when the logistics distribution is considered, the Generalized Partial Credit Model (GPCM) results [18]. The latter reduces to the Partial Credit Model [19] when discrimination parameters γk are constrained to 1 for all items.
On the other hand, the regression component models the relation between the latent SFK and the considered covariates, namely P(θ|X, Z), concurrently considering the hierarchical structure of data. In particular, we specify a random-intercept linear model [20] for the latent SFK:
where β0j is the random intercept accounting for the effect of region j on SFK, β and ζ are the vectors of regression coefficients regarding the effects of individual-level and regional-level covariates on the SFK, respectively. The values uj and eij are the normally distributed random effects indicating the error components at regional- and individual-level, respectively.
Thus, the complete specification of latent regression multilevel PCM can be expressed, in terms of logit, as:
Model parameters estimation was performed through the maximum marginal likelihood with adaptive Gaussian quadrature and Newton-Raphson iterative algorithm implemented in the GLLAMM routine [21] of STATA software.
In what follows, we first report the results of the multilevel PCM estimated without covariates, providing details about item difficulty parameters and regional ranking according to the SFK of their citizens. Second, we illustrate the findings of the latent regression multilevel PCM to shed light on the role of individual and regional features in explaining regional differences and individual-level heterogeneity regarding SFK.
The estimates related to the measurement part of the model, namely item-step parameters, are shown in Figure 3. It is possible to notice unordered item-step difficulty parameters for the majority of items, mainly related to the high unbalance between the first category (no knowledge) vs. the remaining ones (see Figure 2). Indeed, considering the item response category characteristic curves (IRCCCs; [22]), we have that the item-step difficulty parameters represent the point on the latent continuum where two consecutive IRCCCs cross each other [17]. Thus, starting from the observed result, we can derive that the characteristic curve of the first category dominates the remaining. In addition, this could also be a sign of the presence of redundant response categories, which are categories perceived as similar to the adjacent ones. Conversely, item FT9 shows the opposite behavior, presenting ordered item-step difficulty parameters and being the only item in which the observed frequency for category 1 is not modal in the considered sample.
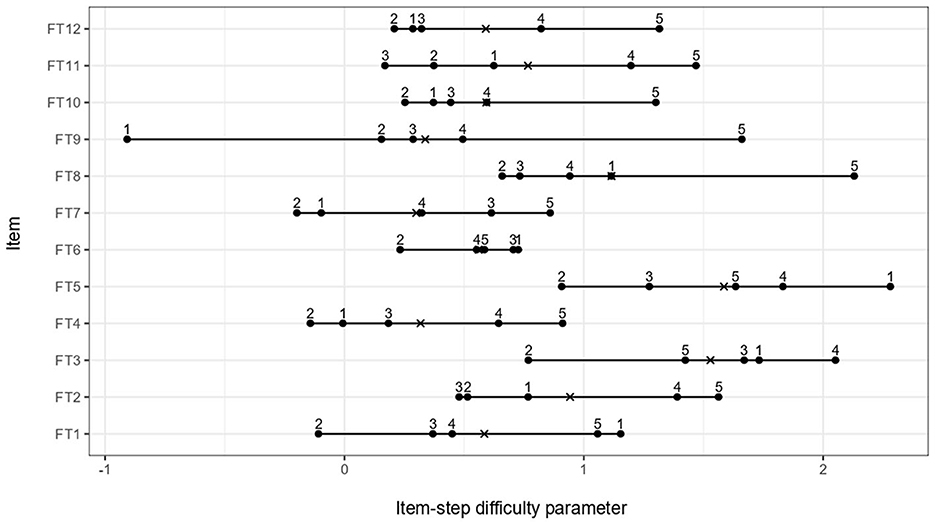
Figure 3. Estimates of item-step difficulty parameters for all items (FT1-FT12). The symbol × indicates the average item difficulty, whereas numbers indicate the steps.
In addition, average item difficulty (also called item location) provides some insights into the most widely known (less popular) digital financial services and tools. Looking at Figure 3, items FT7-FT9-FT4 emerged as the easiest items, indicating that Cloud computing, Artificial Intelligence and Instant payments are the most popular modern financial tools. On the other hand, the most difficult items (less popular services) are FT5 and FT3 referring to Roboadvisor and Instant insurance, respectively.
Regarding regional differences, the caterpillar plot in Figure 4 shows the ranking of the 10 considered Italian regions according to the estimates of second-level random effect uj (and the related 95% confidence interval), where increasing values of uj indicate increasing levels of SFK. Results reveal that the region of belonging weakly affects individual SFK, reporting overlapping confidence intervals for almost all regions except for Campania, Lombardia, and Veneto which are at the two extremes. In particular, individuals in the Campania and Lombardia regions present an SFK significantly worse than those belonging to the Veneto region.
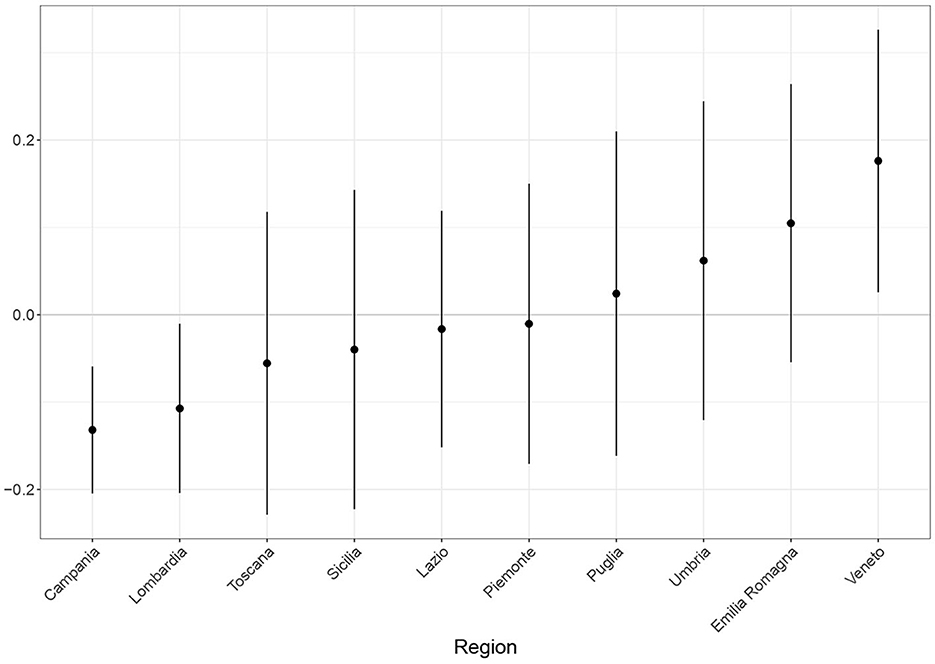
Figure 4. Caterpillar plot: Estimated second-level random effects with 95% confidence interval.
In the latent regression multilevel PCM, we added individual- and cluster-level covariates to have a deeper understanding of the differences observed in SFK. In particular, at the individual level, we included gender, age, educational level, field of study, occupational status, field of work, economic condition, knowledge of traditional financial tools (such as spreads and GDP), objective financial knowledge and numeracy. At the regional level, we entered the GVA in financial and insurance activities and the disposable income per capita.
The finally selected model encompasses all the covariates with significant estimated coefficients plus gender and second-level covariates. Figure 5 displays regression coefficients estimate for the covariates at the individual level. As can be seen, older participants exhibit a lower level of SFK, as can be expected. Additionally, FinTech literacy is particularly lacking for people with a Humanistic background of study. Also, individuals not specialized in a particular field of study or work reported a more impaired SFK. Conversely, those who have a better economic condition, possess greater familiarity with traditional financial instruments and are adept with numbers (numeracy) present higher SFK. Finally, surprisingly, no significant effect resulted for gender and regional-level covariates. It is worth noting that in latent regression multilevel PCM, regional gaps are even less substantive than those found in the model without covariates. Indeed, when covariates were added to the model, no significant differences between the estimates of second-level random effect uj emerged.
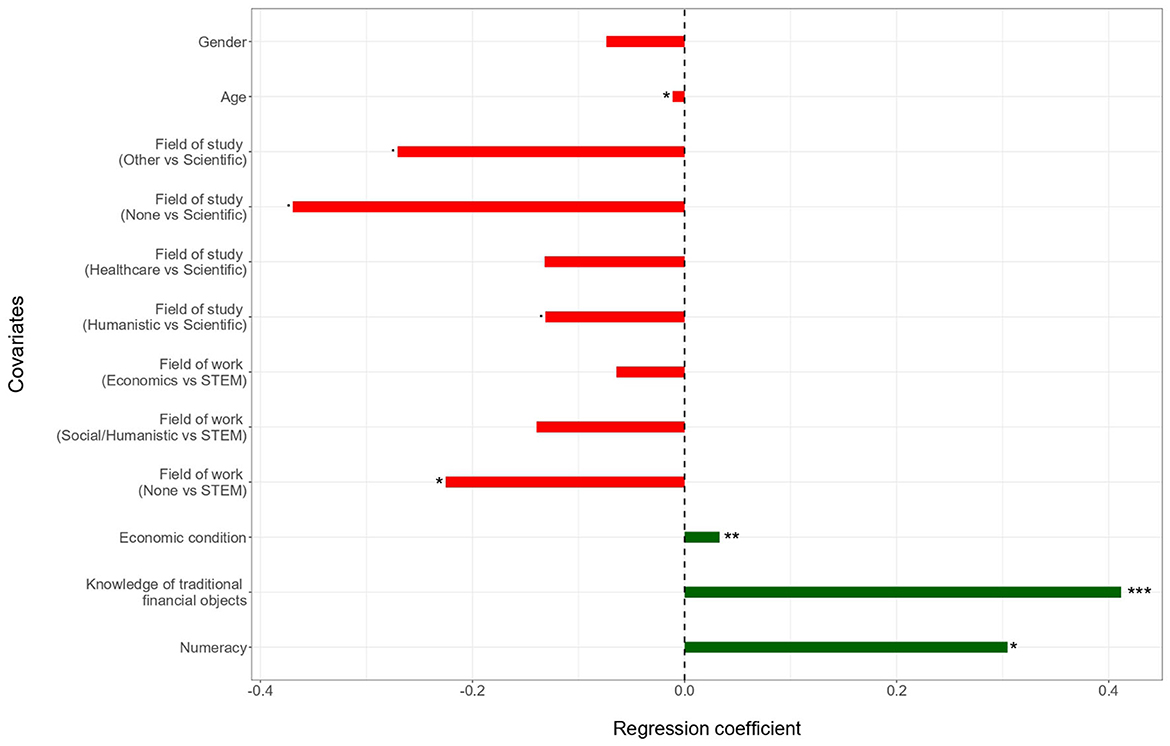
Figure 5. Latent regression multilevel PCM: Regression coefficients estimate for covariates at the individual level. Red bars indicate negative effects, whereas green bars denote positive effects. P-values are also reported: · p < 0.10; * p < 0.05; ** p < 0.01, *** p < 0.001.
The objective of the present study was to examine heterogeneity in SFK in the Italian context. Italy is significantly affected by the spread of digital technologies in financial intermediation. Even before the pandemic crisis, there had already been a gradual growth in the use of alternative payment instruments to cash, especially cards, both as a result of rapid technological development and regulatory interventions to support payment efficiency and security. The spread of the COVID-19 contagion has profoundly affected purchasing and payment habits, persistently intensifying the use of electronic payment solutions and contributing to reducing Italy's gap in comparison with other Eurozone countries in terms of the number of transactions per capita settled by means other than cash. There has been a gradual increase in online purchases, as well as greater relative use of the card at the POS, and rapid growth in contactless transactions, which have risen from 35% in the pre-lockdown period to more than 55% [23].
Since other studies about financial knowledge reported differences according to geographical macro-areas [24, 25], we accounted for regional differences by exploiting a multilevel approach. Indeed, we aimed to investigate if individual differences also reflect a regional-level difference in FinTech advancement. Based on the multilevel PCM model estimates, artificial intelligence (FT9) is the most popular modern financial tool, followed by cloud computing (FT7) and instant payments (FT4), while Instant insurance (FT3) and roboadvisor (FT5) are the most difficult items (less popular services). Results showed a weak regional effect, revealing that heterogeneity in SFK can be mainly attributed to individual characteristics. In particular, we observed that older people reported lower levels of SFK (in line with what is reported in Jünger and Mietzner [26], Nguyen [27], Choudrie et al. [28]). This result confirms what is highlighted in Hauk et al. [29] regarding older customers who are less prone to use new technological devices and services. Indeed, as pointed out in [30, 31], younger people are more curious (and skilled) about digital innovations, whereas older individuals experience more technological discomfort. Economic conditions also proved to have a significant influence on individual SFK, contributing to techno-financial inequality. In this vein, research on digital financial capability and wellbeing (see [32, 33] among others) underlined that the digital divide due to socio-economic status also forecloses disadvantaged people from access to various forms of digital finance technologies [34]. As a consequence, low family income correlates with poor knowledge of FinTech instruments and a lacking capability to utilize them for financial management. Low affinity with numbers (numeracy) also represents a barrier to digital financing. The literature generally reports a strong relation between numeracy and financial literacy, see [35–37] among others. Indeed, lowly numerate consumers often make bad economic choices because of erroneous calculations, such as a mistaken evaluation of percentage changes [38]. Our results confirm this relation even in the modern FinTech context.
In Italy (and, more in general, in other EU countries [39–41]), many students receive inadequate financial literacy education prior to entering the workforce. This negative effect is more evident for those who were not enrolled in a STEM course, since they usually have less financial and mathematical literacy, and therefore, more difficulties in understanding even the traditional financial products [24, 42]. The negative effects registered for respondents who have a weak (or no) familiarity with STEM professions and/or scientific instruction support the above discussion. On the other hand, respondents that declare a deeper understanding of traditional financial topics, such as the financial crisis, sustainable finance, quantitative easing and purchasing power, present higher SFK scores. This research also evidenced a non-significative gender bias in SFK. Although this result may be initially surprising, it is in line with some recent findings in literature [9], supporting that FinTech adoption significantly improves female employment and reduces gender inequality.
The results provide insights regarding predictors of individual differences in SFK, which can inspire policymakers' actions with the aim of increasing financial literacy in the population. In particular, this research firstly implies that policymakers should improve the population awareness of less popular FinTech tools, such as instant insurance and roboadvisor. Moreover, as highlighted in the bibliometric analysis, researchers also should turn their attention more toward less-known FinTech services (e.g., instant insurance) to further enrich the discussion on the use and implications of these tools, for example posing them in the financial inclusion debate. The second implication is that individuals' literacy about numbers and traditional financial tools is expected to have a greater influence in explaining FinTech knowledge differences compared to socio-demographic characteristics such as region of belonging and gender. Such financial basic knowledge should be introduced in the secondary school curricula, reducing a subsequent potential impairment in favor of people enrolled in the STEM field of study (or work). In this regard, the results from the OECD survey on students' financial literacy [43] report that about 21% of students in Italy did not reach the baseline level of proficiency and that generally students obtain information about money matters from their parents, highlighting the need for a deeper involvement of school in fostering financial literacy. Third, the weak regional differences support national homogeneity in FinTech advancement and concurrently trigger new questions about national differences in an international scenario where different regulatory frameworks and restrictions can affect the growth of FinTech.
We recognize that our study has various limitations to consider, particularly in terms of sampling and response bias. Firstly, we considered a convenience sample, making it difficult to generalize the results obtained to the general reference population. In addition, the sample shows a regional unbalance that does not reflect the real population distribution among the regions. Secondly, the use of online self-report measures might affect response quality. Despite these limitations, our study merits attention because, to our knowledge, no previous research has investigated the effects of regional differences on the knowledge levels of FinTech tools in Italy from a multilevel perspective. A probabilistic sampling conducted in a more appropriate way, i.e., taking into account the regional strata, would positively affect the consistency of the estimates. Moreover, as a further improvement of this work, response bias can be addressed by exploiting latent trait models that extend the PCM to account for responders' response styles and uncertainty [44, 45]. In conclusion, a possible extension of this study to a more general population (e.g. European countries) can prove the validity and reliability of the findings in an international dimension to discover whether similar behaviors occur in other nations.
The raw data supporting the conclusions of this article will be made available by the authors, without undue reservation.
Ethical approval was not required for the studies involving humans because data used in this work are part of the survey on Knowledge and Use of Fintech Products belonging to the European project CA19130 Fintech and Artificial Intelligence in Finance. The studies were conducted in accordance with the local legislation and institutional requirements. The participants provided their written informed consent to participate in this study.
RF: Conceptualization, Data curation, Formal analysis, Investigation, Methodology, Software, Validation, Visualization, Writing—original draft. LP: Conceptualization, Data curation, Formal analysis, Investigation, Methodology, Software, Validation, Visualization, Writing—original draft. All authors contributed to the article and approved the submitted version.
The author(s) declare that no financial support was received for the research, authorship, and/or publication of this article.
The authors would like to thank the Prize Judging Committee of the FinTech contest4 Best WI-FI 2023 Young Researcher Paper for choosing this contribution for the first prize.
The authors declare that the research was conducted in the absence of any commercial or financial relationships that could be construed as a potential conflict of interest.
All claims expressed in this article are solely those of the authors and do not necessarily represent those of their affiliated organizations, or those of the publisher, the editors and the reviewers. Any product that may be evaluated in this article, or claim that may be made by its manufacturer, is not guaranteed or endorsed by the publisher.
1. ^“FinTech Action plan: For a more competitive and innovative European financial sector”, COM/2018/0109.
2. ^Source: www.cost.eu/actions/CA19130.
3. ^Source: www.webofscience.com/wos/woscc.
4. ^Source: https://fin-ai.eu/womeninfintech2023/.
1. Hanelt A, Bohnsack R, Marz D, Antunes Marante C. A systematic review of the literature on digital transformation: insights and implications for strategy and organizational change. J Manage Stud. (2021) 58:1159–97. doi: 10.1111/joms.12639
2. Omarini A. FinTech: a new hedge for a financial re-intermediation. Strategy and risk perspectives. Front Artif Intell. (2020) 3:63. doi: 10.3389/frai.2020.00063
3. Robb CA, Woodyard A. Financial knowledge and best practice behavior. J Fin Counsel Plan. (2011) 22:60–70.
4. Barroso M, Laborda J. Digital transformation and the emergence of the Fintech sector: systematic literature review. Digit Bus. (2022) 2:100028. doi: 10.1016/j.digbus.2022.100028
5. Grohmann A, Menkhoff L. The relationship between financial literacy and financial inclusion. In: DIW Berlin Discussion Paper (Berlin). (2020).
6. Lusardi A, Mitchell OS. Financial literacy around the world: an overview. J Pension Econ Fin. (2011) 10:497–508. doi: 10.1017/S1474747211000448
7. Khera P, Ogawa S, Sahay R, Vasishth M. Women in Fintech: as leaders and users. IMF Working Paper (Washington, DC). (2022).
8. Guo Q, Chen S, Zeng X. Does FinTech narrow the gender wage gap? Evidence from China. China World Econ. (2021) 29:142–66. doi: 10.1111/cwe.12382
9. Loko MB, Yang Y. Fintech, Female Employment, and Gender Inequality. International Monetary Fund (2022).
10. Fox JP, Glas CA. Bayesian estimation of a multilevel IRT model using Gibbs sampling. Psychometrika. (2001) 66:271–88. doi: 10.1007/BF02294839
11. Cokely ET, Galesic M, Schulz E, Ghazal S, Garcia-Retamero R. Measuring risk literacy: the Berlin numeracy test. Judgment Decis Mak. (2012) 7:25–47. doi: 10.1017/S1930297500001819
12. Aria M, Cuccurullo C. bibliometrix: an R-tool for comprehensive science mapping analysis. J Informetr. (2017) 11:959–75. doi: 10.1016/j.joi.2017.08.007
13. Traag VA, Waltman L, Van Eck NJ. From Louvain to Leiden: guaranteeing well-connected communities. Sci Rep. (2019) 9:5233. doi: 10.1038/s41598-019-41695-z
14. Hambleton RK, Swaminathan H. Item Response Theory: Principles and Applications. New York, NY: Springer Science & Business Media (2013).
15. Stapleton LM, McNeish DM, Yang JS. Multilevel and single-level models for measured and latent variables when data are clustered. Educ Psychol. (2016) 51:317–30. doi: 10.1080/00461520.2016.1207178
16. Agresti A. Analysis of Ordinal Categorical Data. vol. 656. New Jersey, NJ: John Wiley & Sons (2010).
17. Bartolucci F, Bacci S, Gnaldi M. Statistical Analysis of Questionnaires: A Unified Approach Based on R and Stata. vol. 34. Boca Raton, FL: CRC Press (2015).
18. Muraki E. A generalized partial credit model: application of an EM algorithm. Appl Psychol Meas. (1992) 16:159–76.
20. Hedeker D. Multilevel models for ordinal and nominal variables. In: de Leeuw J, and Meijer E, editors. Handbook of Multilevel Analysis. New York, NY: Springer (2008). p. 237–274.
21. Rabe-Hesketh S, Skrondal A, Pickles A. GLLAMM Manual. University of California, Berkeley, CA (2004).
23. Perrazzelli A. L'accelerazione digitale del sistema finanziario: nuove sfide per il mercato e per le autorità. Bank of Italy, Eurosystem (2021). Available online at: http://www.bancaditalia.it/pubblicazioni/interventi-direttorio/int-dir-2021/Perrazzelli_accelerazione_digitale_sistema_finanziario_25022021.pdf
24. Levantesi S, Zacchia G. Machine learning and financial literacy: an exploration of factors influencing financial knowledge in Italy. J Risk Fin Manage. (2021) 14:120. doi: 10.3390/jrfm14030120
25. D'Alessio G, De Bonis R, Neri A, Rampazzi C. Financial literacy in Italy: the results of the Bank of Italy's 2020 survey. Polit Econ. (2021) 37:215–52. doi: 10.1429/102932
26. Jünger M, Mietzner M. Banking goes digital: the adoption of FinTech services by German households. Fin Res Lett. (2020) 34:101260. doi: 10.1016/j.frl.2019.08.008
27. Nguyen TAN. Does financial knowledge matter in using fintech services? Evidence from an emerging economy. Sustainability. (2022) 14:5083. doi: 10.3390/su14095083
28. Choudrie J, Junior CO, McKenna B, Richter S. Understanding and conceptualising the adoption, use and diffusion of mobile banking in older adults: a research agenda and conceptual framework. J Bus Res. (2018) 88:449–65. doi: 10.1016/j.jbusres.2017.11.029
29. Hauk N, Hüffmeier J, Krumm S. Ready to be a silver surfer? A meta-analysis on the relationship between chronological age and technology acceptance. Comput Hum Behav. (2018) 84:304–19. doi: 10.1016/j.chb.2018.01.020
30. Berkowsky RW, Sharit J, Czaja SJ. Factors predicting decisions about technology adoption among older adults. Innovat Aging. (2017) 1:igy002. doi: 10.1093/geroni/igy002
31. Blut M, Wang C. Technology readiness: a meta-analysis of conceptualizations of the construct and its impact on technology usage. J Acad Market Sci. (2020) 48:649–69. doi: 10.1007/s11747-019-00680-8
32. Choi NG, DiNitto DM. The digital divide among low-income homebound older adults: internet use patterns, eHealth literacy, and attitudes toward computer/Internet use. J Med Internet Res. (2013) 15:e93. doi: 10.2196/jmir.2645
33. Anvari-Clark J, Ansong D. Predicting financial well-being using the financial capability perspective: the roles of financial shocks, income volatility, financial products, and savings behaviors. J Fam Econ Issues. (2022) 43:730–43. doi: 10.1007/s10834-022-09849-w
34. Boamah EF, Murshid NS, Mozumder MG. A network understanding of FinTech (in) capabilities in the global South. Appl Geogr. (2021) 135:102538. doi: 10.1016/j.apgeog.2021.102538
35. Graffeo M, Polonio L, Bonini N. Individual differences in competent consumer choice: the role of cognitive reflection and numeracy skills. Front Psychol. (2015) 6:844. doi: 10.3389/fpsyg.2015.00844
36. Sunderaraman P, Barker M, Chapman S, Cosentino S. Assessing numerical reasoning provides insight into financial literacy. Appl Neuropsychol Adult. (2022) 29:710–17. doi: 10.1080/23279095.2020.1805745
37. Skagerlund K, Lind T, Strömbäck C, Tinghög G, Västfjäll D. Financial literacy and the role of numeracy–How individuals' attitude and affinity with numbers influence financial literacy. J Behav Exp Econ. (2018) 74:18–25. doi: 10.1016/j.socec.2018.03.004
38. Chen H, Rao AR. When two plus two is not equal to four: errors in processing multiple percentage changes. J Cons Res. (2007) 34:327–40. doi: 10.1086/518531
39. Hadzic M, Poturak M. Students perception about financial literacy: case study of International Burch University. Eur Res. (2014) 77:1155–66. doi: 10.13187/issn.2219-8229
40. Mavlutova I, Sarnovics A, Armbruster C. Financial Literacy of Young Generation in Changing European Environment: Evidence from Germany Latvia. (2015). TIIM. Available online at: http://www.toknowpress.net
41. Clichici D, Moagăr-Poladian S. Financial literacy, economic development and financial development: a cross-country analysis. Roman J Eur Aff. (2022) 22:35–49.
42. Lusardi A. Financial literacy and the need for financial education: evidence and implications. Swiss J Econ Stat. (2019) 155:1–8. doi: 10.1186/s41937-019-0027-5
43. OECD. PISA 2018 Results (Volume IV) (2020). Available online at: https://www.oecd/ilibrary.org/content/publication/48ebd1ba/en
44. Tutz G, Schauberger G, Berger M. Response styles in the partial credit model. Appl Psychol Meas. (2018) 42:407–27. doi: 10.1177/0146621617748322
Keywords: FinTech, financial products, financial literacy, latent variable models, multilevel IRT model
Citation: Fabbricatore R and Palazzo L (2023) Multilevel IRT models to explore heterogeneity in subjective financial knowledge at individual and regional levels: the Italian case. Front. Appl. Math. Stat. 9:1278146. doi: 10.3389/fams.2023.1278146
Received: 15 August 2023; Accepted: 18 September 2023;
Published: 04 October 2023.
Edited by:
Joerg Osterrieder, University of Twente, NetherlandsReviewed by:
Viorela-Ligia Vaidean, Babeş-Bolyai University, RomaniaCopyright © 2023 Fabbricatore and Palazzo. This is an open-access article distributed under the terms of the Creative Commons Attribution License (CC BY). The use, distribution or reproduction in other forums is permitted, provided the original author(s) and the copyright owner(s) are credited and that the original publication in this journal is cited, in accordance with accepted academic practice. No use, distribution or reproduction is permitted which does not comply with these terms.
*Correspondence: Rosa Fabbricatore, cm9zYS5mYWJicmljYXRvcmVAdW5pbmEuaXQ=
Disclaimer: All claims expressed in this article are solely those of the authors and do not necessarily represent those of their affiliated organizations, or those of the publisher, the editors and the reviewers. Any product that may be evaluated in this article or claim that may be made by its manufacturer is not guaranteed or endorsed by the publisher.
Research integrity at Frontiers
Learn more about the work of our research integrity team to safeguard the quality of each article we publish.