 Md. Ahsan Kabir
 Yu Liping
 Sanjoy Kumar Sarker
 Md. Nahiduzzaman
 Tanmay Borman
94% of researchers rate our articles as excellent or good
Learn more about the work of our research integrity team to safeguard the quality of each article we publish.
Find out more
ORIGINAL RESEARCH article
Front. Appl. Math. Stat., 05 December 2023
Sec. Mathematical Finance
Volume 9 - 2023 | https://doi.org/10.3389/fams.2023.1271485
The main goal of this study is to examine the return explanation strengths of the Carhart four-factor, the Fama–French three-factor, and the single-factor models in the context of the Bangladeshi stock market. We, therefore, reveal the risk-adjusted returns, test the valuation capability of multi-factor models, and estimate optimal portfolio weights of stocks listed in DSE under the DSE30 index. Our findings demonstrate that large capitalization firms that have low or medium book-to-market (B/M) ratios produce more concentrated returns than their counterparts, resulting in greater earnings per unit of total, systematic, and downside risks. Furthermore, we discover that each factorial value has an impressive capacity to explain the market excess returns; however, the influence of factor values on the cross-section of stock returns is somewhat contradictory. In particular, the momentum factor is unable to describe the cross-section excess returns, whereas the risk premium, size, and value factors have a significant impact on the cross-section excess returns. Finally, we find that a large-cap firm with a low B/M ratio is suitable for risk-seeking investors; in contrast, a small-cap firm with a low B/M ratio is appropriate for lower risk tolerance investors. Moreover, our empirical outcomes have noteworthy implications for private companies, investors, and policymakers.
The Dhaka Stock Exchange (DSE) has grown to be a major participant in the global financial landscape, enticing both domestic and foreign investors searching for possible opportunities in the Bangladeshi stock market. As the DSE continues to develop and gains a reputation, explaining the characteristics of changing prices becomes essential for investors to make well-informed decisions and handle risks effectively. Shahi et al. (1) denoted that understanding the behaviors of the stock market is an essential activity not only in the context of the local stock market but also in the context of the global financial market.
Furthermore, in recent years, understanding behavioral changes of the stock return and making purchasing and buying decisions have gained significant attention in the stock market literature, due to the increasing number of unexpected events affecting the portfolios of investors. The portfolio theory developed by Markowitz (2) states that investors diversify their investments depending on the relationship between risk and return. According to the fundamental theory of Markowitz (2), Treynor (3, 4), Sharpe (5), Lintner (6), and Mossin (7) introduced the theory of the capital asset pricing model (CAPM). It is stated that when deciding which assets to include in a well-diversified portfolio, the CAPM model is applied to estimate the excess rate of return of assets. In essence, the CAPM is viewed as a single-factor model that explains a normal linear association between the expected return and market portfolio risk of an asset. However, the CAPM has undergone several refinements over the years, leading to the development of multi-factor models that attempt to identify additional sources of risk and return. Specifically, there are some drawbacks to the single-factor CAPM model since this model relies on a set of simplifying assumptions that may not fully capture the complexities of real-world financial markets (8–13). These assumptions include an efficient market, a linear relationship between returns and systematic risk, constant betas over time, and constant risk-free rates. In reality, markets may not always be perfectly efficient, investors may have varying degrees of access to information, betas can change as a result of changing market conditions or company-specific factors, and the risk-free rate can be influenced by government policy and market conditions. Later, with the addition of size risk (small-cap minus large-cap, or SMB) and value risk (high book value-to-market price ratio minus low book value-to-market price ratio, or HML) factors to the market risk factor in the capital asset pricing model (CAPM), Fama and French (11) invented the three-factor model that extends the capabilities of the earlier model. After that, Jegadeesh and Titman (14) found the role of the momentum factor in explaining cross-section returns in a better way, and successively, Carhart (15) created a four-factor model by incorporating the momentum factor into the Fama–French three-factor model in portfolio management. They thought that the momentum factor accurately measures the variations in returns across stocks with high and low historical earnings.
The Sharpe–Lintner capital asset pricing model (CAPM), the Fama–French three-factor model, and the Carhart four-factor model have all been deemed sufficient to illustrate the cross-sectional volatility in equity returns and market discrepancies (16). In the existing literature, many researchers [e.g. (17–24)] confirmed the presence of size and value factors in global capital markets, which validated the three-factor model. Furthermore, several other studies [(e.g., 25–28)] tested the presence of the momentum factor in the valuation of the cross-section return. Meanwhile, subsequent investigations attempt to determine the usefulness of the aforementioned multi-factor models from the perspective of several categories of financial markets, both at the regional level and the international level.
While the Dhaka Stock Exchange (DSE) is the leading stock exchange in Bangladesh, investors face tremendous problems due to the market manipulation caused by actions carried out by individuals or groups to artificially influence the price or trade volume of security and create a false perception of market conditions. However, the Bangladesh Securities and Exchange Commission (BSEC) has installed expensive surveillance software and imposed penalties on certain manipulators. According to the investigation decision of BSEC, a deputy registrar of the Department of Cooperatives and his associate have recently been fined Tk 5.25 crore for manipulating the stocks of NRB Commercial Bank and Fortune shoes.1 In addition to this issue, a substantial portion of investors have been suffering and failing to diversify their investments in the promising asset classes due to unpredictable market circumstances, high costs of making investments, and unanticipated volatility. During January and February of 2023, investors lost nearly a third of their investments in different kinds of equities, and DSE turnover has decreased to less than Tk 250 crore due to the restrictive regulatory policies.2 Moreover, various economic catastrophes, such as the COVID-19 pandemic (29) and the Russian-Ukrainian invasion (30), had a major and detrimental impact on the stock market of Bangladesh. For those consequences, it is estimated that several unfavorable practices and unexpected events affected the stock market of Bangladesh, deteriorating the decision of the investors and undermining its overall integrity. Therefore, it is essential to develop precise measurements so that stock market investors in Bangladesh can correctly plan their portfolios and make optimal purchasing and selling decisions at the right moment.
A number of asset pricing models, namely, single-factor model, three-factor model, and four-factor model, have been constructed by academicians around the world to determine the value of stocks and explain cross-sectional stock returns. However, in the context of Bangladesh, such types of investigations are incredibly minimal. A few researchers [(e.g., 31–34)] tested the valuation capabilities of Fama–French three-factor model from the perspective of the Bangladeshi stock market. They assessed the impact of size and value parameters on the cross-section stock return. Furthermore, the valuation capacities of the single-factor CAPM (35, 36) and the Carhart four-factor model (37) are also investigated, but the authors considered only non-financial institutions listed in DSE. Moreover, the impact of the momentum factor on the return of financial institutions listed in DSE has yet to be explored. In addition, comparing the efficiency between single-factor, three-factor, and four-factor models in explaining the cross-section return considering both financial and non-financial institutions has drawn important ramifications in the existing literature since investors in each category continuously search for better alternatives to understand the characteristics of changing returns. Furthermore, after assessing the effectiveness of multi-factor models, we have not identified any evidence of portfolio weight optimization that could aid investors in making capital allocation decisions.
While the aforementioned models have been widely studied in various financial markets, their valuation capabilities and applicability to specific contexts require further empirical investigation. Therefore, to the best of our knowledge, our study is very comprehensive in regard to the current literature as we look for answers to five research questions that may provide noteworthy implications for the investors and policymakers of the Dhaka stock exchange (DSE). First, what are the risk-adjusted performances (measured by Sharpe ratio, Treynor ratio, Jensen’s alpha, and Sortino ratio) of companies listed in DSE under the DSE30 index? Second, do the volume of capitalization and the deviation between the book value-to-market value ratios of capital affect the volatility of the returns? Third, do the single-factor, Fama–French three-factor, and Carhart four-factor models have the efficiency to explain the excess returns of investors, if yes, then is there any effectiveness-differentiation across the models? Fourth, what is the impact of risk, size, value, and momentum factors on the cross-section excess returns? Finally, what are the proportions in formulating optimal portfolios that minimize the total risk and maximize the Sharpe ratio of the investors?
To address the mentioned questions, the findings of our study demonstrate that the large-cap firms with low B/M ratios have consistent returns with a skilled fund manager, and except for the momentum factor, the remaining three factors have adequate ability to explain the returns of DSE stocks. In addition, our study also finds that small-cap firms with low B/M ratios provide optimal benefits by reducing the lowest total risk of investment while large-cap firms with the same B/M ratios offer optimal weights in the portfolios by increasing the maximum Sharpe ratio.
The following are the remaining sections of the study: The existing literature is reviewed in Section 2, Section 3 displays the data and methodology, the analysis and interpretations of the results are reported in Section 4, and finally, Section 5 represents the concluding remarks with implications.
A comprehensive overview of the current capital asset pricing model literature is presented in this part, with a focus on the Carhart four-factor model, the Fama–French three-factor model, and the single-factor model both in the context of Bangladesh and on a worldwide scale.
In the earliest version of the capital asset pricing model (CAPM), known as the single-factor CAPM, Sharpe (5) and Lintner (6) stated that investors are solely rewarded for taking systemic risk. As a result, this approach primarily employs beta to calculate non-diversifiable risk. However, the single-factor CAPM is empirically incoherent in a number of ways (8–12, 16), most notably with the size effect (8, 38, 39), and value effect (40). Banz (8) argued that considering the beta estimations, on the one hand, mean returns on large-cap stocks are excessively low, and on the other hand, mean returns on small-cap stocks are extremely high. Furthermore, Bhandari (41) demonstrated a disputation that the single-factor model does not capture the leverage risk, although leverage risk is associated with the expected rate of return and in investigations that take into account the size of the stock and beta, it assists in explaining the cross-section of the mean returns on equities. In experiments that also take size and market beta into account, Basu (10) illustrated that earnings–price ratios (E/P) contribute to the explanation of the cross-section of average returns on United States companies.
Corresponding to these arguments, previous literature [(e.g., 42, 43),] observed that there is a positive correlation between the expected return on United States stocks and the ratio of book value to market value of a company’s shares. Subsequently, Chan and Chen (44) also discovered the same findings in Japanese stocks. Finally, Fama and French (11) created the three-factor CAPM model, which expands the capacity of the original model, by adding two factors, namely, the size factor and the ratio of the book-to-market value of equity (value) factor. Later, the value effect (45–48) and size effect (49–51) on the cross-section stock return are proved in several financial markets around the world.
Empirically, Drew and Veeraraghavan (18) investigated the ability of size and value premium to explain the price of stocks listed in the Kuala Lumpur Stock Exchange and found a powerful illustrative capacity since while the market offers an annual return of 1.92%, two resemblance portfolios—SMB and HML—produce annual returns of 17.70 and 17.69%, respectively. In addressing the limitations of study of Halliwell (52), Gaunt (20) examined the pricing ability of the Fama–French three-factor model in the Australian stock market. They discovered that the three-factor model had much explanatory supremacy. Furthermore, to clarify the disparity in implied costs associated with equity, Mishra and O’Brien (53) compared the efficiency of CAPM and the Fama–French three-factor model using 33,301 U.S. stock samples and detected better performance from the Fama–French model.
However, Urbański (54) suggested a change to the Fama–French three-factor framework that takes into consideration the regional price border conditions. He noted that the spillover effect of an event from a country affects the effectiveness of the Fama–French model in another country. In addition, the reliability of the Fama–French three-factor model also fluctuates according to the economic status of a country (55) since several studies—Hearn and Piesse (56), Hearn (57), and Benali et al. (58)—examined the usefulness of the three-factor model in explaining the cross-section of stock return in some stock markets in Africa and revealed a few different findings. Specifically, according to Hearn (57), the impact of size was far greater in Egypt and Tunisia than it was in Morocco. In addition, this finding is further supported by Benali et al. (58), who concluded that the excess return of equities in Moroccan markets is not explained by market, size, or value factors. Furthermore, in five growing economies in the Pacific Basin, Chui, and Wei (59) looked at the connections between stock returns, the beta of the market, book-to-market equity (B/M), and size. They found that in spite of having a weak association between mean return and beta, on the one hand, the B/M equity explains the variability of average cross-section return in the stock market of Malaysia, Hong Kong, and Korea, and on the other hand, the impact of size is notable in all stock markets, except in Taiwan.
In United States stock returns, Jegadeesh and Titman (14) showed the influence of momentum and addressed the fact that equities that have performed well during the previous year typically continue to do so in the next year. After that, employing a sample devoid of survivor bias, Carhart (15) proved the capacity of typical factors in returns on stocks and investment costs to explain the average and risk-adjusted earnings of mutual funds and added momentum factor in Fama–French three-factor model. He discovered that of an 8% yearly return, deviations in the value of market and stock momentum explain 4.6%, whereas fluctuations in expenditure ratios and spending on transactions only account for 0.7 and 1% return, respectively. Subsequently, the capacity of the momentum factor along with earlier factors in explaining the returns of stocks is tested in several studies [(e.g., 46, 47, 60)].
In the context of Bangladesh, the evidence of the impact of multi-factor models in describing the variation of cross-section returns is documented but insufficiently explained; hence, there is a potential scope to enrich the current literature. Mostafizur et al. (34, 61) looked at how well the Fama–French three-factor model could describe the link between risk and expected returns of 123 non-financial companies listed in the Dhaka stock exchange (DSE). Using multiple regression analysis and complying data ranging from 1999 to 2003, they showed that there is a strong association between factor values beta, book-to-market value, and size and stock return. Furthermore, Hasan et al. (32) investigated the ability of the Fama–French three-factor model in explaining the cross-section stock return of DSE and found that the prior result—factor values have a strong power in explaining the expected return. In addition, Mobarek and Mollah (33) revealed that additional factors such as share volume, revenue yield, and yield of cash flow also pose a big impact on share returns in DSE-listed companies. Considering the data of non-financial institutions in DSE, Khan and Fahim (37) added the power of the momentum factor in explaining the stock returns and found favorable results. However, Hasan et al. (35) exposed that the CAPM is an inappropriate strategy to explain the asset price of non-financial businesses listed in DSE using a hypothesis test with OLS regression. Meanwhile, they assessed the validity of the CAPM framework in DSE adopting an extended data period from 2005 to 2009 and a sample of 80 non-financial companies. Furthermore, Chowdhury and Sharmin (31) studied the variables that could affect the cross-section stock returns of listed companies in DSE. They investigated eight distinct variables and observed that they do not describe the cross-section of returns on shares.
After proper assessments of the aforementioned literature, a number of essential properties could be drawn to enrich the existing literature. First, most of the researchers tested and discussed the ability of multiple-factor models (e.g., single-factor, Fama–French three-factor, and Carhart four-factor models) in explaining the general mean returns or cross-section stock returns in several stock markets. However, the diagnosis of risk-adjusted returns and the optimal portfolio weights according to the market cap and B/M ratios of the firms are missing in the current literature. Second, while there is considerable ground to evaluate the ability of the same factor values in describing returns on market as well as cross-section portfolio returns, the above literature either concentrated on explaining the ability of factor models in expected/excess market returns or focused on cross-section stock mean/excess returns. Third, in the perspective of Bangladesh, a few studies have been conducted to show the capacity of multi-factor models in describing the returns, and the majority of them considered only the data of non-financial institutions; however, financial institutions are the strong player in the market, having 33% capitalization out of total capital in DSE (32).
Moreover, to fulfill the above gaps in the literature, our study will assess the effectiveness of various factor models in explaining the market and cross-section excess returns of DSE-listed companies, including both financial and non-financial institutions. Furthermore, we will compute the risk-adjusted returns and the optimal portfolio weights based on the market capitalization and book-to-market value ratios of the companies.
We consider monthly stock prices of 30 companies under the DSE30 index listed in the Dhaka Stock Exchange (DSE). The DSE 30 Index is a benchmark stock market index that represents the performance of the top 30 companies listed on the Dhaka Stock Exchange. It is designed to include the 30 largest and most actively traded stocks on the DSE, often referred to as blue-chip stocks. According to the criteria set forth by the Dhaka Stock Exchange (DSE) for the DSE30 Index, companies with a float-adjusted market capitalization of TK. 50 crores or more as of the rebalancing reference date are eligible for inclusion in the DSE30 Index.3 However, the DSEX index serves as a comprehensive measure of Bangladesh’s stock market performance, providing insights into the overall status and trajectory of the country’s stock exchange. Regarding the inclusion criteria for DSE-listed companies including Islami Shariah-based firms, those with a float-adjusted market capitalization exceeding TK. 10 crores are considered for index membership. In certain circumstances, if a constituent’s current market capitalization falls below the TK. 10 crores threshold but remains above TK. 7 crores, these companies may still retain their positions within the . Our preference for the DSE30 index as our sample is primarily driven by our focus on larger, well-established, and traditionally stable companies. This index tends to exhibit lower levels of risk when compared to broader indices. This choice allows us to effectively and comprehensively assess the pricing capabilities of multi-factor models, both in explicit and implicit terms, within the context of the Bangladeshi stock market. In this study, data periods, ranging from 2013 to 2022, are considered, and datasets place restrictions on our sample size and beginning point based on their availability. All the data were collected from www.investing.com. Initially, we classify the 30 companies according to their market capitalization volume,4 namely, small-capitalized companies and large-capitalized companies, and after that, we further split them in terms of book-to-market (B/M) value ratio5 such as low B/M ratio, medium B/M ratio, and high B/M ratio. Finally, we compute the monthly return of each sample company.
To compute the risk-adjusted returns of the studied variables, we use four risk adjustment techniques, namely, Sharpe ratio, Treynor ratio, Jensen’s alpha, and Sortino ratio. The definition and econometric formula of these techniques are represented below:
Sharpe ratio, originated by Sharpe (5, 62), is used to measure the performance of an investment considering its return volatility. According to the rule of thumb, a positive ratio indicates the average return is higher than the risk-free rate; furthermore, the higher the ratio, the more return an investor can generate per unit of risk-taking. The estimated formula is as follows:
where indicates the average return of security , represents the daily average risk-free rate, and is the standard deviation of index return to measure the volatility.
Treynor ratio, developed by Treynor (63), measures the performance of a security considering the systematic risk of that security. It is similar to the Sharpe ratio with the exception that it considers market risk instead of security’s total risk volatility. As with the Sharpe ratio, a higher ratio indicates better investment. The proposed formula is given below:
where and are characterized as above, and indicates the systematic risk of index .Jensen’s alpha, proposed by Jensen (64), is used to calculate the additional return from security compared to the expected return recommended by CAPM. The positive alpha value indicates there is a chance to add value to this respective security. The regression formula below is used to compute the Jensen’s alpha value.
Therefore,
where denote daily return, risk-free rate, and portfolio market return (benchmark index), respectively, and coefficient represents the index’s systemic risk.
The Sortino ratio is a financial metric used to evaluate the risk-adjusted return of an investment or portfolio (65). It is an enhancement of the Sharpe ratio and focuses specifically on downside risk. In other words, it focuses on how well an investment performs relative to its downside risk or volatility. The Sortino ratio is named after its developer, Frank A. Sortino.
where represents the average return of the portfolio or investment over a specific period, indicates the daily average risk-free rate, and is the standard deviation of the return of portfolio that falls below the risk-free rate (i.e., negative returns).
The simplest type of return estimating model, where only one element is taken into account, is the single-factor model. After the work of Markowitz (2) was completed, Sharpe (5) and Lintner (6) developed the capital asset pricing model (CAPM). The estimation model is given as follows:
where represents the risk-free rate, indicates the risk premium, and is the market portfolio return. The systematic risk is denoted by β, deriving from , and denotes the error term.
The estimated regression model considering the single-factor model is illustrated by the following equation:
where represents the excess rate of return for the firm i at time t, is the intercept term, states the regression coefficient, and and show the risk premium and the error term, respectively.
In addition to the market risk element, Fama and French (11) also incorporated size risk and value risk factors in their capital asset pricing model (CAPM). In the next section, the three-factor valuation model and its associated regression model are given:
where the extra terms, namely, and , indicate the size factor (returns of small-cap firms minus returns of large-cap firms) and value factor (return of high B/E ratio firms minus return of low B/E ratio firms), respectively.
The Carhart four-factor model is an extended form of the CAPM two-factor model and the Fama–French three-factor model. Carhart (15) added a momentum factor to the three-factor model. The root equation is given as follows, followed by the corresponding regression model:
Here, the extra added term MOM denotes the momentum factor (return of the best-performing firms minus the return of the lowest-performing firms, lagged 1 month).
Table 1 illustrates the descriptive statistics of excess return (ERN) along with four asset pricing parameters, namely, risk premium (RPM), size factor (SMB), value factor (HML), and momentum factor (MOM), and six cross-section market portfolio returns such as large/high (B/H), large/low (B/L), large/medium (B/M), small/high (S/H), small/low (S/L), and small/medium (S/M) firms. The outcomes show that the average market excess return is negative with a value of −4.773%, while the return from the momentum factor is positive with a value of 0.7%. However, the remaining three parameters in the factor model and cross-section returns have negative mean returns. According to the standard deviation values, SMB has the lowest risk, having a value of 2.19%, followed by MOM and HML, with values of 2.28 and 2.45%, respectively; in contrast, B/M has higher volatility of return, followed by S/M and S/H. The positive skewness values for all the variables (except for SMB, HML, and MOM) indicate that these return series are skewed in the right way, while the negative values for the SMB, HML, and MOM refer to left-skewed returns. Moreover, high and positive Kurtosis values for each variable display heavy tail and fatter distribution. The Jarque-Bera statistics show that the returns of each variable (except for RPM and S/H) are non-normally distributed as the null hypothesis is rejected at a 5% level of significance.
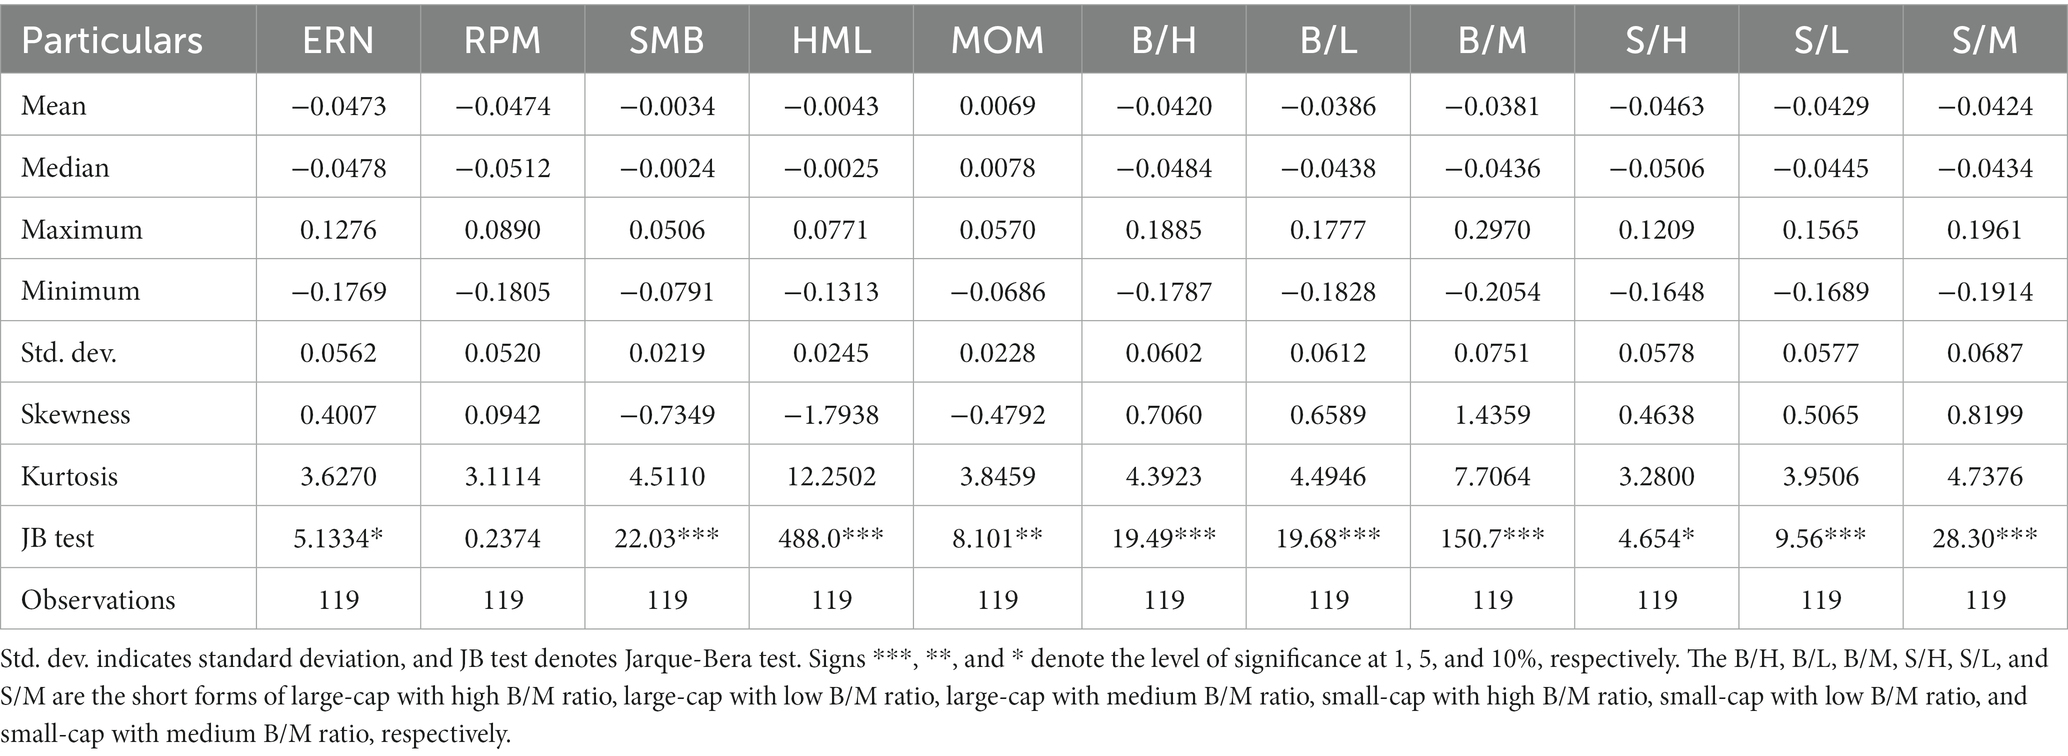
Table 1. Descriptive statistics.
The result of correlation coefficients is represented in Table 2. It is noticed that among the asset pricing parameters, there is a positive and significant relationship between SMB and RPM; however, in the remaining pairs, there is an insignificant relationship. Furthermore, we observe a significant relationship between every pair of cross-section portfolios, while there are some mixed outcomes between factor returns and cross-section returns. Specifically, the return of RPM, SMB, and HML is almost significantly nexus with the cross-section returns; in contrast, there is insignificant linkage between MOM and cross-section returns.
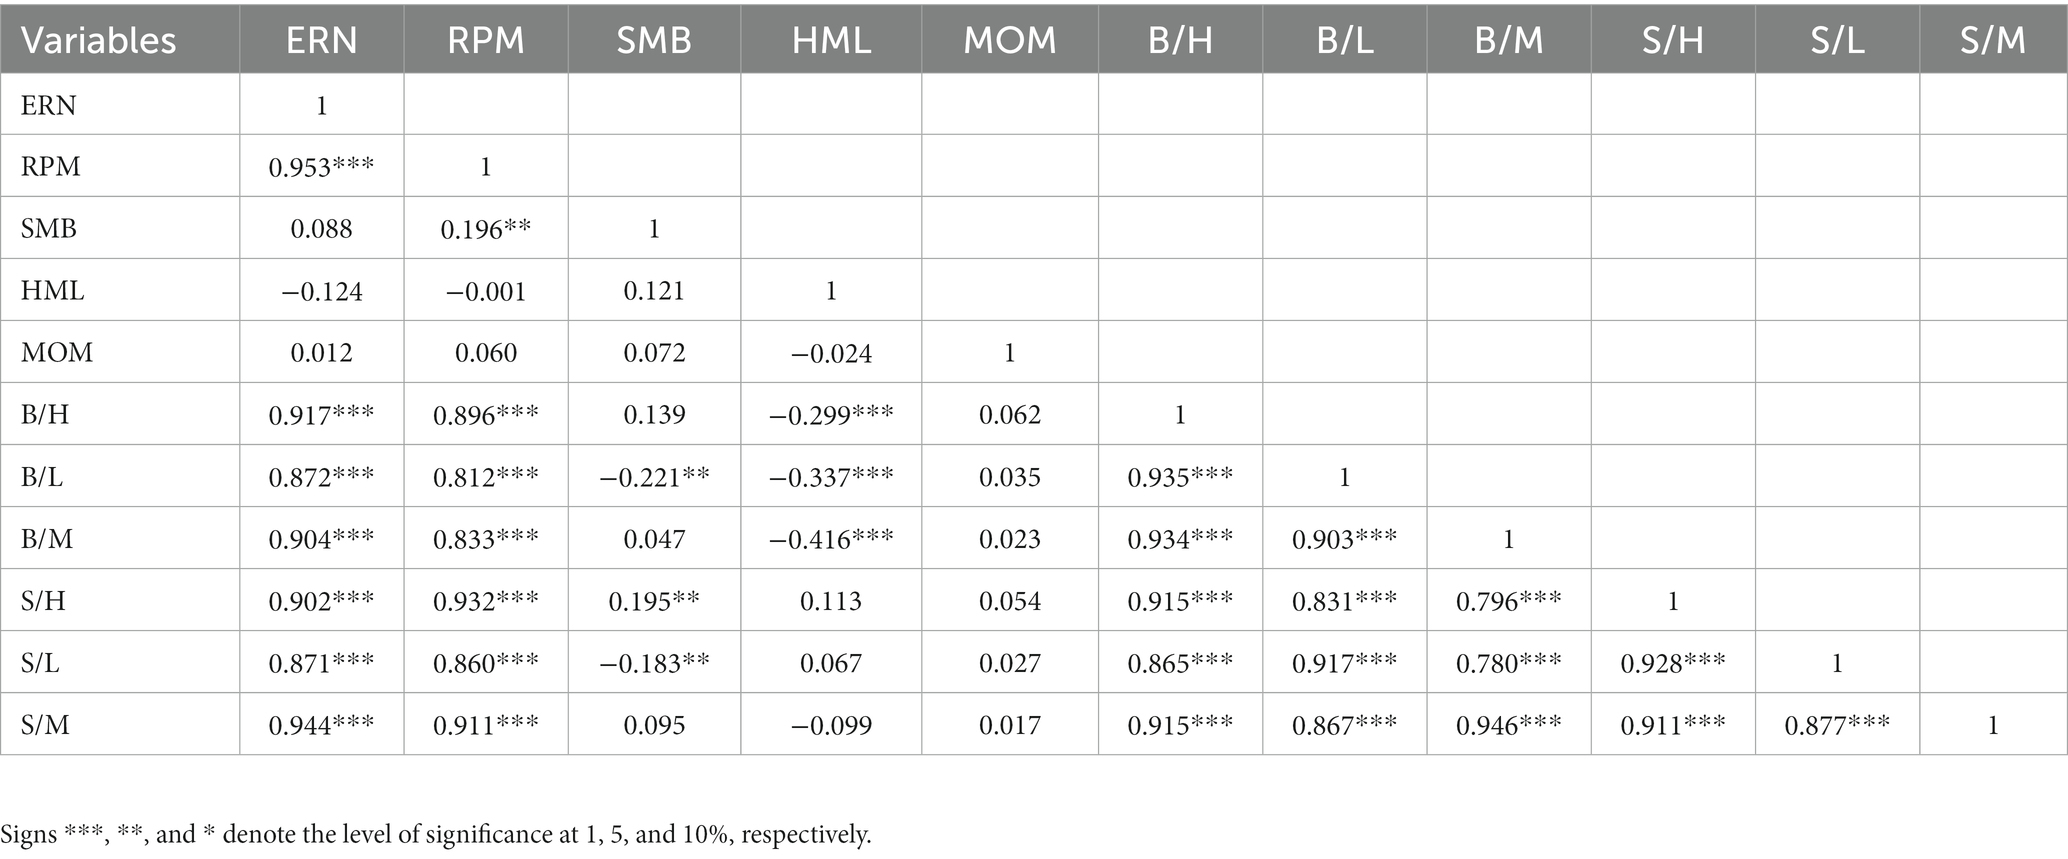
Table 2. Correlation matrix.
Table 3 demonstrates the risk-adjusted performances along with annualized return, total risk, and systematic risk of 30 companies listed in the Dhaka Stock Exchange under the DSE30 index. Additionally, we compute the rank according to the value of the Sharpe ratio, Treynor ratio, Jensen’s alpha, and Sortino ratio for displaying their position in the stock market of Bangladesh. The results show that the annualized mean return of 23 companies out of 30 companies is positive, and the remaining seven companies, namely, HBCB, ISLB, NBLL, SMPL, TITA, UCBL, and UNIQ, generate negative annual average returns. Meanwhile, it is observed that the total risk of the majority of companies is under 15% (except for BATC and BEXI). In addition, when the systemic risk is taken into account, it is seen that BSRR, BRAC, BEXI, GRAE, and IDLC have higher non-diversifiable risk, generating β-values greater than 1, while the rest of the firms have β-coefficients lower than 1. This finding implies that if investors place their money in companies—BSRR, BRAC, BEXI, GRAE, and IDLC, they will generate more return than market portfolio return. However, the Sharpe ratio statistics show that, except for IBBL, practically all large-capitalized companies produce a positive Sharpe ratio and achieve relatively higher rankings. On the contrary, six businesses out of the 21 small-capitalized businesses have a negative Sharpe ratio and are ranked lower. In the meantime, while seven of the top 20 companies according to the Sharpe ratio have small capitalizations and low B/M ratios, six of the top 10 companies have large capitalizations and have low or medium B/M ratios. In general, large-cap stocks typically underperform small-cap companies (47, 66), and small-cap companies may underperform because of their inadequate productivity in general and significant financial debt in recessionary times (44, 67, 68). Surprisingly, only BRAC has a place below 15, even though its shares have a high book value relative to their market value. The aforementioned findings imply that the majority of large-capitalized corporations and those who have low B/M ratios, regardless of capital size, generate positive returns per unit of total risks with lower volatility. Moreover, the results of the Treynor ratio and the Sharpe ratio do not differ much from one another in the case of the volume of market capitalization and the magnitude of the B/M ratios since eight of the top 10 companies according to the ranking of Sharpe ratio also place below 10 in the Treynor ratio ranking. However, every large-capitalized firm, except for Square Pharmaceuticals Limited, improves its position in the Treynor ratio, suggesting that large-capitalized companies have comparably lower systemic risk than their counterparts and generate more return at per unit of systemic risk. In addition, 10 companies out of 12 companies that have a low B/M ratio achieve a strong position in the ranking, symbolically below 15. On top of that, the majority of the firms that have small capitalization with high B/M ratios generate negative and lower Treynor ratios, indicating that their earning is less than the risk-free rate and unable to manage the market risk. Furthermore, the value of Jensen’s alpha represents that five companies out of the top six companies are large-capitalized and have lower to moderate B/M ratios, generating positive Jensen’s alpha. However, it is surprising to see that while nearly all the firms do not dramatically lose their position in the ranking compared to the earlier two ratios, the BRAC loses their position significantly according to Jensen’s alpha value. This finding indicates that although BRAC has a lower volatile return with low systemic risk, their portfolio manager’s stock-picking abilities are slightly weaker compared to their competitors to successfully outperform the market since Jensen’s alpha value is near 0. Apart from that, the majority of the firms with high B/M ratios are also seen as underperformers in the market. Finally, the results derived from the Sortino ratio analysis reveal an interesting observation. Among the nine large-cap companies under consideration, six of them have obtained rankings below 10 in the Sortino ratio, which is almost consistent with the patterns observed in the three previous ratios (Sharpe ratio, Treynor ratio, and Jensen’s Alpha), with one notable exception—IBBL. Our overarching findings are in line with the results obtained in the studies by Shapiro and Zheng (69) and Lynch (70), both of which have observed that large-cap firms tend to generate more consistent and stable risk-adjusted returns in comparison with their small-cap counterparts. Recently, Valadkhani (71) documented that small-cap ETFs experience more significant declines during extreme market downturns compared to their gains in periods of extreme market upturns. In addition, as anticipated, a significant portion of firms with high book-to-market (B/M) ratios exhibit unfavorable Sortino values. This observation suggests that these companies generate lower returns relative to the risk of incurring losses, aligning with the patterns observed in the other risk-adjusted ratios.
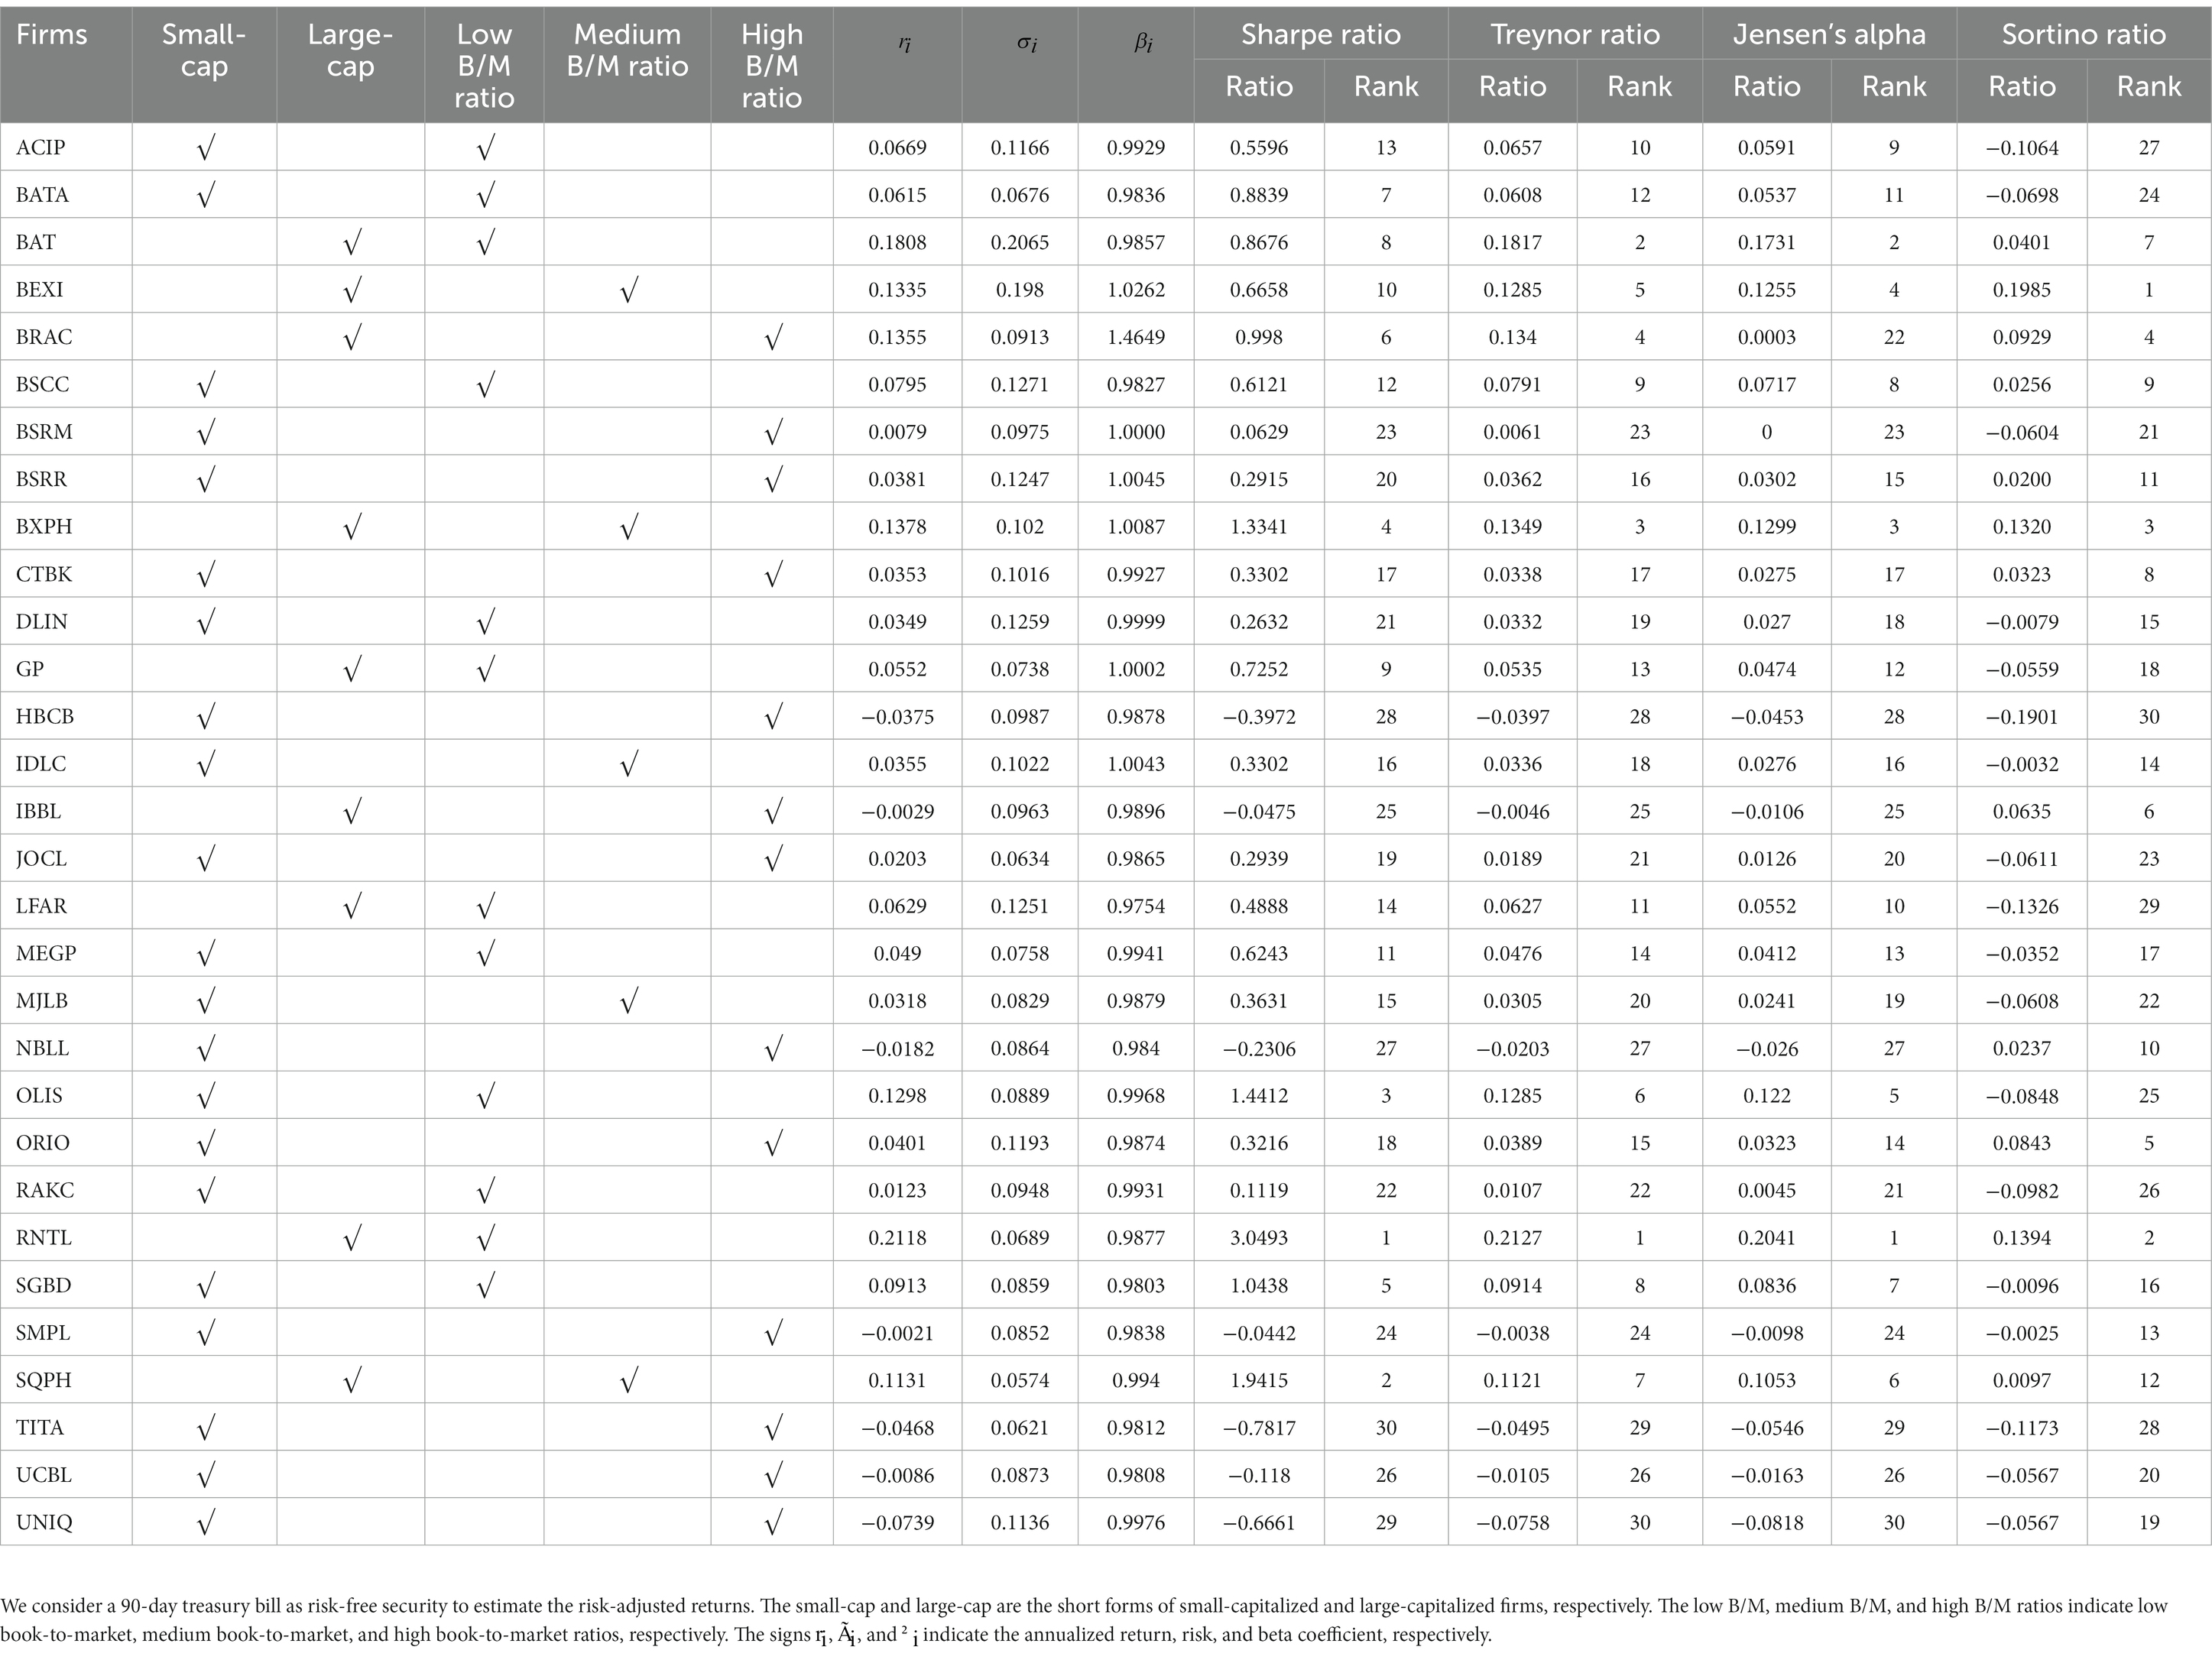
Table 3. Risk-adjusted returns.
Table 4 states the stationary test of the studied variables. We consider two popular methods of unit root test, such as Augmented Dickey–Fuller (ADF) (72) and Phillips–Perron (PP) (73), for suspecting the existence of possible unit root in our time series data. Initially, we detect the stationarity feature at level I(0); after that, we also test the same at the first difference I(1). The results show that every variable in our study is free from the unit root, indicating the presence of stationarity characteristics in the variable both at the level I(0) and at the first difference I(1) at a 1% significance level, respectively. Hence, it is recommended that we run the OLS/linear regression model in this study.
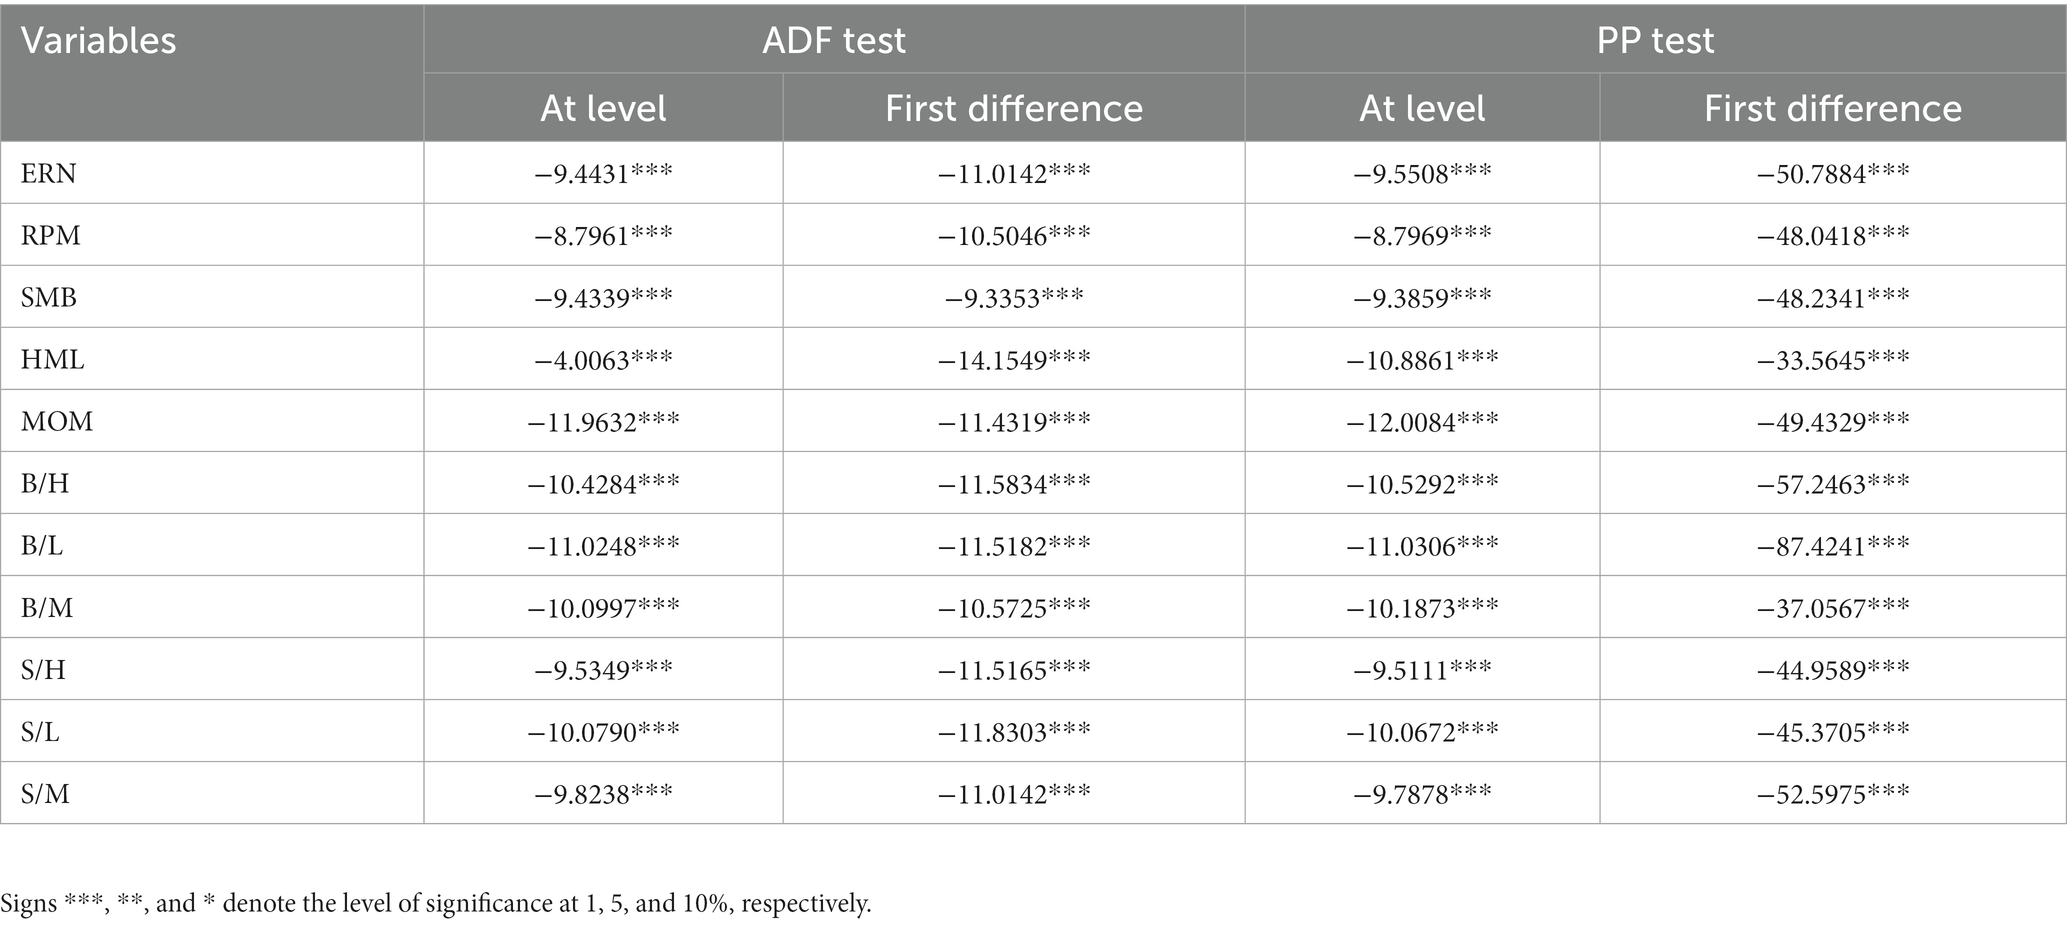
Table 4. Unit root test.
Table 5 represents the results of diagnostic test statistics of the considering models. We employ a variety of tests to serve a variety of purposes, including the tolerance and variance inflation factor (VIF) values for the multicollinearity test, the Jarque-Bera (JB) statistic for the normality test, and the chi-square value for the heteroscedasticity test. According to the rule of thumb, tolerance values less than 1 and VIF values under 10 indicate that the model has no multicollinearity issues. We observe that all three of our estimated models—four-factor, three-factor, and two-factor models—fulfill the requirements for a multicollinearity-free model. After that, the models are, therefore, considered to be normal because the JB statistics fail to reject the null hypothesis at a 5% significance level for each model. Finally, the chi-square values for all of the models are also rejected at the 5% level of significance, indicating that the heteroscedasticity assumptions have not been violated.
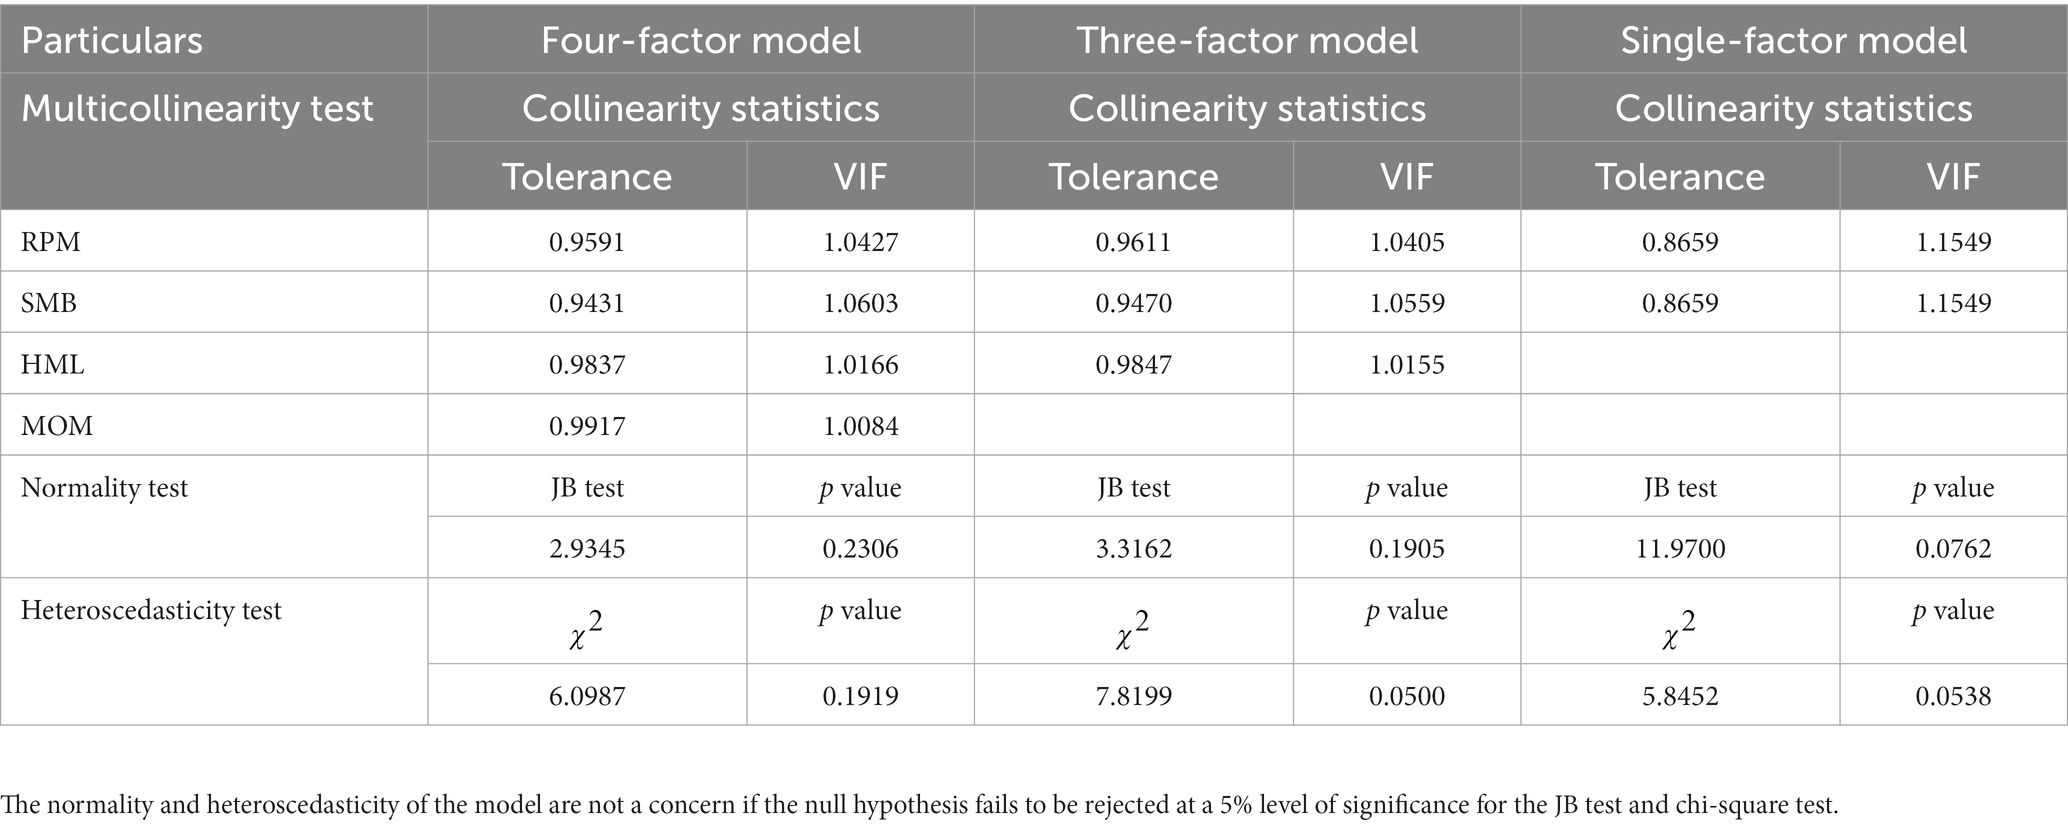
Table 5. Diagnosis test statistics.
The impact of the Carhart four-factor model, the Fama–French three-factor model, and the two-factor model on market excess returns of equity assets of listed companies under the index of DSE30 in the Dhaka stock exchange is exhibited in Table 6. The outcomes reveal that RPM affects the excess returns positively and significantly in three models (models 1, 2, and 3), whereas SMB and HML have a negative and significant impact on the excess returns of securities in the four-factor and three-factor models. The magnitude of these outcomes denotes that getting a risk premium boosts the profitability of the investors as it explains that if the market return is higher than the risk-free rate, the investors will generate more excess returns from their investments. Furthermore, the returns of size factor (SMB) and value factor (HML) outperform the excess return of the investment in four-factor and three-factor models, evidencing more returns of SMB and HML factors and less excess returns. However, it is surprising to notice that in the two-factor model, SMB positively and significantly affects the excess returns for the investors. In addition, the value of the momentum factor (MOM) in the four-factor factor model describes the excess returns in a negative and significant way, inferring that the sentiment of winning the stocks does not increase the extra return of investors. It is stated that stock investors will shift their funds from one company to another company if they forecast an uncertain future for that current company despite its good past performance (31).
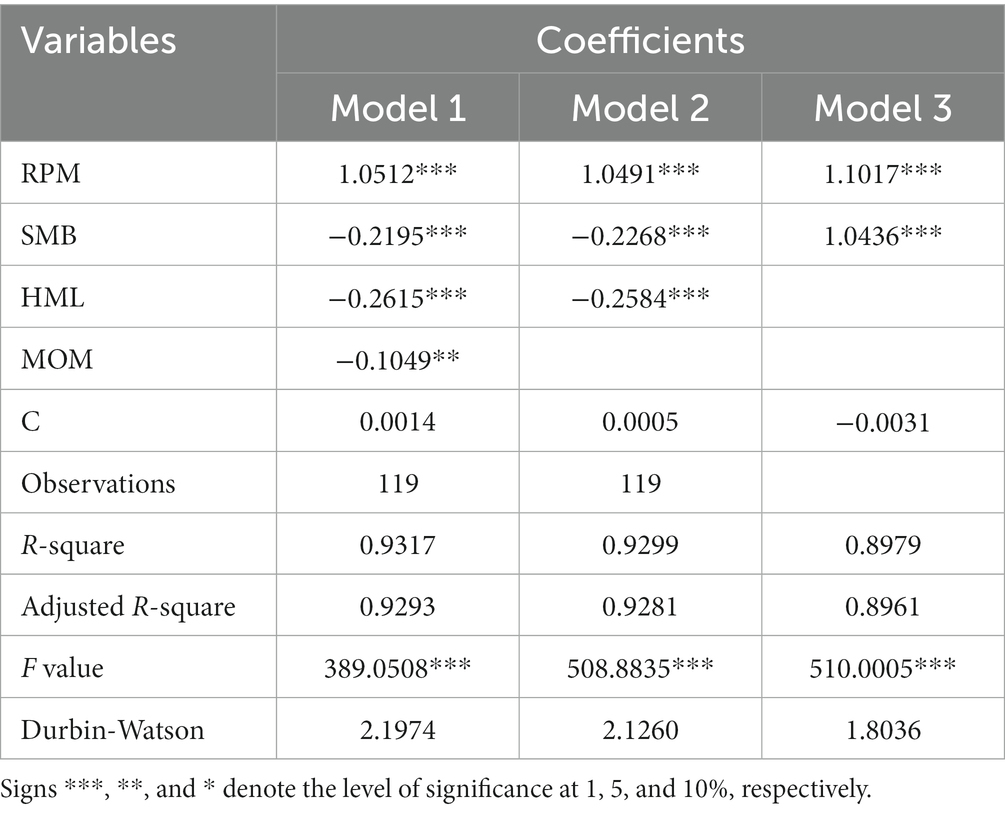
Table 6. Regression outcomes of factorial values on market excess returns.
Moreover, our researched explanatory variables appear to have a perfect fit with the dependent variable ERN according to the adjusted value of models I (0.9317), II (92.81), and III (0.8961), meaning that four-factor, three-factor, and two-factor models explain the excess returns 93.17, 92.81, and 89.61%, respectively. In addition, the intercept coefficients (c) are close to zero, which supports the proper regression model. Finally, based on the general guideline by Field (74) who stated that a Durbin-Watson test value between 1 and 3 is not of concern for autocorrelation, we confirm that there is no autocorrelation inherent in the models.
Table 7 denotes the impact of the Carhart four-factor model on the excess returns for investors in cross-section portfolios. The results show that the calculated coefficients of the market risk premium factor (RPM), which is significant and positive in all portfolios at the 1% level, have a very good ability to provide an explanation for the disparity in excess returns for each of the portfolios. Our finding is in agreement with previous research conducted by Fama and French (47) as well as Hasan et al. (32). These studies have demonstrated that the RPM factor exhibits a robust ability to explain variations in cross-sectional stock returns. The size factor (SMB), however, has a negative and significant impact on investors’ excess returns across all portfolio distributions (with the exception of the S/H and B/H cross-section firms), meaning that SMB explains excess returns spontaneously for portfolio distributions with small- or large-capitalized firms that have low or medium B/M ratio rather than portfolio distributions with high B/M ratio firms. The findings of Coşkun et al. (75) and Khan and Fahim (37) also concurred with our outcomes. Meanwhile, while the value factor (HML) has a positive and significant impact on S/L and S/H firms and a negative and significant impact on S/M, B/L, B/M, and B/H firms, the momentum factor (MOM) has no discernible impact on the excess return of investors for any given portfolio distributions. These results show that the return of value factor explicitly forecasts the supplementary profit for investors; however, the top-performing stock sentiment is unable to forecast the anticipated results for investors. Fama and French (48), Chui et al. (46), and Ang et al. (76) also documented that the momentum factor may be unable to explain the cross-section returns of stocks. Particularly, Fama and French (48) and Chui et al. (46) demonstrated that a country that places a greater degree of emphasis on individualism rather than collectivism has a significant momentum effect on stock returns. However, our result is contradicted by Khan and Fahim (37) who explored a strong effect of the momentum factor in stock returns, but they considered only non-financial institutions in their datasets.
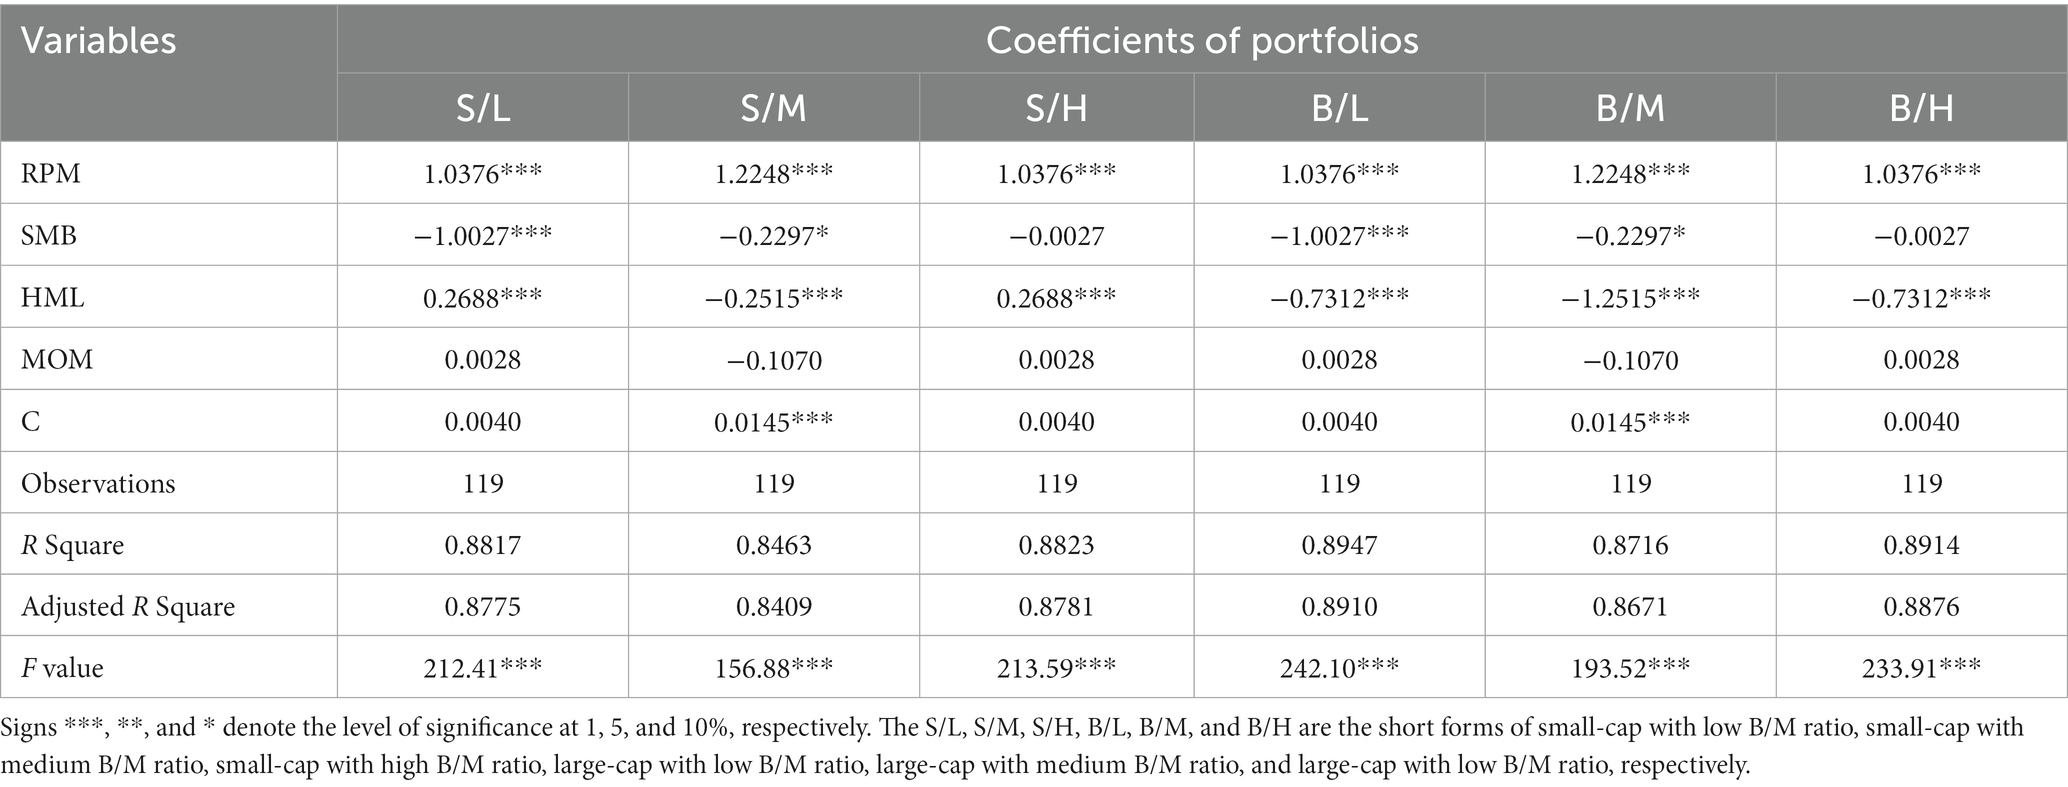
Table 7. Regression outcomes of Carhart four-factor model.
Moreover, regression intercept c is supposed to be closer to zero if the model is valid. All intercepts are seen to have near zero. In addition, the adjusted values in all the cases convey the perfect fit of the models.
The three-factor time series regression model developed by Fama and French (11) is presented in Table 8. We estimate the influence of factor return on cross-section portfolio returns taking into account the firms’ risk premium, size, and value factors. Surprisingly, it has been found that, with the exception of the momentum component in the four-factor model, the consequences of the Carhart four-factor model and the Fama–French three-factor model on the excess returns of cross-section portfolios are quite similar. Drew and Veeraraghavan (18) concluded in their study that the multi-factor model, specifically the Fama and French three-factor model, provides a parsimonious and economically meaningful representation of the risk factors that explain returns in the context of Malaysia. Furthermore, Lettau and Ludvigson (24), Kianpoor and Dehghani (23), and Jareno et al. (21) have independently affirmed the efficacy of the Fama and French three-factor model as a valid estimator for excess returns of securities. We find that in contrast to size factor (SMB), which has a negative and significant influence on the same return classes (apart from B/H) at 1 and 5% significant levels, risk premium (RPM) has a positive and significant impact on all portfolios at the 1% significant level. Furthermore, the value component (HML) has a positive and notable effect on S/L and S/H enterprises while having an adverse and significant effect on firms that have large capitalizations (except for S/M).
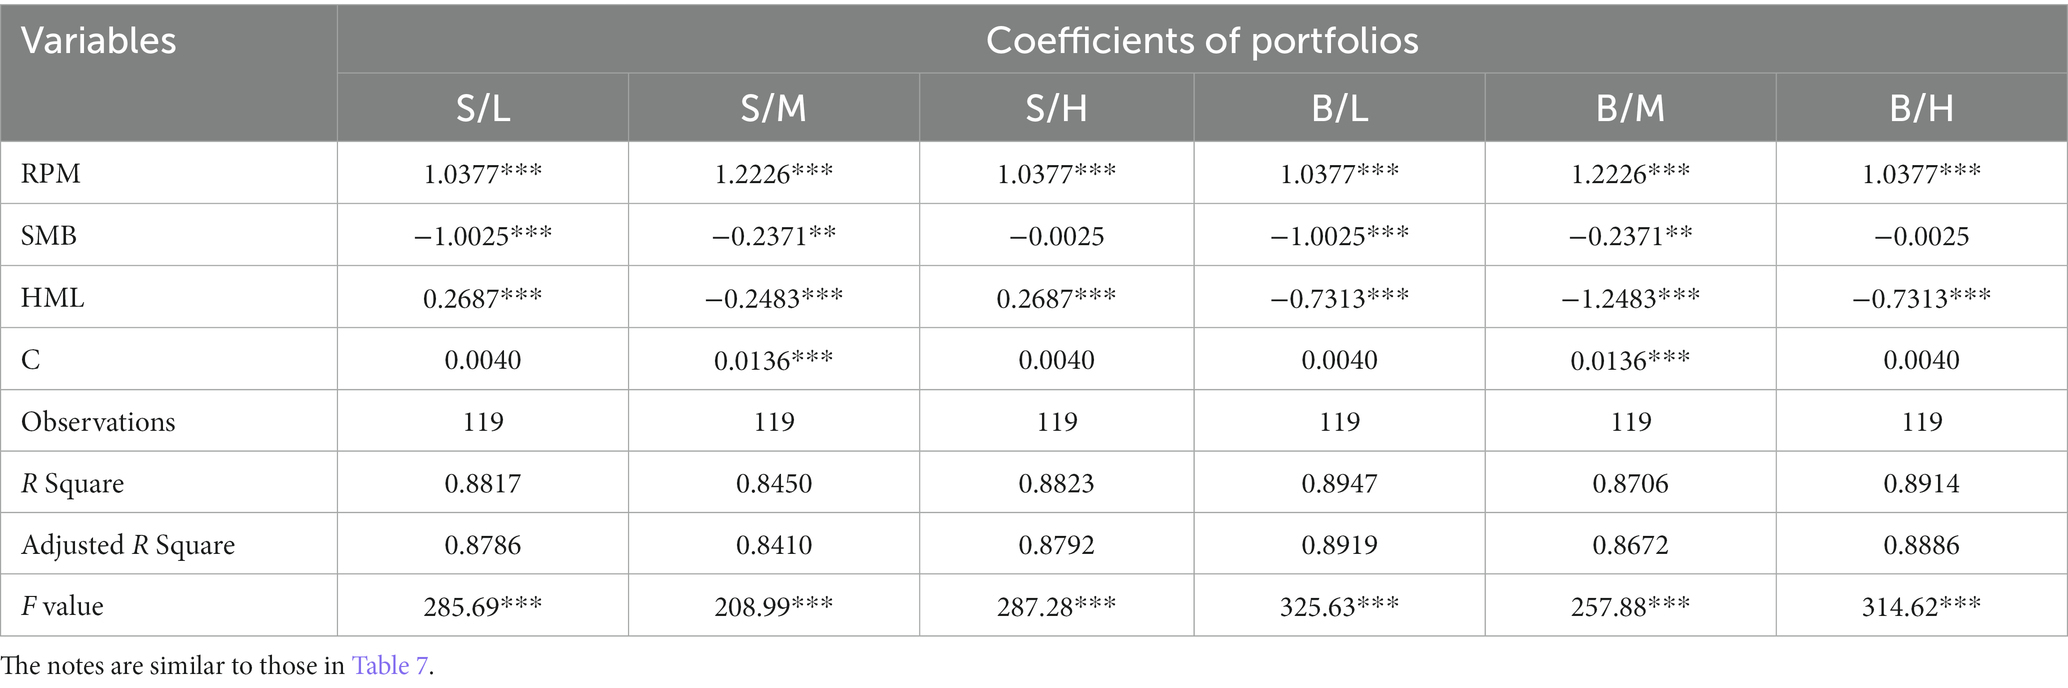
Table 8. Regression outcomes of Fama–French three-factor model.
Additionally, the modified R2 values and intercept coefficient values for all models in Table 7 indicate that the regression models are well-fitted.
The outcomes of the optimal optimization of the portfolios are shown in Figure 1. We compute the weights of optimal portfolios using data from three distinct standpoints and focus on minimizing the total risk (standard deviation) and maximizing the Sharpe ratio. First, we estimate the ideal portfolio weights taking into account the cross-section of enterprises (e.g., small-capitalized firms with low B/M ratio), after that, for robustness, we calculate the optimal portfolios based on market capitalization, and finally, we construct the portfolio depending on B/M ratio of the firms (e.g., low book value-to-market value ratio). The results of Figures 1A,B depict that if the investors invested 46.12% of their total funds in S/L portfolios, they could minimize most of their risk of investments, followed by 32.57% of their funds in S/H portfolios; in contrast, to maximize the Sharpe ratio, investors should invest 81.39% of their funds in B/M portfolios. These results demonstrate that small-capitalized companies with low B/M ratios offer a consistent return, but it is lower than the risk-free rate or it is unable to generate more profit according to the per unit of risk-taking. On the other hand, large-capitalized businesses with medium B/M ratios make more profit per unit of risk and offer a return that is higher than the risk-free rate. It suggests that, in general, risk-seeking investors should select large capitalization companies with medium B/M ratios to maximize their return, and comparatively lower risk tolerance investors should select small capitalization companies with lower B/M ratios to minimize the risk. Our findings are partially in line with the study conducted by Cao et al. (77) and Brown et al. (78). Their research indicated that investing heavily in mid- and large-cap stocks exposes investors to unforeseen risks. However, it is noteworthy that their study did not observe higher abnormal returns or performance persistence among investors in this context. Nevertheless, Ho et al. (79) presented evidence in their study suggesting that small-cap stocks may exhibit lower risk levels compared to large-cap stocks when evaluated over extended holding periods. Risk-seeking investors constantly search for risky investments to earn greater returns, whereas risk-averse investors demand higher potential returns on riskier investments to compensate for the increased uncertainty (80–82). From the perspective of the Bangladeshi stock market, the broader economic conditions and political instability of the country affect the risk and performance of stocks listed in the DSE [Source]. Recently, the Business Post reported that during the first half of 2023, the top 10 companies with the highest market capitalization in the Dhaka Stock Exchange experienced significantly lower returns. This was due to these companies being unable to increase their share prices beyond their floor prices. Meanwhile, smaller-cap companies saw a substantial rise in their share prices over the last 6 months in the DSE.6 Figures 1C,D display the optimal portfolio weight allocation between the small- and large-capitalized firms. It is observed that optimal weights of small-capitalized firms in the portfolio lead to lower standard deviation, resulting that if investors allocated 85.29% of their funds to the small-capitalized firms, they could manage to reduce the total risks of the investment. However, they have to put approximately 98.98% of their money into large-capitalized companies if they wish to optimize the Sharpe ratio. The share prices of large-cap companies maintain consistency since the market participants cannot easily manipulate their prices and the dividend yields of large-cap firms are higher than small-cap firms (83). Furthermore, the results of Figures 1E,F also show that the firms that have low B/M ratio capital (Low B to P) offer the lowest risk to the portfolio, followed by investments in firms with high B/M ratios. However, investing in companies with lower B/M ratio capital offers investors a greater Sharpe ratio. These results suggest that investing money in companies that have low B/M ratio capital entails less risk and results in a better Sharpe ratio.
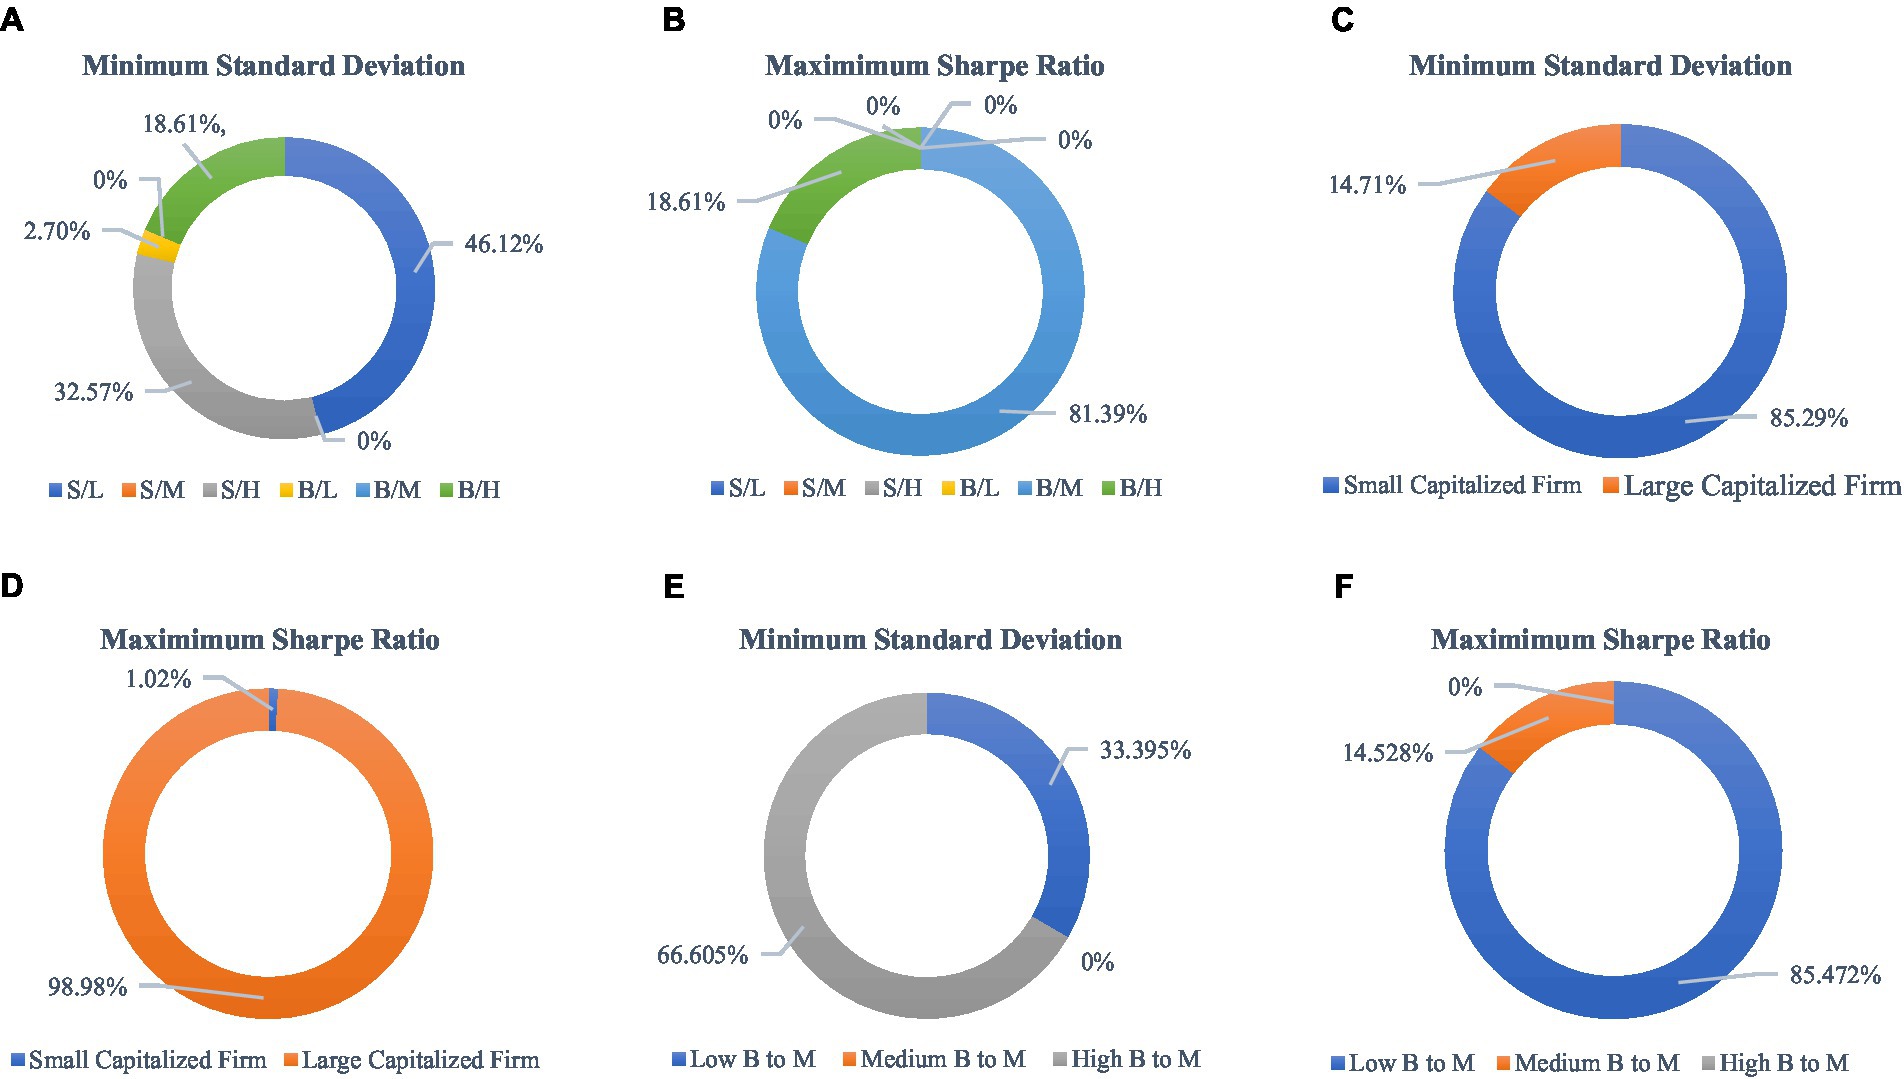
Figure 1. Optimal portfolio optimization plots (A–F). The S/L, S/M, S/H, B/L, B/M, and B/H are the short forms of small-cap with low B/M ratio, and small-cap with medium B/M ratio, small-cap with high B/M ratio, large-cap with low B/M ratio, large-cap with medium B/M ratio, and large-cap with high B/M ratio, respectively. Furthermore, the low B to M, medium B to M, and high B to M ratios indicate low book-to-market, medium book-to-market, and high book-to-market ratios, respectively. We utilize Microsoft Solver functions to determine the optimal portfolio weights. For more detailed information on this process, please see the link: https://www.youtube.com/watch?v=SKnpdX5rSt8.
The financial market is regarded as the hub for the administration and management of stock and debt allocations for all financial institutions. The share and debt securities are exchanged in the secondary market after being issued in the primary market, and investors are constantly looking for new strategies to explain the returns and make purchasing and selling decisions. However, there is a lack of studies on the return explanation abilities of different factor models along with some supportive analyses, in the context of Bangladesh, despite the fact that there are extensive studies on a variety of stock market-related issues. Hence, against this backdrop, we estimate the ability of factor values to explain the stock returns along with scrutinizing the risk-adjusted returns and optimization of portfolio weights of listed firms according to their cap sizes and B/M ratios. In doing so, we take the monthly prices of 30 listed companies in the Dhaka Stock Exchange under the DSE30 index. Primarily, the Sharpe ratio, Treynor ratio, Jensen’s alpha, and Sortino ratio are calculated for measuring the risk-adjusted returns, and after that, we apply the linear regression model to test the ability of factorial values in explaining the market and cross-section excess return of stocks.
The outcomes of our risk-adjusted techniques show that, in contrast to small-capitalized firms with high B/M ratios, those with relatively large capital with low B/M ratios have the ability to generate more profit per unit of risks, encompassing both systematic and downside, and have skillful fund managers for choosing accurate projects since they all have positive Sharpe ratio, Treynor ratio, Jensen’s alpha, and Sortino ratio. Furthermore, our linear regression estimations depict that all factor models have strong power to explain the market excess returns. However, concerning the impact of the Carhart four-factor model and the Fama–French three-factor model on cross-section stock returns, we do find a single difference in the results, exploring that except for the momentum factor, the risk premium, size, and value factors have a vast and identical impact on cross-section excess returns. Moreover, the size factor explains the returns more explicitly for small-to-low (S/L), small-to-medium (S/M), large-to-low (B/L), and large-to-medium (B/M) portfolios rather than portfolio distributions at small-to-high (S/H) and large-to-high (B/H) categories. Finally, our optimal portfolio optimization weights indicate that investors should invest 46.12–85.29% of their funds in small-cap firms with low B/M ratios to minimize the risk of investments; however, if they want to maximize the maximum Sharpe ratio, they need to invest 81.39–98.98% of their funds in large-cap firms that also have low B/M ratios.
Moreover, our findings have significant implications for the institutions, investors, financial analysts, and regulatory bodies, in the specific context of the Dhaka Stock Exchange. First, small-capitalized firms with high B/M ratios may be conscious about the optimum use of their capital and managing their systemic risk and unsystematic risks. Second, specifically, the investors in DSE can use the factorial returns to explain the stock return and make favorable portfolio decisions. Third, depending on the risk-taking behaviors, investors can allocate their funds according to the optimal weight distributions to minimize risk and maximize the Sharpe ratio. Fourth, the regulatory bodies and policymakers may enhance the quality of the stock market by reducing the asymmetric information between the investors and fund managers of companies and implementing proper policies. Finally, this research may contribute to the current literature on asset valuation models by shedding light on the viability and effectiveness of a number of CAPM modifications in an emerging market context.
Nevertheless, our study suggests that a larger sample size, coupled with more advanced methodologies, with a particular focus on the examination of out-of-sample R-squared values or application of time-varying models, could provide a more comprehensive assessment of the influence of factor models in elucidating stock returns across both long-run and short-run periods. In addition, conducting research to assess the effects of regulatory interventions on market dynamics within the DSE would be a noteworthy endeavor. This is particularly relevant given the recent implementation of costly surveillance software by the BSEC and the imposition of penalties on specific individuals engaged in market manipulation.
Publicly available datasets were analyzed in this study. This data can be found at: www.investing.com.
MK: Conceptualization, Resources, Validation, Writing – review & editing, Funding acquisition, Investigation, Project administration, Supervision. YL: Conceptualization, Investigation, Project administration, Resources, Supervision, Validation, Writing – review & editing, Methodology. SS: Conceptualization, Investigation, Methodology, Project administration, Supervision, Data curation, Resources, Software, Writing – original draft. MN: Conceptualization, Data curation, Resources, Software, Writing – original draft, Formal Analysis, Methodology, Validation, Writing – review & editing. TB: Conceptualization, Project administration, Resources, Supervision, Validation, Visualization, Writing – review & editing, Investigation.
The author(s) declare that no financial support was received for the research, authorship, and/or publication of this article.
The authors declare that the research was conducted in the absence of any commercial or financial relationships that could be construed as a potential conflict of interest.
All claims expressed in this article are solely those of the authors and do not necessarily represent those of their affiliated organizations, or those of the publisher, the editors and the reviewers. Any product that may be evaluated in this article, or claim that may be made by its manufacturer, is not guaranteed or endorsed by the publisher.
1. ^Manipulation in stock market lives on despite surveillance, Available at: https://www.thedailystar.net/business/economy/stock/news/manipulation-lives-despite-surveillance-3116241 (Accessed May 27, 2023).
2. ^Chained-up stock market keeps bleeding, Available at: https://www.tbsnews.net/economy/stocks/chained-stock-market-keeps-bleeding-591234 (Accessed May 27, 2023).
3. ^For more information, please see the link: https://dsebd.org/assets/pdf/DSEX_DS30.pdf.
4. ^We consider that a corporation is classified as a small-cap company if its market capital is less than Tk.5000 crore. On the other hand, a large-cap company is one whose market capital exceeds Tk.5000 crore (Information available at https://simplywall.st/stocks/bd/market-cap-large).
5. ^The classification of companies based on book-to-market (B/M) ratio is as follows: the top 30% represents the high B/M ratio, the middle 40% indicates the medium B/M ratio, and the bottom 30% symbolizes the low B/M ratio (Lahboub and Bouhadi, 2023).
6. ^Small-cap cos outperform DSE heavyweights, Available at: https://businesspostbd.com/stocks/small-cap-cos-outperform-dse-heavyweights (Accessed September 20, 2023).
1. Shahi, TB, Shrestha, A, Neupane, A, and Guo, W. Stock price forecasting with deep learning: a comparative study. Mathematics. (2020) 8:1441. doi: 10.3390/math8091441
3. Treynor, J.L. (1962). Jack Treynor's “Toward a theory of market value of risky assets.” SSRN. Available at: https://ssrn.com/abstract=628187
4. Treynor, J.L. (1961). Market value, time, and risk. SSRN. Available at: https://ssrn.com/abstract=2600356
5. Sharpe, WF. Capital asset prices: a theory of market EQUILIBRIUM under conditions of risk*. J Financ. (1964) 19:425–42. doi: 10.1111/j.1540-6261.1964.tb02865.x
6. Lintner, J. The valuation of risk assets and the selection of risky investments in stock portfolios and capital budgets. Rev Econ Stat. (1965) 47:13–37. doi: 10.2307/1924119
7. Mossin, J. Equilibrium in a capital asset market. Econometrica. (1966) 34:768–83. doi: 10.2307/1910098
8. Banz, RW. The relationship between return and market value of common stocks. J Financ Econ. (1981) 9:3–18. doi: 10.1016/0304-405X(81)90018-0
9. Basu, S. Investment performance of common stocks in relation to their Price-earnings ratios: a test of the efficient market hypothesis. J Financ. (1977) 32:663–82. doi: 10.2307/2326304
10. Basu, S. The relationship between earnings’ yield, market value and return for NYSE common stocks: further evidence. J Financ Econ. (1983) 12:129–56. doi: 10.1016/0304-405X(83)90031-4
11. Fama, EF, and French, KR. The cross-section of expected stock returns. J Financ. (1992) 47:427–65. doi: 10.1111/j.1540-6261.1992.tb04398.x
12. Shanken, J. Multivariate tests of the zero-beta CAPM. J Financ Econ. (1985) 14:327–48. doi: 10.1016/0304-405X(85)90002-9
14. Jegadeesh, N, and Titman, S. Returns to buying winners and selling losers: implications for stock market efficiency. J Financ. (1993) 48:65–91. doi: 10.2307/2328882
15. Carhart, MM. On persistence in mutual fund performance. J Financ. (1997) 52:57–82. doi: 10.1111/j.1540-6261.1997.tb03808.x
16. Huang, TL. Is the Fama and French five-factor model robust in the Chinese stock market? Asia Pac Manag Rev. (2019) 24:278–89. doi: 10.1016/j.apmrv.2018.10.002
17. Bartholdy, J, and Peare, P. Estimation of expected return: CAPM vs. Fama and French. Int Rev Financ Anal. (2005) 14:407–27. doi: 10.1016/j.irfa.2004.10.009
18. Drew, ME, and Veeraraghavan, M. A closer look at the size and Value premium in emerging markets: evidence from the Kuala Lumpur stock exchange. Asian Econom J. (2002) 16:337–51. doi: 10.1111/1467-8381.00156
19. Faff, R. An examination of the Fama and French three-factor model using commercially available factors. Aust J Manag. (2001) 26:1–17. doi: 10.1177/031289620102600101
20. Gaunt, C. Size and book to market effects and the Fama-French three factor asset pricing model: evidence from the Australian stockmarket. Account Finance. (2004) 44:27–44. doi: 10.1111/j.1467-629x.2004.00100.x
21. Jareno, F, González, MDLO, and Escolástico, AM. Extension of the Fama and French model: a study of the largest European financial institutions. Int Econ. (2020) 164:115–39. doi: 10.1016/j.inteco.2020.09.001
22. Jian, LT, and Hong, NM. Cross-section of equity returns motivated by Fama and French. Proc Econ Fin. (2012) 2:284–91. doi: 10.1016/s2212-5671(12)00089-5
23. Kianpoor, MM, and Dehghani, A. The analysis on Fama and French asset-pricing model to select stocks in Tehran security and exchange organization (TSEO). Proc Econ Fin. (2016) 36:283–90. doi: 10.1016/s2212-5671(16)30039-9
24. Lettau, M, and Ludvigson, S. Resurrecting the (C)CAPM: 2010; a cross-sectional test when risk premia are time and varying. J Polit Econ. (2001) 109:1238–87. doi: 10.1086/323282
25. Beigi, F, Hosseini, M, and Qodsi, S. The effect of the earning transparency on cost of capital common stock based on the Fama-French and momentum factors. Proc Econ Fin. (2016) 36:244–55. doi: 10.1016/s2212-5671(16)30035-1
26. Boamah, NA, Watts, E, and Loudon, G. Regionally integrated asset pricing on the african stock markets: evidence from the Fama-French and carhart models. J Econ Bus. (2017) 92:29–44. doi: 10.1016/j.jeconbus.2017.04.002
27. Rath, S, and Durand, RB. Decomposing the size, value and momentum premia of the Fama-French-Carhart four-factor model. Econ Lett. (2015) 132:139–41. doi: 10.1016/j.econlet.2015.05.003
28. Waszczuk, A. A risk-based explanation of return patterns-evidence from the polish stock market. Emerg Mark Rev. (2013) 15:186–210. doi: 10.1016/j.ememar.2012.12.002
29. Hossain, T, Nesa, T, Dowla, MSU, and Akter, F. The impact of Covid-19 pandemic on the stock market performance: a study on Dhaka stock exchange (DSE). Int J Bus Econ Manag. (2021) 8:390–408. doi: 10.18488/journal.62.2021.85.390.408
30. Hossain, MJ, Uddin, J, and Akter, S. Evidence of interdependence between listed companies of major sector in Dhaka stock market. J Hunan Univ Nat Sci. (2022) 49:235–47. doi: 10.55463/issn.1674-2974.49.12.24
31. Chowdhury, SS, and Sharmin, R. Relevant factors to explain cross-section of expected returns of the firms listed in the Dhaka stock exchange. Int Bus Res. (2013) 6:165–73. doi: 10.5539/ibr.v6n3p165
32. Hasan, MB, Alam, MN, Amin, MR, and Rahaman, MA. The size and Value effect to explain cross-section of expected stock returns in Dhaka stock exchange. International. J Econ Financ. (2015) 7:14–23. doi: 10.5539/ijef.v7n1p14
33. Mobarek, A, and Mollah, A. The general determinants of share returns: an empirical investigation on the Dhaka stock exchange. Rev Pacific Basin Finan Markets Polic. (2005) 8:593–612. doi: 10.1142/S0219091505000518
34. Mostafizur, R, Baten, MA, and Ashraf-Ul-Alam,. An empirical testing of capital asset pricing model in Bangladesh. J Appl Sci. (2006b) 6:662–7. doi: 10.3923/jas.2006.662.667
35. Hasan, M, Kamil, A, Mustafa, A, and Baten, MA. A validity test of capital asset pricing model for Dhaka stock exchange. J Appl Sci. (2011) 11:3490–6. doi: 10.3923/jas.2011.3490.3496
36. Hasan, MZ, Kamil, AA, Mustafa, A, and Baten, MA. Relationship between risk and expected returns: evidence from the Dhaka stock exchange. Proc Econ Fin. (2012) 2:1–8. doi: 10.1016/S2212-5671(12)00058-5
37. Khan, MS, and Fahim, MMU. The four-factor model and stock returns in Bangladesh. Int J Acc Fin Rev. (2021) 6:133–49. doi: 10.46281/ijafr.v6i2.1122
38. Brown, P, Keim, DB, Kleidon, AW, and Marsh, TA. Stock return seasonalities and the tax-loss selling hypothesis: analysis of the arguments and Australian evidence. J Financ Econ. (1983) 12:105–27. doi: 10.1016/0304-405X(83)90030-2
39. Reinganum, MR. Misspecification of capital asset pricing: empirical anomalies based on earnings’ yields and market values. J Financ Econ. (1981) 9:19–46. doi: 10.1016/0304-405X(81)90019-2
40. Chan, LKC, Hamao, Y, and Lakonishok, J. Fundamentals and stock returns in Japan. J Financ. (1991) 46:1739–64. doi: 10.2307/2328571
41. Bhandari, LC. Debt/equity ratio and expected common stock returns: empirical evidence. J Financ. (1988) 43:507–28. doi: 10.1111/j.1540-6261.1988.tb03952.x
42. Rosenberg, B, Reid, K, and Lanstein, R. Persuasive evidence of market inefficiency. J Portf Manag. (1995) 11:48–55. doi: 10.2307/j.ctv1mjqtwg.9
44. Chan, KC, and Chen, N-F. Structural and return characteristics of small and large firms. J Financ. (1991) 46:1467–84. doi: 10.1111/j.1540-6261.1991.tb04626.x
45. Asness, CS, Moskowitz, TJ, and Pedersen, LH. Value and momentum everywhere. J Financ. (2013) 68:929–85. doi: 10.1111/jofi.12021
46. Chui, ACW, Titman, S, and Wei, KCJ. Individualism and momentum around the world. J Financ. (2010) 65:361–92. doi: 10.1111/j.1540-6261.2009.01532.x
47. Fama, EF, and French, KR. Value versus growth: the international evidence. J Financ. (1998) 53:1975–99. doi: 10.1111/0022-1082.00080
48. Fama, EF, and French, KR. Size, value, and momentum in international stock returns. J Financ Econ. (2012) 105:457–72. doi: 10.1016/j.jfineco.2012.05.011
49. Herrera, MJ, and Lockwood, LJ. The size effect in the Mexican stock market. J Bank Financ. (1994) 18:621–32. doi: 10.1016/0378-4266(93)00010-M
50. Michou, M, Mouselli, S, and Stark, A. Fundamental analysis and the modeling of Normal returns in the UK. SSRN Electron J. (2010). doi: 10.2139/ssrn.1607759
51. Rouwenhorst, KG. Local return factors and turnover in emerging stock markets. J Financ. (1999) 54:1439–64. doi: 10.1111/0022-1082.00151
52. Halliwell, J, Heaney, R, and Sawicki, J. Size and book to market effects in Australian share markets: a time series analysis. Account Res J. (1999) 12:122–37.
53. Mishra, DR, and O’Brien, TJ. Fama-French, CAPM, and implied cost of equity. J Econ Bus. (2019) 101:73–85. doi: 10.1016/j.jeconbus.2018.08.002
54. Urbański, S. Multifactor explanations of returns on the Warsaw stock exchange in light of the ICAPM. Econ Syst. (2012) 36:552–70. doi: 10.1016/j.ecosys.2012.03.002
55. Foye, J, Mramor, D, and Pahor, M. A Respecified Fama-French three-factor model for the new European Union member states. J Int Financ Manag Acc. (2013) 24:3–25. doi: 10.1111/jifm.12005
56. Hearn, B, and Piesse, J. Modelling size and illiquidity in west African equity markets. Appl Financ Econ. (2010) 20:1011–30. doi: 10.1080/09603101003724364
57. Hearn, B. Modelling size and liquidity in north African industrial sectors. Emerg Mark Rev. (2011) 12:21–46. doi: 10.1016/j.ememar.2010.08.004
58. Benali, M, Lahboub, K, and El Bouhadi, A. Pricing ability of Carhart four-factor and Fama–French three-factor models: empirical evidence from Morocco. Int J Fin Stud. (2023) 11:20. doi: 10.3390/ijfs11010020
59. Chui, ACW, and Wei, KCJ. Book-to-market, firm size, and the turn-of-the-year effect: evidence from Pacific-Basin emerging markets. Pac Basin Financ J. (1998) 6:275–93. doi: 10.1016/S0927-538X(98)00013-4
60. Griffin, JM, Ji, X, and Martin, JS. Momentum investing and business cycle risk: evidence from pole to pole. J Financ. (2003) 58:2515–47. doi: 10.1046/j.1540-6261.2003.00614.x
61. Mostafizur, R, Baten, MA, Belal, U, and Zubayer, M. Fama-French’s CAPM: an empirical investigation on DSE. J Appl Sci. (2006a) 6:2297–301. doi: 10.3923/jas.2006.2297.2301
64. Jensen, MC. The performance of mutual funds in the period 1945–1964. J Financ. (1968) 23:389–416. doi: 10.1111/j.1540-6261.1968.tb00815.x
65. Sortino, FA, and Price, LN. Performance measurement in a downside risk framework. J Invest. (1994) 3:59–64. doi: 10.3905/joi.3.3.59
66. Keim, DB. An analysis of mutual fund design: the case of investing in small-cap stocks. J Financ Econ. (1999) 51:173–94. doi: 10.1016/S0304-405X(98)00049-X
67. Kim, MK, and Burnie, DA. The firm size effect and the economic cycle. J Financ Res. (2002) 25:111–24. doi: 10.1111/1475-6803.00007
69. Shapiro, R, and Zheng, F. Recent large-cap stock outperformance and its impact on US equities. J Invest. (2021) 30:95–106. doi: 10.3905/joi.2021.1.184
70. Lynch, R. (2018). High returns and low volatility: the case for mid-cap stocks. Undergraduate honors theses. Paper 450. Available at: https://dc.etsu.edu/honors/450
71. Valadkhani, A. Do large-cap exchange-traded funds perform better than their small-cap counterparts in extreme market conditions? Glob Financ J. (2022) 53:100743. doi: 10.1016/j.gfj.2022.100743
72. Dickey, DA, and Fuller, WA. Likelihood ratio statistics for autoregressive time series with a unit root. Econometrica. (1981) 49:1057–72. doi: 10.2307/1912517
73. Phillips, PCB, and Perron, P. Testing for a unit root in time series regression. Biometrika. (1988) 75:335–46. doi: 10.2307/2336182
74. Field, A. Discovering Statistics Using SPSS. 3rd ed. London, United Kingdom: SAGE Publications Ltd. (2009).
75. Coşkun, Y, Selcuk-Kestel, AS, and Yilmaz, B. Diversification benefit and return performance of REITs using CAPM and Fama-French: evidence from Turkey. Borsa Istanbul Rev. (2017) 17:199–215. doi: 10.1016/j.bir.2017.08.003
76. Ang, A, Hodrick, RJ, Xing, Y, and Zhang, X. The cross-section of volatility and expected returns. J Financ. (2006) 61:259–99. doi: 10.1111/j.1540-6261.2006.00836.x
77. Cao, C, Iliev, P, and Velthuis, R. Style drift: evidence from small-cap mutual funds. J Bank Financ. (2017) 78:42–57. doi: 10.1016/j.jbankfin.2017.01.009
78. Brown, K., Harlow, W., and Zhang, H. (2009). Staying the course: The role of investment style consistency in the performance of mutual funds. Working Paper, University of Texas, Austin.
79. Ho, K., Ernst, B., and Zhang, Z. (2011). Assessing the dynamic relationship between small and large cap stock prices. 19th International Congress on Modelling and Simulation. Perth, Australia: Australian Mathematical Sciences Institute.
80. Cheng, PYK. Risk willingness and perceived utilities to explain risky investment choices: a behavioral model. J Behav Financ. (2019) 20:255–66. doi: 10.1080/15427560.2018.1506785
81. Post, T, and Levy, H. Does risk seeking drive stock prices? A stochastic dominance analysis of aggregate investor preferences and beliefs. Rev Financ Stud. (2005) 18:925–53. doi: 10.1093/rfs/hhi021
82. Tesfatsion, L. Stochastic dominance and the maximization of expected utility. Rev Econ Stud. (1976) 43:301–15. doi: 10.2307/2297326
83. Tuhin, A. H. (2023). Investors' wealth erodes over 10% in large-cap. The Business standard. Available at: https://www.tbsnews.net/economy/stocks/investors-wealth-erodes-over-10-large-cap-567918
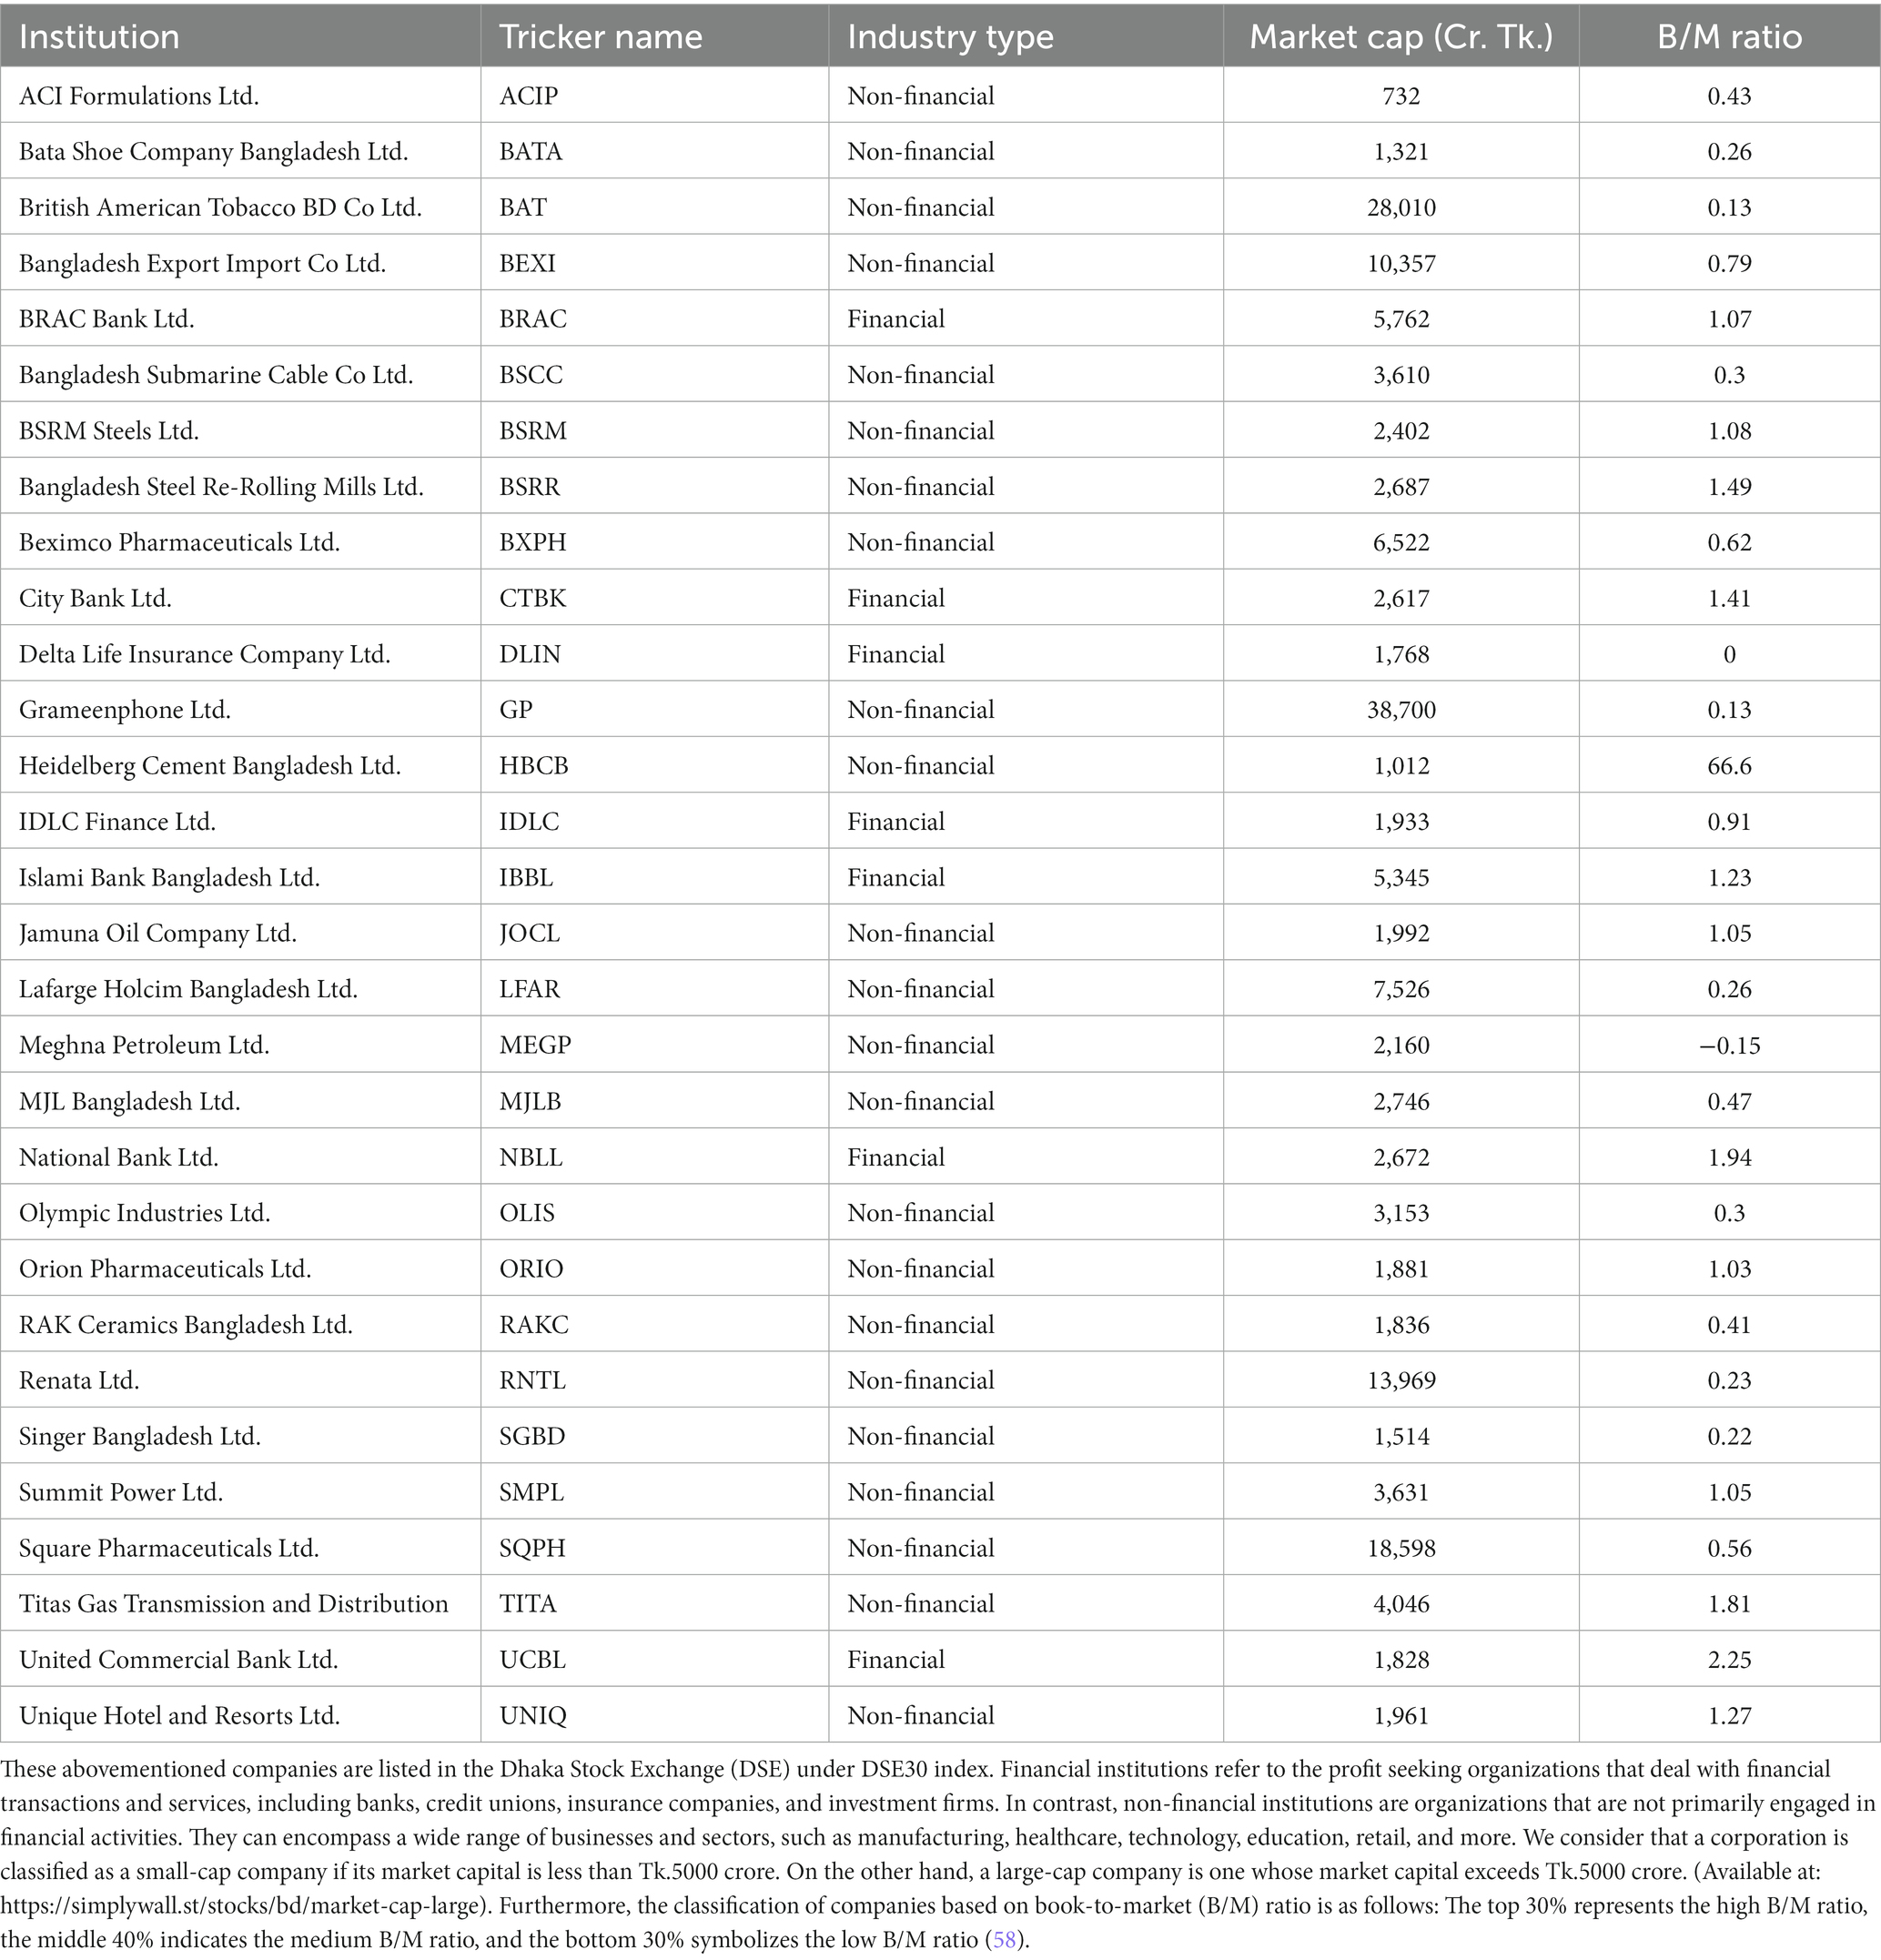
Table A1. Information of listed companies.
Keywords: CAPM, Fama and French, Carhart, risk-adjusted returns, portfolio optimizations, DSE
Citation: Kabir MA, Liping Y, Sarker SK, Nahiduzzaman M and Borman T (2023) Portfolio optimization and valuation capability of multi-factor models: an observational evidence from Dhaka stock exchange. Front. Appl. Math. Stat. 9:1271485. doi: 10.3389/fams.2023.1271485
Edited by:
Shuenn-Jyi Sheu, National Central University, TaiwanReviewed by:
Michael Phillips, Consultant, Pasadena, CA, United StatesCopyright © 2023 Kabir, Liping, Sarker, Nahiduzzaman and Borman. This is an open-access article distributed under the terms of the Creative Commons Attribution License (CC BY). The use, distribution or reproduction in other forums is permitted, provided the original author(s) and the copyright owner(s) are credited and that the original publication in this journal is cited, in accordance with accepted academic practice. No use, distribution or reproduction is permitted which does not comply with these terms.
*Correspondence: Sanjoy Kumar Sarker, c2Fuam95QGZpYmEuaXUuYWMuYmQ=; Md. Nahiduzzaman, aW5mby5uYWhpZHV6emFtYW4uYmRAZ21haWwuY29t
Disclaimer: All claims expressed in this article are solely those of the authors and do not necessarily represent those of their affiliated organizations, or those of the publisher, the editors and the reviewers. Any product that may be evaluated in this article or claim that may be made by its manufacturer is not guaranteed or endorsed by the publisher.
Research integrity at Frontiers
Learn more about the work of our research integrity team to safeguard the quality of each article we publish.