 Álvaro Saiz-Sepúlveda
 Carmen Orden-Cruz
 Álvaro Hernández-Tamurejo
95% of researchers rate our articles as excellent or good
Learn more about the work of our research integrity team to safeguard the quality of each article we publish.
Find out more
REVIEW article
Front. Appl. Math. Stat. , 03 January 2024
Sec. Mathematical Finance
Volume 9 - 2023 | https://doi.org/10.3389/fams.2023.1146776
A retrospective view of the “subprime mortgage” crisis enables us to assess the actions of banks, both those prompting the genesis of the crisis and those resulting from subsequent actions aimed at resolving it and rebooting the economy. However, given the fact that the crisis is framed by the sudden appearance of another outside the established parameters of the post-recession boom, we are able to analyze whether the actions adopted by regulators were as effective as initially thought. Solvency and profitability are two of the most important factors that reveals the quality of banking management. From the numerous parameters described in the literature reviewed, fourth banking ratios were selected to evaluate the relationship between solvency and profitability from 2011 to 2021, a period between the two economic-financial crises of the 21st century. Using a representative sample of Spanish banking and applying a descriptive and explicative methodology, the results show a complementarity between solvency and profitability. This evidence provides to bank managers more knowledge about the behavior of banking during crisis periods.
Spanish banking, which in 2009 accounted for an historically-high 5.2% of GDP, fell to 3.4% in 2013 (downtrend after the subprime crisis) and, with some oscillations, rose again to 4.05% in 2021 (2021 INE). During the latest economic crisis prompted by the COVID-19 pandemic, which is still ongoing at the time of this investigation, the banking sector was once again one of the few that achieved growth–2.4% y-o-y [1]—with the same occurring in other nearby economies.
The shock of COVID-19 revealed the weaknesses of the financial systems [2], but the regulatory and institutional changes made in the past decade, following the 2008 financial crisis, allowed this sector to be more resilient, preserving economic stability [3]. Therefore, seeking a connection point between the two economic crises and reviewing their inherent features, it is worth noting the economic slowdown of the 2008 financial crisis, and the virtual standstill of economic activity in the 2020 COVID-19 crisis due to lockdowns [4]. Massive deterioration of employment is another common factor of both financial crises, though this study aims to highlight the differences between financial and banking aspects.
In this economic-financial context, the management of banking and financial institutions is complex. Depending on their positioning, results in one of two situations: (i) incurring significant losses or, (ii) bankruptcy and dissolution, with the resulting significant social damage. One of the main causes of stress situations this century, according to the literature, is an excessive concentration of risk in certain types of markets. Real estate has been the typical example, as the Bank of Spain's Financial Stability Report points out [5].
Likewise, supervisory entities are gradually gaining prevalence, emerging to assess the solvency and actions of financial institutions. Despite this, it is necessary to create a sufficient and coherent regulatory framework that prevents the distortions that internal conflicts in bank decision-making can cause to the general economy [6]. In 2014, the Basel Committee on Banking Supervision highlighted in its studies that “...the regulatory framework was not designed to protect banks against large losses in the event of the failure of one of their counterparties”. The committee focused its efforts on mitigating the fallout from losses stemming from the failure of a single counterparty, or a set of connected counterparties [7].
Most of the literature has evidenced that banks with higher capital levels are the most profitable [8, 9], but there is evidence that the bank profitability is hurt by an increase in capital requirements [10, 11]. Recently, Tran et al. [12] has shown a non-linear relationship between regulatory capital and bank performance and depends on the level of capitalization. In the case of Spain, to our knowledge, only Bachiller and Lasa [13] have explored this relationship in Spanish savings bank finding that a solid core capital led to a greater performance. Therefore, the main objective of this study was to assess the duality or not of solvency and profitability of the systemic Spanish banking between the two major crises of the 21st century. Taking a period from 2011 to 2021, four key indicators were considered for the analysis: the Non-Performing Loans (NPL) ratio, the CET1 Fully Loaded Capital ratio, the efficiency ratio, and the results for the year. The phased-in CET1 ratio is also included for the purposes of comparison to the latter and given its importance until a few years ago. A representative sample of Spanish banks was selected as BBVA (Banco Bilbao Vizcaya Argentaria), Banco Santander, and CaixaBank who represent slightly more than 60% of Spanish banks [14]. The study results shows that a better solvency led a greater profitability in the medium-term also in the Spanish banking corroborating previous findings of Bachiller and Lasa [13] relatives to savings bank. This evidence shows the importance of these two factors to evaluate the quality of banking management.
After this introduction, the second section reviews the literature; the third section presents the sample and methodology of the study; the fourth section analyses the results; and the last section presents the conclusions of the study.
Banking management is one of the most researched fields in finance/economics. The models developed are based mainly on ratio analysis, with theories focused on the concepts of solvency, profitability, and risk [15]. The information extracted from basic financial statements (balance sheet and profit and loss account) must be complemented with a series of ratios that provide a clearer view of major financial difficulties or the risk of insolvency. These are circumstances that the authors Demirgüç-Kunt and Detragiache [16] consider warning signs when the various ratios deviate from their limit values.
In Spain, preliminary research on banking risks was carried out in the 1990s ([17–19], among others). Mar-Molinero and Serrano-Cinca [20] specifically pointed to ratios of Current Assets/Total Assets; (Current Assets—Cash)/Total Assets; Current Assets/Debts; Reserves/Debts; Net Profit/Total Assets; Net Profit/Equity; Net Profit/Debts; Cost of Sales/Sales and Cash-Flow/Debts, as the most indicative of insolvency risk for Spanish banks in the 1980s. In this sense, liquidity ratios took center stage in the analysis of bankruptcy risk. Gombola and Ketz [21] highlighted the strong correlation between cash flow from ordinary operations and profit, as did Larrán [22] in Spain. Thus, the financial dimension (liquidity linked to solvency) and the economic dimension (profitability) of banks were addressed.
NPL ratio is one of the most used measures of bank asset quality and it is used in credit risk models as a measure of credit risk. Literature has evidenced that NPL are affected by multiple factors such as: economic growth [23, 24], lagged credit growth [25], loan loss provisions—that are driven by GDP growth, private sector leverage and a lack of banks capitalizations—[26]; and, even, microeconomic individual bank level variables—bank size, net interest margin, capital ratio and market power—[23].
Capital ratios are also key indicators. Specifically, the Common Equity Tier 1 Fully Loaded Capital ratio (“CET1 Fully Loaded”) is one of the most widely used in predicting bank failures. This methodology is based on the credit risk capital requirements of the Basel Accords. Based on balance sheet data and the regulatory equity of the institutions, the probability of a bank default is defined as the probability of default where the unexpected losses associated with the debtors in the portfolio exceed the capital, given by the sum of the regulatory capital requirements and any excess capital. This method was introduced by De Lisa et al. [27], and has been the basis for the subsequent development of models incorporating risk-weighted assets. This ratio constitutes one of the six instruments of macro-prudential policy in Europe used to measure financial stability [28] and is one of the key indicators in the assessment of bankruptcy risk in Spain [29]. It is also used for financial stress models [30, 31].
Another commonly used ratio is the efficiency ratio, which is configured as a key element for bank profitability [32, 33]. Efficiency can be understood as the degree of optimality achieved in the management of resources for the production of banking services [34]. A broad methodology has been developed, with noteworthy technical efficiency [35, 36] and cost models [37, 38]. The efficiency studies carried out in the Spanish banking sector have been conducted from different points of view. Pueyo [39] conducts a study of efficiency indicators using the intermediation approach. Pastor and Serrano [40] address the efficiency of costs and profits. Prior et al. [38] make a comparison before and after the financial crisis, incorporating not only costs but revenue as a factor of analysis. In another area of study based on parametric models, Maudos [41] addresses efficiency through productivity and technical changes. Even Gallego et al. [42] explore central bank efficiency in the framework of the European Union.
Qualitative information that is more difficult to quantify, such as the personal characteristics of clients, is also available [43]. Technological progress in recent decades has enabled the development of models for profiling clients and defining their default risk, known as credit scoring [44], which became highly developed in the 1990s corporate sector [45]. One of the most significant indicators of bankruptcy risk is the default rate. In Spain, default rates are closely linked to the economic cycle. At times of strong economic growth, there is usually a rapid expansion of credit, which is one of the main causes of default. Fernández de Lis et al. [46] estimate that in Spain there is a 3-year lag between credit expansion and the appearance of non-performing loans. And it is precisely the largest banks that tend to record higher NPLs, increased by the herd mentality of bank managers, which tends to occur at times of credit expansion.
Finally, analyzing the results of different financial years is another widely used tool for assessing bank profitability. In recent decades, banking has been one of the sectors impacted by deregulation, globalization, and technological change. This has led to strong competition reflected in income statements and operating margins, leading to a convergence in bank profitability worldwide [10]. The determinants of bank profitability are largely based on the bank's profile, which influences bank profitability. The effect of high solvency is mixed. On the one hand, it allows for lower financing costs, supporting income [47], but fewer risks are assumed, leading to lower profitability expectations [48]. Asset quality is worth considering, as the literature shows that the higher the credit risk, the lower the return [47, 49]. Furthermore, several studies conclude that efficiency is related to profitability [47]. Bank size is another indicator that has been analyzed, but its relationship with profitability is unclear [50]. This similarly occurs with income diversification, where some authors show a positive correlation [51] and others a negative one [52]. Finally, the literature indicates that the relationship between profitability and business models is difficult to assess, as there are multiple factors that interfere in this relationship [53, 54].
The study covers the period from 2011 to 2021 and was carried out by selecting BBVA, Banco Santander and Caixabank, three institutions that account for a very high percentage of the assets and liabilities among Spanish banks in Spain [55–57]. According to Sobrino [58], these three institutions hold an aggregate 64% of the liabilities. This is important to note, since both Santander and BBVA include international operations in their consolidated balance sheets, which, in the case of Santander, accounts for more than 70% of the balance sheet, and, in the case of BBVA, more than 40%. These selected institutions carry out their activity under a common regulatory framework, not only in terms of compliance with international conventions and the supervision of the European Central Bank, but also with the direct coordination from the Bank of Spain. Also, they meet all the regulatory requirements of the Basel Committee and the Financial Stability Board (FSB), having been considered for their size, on a national and international scale, and for the fact that they prepare their financial information in compliance with the established regulations. Banco Santander has been considered a Global Systemically Important Institution since 2011 and BBVA, which held the distinction from 2012 to 2014 [59]. CaixaBank, in its absorption of Bankia, has also become a bank with systemic capacity that must be considered by all regulators as the leading operating institution, by some measure, in the Spanish market. In this sense, Bank of Spain [60] consider these three banks as other systemically important institutions (O-SIIs) that are subject to additional capital buffers.
The sources used was obtained from the own institutions. In the case of BBVA, in addition to the information obtained from the financial institution's website, the “Annual accounts with auditor's report and management report,” the “Financial report,” and the “Report with prudential relevance, Pillar III of Basel” were used for the study. In all cases, information was consulted for each of the years analyzed and extracted with the connotations and/or special characteristics of each year under examination. The financial group's consolidated accounts have been removed from the study, and used only for data comparisons and additional information.
In the case of Banco Santander, we secured access to the “annual report” published since the beginning of the study, the “Report with prudential relevance (Pillar III),” the “Report for other regulatory bodies,” and the “TLAC information” (Total Loss Absorbency Capacity). In some cases, for the purposes of comparison, we accessed official quarterly information and information issued to shareholders, which was not taken into consideration to verify the existence of the former and to avoid a possible difference in the content of the same data, which is observed in some cases (not affecting this part of the study), without obtaining clarification in this respect.
As regards CaixaBank, naturally the merger by absorption of Bankia can only entail an increase in all the parameters referring to volume and solvency, given the accounts of the absorbed institution. The data analyzed about CaixaBank and provided in its annual reports take into account the aforementioned absorption, which was finalized in 2021. The study was carried out using the annual and half-yearly financial statements, the “Other financial information” report, and the annual publication on “Risk management” which, although it analyses all aspects of this parameter, focuses on credit risk to obtain data. One particular feature of this institution is that, up to and including 2011, the data published are those of a savings bank, which only became the current bank in 2012.
In this study, we employ a descriptive and explicative methodology to analyze the management of systemic banking in Spain between 2011 and 2021 focusing on solvency and profitability. This method has involved a systematic collection and presentation of specific ratios to give a clear view of the systematic Spanish banks during the period pointed, being used by previous literature ([32, 61–63], between others).
The indicators used in the study are set out below. From the large number of ratios and data extracted and analyzed, a total of four indicators have been chosen as relevant for the subsequent evaluation of conclusions. It is important to note that in order to obtain all indicators, mainly at institutions with a strong international presence, only data referring to activity in Spain, and specifically to banking activity, have been considered, since other financial institutions may also contribute to the profit and loss accounts (retail finance companies).
The four ratios considered were: NPL ratio, CET1 Fully Loaded Capital ratio, efficiency ratio, and results for the year. Additionally fifth ratio (phased-in CET1) is included, but only for the purposes of understanding the changes in the CET1 Fully Loaded parameter established in the Basel III agreements. The choice of these ratios makes it possible to establish the parallelism between the way banks operate and their prudential criteria, through the minimum, necessary solvency established by the regulator. Specifically, the ratios and data considered are: NPL ratio, CET1 Fully Loaded Capital ratio, efficiency ratio, and profit for the year.
First, as regards the NPL ratio—defined as the ratio between the value of doubtful loans and the total loan portfolio—the objective is to provide a snapshot of the results of financial activity in terms of the treatment of assets, a key factor in the generation of profits, profitability, and therefore, solvency. A loan defaults when the debtor is at least 3 months late in paying the principal or interest on the debt (or financing), within the amortization period. It is defined by the data itself, the status of the portfolio of the institution analyzed, and the risk management and control carried out. This rate is noteworthy in the Spanish banking system, since the financial crisis left a legacy of high delinquency rates that have not yet been absorbed, according to Berges Lobera and Ontiveros Baeza [64].
In CaixaBank, the data was extracted from the risk information published by the bank itself. In the case of the other two banks, the same has been disaggregated for Spain, excluding other areas of activity and given that the ratios reported by BBVA and Santander include their global activity as a whole.
One parameter that reflects the increasingly significant intervention of the regulator is the CET1 Fully Loaded Capital ratio, which is intended to assess the effort imposed on financial institutions in exchange for authorization to operate within the system. This is apparently divorced from their courses of action on the market. The resources and equity of a financial entity are those that cannot be reclaimed at any time (shareholders or investors), there being no imperative obligation for remuneration. This parameter was chosen because the ratio assesses the financial health of a bank, relating the funds it holds to its ability to effectively weather unforeseen events that may arise. To prove solvency, financial institutions are required by the regulator to retain a percentage of capital in relation to their risk-weighted assets.
Obviously, the highest quality capital is that which is composed of assets that have the greatest capacity to absorb losses. This is supplemented by other items that are not purely capital, but nevertheless have a lower loss absorption capacity. Since they are fully available to the institution, they can, at any time, be used to meet unexpected losses without limitation. They include:
• Ordinary capital or common equity (CE), which encompasses capital and reserves.
• Basic equity, which includes shares issued by a bank, as well as reserves (profits not distributed to investors that are capitalized to strengthen equity), and shares issued by subsidiaries (within specific compliance criteria).
• Other resources that may also be counted as equity if the period of permanence is prolonged and remuneration is subject to certain limitations.
Core capital consists of eligible capital + reserves + profit attributable to the group. TIER-1 (or basic equity), consists of core capital + preference shares + eligible results for the year, minus capital losses on equities and fixed income, deductions for expected losses and others, deductions for goodwill and deductions for investments in financial institutions and insurance companies.
TIER-2 (or second tier resources), when added to TIER-1, consists of the appreciation of tangible assets, subordinated debt, general provisions, and other deductions for solvency purposes.
Eligible capital is the sum of TIER-1 and TIER-2. The minimum ratios, according to Basel III regulations, are set out in Figure 1.
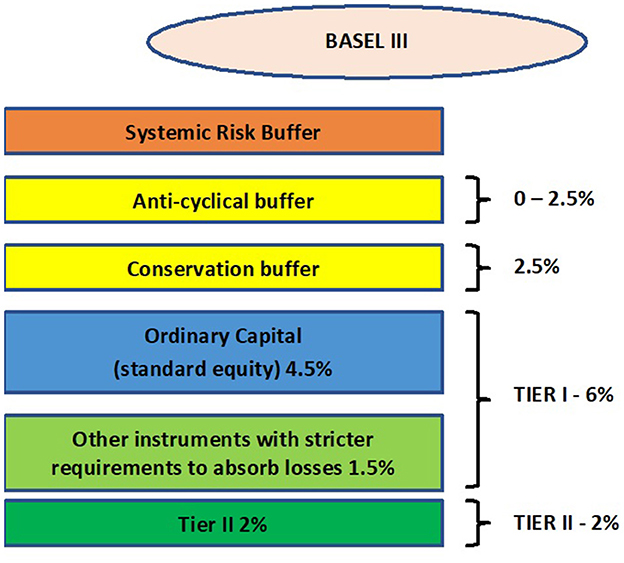
Figure 1. Estimated regulatory capital under Basel III. Source: prepared by authors.
To clarify, a bank whose capital equals the minimum legally established by the regulator can issue no further credit to clients, even if it increases deposits, until it raises capital to within the minimum parameters established for new financing. This involves measuring the risk-weighted assets (RWA), an element related to minimum capital, in accordance with the criteria established by the regulator.
At first, financial institutions published their solvency data with the initially established phased-in CET1 criteria, based on the weightings established for each financial year.
In 2014, regulators began to review the latest Basel III Accord [65], given the factors brought to light by the subprime mortgage crisis, the consequences of which had spread to the global economy as a whole. The perception was that certain parameters were incorrectly set for the solvency of financial institutions in situations of maximum stress, which could lead to extreme difficulty or even insolvency, with the resulting social disruptions [66].
The measurement basis was modified by the new criteria, establishing CET1 Fully Loaded as such, which financial institutions began to publish from the outset (together with previous CET1 criteria), regardless of its official entry into force in 2019.
There are specific causes that tarnished the CET1 Fully Loaded ratio of Spanish banks, mainly extensive deferred tax assets (DTA) on the balance sheet, whose modification in terms of their accounting as Tier 1 capital grew diluted over several years.
The information relative to CET1 ratio, has been obtained both from the bank financial statements and from the information about Basel III compliance published by the three banks.
For its part, the efficiency ratio is considered one of the main ways of measuring relative productivity. The information links the income obtained to the expenses necessary to obtain said income over a given period of time, which usually coincides with the calendar year. The lower the ratio, the more efficient the financial institution [67]. As an example, a ratio of 75 euros means it is necessary to spend 75 euros in order to earn 100 euros. The efficiency ratio is calculated by dividing the operating expenses by the gross margin. The efficiency ratio of Spanish banks is better than the European average due to the severe requirements established by the European financial assistance program [64]; while Spanish banks have an average ratio of 52.1, European banks have an average ratio of 66.6 [68].
The efficiency ratio has been obtained from the annual reports published by the three banks, disaggregating, from the global information and only in the case of Banco Santander and BBVA, that referring to Spain, contrasting this data with that collected by the regulator. In the case of financial results, they were obtained from the same source than for the aforementioned parameter.
A fourth specific data that allows us to evaluate and link the parameters selected for this study is the result for the financial year. This facilitates an effective quantitative assessment, for comparison to both solvency and profitability, with the logical exceptions derived from the items that are subtracted from the profit and loss accounts due to exceptional situations. Therefore, it is the result of the profit and loss account at the end of the financial year, which at financial institutions coincides with the last day of the year (except in anomalous situations).
In order to ensure the objectivity of the analysis carried out, it should be noted that two cases deals with the results of large international banking groups, in which only the activity conducted in Spain has been taken into account.
Each of the aforementioned figures has been analyzed individually, allowing conclusions to be drawn regarding the evolution and significance for each of the financial institutions analyzed. However, this analysis has been presented jointly for the three institutions, while also seeking a comparison between them, in an attempt to highlight best practices and development in compliance with the instructions issued by the regulator, within the management of each bank.
This section shows the results of each of the parameters by the three institutions analyzed, in a comparative manner in order to obtain, in the joint assessment, a solvent opinion on the principles of action.
Starting with the NPL ratio, it is clear that, following the stress tests carried out on all Spanish banks in preparation for the financial bailouts approved by the European troika and set out in the MoU (Memorandum of Understanding), thus following the re-evaluation of loans, the NPL ratio of banks rose considerably during the years analyzed. An extensive literature evidences a strong correlation between GDP growth and NPL ratio [23, 24]. So, there is a certain uniformity in the data obtained, both at the time of growth and in the subsequent redirection of figures toward criteria of greater moderation, which began in the 2012/2013 financial years (see Figure 2).
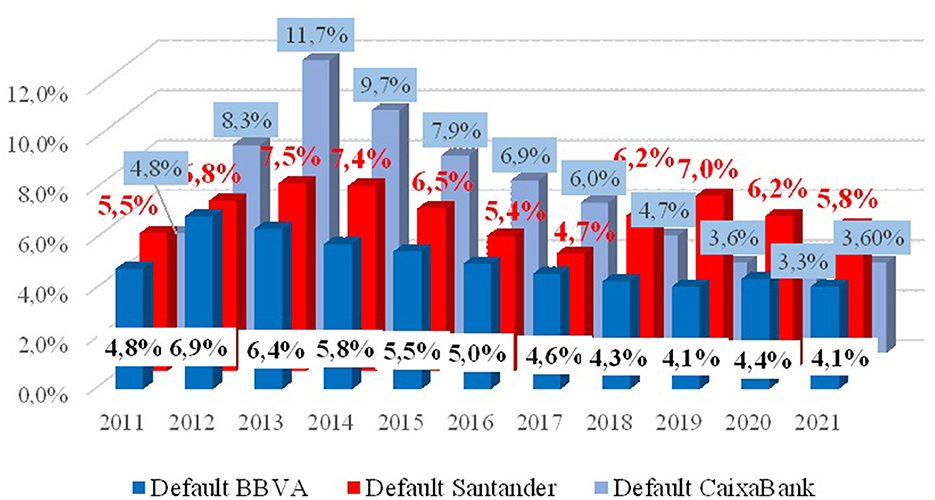
Figure 2. NPL ratio. Source: prepared by authors.
In all cases the decline is sharp, leaving as a particularity that reflected by Banco Santander in 2018, when the absorption of Banco Popular materialized and when, once its figures were diluted through the absorbing bank, it saw, despite everything, an increase of 150 b.p. in the overall NPL ratio. This increase was assessed using the bank's figures in the Spanish market. Banco Santander Spain, with a 5.8% NPL ratio in 2021 [69], was the national institution with the highest ratio, with special attention to the I.C.O. (Instituto de Crédito Oficial) financing lines.
Also evident from observing the curve and the percentages posted is a slower declaration of defaults relative to the others analyzed, meaning a slower cleanup of the portfolios and the more-than-likely offsetting of these data with those reflected in the other markets in which the bank operates. As a systemically important bank (declared as much in 2012), the regulator (without having found any instructions in this respect that the bank has included in its reports) may have consented to this type of operation in a period of maximum upheaval for the entire financial world.
Another peculiarity appears for CaixaBank, with percentages that are close to those of the then-nationalized and now-absorbed Bankia, without the monetary authority registering any impact on the difficulties of the newly launched bank in 2012, which was previously a defunct savings bank. At the time of its nationalization, Bankia's NPL ratio was 13%, while CaixaBank's was close to 12% in 2013. These levels exceed the ratio's 10% limit and constitute a high level of risk, as indicated by Demirgüç-Kunt and Detragiache [16].
The increase in CaixaBank's NPLs in 2021 appears to be the result of the absorption of Bankia.
In Figure 2, BBVA reflects the absorption of Unnim Bank in 2012, with an increase in NPLs of almost 40%, although the trend of linear reduction continues in 2015, when the integration of Caja Cataluña takes place.
More uniform lines and greater global decline is evident in the gradual reduction of client financing, replaced by capital investment in assets, mostly derived from the “free funds” established by the European Central Bank to avoid the collapse of the economy, and which most banks used, outside the market, in invest in products with a reduced level of risk.
BBVA, however, in an early review of the portfolio, underwent a significant rebound (from 4.10 to 4.40%) in 2020, weathering the first virulent phase of the COVID-19 crisis. In 2021, with the write-down policy, it regained the figures lost in 2019.
The second indicator considered within the framework of analysis and assessment is the CET1 Fully Loaded capital ratio, which, as mentioned above, became the official solvency control in 2019. The regulator modified the previous calculation bases integrated into the phased-in CET1 capital ratio, which included that which was considered mandatory for the financial institutions analyzed at a given time.
By contrast, the CET1 Fully Loaded ratio incorporates all the requirements that the regulator estimated must be fulfilled from the year in question and with a forecast of uniformity. In all cases, the ratios are determined as a percentage by the regulator and, for each institution, on the basis of the value assigned to risk-weighted assets (RWA).
Figure 3 refers to the core capital identified as CET1 Fully Loaded, whose publication and percentages are determined by Basel III. However, for systemically important banks (where the direct supervisor is the European Central Bank), the percentages, following the basic criterion, are reviewed annually as a special requirement for the institution.
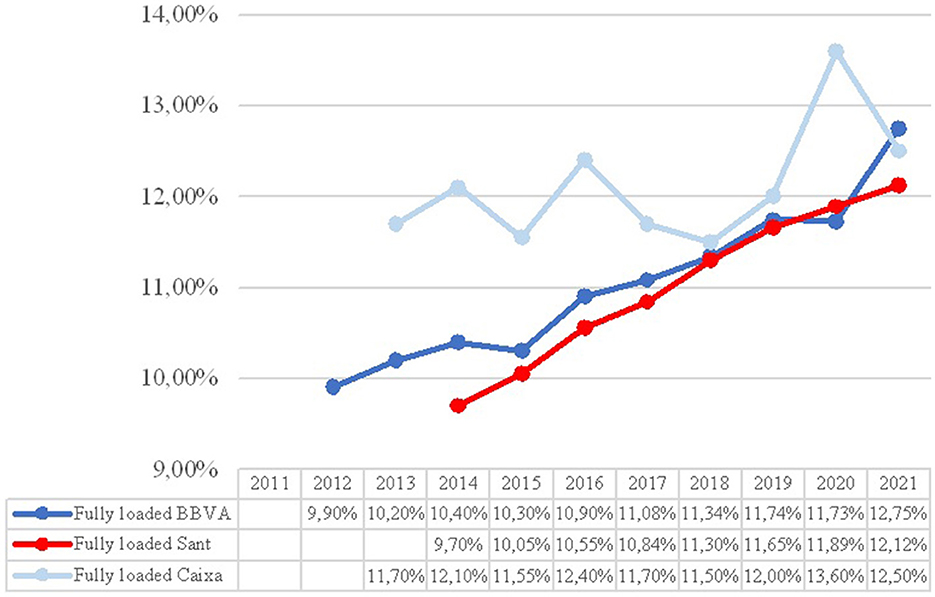
Figure 3. CET1 fully loaded. Source: prepared by authors.
The European Central Bank, which regulates systemically important banks (non-systemic banks are supervised by the respective national central banks), established a minimum CET1 Fully Loaded ratio of 9.7% for Banco Santander at the consolidated level for 2019 and 2020, based on the following calculation:
CET1 capital: 4.5% (Common Equity Tier 1)
AT1: 1.5% (Additional Tier 1)
C.C. buffer: 2.5% (capital conservation)
Global Systemically Important Financial Institution: 1%
Anti-cyclical buffer: 0.2% (UK presence)
By observing the comparison between the entities analyzed, we can conclude that there is at least a growth trend for all of them. These come from the situation in 2008 in which the degree of Spanish banks solvency was at levels close to the European average [70]. Especial is the case of CaixaBank, which in 2020 obtained a percentage increase of nearly 15%. The merger with Bankia pushed the figures significantly downward.
BBVA's decline in the 2020 financial year stems from the provision for possible insolvencies and write-offs, which, by reducing its volume of profits (losses in 2020), entails a reduction in part of the capital allocated to cover these situations. These results are in line with the vision of Valverde and Fernández [63].
Another of the parameters analyzed is the efficiency ratio, illustrated in Figure 4. After the falling rates of solvency until 2007 [61], the positive evolution started in the following years. The only one of the three banks that shows continuous movement is BBVA, which, with a slight upturn due to the takeovers of Unnim Banco and Caja Cataluña, climbed to 45.2, the highest level in the large banking segment in Spain, and one of the best in Europe, where the average is 66.6 points, compared to 52.1 on average in Spain (already cited). This behavior could be explained by internal management variables and macroeconomic environment as Neves et al. [71] pointed for the banking performance in the Iberian Peninsula when they measured it in terms of profitability and efficiency.
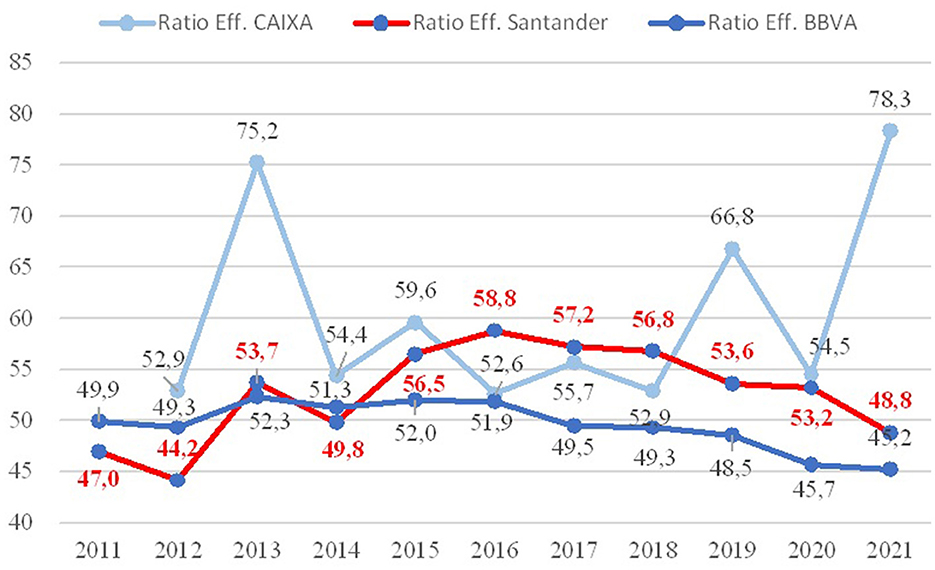
Figure 4. Efficiency ratio. Source: prepared by authors.
Banco Santander's ratio in Spain (48.8 p.p.) is different from its global ratio (47 p.p.). The ratio in Spain in 2012 is attributable to funds allocated to write-downs and the absorption of Banco Popular. Globally, it is also one of the best-positioned institutions in Europe in terms of efficiency.
In the case of CaixaBank, according to information obtained from CaixaBank/Bankia, in 2019 negotiations were already at an advanced stage for the merger, which ultimately resulted in a takeover.
The main ratio decline in the year under review stems from the high amounts provisioned for compensation to be paid in the massive departure of employees (surpluses) that the merger would generate (this information was also confirmed in an interview with a representative from the bank itself).
Given the above and with the parameters consulted in European banking, BBVA on the Spanish and global level, and Banco Santander on the global (not national) level, are two institutions with the best management, based on their efficiency. This assessment corroborates the conclusions showed by Maudos [62] and Zurita [72].
Finally, as regards the parameters determined for this study, the results of the year allow us to analyze the evolution of the remaining indicators, using this as the basis for each financial institution's course of action.
It is important to note that, among the institutions analyzed, only BBVA has recorded substantial losses (shown in Figure 5), covered by the bank's capital surplus, by making significant provisions in the two most significant years of this study: in 2012, following stress tests and as the century's first major financial crisis began in Spain, and in 2020, with a still-unresolved financial situation resulting from a global health crisis.
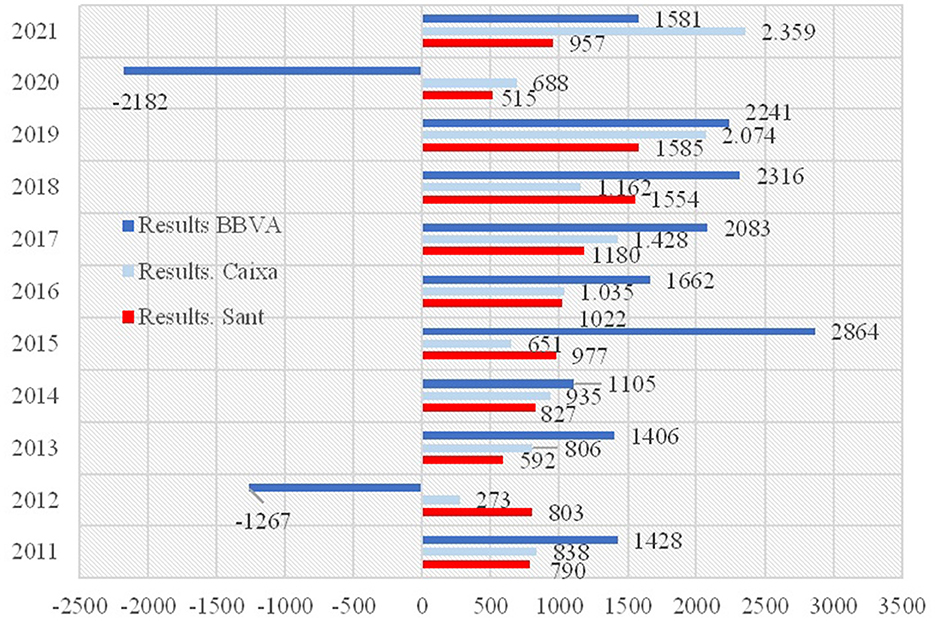
Figure 5. Evolution with bank results for the year (data in millions of euros). Source: prepared by authors.
The other two institutions operate in the same environment as the rest of the national banks, with a reduction of profits in times of crisis, given the significant provisions made to cover expected defaults. In this sense, Pérez Cimarra [32] shows how hard is the challenges of bank profitability.
However, it is worth noting the differences between the two crises analyzed, the first of which had a gestation period of several years, with much deeper roots in the financial system and consequences that reverberated long after, and the second, which arose within weeks, with a greater degree of protection for the financial institutions, given the numerous, prompt measures implemented by the European Central Bank, the most urgent of which are detailed in Table 1.
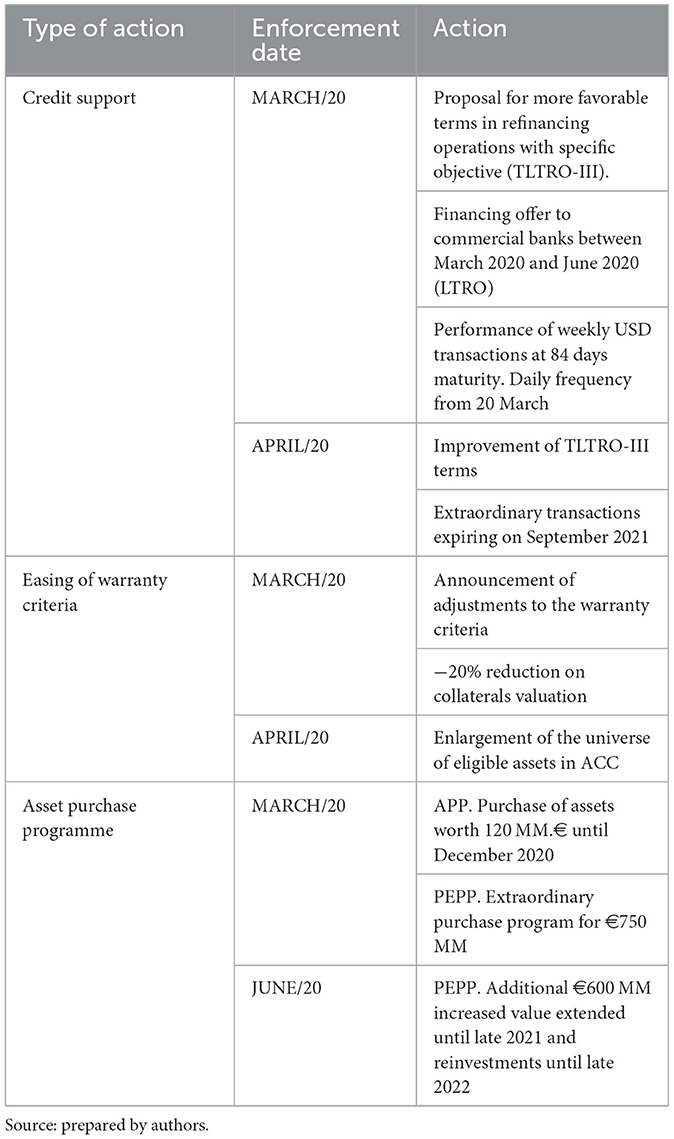
Table 1. Emergency regulations issued in 2020.
This study has explored whether the duality of solvency and profitability are opposed in a financial institution or whether, on the contrary, they are complementary and form a linked whole in banking management. To this end, a representative sample of three large Spanish banks, which hold 60% of market share, were analyzed using a comparative study of different ratios, leading to the conclusions set out below.
The first conclusion drawn from this study focuses on the need to manage the different types of risk in a professional manner and within the appropriate parameters of prudence and compliance with the rules. This would likely have prevented many of the negative externalities that the banks' actions had on society, i.e.,: the data recorded on bank defaults over several years and long after the first crisis studied. Based on this and on an assessment of the parameters, we can infer that non-performing loans, and thus the forecast of possible defaults, entail the deduction of significant amounts from the institutions' profit and loss account, thereby reducing profitability.
It is important to mention the parallelism between the figures obtained for Banco Santander and BBVA; this is also the case for CaixaBank, which nevertheless modified some of its parameters, mainly after the absorption of Bankia.
Solvency is set as a minimum by the regulator. A higher ratio results from the individual actions of banks, which sometimes sacrifice this range for the sake of cleaning up their balance sheets in order to consolidate the return to a positive framework in the long term. The absence of positive results at institutions, management that is not entirely adequate, or supervening situations that led to improvisation, also affect Core Capital when it must be used to cover declared write-offs or to make provisions provide for other types of situations (loss of solvency). Although the capitalization of profits allows institutions to grow through their link to the Tier 1 ratio and therefore RWA, the generation of financial instruments included in Core Capital also makes up for the impossibility of such capitalization. Therefore, a strengthening of solvency creates a favorable environment for medium-term profitability.
Another significant conclusion drawn is that the two crises were resolved differently, with first-tier banks in Spain (and in some cases in Europe) having solvency and efficiency figures in this second crisis much higher than those recorded in the subprime crisis. There is, therefore, an important parallel between the profitability of institutions and their solvency, the latter deriving from the management parameters that lead to the former.
From these observations and the data obtained, though minimal, it is possible to glimpse a much faster recovery for this second crisis, without the years-long implications of the “brick crisis”.
Therefore, these results show the need to manage the different types of risk in a professional manner and within the appropriate parameters of prudence and compliance with the rules. This would likely have prevented many of the negative externalities that the banks' actions had on society, i.e.,: the data recorded on bank defaults over several years and long after the first crisis studied.
This work presents limitations. One of them concerns the sample, given that it is made up of three institutions representing slightly more than 60% of Spanish banks. A higher percentage could have been considered, if not the total number of Spanish institutions. The study has also been placed within the framework of national institutions, without taking into account the top-tier institutions or those with the largest volume of assets in the framework regulated by the European Union and controlled by the European Central Bank. Finally, another perhaps transcendental limitation is that the study is limited to little more than a decade, in an attempt to cover the time frame in which both crises occurred, but in which the second has only just begun to be managed, and from which only the first 2 years of indicators are obtained. Extending this study over a longer period to coincide with the genesis of the US crisis and the end of the current crisis would entail a larger sample.
The conclusions obtained can be analyzed, without bias derived from the aforementioned timeframe.
ÁS-S: investigation, conceptualization, methodology, formal analysis, writing—original draft, data curation, writing—review and editing, and writing—final and supervision. CO-C: investigation, formal analysis, writing—review and editing, and writing—final and supervision. ÁH-T: investigation, methodology, formal analysis, writing—original draft, data curation, project administration, and supervision. All authors contributed to the article and approved the submitted version.
The authors declare that the research was conducted in the absence of any commercial or financial relationships that could be construed as a potential conflict of interest.
All claims expressed in this article are solely those of the authors and do not necessarily represent those of their affiliated organizations, or those of the publisher, the editors and the reviewers. Any product that may be evaluated in this article, or claim that may be made by its manufacturer, is not guaranteed or endorsed by the publisher.
1. Instituto Nacional de Estadística. Quarterly national accounts of Spain: QNA Main Aggregates (Preview). Fourth Quarter 2022. INE (2021). Available online at: https://www.ine.es/dyngs/INEbase/es/operacion.htm?c=Estadistica_C&cid=1254736164439&menu=ultiDatos&idp=1254735576581#:~:text=El%20PIB%20espa%C3%B1ol%20registra%20una,del%20cuarto%20trimestre%20de%202021.&text=Datos%20ajustados%20de%20efectos%20estacionales%20y%20de%20calendario (accessed December 5, 2022).
2. Bavoso V. Hail the new private debt machine: private equity, leveraged loans, and collateralized loan obligations. Law Finan Mark Rev. (2020) 14:141–50. doi: 10.1080/17521440.2020.1802547
3. Giese J, Haldane A. Covid-19 and the financial system: a tale of two crises. Oxf Rev Ec Policy. (2020) 36(Suppl._1):S200–14. doi: 10.1093/oxrep/graa035
4. Li Z, Farmanesh P, Kirikkaleli D, Itani R. A comparative analysis of COVID-19 and global financial crises: evidence from US economy. Econ Res. (2022) 35:2427–41. doi: 10.1080/1331677X.2021.1952640
5. Banco de España. Informe de estabilidad financiera (2006). Available online at: https://repositorio.bde.es/bitstream/123456789/11548/1/IEFnov06.pdf (accessed November 1, 2022).
6. Vousinas GL. Supervision of financial institutions: the transition from Basel I to Basel III. A critical appraisal of the newly established regulatory framework. J Finan Regul Comp. (2015) 23:383–402. doi: 10.1108/JFRC-02-2015-0011
7. Tribunal de Cuentas Europeo. La supervisión bancaria europea toma forma. La Autoridad bancaria europea en un contexto en evolución. Luxemburgo: Oficina de Publicaciones de la Unión Europea (2014). Available online at: https://eur-lex.europa.eu/legal-content/ES/TXT/PDF/?uri=CELEX:52014SA0005&from=SV (accessed November 1, 2022).
8. Demirgüç-Kunt A, Huizinga H. Financial Structure Bank Profitability. Vol. 2430. Washington, DC: World Bank Publications (2000). Available online at: https://openknowledge.worldbank.org/bitstream/handle/10986/21368/wps2430.pdf (accessed December 01, 2022).
9. Lee CC, Hsieh MF. The impact of bank capital on profitability and risk in Asian banking. J Int Money Finan. (2013) 32:251–81. doi: 10.1016/j.jimonfin.2012.04.013
10. Goddard J, Liu H, Molyneux P, Wilson JO. The persistence of bank profit. J Bank Finan. (2011) 35:2881–90. doi: 10.1016/j.jbankfin.2011.03.015
11. Baker M, Wurgler J. Do strict capital requirements raise the cost of capital? Bank regulation, capital structure, and the low-risk anomaly. Am Econ Rev. (2015) 105:315–20.
12. Tran VT, Lin CT, Nguyen H. Liquidity creation, regulatory capital, and bank profitability. Int Rev Financ Anal. (2016) 48:98–109. doi: 10.1016/j.irfa.2016.09.010
13. Bachiller P, Lasa FDB. Spanish savings banks: an analysis of their performance. In:Vrontis D, Weber Y, Tsoukatos E, , editor. Confronting Contemporary Business Challenges through Management Innovation. 6th Annual Conference of the EuroMed Academy of Business. Zürich: EuroMed Research Business Institute (2013). Available online at: https://www.researchgate.net/profile/Helena-Nobre/publication/317687081_Toward_a_Luxury_Brand_Definition/links/5948ff120f7e9b1d9b275d49/Toward-a-Luxury-Brand-Definition.pdf#page=121
14. Caballero D. Los cinco grandes bancos superarán el 70% de cuota de mercado en España. Diario Expansión (2020). Available online at: https://www.abc.es/economia/abci-cinco-grandes-bancos-superaran-70-por-ciento-cuota-mercado-espana-202009260202_noticia.html (accessed November 1, 2022).
15. Altman EI. Financial ratios, discriminant analysis and the prediction of corporate bankruptcy. J Finan. (1968) 23:589–609. doi: 10.1111/j.1540-6261.1968.tb00843.x
16. Demirgüç-Kunt A, Detragiache E. Determinants of banking crises: evidence from developing and developed countries. Staff Paper. (1998) 45:81–109.
17. Pina V. Estudio empírico de la crisis bancaria. Revista Española Financiación Contabilidad. (1989) 18:309–38.
18. Mar Molinero C, Ezzamel M. Multidimensional scaling applied to company failure. Omega. (1991) 19:259–74. doi: 10.1016/0305-0483(91)90044-T
19. Serrano Cinca C, Martín del Brío B. Predicción de la quiebra bancaria mediante el empleo de redes neuronales artificiales. Rev Española Financiación Contabilidad. (1993) 22:153–76.
20. Mar-Molinero C, Serrano-Cinca C. Quiebra bancaria: un enfoque de escalamiento multidimensional. Eur J Finan. (2001) 7:165–83. doi: 10.1080/13518470122202
21. Gombola MJ, Ketz JE. A note on cash flow and classification patterns of financial ratios. Account Rev. (1983) 58:105–14.
22. Larrán M. La asociación entre distintas acepciones del cash flow utilizadas en la literatura contable y financiera: evidencia empírica. Análisis Financiero. (1996) 69:62–76.
23. Salas V, Saurina J. Credit risk in two institutional regimes: Spanish commercial and savings banks. J Finan Serv Res. (2002) 22:203. doi: 10.1023/A:1019781109676
24. Pesaran MH, Schuermann T, Treutler BJ, Weiner SM. Macroeconomic dynamics and credit risk: a global perspective. J Money Credit Bank. (2006) 38:1211–61. doi: 10.1353/mcb.2006.0074
25. Nkusu M. Nonperforming Loans Macrofinancial Vulnerabilities in Advanced Economies, IMF Working Paper 11/161 (2011). Available online at: https://www.elibrary.imf.org/view/journals/001/2011/161/article-A001-en.xml (accessed December 1, 2022).
26. Glen J, Mondragón-Vélez C. Business cycle effects on commercial bank loan portfolio performance in developing economies. Rev Dev Finan. (2011) 1:150–65. doi: 10.1016/j.rdf.2011.03.002
27. De Lisa R, Zedda S, Vallascas F, Campolongo F, Marchesi M. Modelling deposit insurance scheme losses in a Basel 2 framework. J Finan Serv Res. (2011) 40:123–41. doi: 10.1007/s10693-010-0097-0
28. Lorenčič E, Festić M. The impact of macroprudential policy instruments on financial stability in Southern Europe. Our Econ. (2021) 68:25–34. doi: 10.2478/ngoe-2022-0003
29. Gómez-Fernández-Aguado P, Parrado-Martínez P, Partal-Ureña A. Risk profile indicators and spanish banks' probability of default from a regulatory approach. Sustainability. (2018) 10:1259. doi: 10.3390/su10041259
30. Paule-Vianez J, Gutiérrez-Fernández M, Coca-Pérez JL. Prediction of financial distress in the Spanish banking system: An application using artificial neural networks. Appl Econ Anal. (2019) 28:69–87. doi: 10.1108/AEA-10-2019-0039
31. Sun J, Li H, Huang QH, He KY. Predicting financial distress and corporate failure: a review from the state-of-the-art definitions, modeling, sampling, and featuring approaches. Knowl Based Syst. (2014) 57:41–56. doi: 10.1016/j.knosys.2013.12.006
32. Pérez Cimarra P. El reto actual de la rentabilidad bancaria. Boletín Económico de ICE, Información Comercial Española, 3121 (2020). p. 19–34. Available online at: https://scholar.archive.org/work/ookenzkyrvhi3j2pmkqv3am3wi/access/wayback/http://www.revistasice.com/index.php/BICE/article/download/6979/6988 (accessed December 2, 2022).
33. Valverde SC, Fernández FR. La rentabilidad bancaria diez años después del inicio de la crisis: la oportunidad digital. Madrid: Cuadernos Inf Económica (2018). p. 25–36.
34. Pastor J, Perez F, Quesada J. Efficiency analysis in banking firms: an international comparison. Eur J Oper Res. (1997) 98:395–407. doi: 10.1016/S0377-2217(96)00355-4
35. Berger AN, Humphrey DB. Efficiency of financial institutions: international survey and directions for future research. Eur J Oper Res. (1997) 98:175–212. doi: 10.1016/S0377-2217(96)00342-6
36. Drake L, Hall MJ, Simper R. The impact of macroeconomic and regulatory factors on bank efficiency: a non-parametric analysis of Hong Kong's banking system. J Bank Finan. (2006) 30:1443–66. doi: 10.1016/j.jbankfin.2005.03.022
37. Maudos J, Pastor JM. Cost and profit efficiency in the Spanish banking sector (1985–1996): a non-parametric approach. Appl Finan Econ. (2003) 13:1–12. doi: 10.1080/09603100110086087
38. Prior D, Tortosa-Ausina E, García-Alcober M, Illueca M. Costs, revenues and performance in Spanish banking: a comparative analysis of preand early crisis years. Spanish J Finan Account. (2016) 45:345–64. doi: 10.1080/02102412.2016.1193971
39. Pueyo J. La eficiencia de la banca española, 1922-82 (2003). Available online at: www.aehe.es/wp-content/uploads/2005/10/b23_pueyo.pdf (accessed December 2, 2022).
40. Pastor JM, Serrano L. The effect of specialisation on banks' efficiency: an international comparison. Int Rev Appl Econ. (2006) 20:125–49. doi: 10.1080/02692170500362868
41. Maudos J. Eficiencia, cambio técnico y productividad en el sector bancario español: una aproximación de frontera estocástica. Investig Econ XX. (1996) 20:339–58.
42. Gallego JCG, Cárceles MCP, Gil IG. Determinantes de eficiencia en bancos centrales de la UE. In:Velasco JMH, Céspedes JC, Pleguezuelo RH, , editors. Investigaciones en métodos cuantitativos para la economía y la empresa: homenaje al profesor Rafael Herrerías Pleguezuelo. Granada: Editorial Universidad de Granada (2016). p. 299–318.
43. Peterson M. Information: Hard and Soft. Chicago IL: Mimeo. Kellogg School of Management, Northwerstern University (2004).
44. Mester L. What's the Point of Credit Scoring? Federal Reserve Bank of Philadelphia Business Review (2007). p. 3–16. Available online at: https://fraser.stlouisfed.org/files/docs/historical/frbphi/businessreview/frbphil_rev_199709.pdf
45. Berger A, Scott Frame W, Miller N. Credit scoring and the availability, price,and risk of small business credit. J Money Credit Bank. (2005) 37:191–222. doi: 10.1353/mcb.2005.0019
46. Fernández de Lis S, Martínez Pagés J, Saurina Salas J. Credit growth, problem loans credit risk provisioning in Spain. Documento de Trabajo n.° 0018. Banco de España. Servicio de Estudios (2000). Available online at: https://repositorio.bde.es/bitstream/123456789/6709/1/dt0018e.pdf (accessed December 01, 2022).
47. Detragiache E, Tressel T, Turk-Ariss R. Where have all the profits gone. In: Paper Presented the International Monetary Fund Working Paper 2018/099. Washington, DC: International Monetary Fund (2018).
48. Goddard J, Molyneux P, Wilson JO. Dynamics of growth and profitability in banking. J Money Credit Bank. (2004) 35:1069–90. doi: 10.1353/mcb.2005.0015
49. Bikker JA, Hu H. Cyclical patterns in profits, provisioning and lending of banks and procyclicality of the new Basel capital requirements. PSL Q Rev. (2002) 55:143–75. doi: 10.13133/2037-3643/9907
50. Shehzad CT, De Haan J, Scholtens B. The relationship between size, growth and profitability of commercial banks. Appl Econ. (2013) 45:1751–65. doi: 10.1080/00036846.2011.637896
51. Demirgüç-Kunt A, Huizinga H. Bank activity and funding strategies: the impact on risk and returns. J Finan Econ. (2010) 98:626–50. doi: 10.1016/j.jfineco.2010.06.004
52. Kok C, Mirza H, Móré C, Pancaro C. Adapting bank business models: financial stability implications of greater reliance on fee and commission income. ECB Finan Stab Rev. (2016) 2:147–57.
53. Ayadi R, Naceur SB, Casu B, Quinn B. Does Basel compliance matter for bank performance? J Finan Stab. (2016) 23:15–32. doi: 10.1016/j.jfs.2015.12.007
54. IMF. Getting the policy mix right. In: Global Financial Stability Report (Chapter 1). Washington, DC: International Monetary Fund (2017). Available online at: https://www.imf.org/en/Publications/GFSR/Issues/2017/03/30/global-financial-stability-report-april-2017 (accessed November 1, 2022).
55. Banco Santander. Informe de auditoría, cuentas anuales y gestión del riesgo (2012-2020). Available online at: https://www.santander.com/es/accionistas-e-inversores/informacion-economico-financiera/informe-anual (accessed November 1, 2022).
56. BBVA. Cuentas anuales BBVA, Informes de Gestión, Informes del Auditor e Informe con relevancia prudencial – Pilar III de Basilea (2011-2020). Available online at: https://accionistaseinversores.bbva.com/accionistas/ (accessed November 1, 2022).
57. CaixaBank. Cuentas anuales individuales, informe de gestión e informe de auditoría (2012-2020). Available online at: https://www.caixabank.com/es/accionistas-inversores/informacion-economico-financiera/cuentas-anuales-semestrales.html (accessed November 1, 2022).
58. Sobrino R., CaixaBank Santander BBVA y Sabadell copan el 75% de los depósitos entre los principales bancos. Diario Cinco Días (2022). Available online at: https://cincodias.elpais.com/cincodias/2022/05/16/companias/1652723529_101157.html (accessed November 1, 2022).
59. Financial Stability Board (2022. Global Systemically Important Financial Institutions (G-SIFIs). FSB. Available online at: https://www.fsb.org/work-of-the-fsb/market-and-institutional-resilience/post-2008-financial-crisis-reforms/ending-too-big-to-fail/global-systemically-important-financial-institutions-g-sifis/ (accessed November 1, 2022).
60. Bank of Spain (2022). Entidades de importancia sistémica. Available online at: https://www.bde.es/bde/es/areas/estabilidad/herramientas-macroprudenciales/identificacion__bbe79f06544b261.html (accessed December 5, 2022).
61. Álvarez JA,. La banca española ante la actual crisis financiera. Estabilidad financiera (2008). p. 21–38. Available online at: https://repositorio.bde.es/bitstream/123456789/11525/1/ief0215.pdf (accessed December 1, 2022).
62. Maudos J. El sector bancario español en el contexto internacional: El impacto de la crisis. Madrid: Fundación de las Cajas de Ahorros (2011). Available online at: https://www.funcas.es/wp-content/uploads/Migracion/Publicaciones/PDF/1758.pdf (accessed December 1, 2022).
63. Valverde SC, Fernández FR. El progreso de la solvencia bancaria española en el contexto europeo. Cuadernos de Información económica (2016). p. 51–60. Available online at: https://www.funcas.es/wp-content/uploads/Migracion/Articulos/FUNCAS_CIE/253art06.pdf (accessed November 19, 2022).
64. Berges Lobera Á, Ontiveros Baeza E. La restructuración del sistema bancario: Gestación, gestión y digestión. Inf Comer Española Rev Econ. (2019) 909:45–56. doi: 10.32796/ice.2019.906.6765
65. BIS. Basilea III: Marco regulador global para reforzar los bancos y sistemas bancarios. Banco Internacional de Pagos (2010). Available online at: https://www.bis.org/publ/bcbs189_es.pdf (accessed November 1, 2022).
66. BIS. Actualizaciones. Resumen de las reformas de Basilea III. Banco Internacional de Pagos (2017). Available online at: https://www.bis.org/bcbs/publ/d424_hlsummary_es.pdf (accessed November 1, 2022).
67. Piot-Lepetit I, Nzongang J. Financial sustainability and poverty outreach within a network of village banks in Cameroon: a multi-DEA approach. Eur J Oper Res. (2014) 234:319–30. doi: 10.1016/j.ejor.2013.10.004
68. EBA. Risk Assessment of the European Banking System. European Banking Authority (2020). Available online at: https://www.eba.europa.eu/sites/default/documents/files/document_library/Risk%20Analysis%20and%20Data/Risk%20Assessment%20Reports/2020/December%202020/961060/Risk%20Assessment_Report_December_2020.pdf (accessed November 1, 2022).
69. Hidalgo C. El Santander, en alerta: tiene la mayor mora de la banca española y es el más expuesto a los ICO. Economía Digital (2022). Available online at: https://www.economiadigital.es/empresas/el-santander-en-alerta-tiene-la-mayor-mora-de-la-banca-espanola-y-es-el-mas-expuesto-a-los-ico.html (accessed November 1, 2022).
70. Maudos J. La banca española ante la crisis financiera. Rev Economía Castilla Mancha. (2009) 14:31–53.
71. Neves ME, Proença C, Dias A. Bank profitability and efficiency in Portugal and Spain: a non-linearity approach. J Risk Finan Manag. (2020) 13:284. doi: 10.3390/jrfm13110284
72. Zurita J. La reforma del sector bancario español hasta la recuperación de los flujos de crédito. Documento de trabajo, No. 14/12. Madrid: BBVA Research (2014). p. 1–23. Available online at: https://www.bbvaresearch.com/wp-content/uploads/2014/05/WP_1412.pdf (accessed December 01, 2022).
Keywords: banks, efficiency ratio, NPL ratio, solvency, profitability
Citation: Saiz-Sepúlveda Á, Orden-Cruz C and Hernández-Tamurejo Á (2024) Solvency and profitability: the duality of the large Spanish banks between the two economic-financial crises of the 21st century. Front. Appl. Math. Stat. 9:1146776. doi: 10.3389/fams.2023.1146776
Received: 17 January 2023; Accepted: 04 December 2023;
Published: 03 January 2024.
Edited by:
Giovanni Herrera-Enríquez, University of the Armed Forces (ESPE), EcuadorReviewed by:
María Pilar Sánchez González, University of Castilla-La Mancha, SpainCopyright © 2024 Saiz-Sepúlveda, Orden-Cruz and Hernández-Tamurejo. This is an open-access article distributed under the terms of the Creative Commons Attribution License (CC BY). The use, distribution or reproduction in other forums is permitted, provided the original author(s) and the copyright owner(s) are credited and that the original publication in this journal is cited, in accordance with accepted academic practice. No use, distribution or reproduction is permitted which does not comply with these terms.
*Correspondence: Álvaro Saiz-Sepúlveda, YWx2YXJvLnNhaXpAdXJqYy5lcw==
Disclaimer: All claims expressed in this article are solely those of the authors and do not necessarily represent those of their affiliated organizations, or those of the publisher, the editors and the reviewers. Any product that may be evaluated in this article or claim that may be made by its manufacturer is not guaranteed or endorsed by the publisher.
Research integrity at Frontiers
Learn more about the work of our research integrity team to safeguard the quality of each article we publish.