 Ethan Peters1
 Joshua C. Hall2*
- 1Allina Health, Minneapolis, MN, United States
- 2Department of Economics, John Chambers College of Business and Economics, West Virginia University, Morgantown, WV, United States
In the field of public economics, there is a literature on calculating the probability of being a decisive voter. The raison d'etre of this literature is to explain voter turnout. In this short empirical paper, we look at the question from a different angle. Heterogeneity in voting preferences means that some individuals vote rationally, others instrumentally, and some individuals are marginal and respond to changes in the probability of being decisive. Individuals with a preference for instrumental voting might be willing to pay more to live in an area with a greater probability of being a decisive voter. If this is the case, housing prices should reflect this higher willingness to pay. We test our theory using hedonic data from Columbus Ohio and find suggestive evidence that voters are willing to pay for a greater likelihood of being a decisive voter. Our results, however, cannot rule out other interpretations.
1. Introduction
Political scientists and economists have devoted significant time and resources to answering the deceptively simple question: Why do people go out and vote? One obvious answer is that people believe their vote matters. For one's vote to really matter it must determine the outcome of the election, that is, it must be decisive. This is typically referred to as instrumental voting since individuals are weighing the benefit of their vote being decisive toward something or someone they care about and against the cost of voting [1]. This is contrasted with expressive voting, where individuals vote not just for instrumental reasons, but rather for how it makes them feel to express a preference for a particular candidate or position [2].
The origins of this literature go back to the rational choice model of Downs [3]. One implication of the rational choice model of voting is that close elections should have higher voter turnout, since the probability that any one vote is decisive is higher than in a blowout. This observation, however, still leaves open the question of how to measure the probability of being a decisive voter. As a result, a significant literature has risen on how to measure the probability of being decisive [4–8].
In this short empirical paper, we look at this literature from a different angle. Heterogeneity in voting preferences means that even if all individuals vote expressively some individuals are willing to pay more to be closer to the decisive voter for instrumental reasons. If this is the case, housing prices should reflect this higher willingness to pay. We test our theory using hedonic data from Columbus Ohio and find suggestive evidence that voters are willing to pay for a greater likelihood of being a decisive voter. Our results, however, cannot rule out other interpretations.
2. Empirical approach and data
Hedonic price models are used to value goods not explicitly traded in markets. Christafore and Leguizamon [9, p. 7] explain: “the hedonic price model suggests that the price of a house represents the sum of expenditures on a number of bundled housing characteristics.” These housing characteristics include both tangible features such as house size, and non-tangible features such as crime rate. In our setting, the hedonic model is trying to empirically control for features of a house, including the probability of being a decisive voter. Hedonic models have tested such diverse topics such as whether homeowners value relative status [10], border congruence between school districts and municipalities [11], and homeowners associations [12].
Instrumental voters, when “voting with their feet,” should prefer to live in school districts where they have a higher probability of being the decisive voter, ceteris paribus. This is not because they value the act of voting itself (although they may very much value it), but rather it is because it is politics that helps to determine all the non-housing features of the community that are capitalized into housing prices. To paraphrase [13], this is because Tiebout needs politics to work. While schools or crime may be proximate on the minds of home buyers, ultimately everything provided by a local government is determined either by direct democracy such as levies or referenda or through local elected officials kept in check by homevoters [14].
Consider a home buyer thinking of moving into a well-regarded school district that is known for its small class sizes. Even though property taxes are high, the home buyer is fine with the high taxes because of the value they would receive from the good school district. The home buyer may care about a high probability of being the decisive voter because it is crucial to his or her ability to protect what is most likely their largest asset—their home [14]. The greater the likelihood of being the decisive voter, the greater the likelihood that their preferences will win out at the ballot box.
To test the probability of being a decisive voter empirically, we employ the well-known housing data set created by David Brasington. This data set was the first large-scale data set of arms-length home sales linked to a wide variety of governmental and environmental variables. In creating this public good, Brasington and others have been able to test a wide-variety of theories in public, urban, and regional economics [15–19].
We use data for the Columbus Ohio Metropolitan Statistical Area (MSA). Although the Brasington data set contains arms-length home sales throughout the state of Ohio in the year 2000, Brasington and Hite [16] show the segmentation of Ohio housing markets across MSAs. Given that market segmentation, we focus only on the Columbus Ohio MSA as it has a relatively high degree of interjurisdictional competition, with 24 school districts represented in the data. We have 11,888 arms-length home sales within these 24 school districts during the year 2000. The data set contains a wide variety of housing and community characteristics and we follow the Christafore and Leguizamon [9] in terms of model specification, with the exception of our measure of the probability of being decisive.
In measuring the probability of being decisive, we use the following formula presented by Mueller [20]:
Where n equals the number of voters. While we recognize that there are a number of different approaches to calculating the probability of being the decisive voter in a general election with two candidates or options (pass or fail), we thought it most appropriate to begin our exploratory analysis with the measure employed in the standard textbook in the field.
Ideally, we would use voter registration data to get the number of voters. However, we were not able to obtain that data. From the 2000 Census, we were able to obtain total population of each school district and we use the total population numbers in our analysis. To the extent that the correlation between voting-age population and total population is not perfect across school districts, our measurement of the probability of being the decisive voter is off. For this, and other reasons highlighted in our concluding remarks, we encourage replication of our results with better data and different contexts. Table 1 shows our measures of the probability of being the decisive voter by school district. Districts are listed from the highest probability to the lowest. The probability of being the decisive voter across school districts in Ohio is driven by population differences. These population differences reflect historical development patterns, past zoning decisions, and household preferences in response to public goods provision. For example, some districts could have zoned for greater density per acre than others. Also, some districts have more square mileage than others allowing for greater population, conditional on zoning.
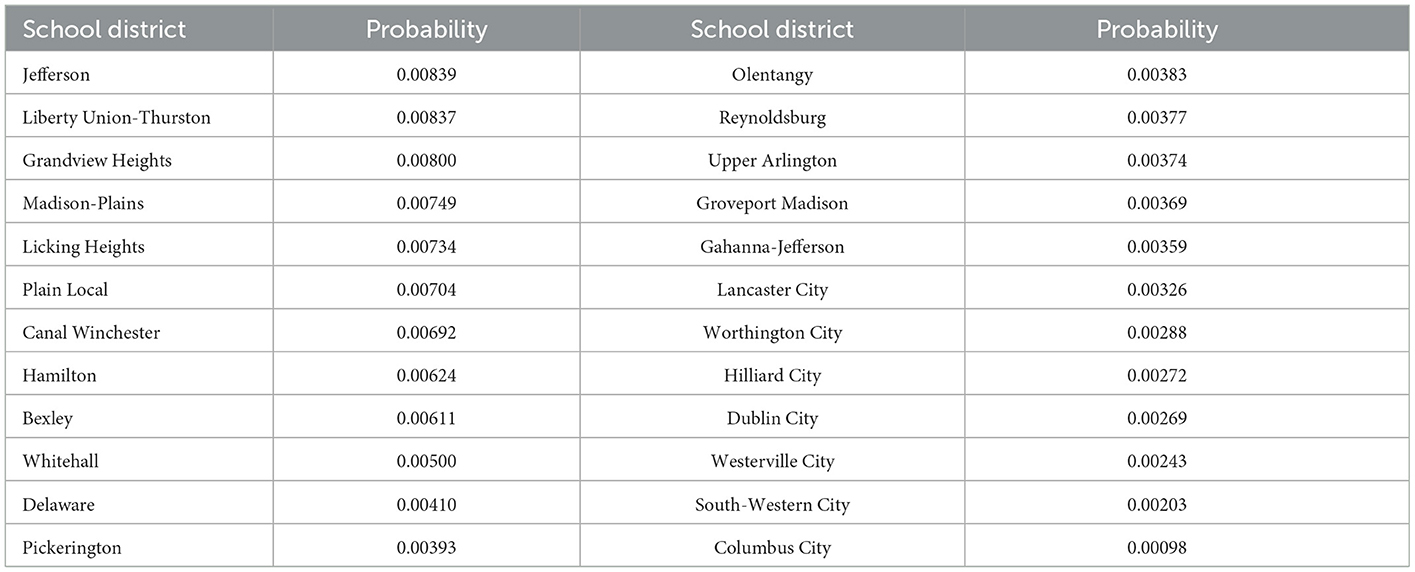
Table 1. Probability of being a decisive voter in a Columbus Ohio school district in 2000.
Descriptive statistics for our data are in Table 2. For a full description of the source of these variables and the steps taken to ensure that they are arms-length home sales, we refer the reader to any of the papers by the data set's creator [16, 18, 19].

Table 2. Summary statistics for Columbus, Ohio hedonic data set.
The descriptive statistics show a wide variation across our sample. We have a minimum home sale of $30,000 and one of over eight million! In our empirical work, we use the natural log of housing prices as is standard in the literature due to the skewness of the data. The mean housing price in our sample is $138,748 and the median $119,900.
Our covariates are standard for hedonic papers. We have housing features such as the age of the home, house size, lot size, presence of central air conditioning, a fireplace, deck, whether it is ranch home, and the number of full and partial bathrooms. In our empirical, analysis we square house age, house size, and lot size. We do so to account for any possible non-linearity in the relationship between these variables and housing prices. For example, depreciation means that housing prices decline with age, except when a house becomes historic. Squaring housing age allows us to capture this effect non-linear effect.
Table 2 shows that the 68 percent of the houses in our sample have air conditioning, while only 53 percent have fireplaces. Very few homes have decks and 41 percent of homes are only one story. The average house has 1.49 full bathrooms and 0.52 partial bathrooms. Lot size is in tens of thousands of square feet, thus the average house in our sample is 1,600 square feet. The average lot size is 9,714 square feet, or almost a quarter of an acre.
The data set also includes neighborhood characteristics associated with the houses, such as income, racial, crime, and schooling data. In 2000, Ohio tested students in several grades and we use math scores in grades 4, 6, and 12. The mean passage rates on the three test score measures are 31, 30, and 32 percent. While these mean proficiency scores seem low, at this time these tests were diagnostic for these grades and therefore teachers were not “teaching to the test” as might have occurred in more recent years.
3. Empirical results
We estimate our hedonic model using Ordinary Least Squares (OLS). The results of the regression are in Table 3. To focus attention on the variable of interest, we do not report other district-level variables in the table, although they are included in the regression. With the exception of the primary variable of interest, we only report results for housing characteristics in the interest of parsimony. Our model explains 74.9 percent of the variation in housing prices in the Columbus Ohio MSA in 2000.
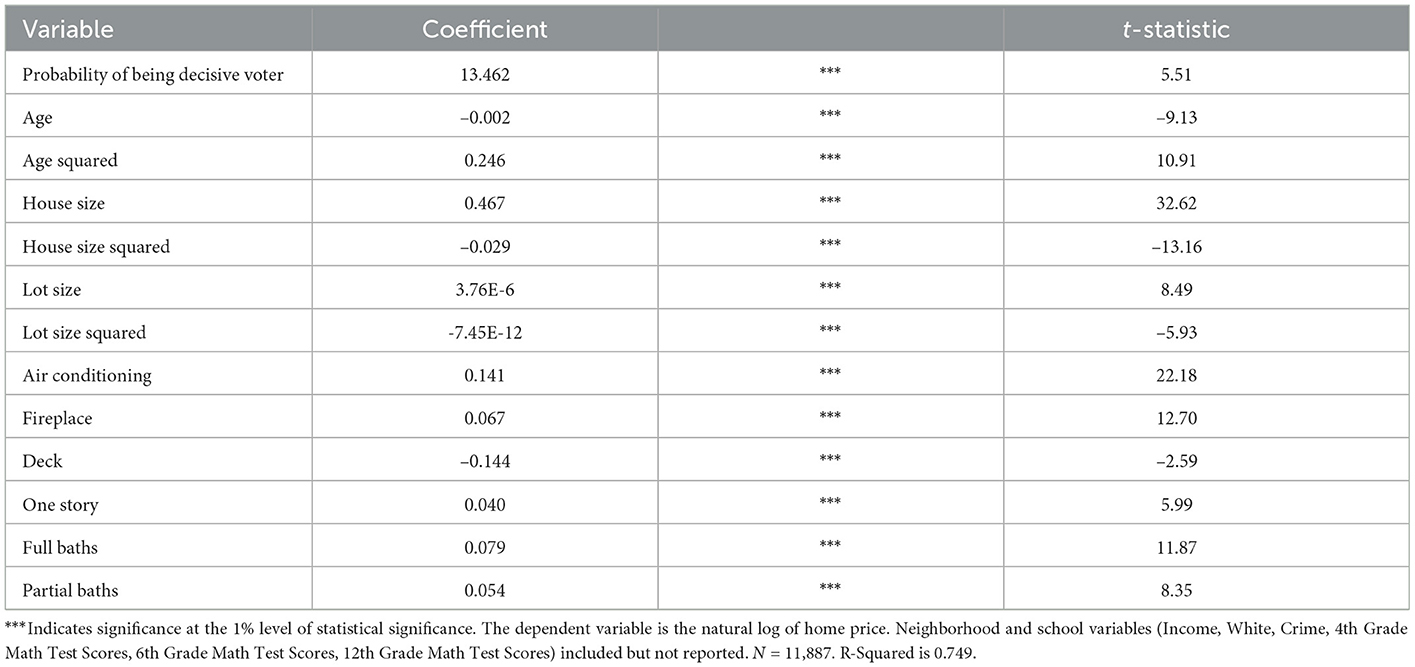
Table 3. Determinants of housing prices in Columbus, Ohio MSA.
The first thing to note is that our regressions results are consistent with the hedonic literature. Larger houses sell for more, other things being equal, but there is such a thing as “too big.” The same is true for lot size. The presence of fireplaces are associated with higher sale prices, while having a deck lowers prices. Houses sell for less as they age, until they are historic.
With respect to our primary variable of interest, we find a positive and statistically significant coefficient on the probability of being the decisive voter. Evaluated at the mean value of the probability of being the decisive voter (0.00235), the coefficient of 13.462 suggests that homeowners are willing to pay roughly $1,650 for their probability of being a decisive voter. That is about 1.2 percent of the sale price of the mean home in our sample.
This estimate may seem large for a feature that is likely not directly cared about by homeowners or home buyers. After all, no one has ever asked their realtor to find them a house in an area with a higher probability of being the decisive voter. Before discussing why this estimate may be overstated, it is important to note that markets aggregate dispersed, often inarticulate, information through prices. Even if no one is aware of the benefit of a high probability of being the decisive voter, the fact that it facilitates political outcomes that create value for residents is a sufficient heuristic to create a positive level of willingness to pay. With that being said, this estimate is likely inflated due to omitted variable bias from the inability to include preference heterogeneity in the regressions.
4. Concluding remarks
Our results are suggestive of homeowners valuing being the decisive voter. Two caveats, however, are in order. First, and probably most important is the fact that Kaniovski and Mueller [21] find that the larger communities are more heterogenous. We cannot distinguish between community heterogeneity and the probability of being the decisive voter. What we are attributing to being decisive could be a preference for homogeneity in preferences. Given Tiebout [22] sorting, our estimates are likely to reflect both preference for homogeneity of preferences and likelihood of being decisive. Future work should try to disentangle these two.
One possible approach would be to utilize interviews about preferences in a manner similar to Fischel [23] across a number of jurisdictions in order to create a heterogeneity in preferences variable. A different approach would look for a natural experiment where was a plausibly exogenous and large change in the probability of being the decisive voter across school districts and compare coefficient estimates before and after the change.
The second caveat relates to external validity. Ohio has 611 school districts across its 88 counties and thus has interjurisdictional competition. Other states, especially in the West and South, do not. Our hypothesis is that we would not observe an effect in areas with weak competition. This, however, needs to be tested with other hedonic data sets.
Data availability statement
The dataset analyzed in this study can be found in the Figshare Data Repository at: https://doi.org/10.6084/m9.figshare.21788345.v1.
Author contributions
The idea for the paper was JH. EP did the initial draft and data analysis. JH edited the paper and produced the final draft. All authors contributed to the article and approved the submitted version.
Acknowledgments
The authors would like to thank participants at the 2019 Mid-Continent Regional Science Association meetings for their helpful feeback.
Conflict of interest
The authors declare that the research was conducted in the absence of any commercial or financial relationships that could be construed as a potential conflict of interest.
Publisher's note
All claims expressed in this article are solely those of the authors and do not necessarily represent those of their affiliated organizations, or those of the publisher, the editors and the reviewers. Any product that may be evaluated in this article, or claim that may be made by its manufacturer, is not guaranteed or endorsed by the publisher.
References
1. Becker G, Mulligan C. Is voting rational or instrumental? In:Hall JC, , editor. Explorations in Public Sector Economics. New York, NY: Springer (2017). p. 1–11. doi: 10.1007/978-3-319-47828-9_1
2. Lee DR, Murphy RH. An expressive voting model of anger, hatred, harm and shame. Public Choice. (2017) 173:307–23. doi: 10.1007/s11127-017-0480-6
4. Barzel Y, Silberberg E. Is the act of voting rational? Public Choice. (1973) 60:51–8. doi: 10.1007/BF01718806
5. Beck N. A note on the probability of a tied election. Public Choice. (1975) 23:75–9. doi: 10.1007/BF01718092
6. Margolis H. Probability of a tie election. Public Choice. (1977) 31:135–8. doi: 10.1007/BF01718979
7. Chamberlain G, Rothschild M. A note on the probability of casting a decisive vote. J Econ Theory. (1981) 25:152–62. doi: 10.1016/0022-0531(81)90022-3
8. Fischer AJ. The probability of being decisive. Public Choice. (1999) 101:267–83. doi: 10.1023/A:1018671000966
9. Christafore D, Leguizamon S. The influence of gay and lesbian coupled households on house prices in conservative and liberal neighborhoods. J Urban Econ. (2012) 71:258–67. doi: 10.1016/j.jue.2011.09.004
10. Leguizamon SJ, Ross JM. Revealed preference for relative status: Evidence from the housing market. J Hous Econ. (2012) 21:55–65. doi: 10.1016/j.jhe.2012.01.001
11. Hall J. Does school district and municipality border congruence matter? Urban Stud. (2017) 54:1601–18. doi: 10.1177/0042098015619868
12. Grace K, Hall JC. The value of residential community associations: evidence from South Carolina. Int Adv Econ Res. (2019) 25:121–9. doi: 10.1007/s11294-019-09723-w
13. Fischel WA. Municipal corporations, homeowners, and the benefit view of the property tax: essays in honor of C. Lowell Harriss. In:Oates WE, , editor. Property Taxation and Local Public Finance. Cambridge: Lincoln Institute for Land Policy (2000). p. 33–77. doi: 10.2139/ssrn.233210
14. Fischel WA. The Homevoter Hypothesis: How Home Values Influence Local Government Taxation, School Finance, and Land-Use Policies. Cambridge: Harvard University Press (2001).
15. Brasington DM. Differences in the production of education across regions and urban and rural areas. Reg Stud. (2002) 36:137–45. doi: 10.1080/00343400220121927
16. Brasington DM, Hite D. Demand for environmental quality: a spatial hedonic analysis. Reg Sci Urban Econ. (2005) 35:57–82. doi: 10.1016/j.regsciurbeco.2003.09.001
17. Brasington D, Haurin DR. Educational outcomes and house values: a test of the value added approach. J Reg Sci. (2006) 46:245–68. doi: 10.1111/j.0022-4146.2006.00440.x
18. Brasington DM. Private schools and the willingness to pay for public schooling. Educ Financ Policy. (2007) 2:152–74. doi: 10.1162/edfp.2007.2.2.152
19. Brasington DM, Haurin DR. Parents, peers, or school inputs: which components of school outcomes are capitalized into house value? Reg Sci Urban Econ. (2009) 39:523–9. doi: 10.1016/j.regsciurbeco.2009.05.002
21. Kaniovski S, Mueller DC. Community size, heterogeneity and voter turnouts. Public Choice. (2006) 129:399–415. doi: 10.1007/s11127-006-9063-7
22. Tiebout CM. A pure theory of local expenditures. J Polit Econ. (1956) 64:416–24. doi: 10.1086/257839
Keywords: median voter, hedonic, decisive voter, instrumental voting, expressive voting
Citation: Peters E and Hall JC (2023) The value of being the decisive voter: Exploratory evidence from a hedonic model. Front. Appl. Math. Stat. 9:1133397. doi: 10.3389/fams.2023.1133397
Received: 28 December 2022; Accepted: 17 January 2023;
Published: 03 February 2023.
Edited by:
Franklin Mixon, Columbus State University, United StatesReviewed by:
Charles Kroncke, Mount St. Joseph University, United StatesRand Ressler, Georgia Southern University, United States
Copyright © 2023 Peters and Hall. This is an open-access article distributed under the terms of the Creative Commons Attribution License (CC BY). The use, distribution or reproduction in other forums is permitted, provided the original author(s) and the copyright owner(s) are credited and that the original publication in this journal is cited, in accordance with accepted academic practice. No use, distribution or reproduction is permitted which does not comply with these terms.
*Correspondence: Joshua C. Hall,  am9zaHVhLmhhbGwmI3gwMDA0MDttYWlsLnd2dS5lZHU=