 Qusain Haider1*
 Ali Hassan
95% of researchers rate our articles as excellent or good
Learn more about the work of our research integrity team to safeguard the quality of each article we publish.
Find out more
ORIGINAL RESEARCH article
Front. Appl. Math. Stat. , 30 March 2023
Sec. Mathematical Biology
Volume 9 - 2023 | https://doi.org/10.3389/fams.2023.1072447
This article aims to describe the simulation studies of the hepatitis B virus non-linear system using supervised neural networks procedures supported by Levenberg-Marquardt back propagation methodology. The proposed strategy has five distinct quantities: susceptible X(t), symptomatic infections Y(t), chronic infections W(t), recovered population R(t), and a population that has received vaccinations Z(t). The reference data set for all three distinct cases has been obtained utilizing the ND-Solver and Adams method in Mathematica software. The outcomes have been validated with performance plots for all cases. To check the accuracy and effectiveness of proposed methodology mean square error has are presented. State transition, and regression plots are illustrated to elaborated the testing, training, and validation methodology. Additionally, absolute errors for different components of hepatitis B virus model are demonstrated to depict the error occurring during distinct cases. Whereas the data assigned to training is 81%, and 9% for each testing and validation. The mean square error for all three cases is 10−12 this show the accuracy and correctness of proposed methodology.
Hepatitis is a liver disease caused by a different type of virus. Hepatitis is an inflammatory condition of the liver. It is commonly the result of a viral infection, but there are some other possible causes of hepatitis. These are namely; autoimmune hepatitis and hepatitis that occurs as a secondary result of medication, drugs, toxins, and alcohol consumption. There are five types of hepatitis, according to WHO 354 million people worldwide are living with this infectious disease. These types include A, B, C, D, and E type hepatitis. It has been found through intensive studies that hepatitis A is more of a short-term disease and is caused by a virus named HVA. Additionally, Hepatitis B and C are caused by HVB and HCV viruses, respectively. It has been discovered that hepatitis B is often an ongoing and chronic condition. Hepatitis C is a blood-borne viral infection and it is also assumed to be a long-term condition. Whereas hepatitis D is a very rare form of hepatitis and it only occurs when a patient already has contracted hepatitis B. It is worth mentioning here that a total of 5% of hepatitis B patients always have hepatitis D. Hepatitis E occurs due to bad sanitation and it could be really dangerous for pregnant women.
Littlejhon et al. [1] discussed the origins and evolution of hepatitis B and hepatitis D. Simmonds et al. [2] investigated human hepatitis viruses in length. Wang et al. [3] examined the current status of human genetic alleles which are associated with hepatitis B. Chu et al. [4] explored the dispersion of hepatitis B in Taiwan and its distribution through DNA in serum. McMahon et al. [5] studied the genotype and sub-genotype of hepatitis B on natural hepatitis B virus history. Krugman et al. [6] explained the prevention of hepatitis B occurrence in humans. Ofori-Asenso and Adom-Agyeman [7] provided a critical review and analysis of hepatitis B through selective studies from 1995-2015 in Ghana. Schaefer et al. [8] elaborated on the significance of the genotype for the hepatitis B virus. Shi et al. [9] introduced a correlation between the hepatitis B virus and its genotype. Beutels et al. [10] gave a detailed review of the economic evaluation of hepatitis B immunization.
Zhao et al. [11] introduced a mathematical model of hepatitis B virus transmission and its application for vaccination strategy in China. Khan et al. [12] discussed the mathematical model of the hepatitis B model with Caputo fractional derivative. Recently, Din et al. [13] demonstrated the application of the ABC derivative to analyze the mathematical model of the hepatitis B virus. Zhang and Xu [14] described a mathematical model of the hepatitis B virus with infection age structure. Khan et al. [15] conducted a fractional analysis of a mathematical model of hepatitis B virus transmission. Zhong et al. [16] demonstrated an asymptotic class of ABC derivative for the hepatitis B virus model. Shaikh et al. [17] conducted a numerical study on the epidemic model of the hepatitis B virus model. Otoo et al. [18] explained the dynamics of the hepatitis B mathematical model with an optimal control strategy. Liu et al. [19] examined the hepatitis B virus model with non-singular and non-local kernels for the fractional mathematical model. Manna and Hattaf [20] introduced a numerical study of a generalized delay-distributed model of the hepatitis B virus in presence of two kinds of transmission mode and adaptive immunity. Shen et al. [21] conducted mathematical analysis of HBV and HCV co-infection model using non-singular fractional order derivative.
In recent years mathematicians have been exploring new methodologies to examine different epidemics. The most recent interest that had created chaos all over the world has been extensively examined by researchers from all fields of science. Volinsky et al. [22] discussed the stability and Cauchy matrix of a mathematical model of hepatitis B with control on the human immune system near the neighborhood of equilibrium-free points. Din et al. [23] explained the stochastic dynamics of the hepatitis B virus. Ahmad et al. [24] addressed semi-analytical solutions of hepatitis B with fractional order Caputo-Fabrizio type derivatives. Chataa et al. [25] examined a mathematical model for the transmission of the hepatitis B virus in the presence of imperfect vaccination.
Alrabaiah et al. [26] discussed COVID-19 spread comparatively using fractional order modified SEIR model. Kumar et al. [27] Genocchi polynomials with a wavelet based numerical scheme to investigate measles disease considering fractional order SEIR model. Mohammadi et al. [28] presented theoretical analysis of hearing loss due to mumps virus and optimal control using Caputo-Fabrizio fractional approach. Kumar at al. [29] studied fractional SIR model of infectious disease using Bernstein wavelets with effective numerical method. Ghanbari et al. [30] used non-singular fractional order to investigate the behavior of immune and tumor cells in immunogenetic tumor model. Rehman et al. [31] investigated cancer tumor disease using fractional order mathematical model. Kumar et al. [32] discussed fractional tumor-immune model to investigate tumor and effector cells for the treatment of cancer. Hebanom et al. [33] conducted a numerical simulation on the impact of vaccination and treatment using fractional order mathematical model of hepatitis B virus.
In this work, the hepatitis B virus model with artificial neural networks is examined. In addition, different components of the model are investigated to check the high accuracy and performance of proposed methodology. The goal of this study is to introduce numerical simulations of the hepatitis B virus non-linear system (HBVNS) of integer order (IO) together with a numerical rehabilitation of stochastic neural network (SNN) methodologies supported by Levenberg-Marquardt back propagation (LBMQBP), also defined as ANNs-LBMQBP. The ANNs-LBMQBP are suggested as a numerical method for solving either IO-XYWRZ system. The local and global search efficiencies based on the complex, singular, and stiff models have been used to exploit stochastic solvers [35–39]. Following non-linear singular frameworks [40] and fractional-order models [41–43] are a couple of additional stochastic schemes. The ANNs-LBMQBP has been used in this study to propose solutions for the integer order HBVNS based on the XYWRZ. It has been discovered that the time IO derivatives have been used in a variety of applications under various conditions. The framework built on memory is represented by the IO derivative [44–48]. Following novel features illustrate the novelty of present work with help of the ANNs-LBMQBP are presented as:
I. An initial design of its HBVNS is introduced based on the non-linear differential system form of the XYWRZ effects.
II. Stochastic solvers have never been used to present solutions to the HBVNS system using the XYWRZ non-linear model.
III. The non-linear mathematical form of the XYWRZ has been used to present the numerical stochastic measures based on the ANNs-LBMQBP for the IO-HBVNS.
IV. To verify the superiority of stochastic computing solvers, comparisons of the results obtained using ANNs-LBMQBP with the reference (Adams-Bashforth-Moulton) solutions have been presented.
V. The non-linear mathematical form of the XYWRZ has been used to achieve the absolute error (AE) in good measures for the IO-HBVNS.
VI. The developed ANNs-LBMQBP for solving the IO-HBVNS system is validated for dependability and consistency utilizing the regression, STs, MSE, EHs, and similarity performances.
The dynamic behavior of the HBV disease has been extensively examined over the years by numerous scientists. Mathematical models for HBV infectious diseases are a hot research topic right now. Din and Li [34] developed a mathematical model for HVB in which the entire population, represented by N(t), is divided into five groups at time t: acutely infected Y(t), susceptible S(t), recovered with this virus R(t), chronically infected W(t), and individuals who have received vaccinations with Z(t).
The non-linear mathematical form of the hepatitis B virus model along with initial condition [34]:
The parameters used in this model are described in the Table 1 below. Assume that the vaccination is not 100% effective in other word if τ1 denotes the vaccination rate, then 0 ≤ τ1 ≤ 1, if τ1 = 0 this means no vaccination and if τ1 = 1 indicate that whole population is vaccinated. As the model illustrated in Equation (1) is a deterministic model, it is quite easy to demonstrate that there always exist a disease free fixed point H0. This point can be obtained form the model (1) by equating the model RHS equal to zero. The following theoretical results are obtained using the following studies [13, 23].
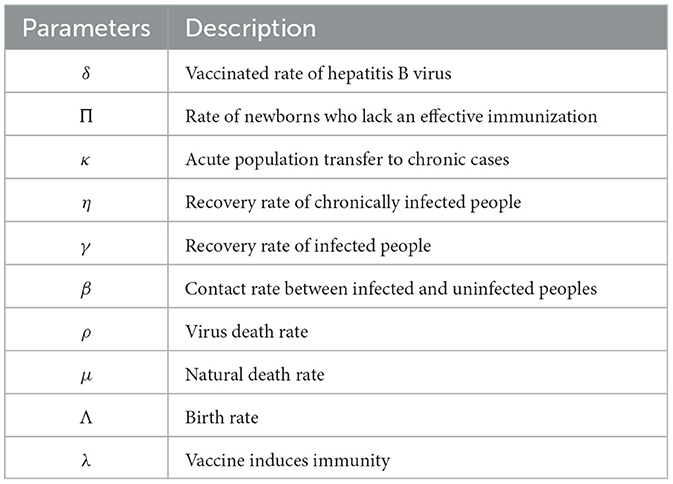
Table 1. Parameters involved in the above XYWRZ-model 1.
Using the next generation matric technique the threshold parameter is for the model (1) is given as
Where, (δ+μ)(λ+μ)> δλ.
The disease epidemic situation is presented by E* and given as E* = (X*, Y*, W*, R*, Z*) for where
Then X*, Y*, W*, R*, and Z* are equal to
Where the parameters detail used in the above XYWRZ-model is given in Table 1 below.
Here, in this study, we incorporate the white noise phenomenon to convert model (1) into a stochastic model. Here, small perturbations of white noise phenomenon are taken into account for stochastic model of HBV model (1) and can be expressed as
Here, Bi(t) = [1, 2, 3, 4, 5] denotes the independent Brownian motion and δi(t) = [1, 2, 3, 4, 5] represents the intensities of Gaussian white noises. Furthermore, terms δ1X(t)dB1(t), δ2Y(t)dB2(t), δ3V(t)dB3(t), δ4W(t)dB4(t), and δ5Z(t)dB5(t). Shows individuals interactions with environment biologically. Following subsidiary equations are associated with above model (6) are
Where the symbol stands for Q the Banach space. Which is containing the continuous function from .
In this system (1), parameters are denoted by small Greek and English characters. Each model parameter has a particular value, and it was calculated using actual information.
In this section, we determine the existence and uniqueness of the solution for considered system (1). For this purpose we will follow the methodology given by Din et al. [13, 23]. In below theorem 1 authors intend to present uniqueness and existence of positive solution of presented model.
Theorem 1 There exist a unique solution of [X(t), Y(t), W(t), R(t) and Z(t)] (2) for each t ≥ 0, and the suitable initial data is . The solution of
Proof For the suitable initial data of components of HBV model X(t), Y(t), W(t), R(t), and Z(t); the system coefficients are Lipschitz locally as well as continuous. Thus, this suggest that there exist a unique solution for stochastic system in local sense in the interval t ϵ [0, τe].
Here, the τe notation denotes explosion time and it is necessary to prove that this solution is naturally global. For this purpose we need to prove that τe = ∞. In addition, let us consider a large enough positive number l0 such that the interval contains all the population at initial stage for all components of HBV model. Furthermore, we assume explosion time for each positive integer l ≥ l0 of the form
Remaining proof is almost as given by Din et al. [34].
To solve the IO-HBVNS system using the non-linear mathematical form of the XYWRZ model, the ANN-LBVMBP scheme is presented in two steps. Using the non-linear mathematical form of the XYWRZ model, the fundamental operations of the ANN-LBVMBP operator performances are introduced along with the designed structure of the IO-HBVNS system. The multi-layer optimization results using the stochastic ANN-LBVMBP are displayed in Figure 1. The ANN-LBVMBP procedures are put together in MATLAB using the “nf tool” process, with data selected for training, testing, and authorization totaling 81, 9, and 9% respectively. Table 2 give specific values of parameters to perform the computations. The reference data set to perform the proposed ANN-LBVMBP is generated with help of Mathematica software employing the ND-solver and Adams Bashforth method. The numerical representations using the results of the HBVNS model are discussed using the ANN-LBVMBP method with 15 neurons and data selection as 81, 09, and 09%, respectively, for training, certification, and testing. The structure of the input, hidden, and output neurons are depicted in Figure 1.

Figure 1. Designed ANN-LBVMBP method for HBVNS.
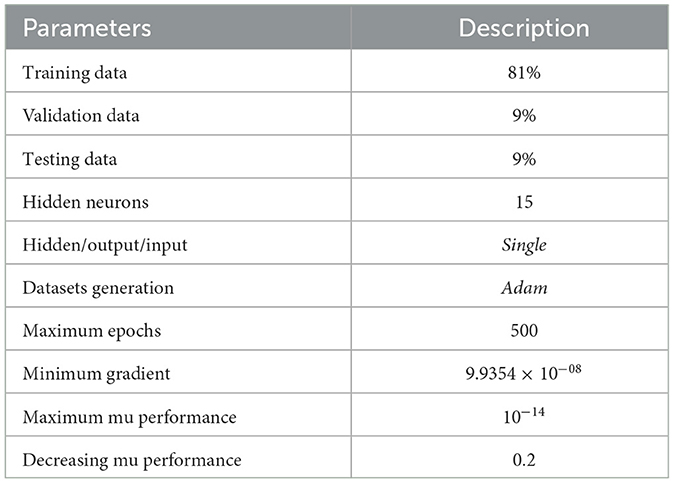
Table 2. Values of the parameter utilized for computations.
This section illustrates the numerical outcomes for three WXWRZ model using the ANN-LBVMBP method. To solve the model using the proposed technique three different cases and different initial conditions have been used. These cases gives the detail illustration of model 1 to perform the proposed technique and analyze the achieved outcomes.
Case 1: Consider the XYWRZ model by taking the ∧ = 0.6, μ = 0.05, ρ = 0.02, β = 0.005, γ = 0.6, η = 0.01, κ = 0.01, λ = 0.07, δ = 0.02, Π = 0.5, X0 = 0.1, Y0 = 0.2, W0 = 0.3, R = 0.4, and Z0 = 0.5.
Figures 2A, B, illustrate the mean square error and state transition results of performance of integer-order Hepatitis B virus model, respectively. Convergence analysis in terms of MSE for training, testing and validation are presented in Figure 2A for case 1. It is observed that convergence of Hepatitis B virus is found at 10−12 for case 1. Figure 2B show the gradient and step size Mu for case 1. The gradient achieved for case 1 is observed at 9.6458 × 10−08 for case 1 and step size is at 10−13.
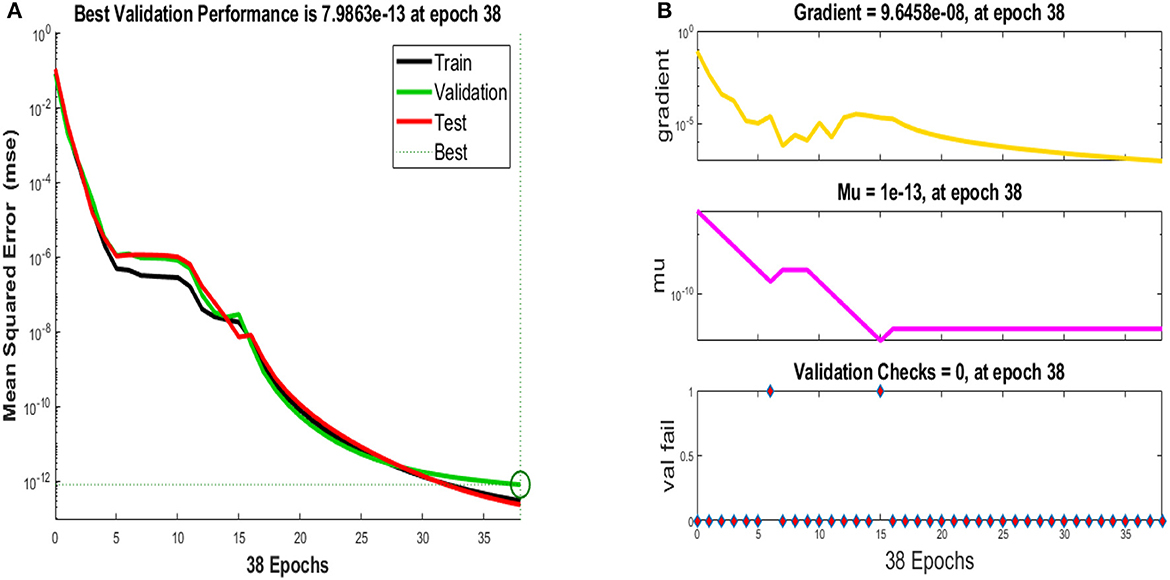
Figure 2. MSE and STs performances for the HBV system. (A) MSE: Case 1. (B) EHs: Case 1.
Figures 3A, B, illustrate the performance of proposed ANN-LBVMBP technique for the Hepatitis B virus model for case 1 and error histogram, respectively. Figure 3A, demonstrate best performance for case 1 and it is found to be at 2.95 × 10⁻¹³. The best performance of proposed scheme is achieved at 38 the epochs. It is worth noting here that, through error histograms that there exist zero error between −1.5 × 10−07 to 1.48 × 10−07(see Figure 3B). It is evident that proposed ANN-LBVMBP technique validate the outcome achieved.

Figure 3. Results and EHs performances for the HBV system. (A) Results: Case 1. (B) EHs: Case 1.
Furthermore, the regression plot generated for case 1 using the proposed ANN-LBVMBP technique is presented in Figure 4 for hepatitis B virus model. It is evident that value of correlations of R are found to be unity which validate accuracy of values used for training, testing and validation processes. Moreover, the regression plot of case 1 illustrate the perfect working scenario of case 1 hepatitis B virus model using integer-order mathematical model.
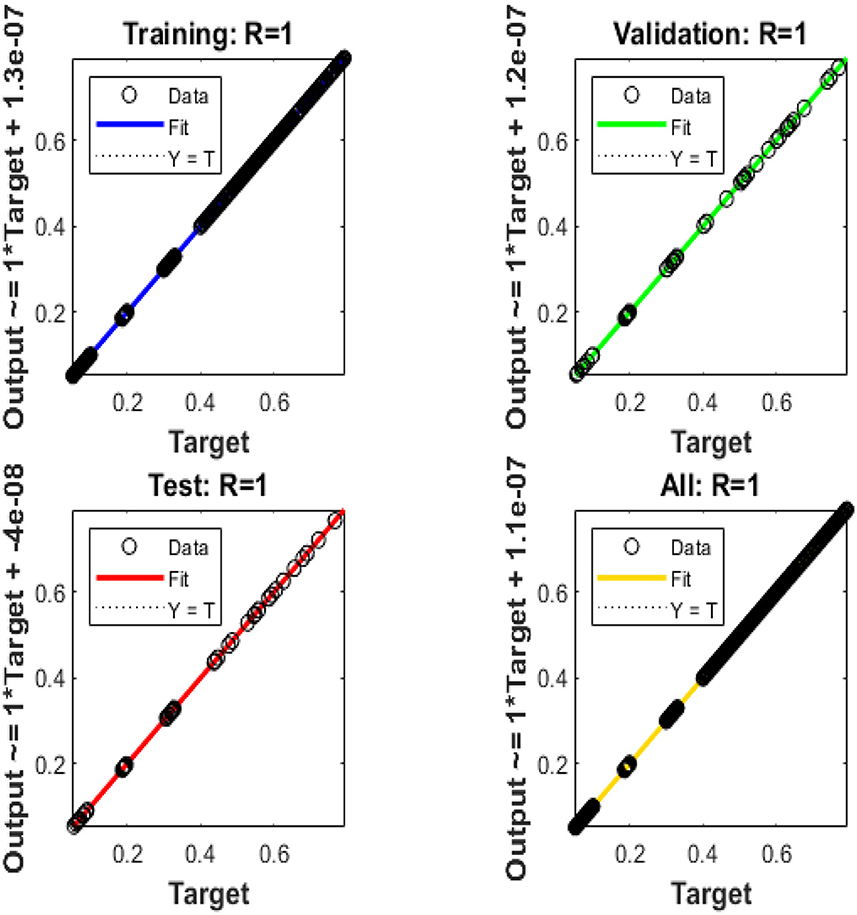
Figure 4. Regression performances for the HBVNS model: Case 1.
Case 2: Consider another case of the XYWRZ model by taking the ∧ = 0.6, μ = 0.05, ρ = 0.02, β = 0.005, γ = 0.6, η = 0.01, κ = 0.01, λ = 0.07, δ = 0.02, Π = 0.5, X0 = 0.1, Y0 = 0.3, W0 = 0.3, R0 = 0.4 and Z0 = 0.5.
Figures 5A, B, illustrate the mean square error and state transition results of performance of integer-order Hepatitis B virus model, respectively. Convergence analysis or curve analysis in terms of MSE for training, testing and validation are presented in Figure 5A for case 2. It is observed that convergence of Hepatitis B virus is found at 10−13 for case 2. Figure 5B show the gradient and step size Mu for case 2. The gradient obtained for case 2 is observed at 9.9354 × 10−08 and step size is at 10− 14.
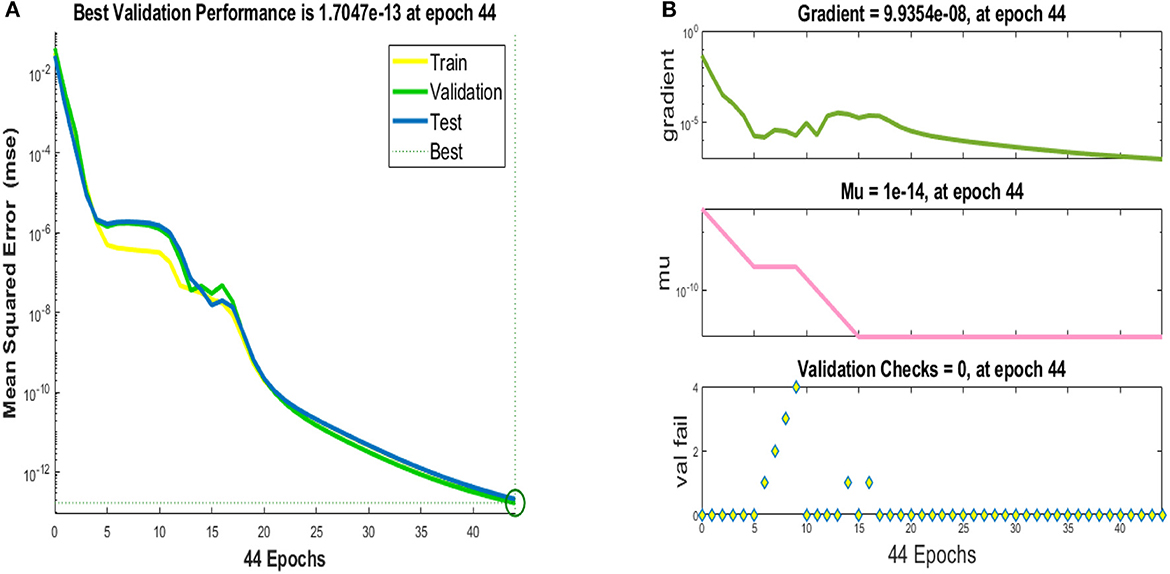
Figure 5. MSE and STs performances for the HBV system. (A) MSE: Case 2. (B) EHs: Case 2.
Figures 6A, B, depict the performance of proposed ANN-LBVMBP scheme for the Hepatitis B virus model for case 2 and error histogram, respectively. Figure 6A, demonstrate best performance for case 2 and it is found to be at 2.12 × 10⁻¹³. It is worth noting here that, with error histograms that there exist zero errors at the −3.8 × 10−08. It is evident that proposed ANN-LBVMBP technique validate the outcome achieved. The best performance of proposed scheme is achieved at 44 the epochs.
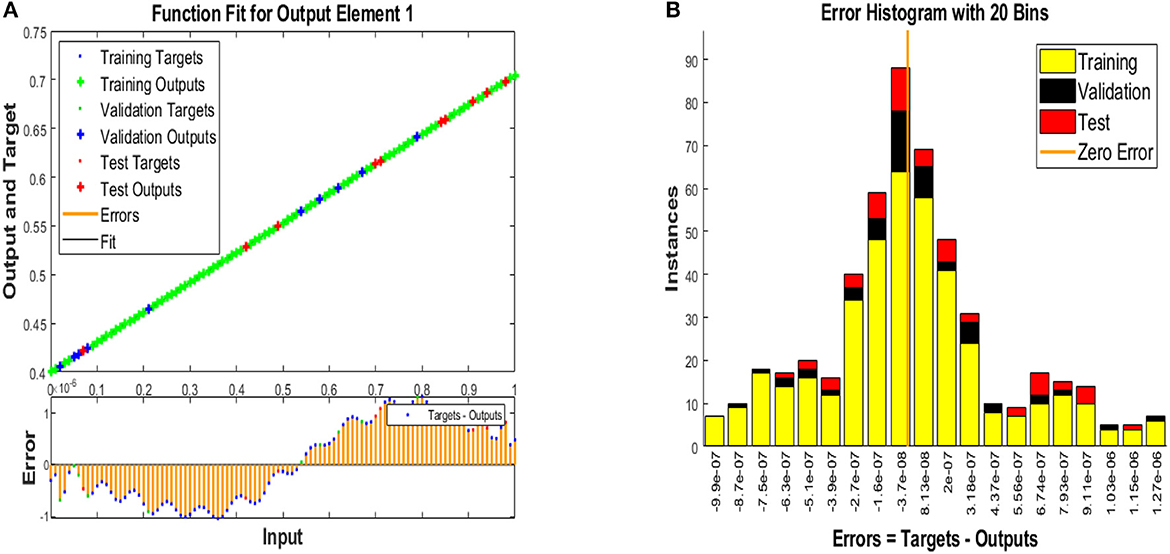
Figure 6. Results and EHs performances for the HBV system. (A) Results: Case 2. (B) EHs: Case 2.
Moreover, the regression plot generated for case 2 using the proposed ANN-LBVMBP technique is presented in Figure 7 for hepatitis B virus model. It is evident from that value of correlations of R are found to be unity which validate accuracy of values used for training, testing and validation processes. Moreover, the regression plot of case 2 illustrate the perfect working scenario of case 2 hepatitis B virus model using integer-order mathematical model.
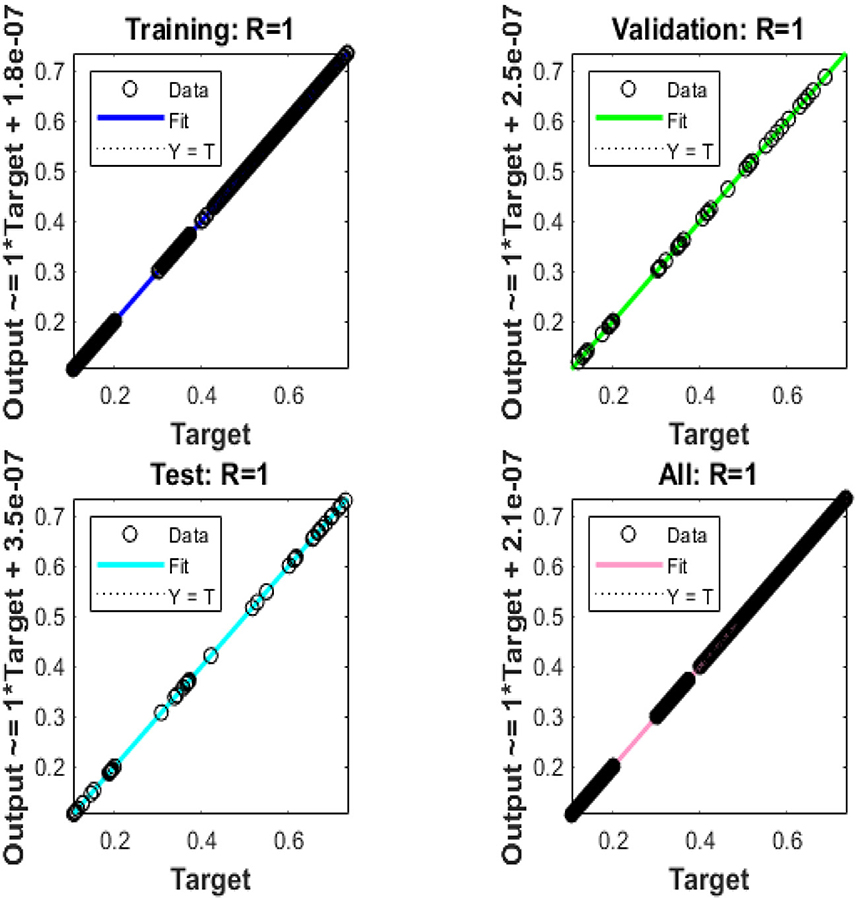
Figure 7. Regression performances for the HBVNS model: Case 2.
Case 3: Consider the third and last case of the XYWRZ model by taking the ∧ = 0.6, μ = 0.05, ρ = 0.02, β = 0.005, γ = 0.6, η = 0.01, κ = 0.01, λ = 0.07, δ = 0.02, Π = 0.5, X0 = 0.1, Y0 = 0.4, W0 = 0.3, R0 = 0.4 and Z0 = 0.5.
Figures 8A, B, illustrate the mean square error and state transition results of performance of integer-order Hepatitis B virus model, respectively. Convergence analysis or curve analysis in terms of MSE for training, testing and validation are presented in Figure 8A for case 3. It is observed that convergence of Hepatitis B virus is found at 10−13 for case 3. Figure 8B show the gradient and step size Mu for case 3. The gradient obtained for case 3 is observed at 9.9569 × 10−08and step size is at 10− 14.
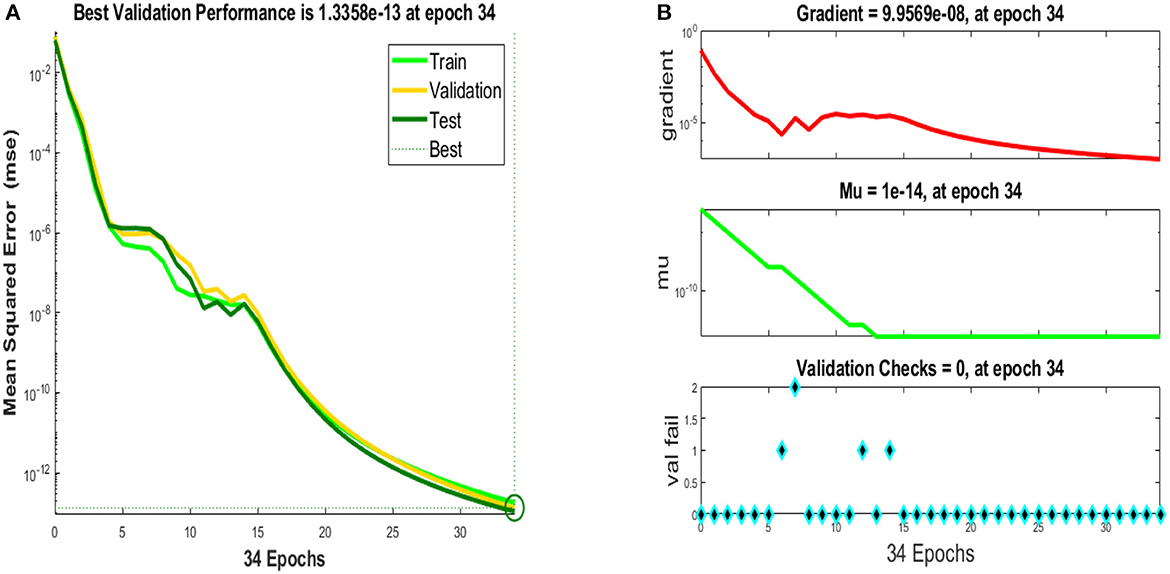
Figure 8. MSE and STs performances for the HBV system. (A) MSE: Case 3. (B) EHs: Case 3.
Figures 9A, B, depict the performance of proposed ANN-LBVMBP scheme for the Hepatitis B virus model for case 3 and error histogram, respectively. Figure 9A, demonstrate best performance for case 3 and it is found to be at 1.82 × 10⁻¹³. It is worth noting here that, with error histograms that there exist zero errors at the −1.8 × 10−08. It is evident that proposed ANN-LBVMBP technique validate the outcome achieved. The best performance of proposed scheme is achieved at 34 the epochs.
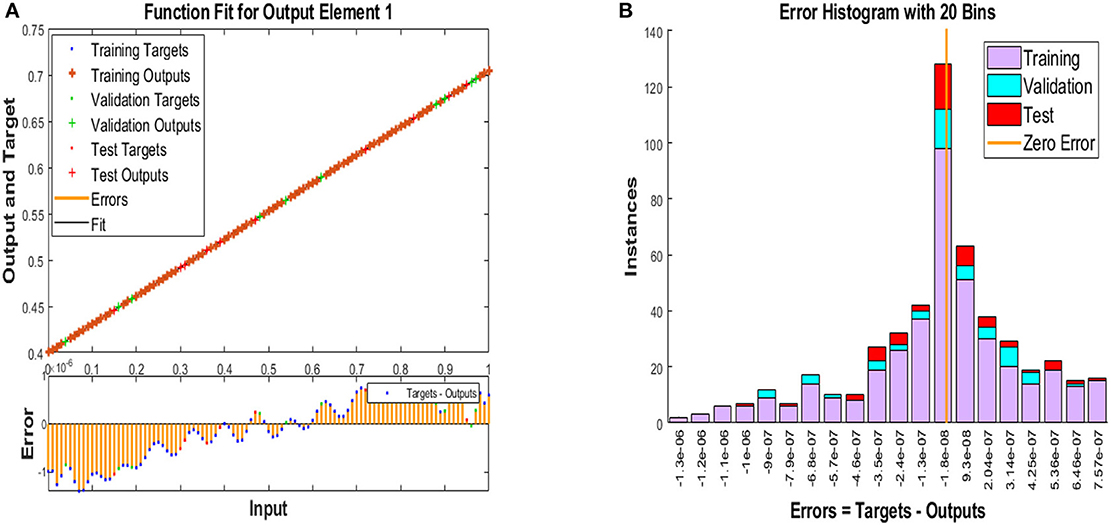
Figure 9. Results and EHs performances for the HBV system. (A) Results: Case 3. (B) EHs: Case 3.
Furthermore, the regression plot generated for case 3 using the proposed ANN-LBVMBP technique is presented in Figure 10 for hepatitis B virus model. It is worth noting here that, correlations of R are found to be unity which validate accuracy of values used for training, testing and validation processes. Moreover, the regression plot of case 3 illustrate the perfect working scenario of case 3 hepatitis B virus model using integer-order mathematical model.
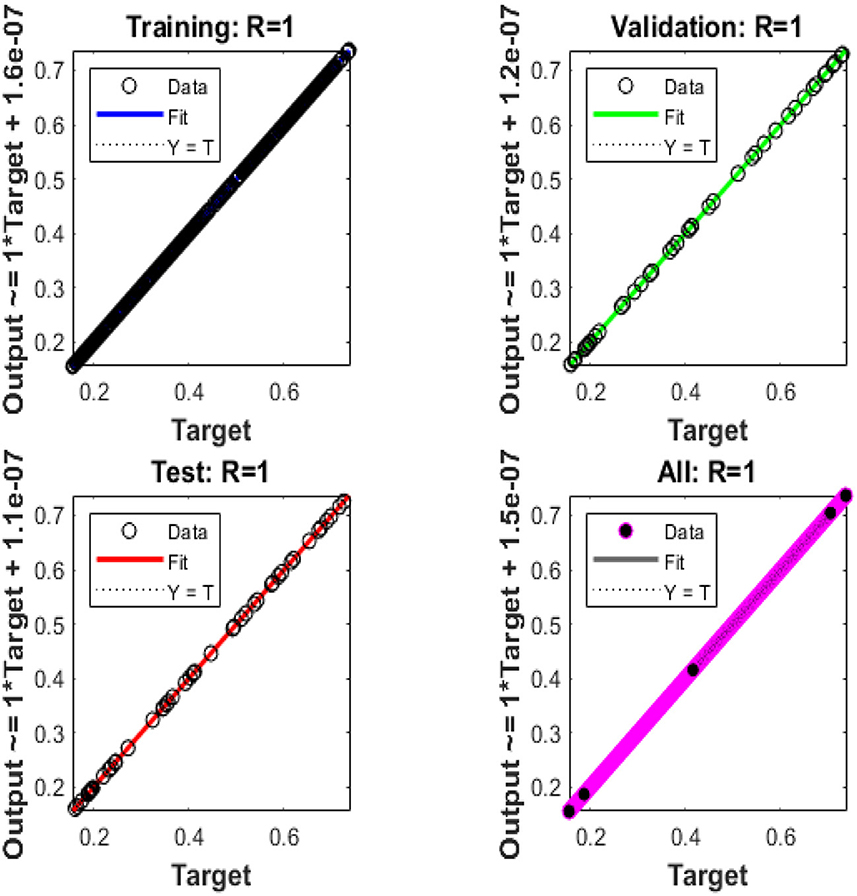
Figure 10. Regression performances for the HBVNS model: Case 3.
Figures 11A–E epitomize the comparative inquiries using the consequence comparisons and AE measures to resolve the ANN-LBVMBP procedures to solve the hepatitis B virus. Figures 11A–E validates the values of the AE for each component susceptible X(t), symptomatic infections Y(t), chronic infections W(t), recovered population R(t), and a population that has received vaccinations Z(t), respectively, using the ANN-LBVMBP methodology.
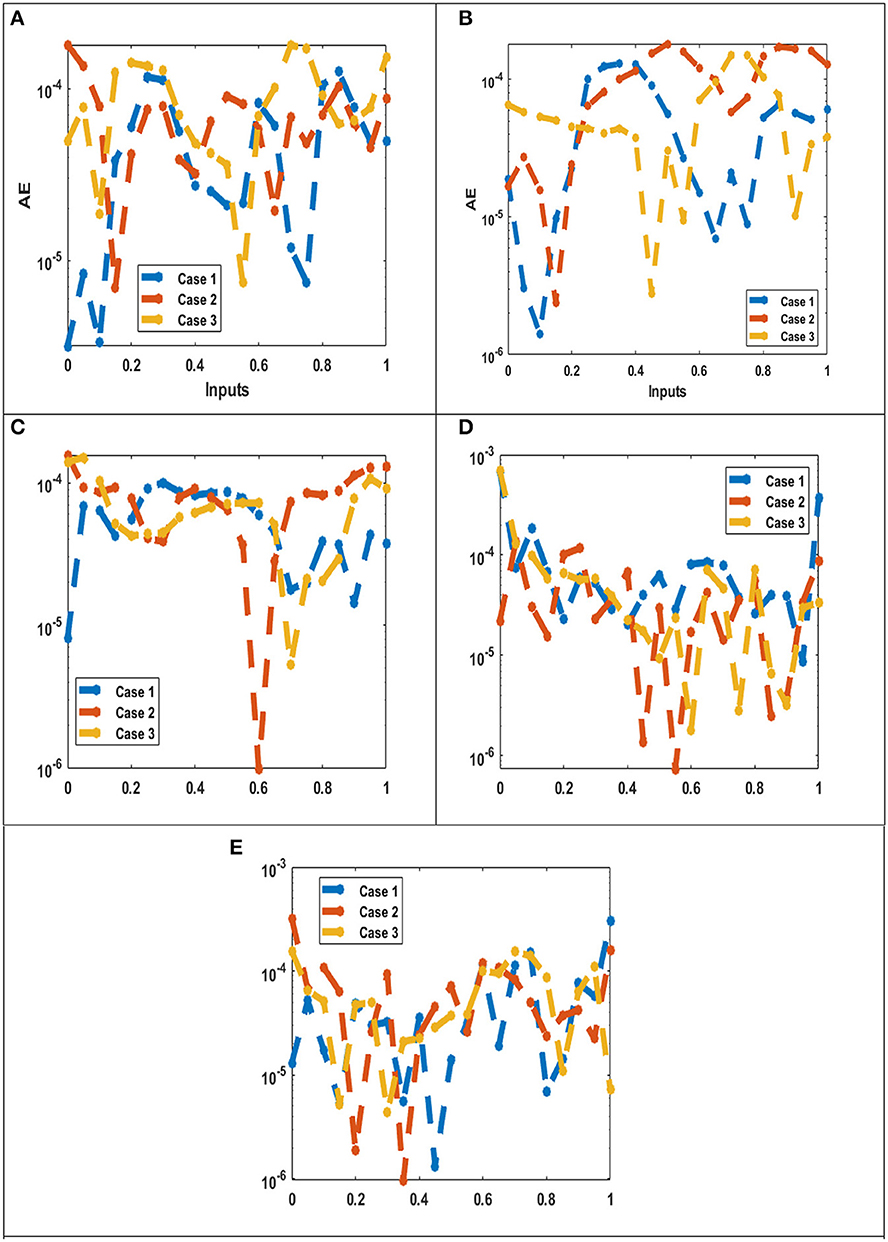
Figure 11. AE for the performances of the integer order system. (A) AE: X(t). (B) AE: Y(t). (C) AE: W(t). (D) AE: R(t). (E) AE: Z(t).
Figure 11A, show the AE measures for the susceptible category X(t) are performed as 10−04 to 10−05 for the mathematical model for all three cases. Figure 11B describe AE value for symptomatic infections Y(t) is provided as 10−05 to 10−06 to solve the mathematical model for three cases. Figure 11C illustrate AE for chronic infections W(t) is measured as 10−04 to 10−06 for three distinct cases of formulated mathematical model of hepatitis B virus model. Figure 11D depict AE measures for the recovered population R(t) are performed as 10−03 to 10−06 for this model.
Figure 11E shows AE for population that has received vaccinations Z(t) is provided as 10−03 to 10−06 to solve the mathematical model. These AE depictions validate the exactness of the ANN-LBVMBP procedures to solve the mathematical system of hepatitis B virus model. Table 2 provides the model convergence using the complexity, MSE, training, verification, generations, and testing. Table 3 illustrate the best performance and gradient obtained for proposed methodology of ANN-LBVMBP. The computation time, epochs and step size for all three different cases is also given the tabulated data set.
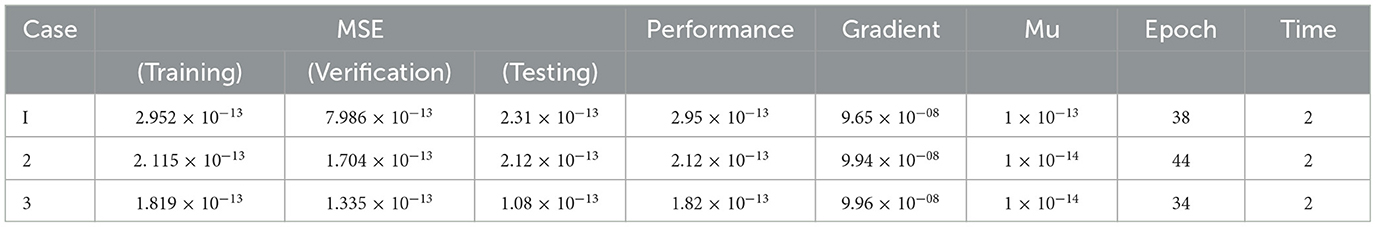
Table 3. ANN-LBVMBP method for the HBVNS XYWRZ model.
Figures 12A–E illustrate comparison performance for all three cases with reference generated data set for five distinct quantities: susceptible X(t), symptomatic infections Y(t), chronic infections W(t), recovered population R(t), and a population that has received vaccinations Z(t), respectively.
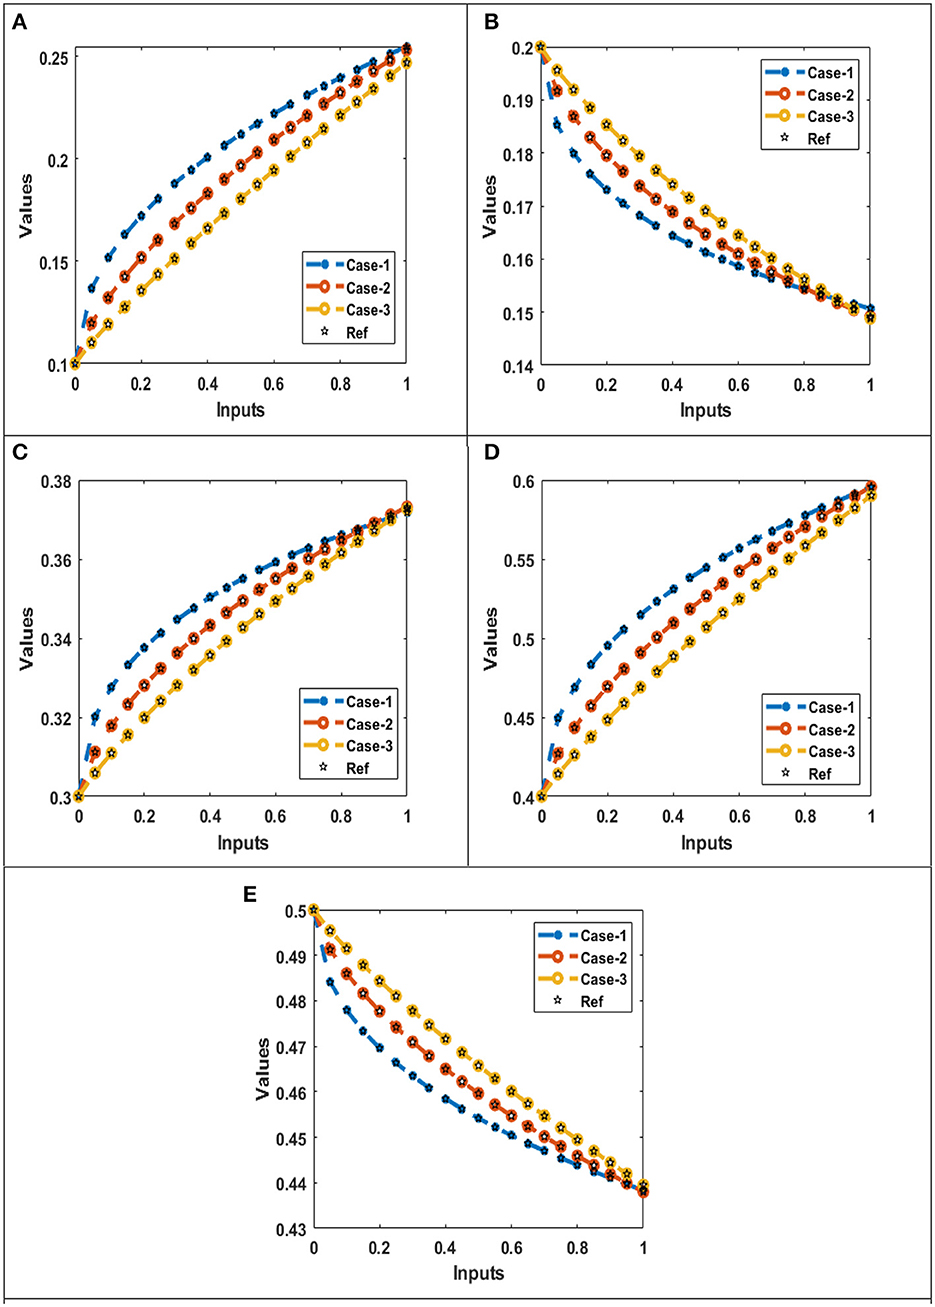
Figure 12. Comparison of the performances for the integer order system. (A) AE: X(t). (B) AE: Y(t). (C) AE: W(t). (D) AE: R(t). (E) AE: Z(t).
Figure 12A, show the susceptibles component of HBV model. Comparison between of the data generated with Adams method and outcomes of all three cases obtained with proposed ANN-LBVMBP scheme are presented. The comparison confirm and validate the proposed ANN-LBVMBP scheme. It is worth noting here that for case1 produce high number of susceptibles for hepatitis B virus when compared with case 2 and case 3. Additionally, case 3 show the minimal safe guard for susceptibles for hepatitis B virus.
Figure 12B, describe the comparison of generated reference data and outcomes achieved with help of proposed ANN-LBVMBP scheme. It is worth mentioning here that number of symptomatic infections with hepatitis B virus rapidly decline for case 1. The comparison plot also illustrate the case 1 produce more rapid decrease in symptomatic infections with hepatitis B virus model when compared with case 2 and case 3, respectively.
Figure 12C, depict comparison of chronic infections of hepatitis B virus model for different cases. It is observed that when there is when there is larger number of interaction occur high number of chronic infections of hepatitis B are discovered. For instant, minimal chronic infections of hepatitis B virus are observed for case 3 and maximum number of chronic infections are obtained for case 1.
Figure 12D, demonstrate the comparison of reference data and outcome achieved with proposed scheme for the recovered population for all three cases. It is observed that when case 1 formulation produce more recovered population response for hepatitis B virus. Whereas the case 2 and case 3 generate slow immune response combat hepatitis B virus model effectively, consequently, these cases produce less recovered population number.
Figure 12F, discuss the population that has received vaccination. It is worth noting that using the proposed methodology the and under the formulated cases for HBV model 1, number of population that has received vaccination has declined for case 1. Additionally, the performance of case 2 to produce the high number of vaccinated population is moderate. Furthermore, case 3 suggest the slow decline in population number that has been vaccinated for HBV.
This study's goal is to present simulation study of the non-linear hepatitis B virus system using a numerical stochastic neural network (SNN) scheme based on Levenberg-Marquardt back propagation. The reference data sets are generated with help of Mathematica software using ND-Solver and employing Adams Bashforth method. Additionally, major outcomes of this study are given as follow:
1. The achieved outcomes with help of proposed ANN-LBVMBP procedures show the accuracy, effectiveness and correctness of utilized scheme.
2. Performance plots validate the reference data and it is concluded that case 1 is overall best performing case in terms of MSE, EH, state transition of results and comparison plots.
3. Minimal step size 10−14 is achieved at 44 epochs and when gradient is observed to be 9.94 × 10− 08.
4. Error histograms shows that minimal zero error stage is found for case 2 which is −3.7 × 10− 08.
5. Best validation comparison performance achieved is 7.9863 × 10⁻¹³ and it is obtained at 38 epochs.
In the future the ANN procedures will be tested for fractional order epidemic models and fluid mechanics problems. One can also investigate the infectious disease models to analyze the effectiveness of ANN procedures.
The original contributions presented in the study are included in the article/supplementary material, further inquiries can be directed to the corresponding authors.
Conceptualization, methodology, software, data curation, project administration, and writing—original draft preparation: QH and AH. Validation, funding acquisition, and resources: SME. Formal analysis and supervision: AH. Writing—review and editing: AH, QH, and SME.
This work was supported by Princess Nourah Bint Abdulrahman University Researchers Supporting Project Number (PNURSP2023R321), Princess Nourah Bint Abdulrahman University, Riyadh, Saudi Arabia. This study was supported via funding from Prince Sattam Bin Abdulaziz University Project Number (PSAU/2023/R/1444).
The authors declare that the research was conducted in the absence of any commercial or financial relationships that could be construed as a potential conflict of interest.
All claims expressed in this article are solely those of the authors and do not necessarily represent those of their affiliated organizations, or those of the publisher, the editors and the reviewers. Any product that may be evaluated in this article, or claim that may be made by its manufacturer, is not guaranteed or endorsed by the publisher.
1. Littlejohn M, Locarnini S, Yuen L. Origins and evolution of hepatitis B virus and hepatitis D virus. Cold Spring Harb Perspect Med. (2016) 6:a021360. doi: 10.1101/cshperspect.a021360
2. Simmonds P. Reconstructing the origins of human hepatitis viruses. Philos Trans R Soc London Series B Biol Sci. (2001) 356:1013–26. doi: 10.1098/rstb.2001.0890
3. Wang FS. Current status and prospects of studies on human genetic alleles associated with hepatitis B virus infection. World J Gastroenterol. (2003) 9:641. doi: 10.3748/wjg.v9.i4.641
4. Chu CM, Karayiannis P, Fowler MJ, Monjardino J, Liaw YF, Thomas HC. Natural history of chronic hepatitis B virus infection in Taiwan: studies of hepatitis B virus DNA in serum. Hepatology. (1985) 5:431–4. doi: 10.1002/hep.1840050315
5. McMahon BJ. The influence of hepatitis B virus genotype and subgenotype on the natural history of chronic hepatitis B. Hepatol Int. (2009) 3:334–42. doi: 10.1007/s12072-008-9112-z
6. Krugman S, Overby LR, Mushahwar IK, Ling CM, Frösner GG, Deinhardt F. Viral hepatitis, type B: studies on natural history and prevention re-examined. New Engl J Med. (1979) 300:101–6. doi: 10.1056/NEJM197901183000301
7. Ofori-Asenso R, Agyeman AA. Hepatitis B in Ghana: a systematic review & meta-analysis of prevalence studies (1995-2015). BMC Infect Dis. (2016) 16:1–15. doi: 10.1186/s12879-016-1467-5
8. Schaefer S. Hepatitis B virus: significance of genotypes. J Viral Hepat. (2005) 12:111–24. doi: 10.1111/j.1365-2893.2005.00584.x
9. Shi YH. Correlation between hepatitis B virus genotypes and clinical outcomes. Jpn J Infect Dis. (2012) 65:476–82. doi: 10.7883/yoken.65.476
10. Beutels P. Economic evaluations of hepatitis B immunization: a global review of recent studies (1994–2000). Health Econ. (2001) 10:751–74. doi: 10.1002/hec.625
11. Zhao S, Xu Z, Lu Y. A mathematical model of hepatitis B virus transmission and its application for vaccination strategy in China. Int J Epidemiol. (2000) 29:744–52. doi: 10.1093/ije/29.4.744
12. Khan SA, Shah K, Kumam P, Seadawy A, Zaman G, Shah Z. Study of mathematical model of Hepatitis B under Caputo-Fabrizo derivative. AIMS Mathematics. (2021) 6:195–209. doi: 10.3934/math.2021013
13. Din A, Li Y, Khan FM, Khan ZU, Liu P. On Analysis of fractional order mathematical model of Hepatitis B using Atangana–Baleanu Caputo (ABC) derivative. Fractals. (2022) 30:2240017. doi: 10.1142/S0218348X22400175
14. Zhang S, Xu X. A mathematical model for hepatitis B with infection-age structure. Discrete Continuous Dynamical Syst B. (2016) 21:1329. doi: 10.3934/dcdsb.2016.21.1329
15. Khan M, Khan T, Ahmad I, Shah Z, Khan A. Modeling of hepatitis B virus transmission with fractional analysis. Math Prob Eng. (2022) 2022. doi: 10.1155/2022/6202049
16. Zhong JF, Gul N, Bilal R, Xia WF, Khan MA, Muhammad T, et al. A fractal-fractional order Atangana-Baleanu model for Hepatitis B virus with asymptomatic class. Physica Scripta. (2021) 96:074001. doi: 10.1088/1402-4896/abf67c
17. Shaikh TS, Fayyaz N, Ahmed N, Shahid N, Rafiq M, Khan I, et al. Numerical study for epidemic model of hepatitis-B virus. Eur Phys J Plus. (2021) 136:1–22. doi: 10.1140/epjp/s13360-021-01248-8
18. Otoo D, Abeasi IO, Osman S, Donkoh EK. Mathematical modeling and analysis of the dynamics of hepatitis b with optimal control. Commun Math Biol Neurosci. (2021) 2021:43.
19. Liu P, Din A, Zarin R. Numerical dynamics and fractional modeling of hepatitis B virus model with non-singular and non-local kernels. Results Phys. (2022) 39:105757. doi: 10.1016/j.rinp.2022.105757
20. Manna K, Hattaf K. A generalized distributed delay model for hepatitis B virus infection with two modes of transmission and adaptive immunity: a mathematical study. Math Methods Appl Sci. (2022) 45:11614–34. doi: 10.1002/mma.8470
21. Shen WY, Chu YM, ur Rahman M, Mahariq I, Zeb A. Mathematical analysis of HBV and HCV co-infection model under nonsingular fractional order derivative. Results Phys. (2021) 28:104582. doi: 10.1016/j.rinp.2021.104582
22. Volinsky I, Lombardo SD, Cheredman P. Stability analysis and cauchy matrix of a mathematical model of hepatitis B virus with control on immune system near neighborhood of equilibrium free point. Symmetry. (2021) 13:166. doi: 10.3390/sym13020166
23. Din A, Li Y, Khan T, Anwar K, Zaman G. Stochastic dynamics of hepatitis B epidemics. Results Phys. (2021) 20:103730. doi: 10.1016/j.rinp.2020.103730
24. Ahmad S, ur Rahman M, Arfan M. On the analysis of semi-analytical solutions of Hepatitis B epidemic model under the Caputo-Fabrizio operator. Chaos Solit Fractals. (2021) 146:110892. doi: 10.1016/j.chaos.2021.110892
25. Chataa P, Nyabadza F, Naandam SM. Mathematical modelling of the transmission dynamics of hepatitis B virus in the presence of imperfect vaccination. J Math Comput Sci. (2021) 11:6949–79.
26. Alrabaiah H, Arfan M, Shah K, Mahariq I, Ullah A. A comparative study of spreading of novel corona virus disease by ussing fractional order modified SEIR model. Alexandria Eng J. (2021) 60:573–85. doi: 10.1016/j.aej.2020.09.036
27. Kumar S, Kumar R, Osman MS, Samet B. A wavelet based numerical scheme for fractional order SEIR epidemic of measles by using Genocchi polynomials. Numer Methods Partial Differ Equ. (2021) 37:1250–68. doi: 10.1002/num.22577
28. Mohammadi H, Kumar S, Rezapour S, Etemad S. A theoretical study of the Caputo–Fabrizio fractional modeling for hearing loss due to Mumps virus with optimal control. Chaos Solitons Fractals. (2021) 144:110668. doi: 10.1016/j.chaos.2021.110668
29. Kumar S, Ahmadian A, Kumar R, Kumar D, Singh J, Baleanu D, et al. An efficient numerical method for fractional SIR epidemic model of infectious disease by using Bernstein wavelets. Mathematics. (2020) 8:558. doi: 10.3390/math8040558
30. Ghanbari B, Kumar S, Kumar R. A study of behaviour for immune and tumor cells in immunogenetic tumour model with non-singular fractional derivative. Chaos Solitons Fractals. (2020) 133:109619. doi: 10.1016/j.chaos.2020.109619
31. Abaid Ur Rehman M, Ahmad J, Hassan A, Awrejcewicz J, Pawlowski W, Karamti H, et al. The dynamics of a fractional-order mathematical model of cancer tumor disease. Symmetry. (2022) 14:1694. doi: 10.3390/sym14081694
32. Kumar S, Kumar A, Samet B, Gómez-Aguilar JF, Osman MS. A chaos study of tumor and effector cells in fractional tumor-immune model for cancer treatment. Chaos Solitons Fractals. (2020) 141:110321. doi: 10.1016/j.chaos.2020.110321
33. Habenom H, Suthar DL, Baleanu D, Purohit SD. A numerical simulation on the effect of vaccination and treatments for the fractional hepatitis b model. J Comput Nonlinear Dynam. (2021) 16:011004. doi: 10.1115/1.4048475
34. Din A, Li Y. Stationary distribution extinction and optimal control for the stochastic hepatitis B epidemic model with partial immunity. Physica Scripta. (2021) 96:074005. doi: 10.1088/1402-4896/abfacc
35. Botmart T, Weera W, Raja MAZ, Sabir Z, Hiader Q, Altamirano GC, et al. Dynamics of fractional differential model for schistosomiasis disease. Computers Mater Continua. (2022) 73:981–99. doi: 10.32604/cmc.2022.028921
36. Sabir Z, Raja MAZ, Alnahdi AS, Jeelani MB, Abdelkawy MA. Numerical investigations of the nonlinear smoke model using the Gudermannian neural networks. Math Biosci Eng. (2022) 19:351–70. doi: 10.3934/mbe.2022018
37. Sabir Z, Wahab HA, Javeed S, Baskonus HM. An efficient stochastic numerical computing framework for the nonlinear higher order singular models. Fractal Fractional. (2021) 5:176. doi: 10.3390/fractalfract5040176
38. Nisar K, Sabir Z, Raja MAZ, Ibrahim AAA, Erdogan F, Haque MR, et al. Design of morlet wavelet neural network for solving a class of singular pantograph nonlinear differential models. IEEE Access. (2021) 9:77845–62. doi: 10.1109/ACCESS.2021.3072952
39. Sabir Z, Guirao JL, Saeed T. Solving a novel designed second order nonlinear Lane–Emden delay differential model using the heuristic techniques. Appl Soft Comput. (2021) 102:107105. doi: 10.1016/j.asoc.2021.107105
40. Sabir Z, Raja MAZ, Guirao JL, Saeed T. Meyer wavelet neural networks to solve a novel design of fractional order pantograph Lane-Emden differential model. Chaos Solitons Fractals. (2021) 152:111404. doi: 10.1016/j.chaos.2021.111404
41. Sabir Z, Raja MAZ, Shoaib M, Aguilar JF. FMNEICS: fractional Meyer neuro-evolution-based intelligent computing solver for doubly singular multi-fractional order Lane–Emden system. Comput Appl Math. (2020) 39:1–18. doi: 10.1007/s40314-020-01350-0
42. Sabir Z, Raja MAZ, Umar M, Shoaib M, Baleanu D. FMNSICS: fractional Meyer neuro-swarm intelligent computing solver for nonlinear fractional Lane–Emden systems. Neural Comput Appl. (2022) 34:4193–206. doi: 10.1007/s00521-021-06452-2
43. Sabir Z, Raja MAZ, Guirao JL, Shoaib M. A novel design of fractional Meyer wavelet neural networks with application to the nonlinear singular fractional Lane-Emden systems. Alexandria Eng J. (2021) 60:2641–59. doi: 10.1016/j.aej.2021.01.004
44. Guirao JL, Sabir Z, Saeed T. Design and numerical solutions of a novel third-order nonlinear Emden–Fowler delay differential model. Math Prob Eng. (2020) 2020. doi: 10.1155/2020/7359242
45. Sabir Z, Raja MAZ, Guirao JL, Shoaib M. A neuro-swarming intelligence-based computing for second order singular periodic non-linear boundary value problems. Front Phys. (2020) 8:224. doi: 10.3389/fphy.2020.00224
46. Ghanbari B, Djilali S. Mathematical analysis of a fractional-order predator-prey model with prey social behavior and infection developed in predator population. Chaos Solitons Fractals. (2020) 138:109960. doi: 10.1016/j.chaos.2020.109960
47. Ghanbari B, Djilali S. Mathematical and numerical analysis of a three-species predator-prey model with herd behavior and time fractional-order derivative. Math Methods Appl Sci. (2020) 43:1736–52. doi: 10.1002/mma.5999
Keywords: non-linear mathematical hepatitis B virus model, integer order, Levenberg-Marquardt back propagation, neural network, reference database
Citation: Haider Q, Hassan A and Eldin SM (2023) Artificial neural network scheme to solve the hepatitis B virus model. Front. Appl. Math. Stat. 9:1072447. doi: 10.3389/fams.2023.1072447
Received: 17 October 2022; Accepted: 23 February 2023;
Published: 30 March 2023.
Edited by:
Francisco Hernández-Cabrera, Autonomous University of Nuevo León, MexicoReviewed by:
Ibrahim Mahariq, American University of the Middle East, KuwaitCopyright © 2023 Haider, Hassan and Eldin. This is an open-access article distributed under the terms of the Creative Commons Attribution License (CC BY). The use, distribution or reproduction in other forums is permitted, provided the original author(s) and the copyright owner(s) are credited and that the original publication in this journal is cited, in accordance with accepted academic practice. No use, distribution or reproduction is permitted which does not comply with these terms.
*Correspondence: Qusain Haider, cXVzYWluLmhhaWRlcjMzNkBnbWFpbC5jb20=; Ali Hassan, bXVoYW1tYWRhbGkwNTQ0QGdtYWlsLmNvbQ==
Disclaimer: All claims expressed in this article are solely those of the authors and do not necessarily represent those of their affiliated organizations, or those of the publisher, the editors and the reviewers. Any product that may be evaluated in this article or claim that may be made by its manufacturer is not guaranteed or endorsed by the publisher.
Research integrity at Frontiers
Learn more about the work of our research integrity team to safeguard the quality of each article we publish.